Embed Size (px)
Citation preview

Boostingandsustainingthegasandgas
condensateproductionfromtheGullfaksSørsubseasatellitefield
Experts in Teamwork 2013 Gullfaks Village Group 4
IdaBaltzersenEngeEvenEvjuSkankeMuradBabayevOladunjoye“Ola”AwogaMd.“Jahid”Islam

1
AbstractStatoilwants toutilizeanewtypeofwetgascompressorsubsea toenhancerecovery
and boost the life time of the Gullfaks South field. Today the gas field produces by
naturalpressuredepletion.This report containsa studyof theeffectsof installing the
wet gas compressormodule on production and economics. Themethods used in the
evaluationaredrygasmaterialbalanceanddrygasflowequations.Thecomputertools
used to implement these equations has been Microsoft Excel, VBA and HYSYS. The
results clearly state that Statoil should proceedwith the installment. The projectwill
have a great impact on both recovery and life span of the field. The recovery factors
increase considerably. It is also recommended to proceed with a low pressure
modificationonthetopsideseparatorsoftheGullfaksCplatformin2018whichyieldsa
positive NPV of 900.3 MNOK in 2029. Sensitivity analysis shows that the project is
robusttochangesineconomicparameterssuchasCAPEX,gaspriceanddiscountrate.A
changeinCAPEXwillhavethelargestimpactonthevalueoftheproject.

2
Contents
1. Introduction.................................................................................................................................................3
2. GullfaksCsubseawetgascompression..........................................................................................5
2.1Designbasisandtechnicalspecifications....................................................................................5
2.1Methodofexecution..............................................................................................................................7
2.1.1Gasproductioncalculations......................................................................................................7
2.1.2Condensateproductionandvalidationofdrygasassumption.................................9
2.2Casesstudied.........................................................................................................................................10
2.2ProductionResults..............................................................................................................................12
2.2.1TheReferencecase:...................................................................................................................12
2.2.2SubseaWGCcase.........................................................................................................................14
2.2.3SubseaWGCwithdowntimeincreased.............................................................................16
2.2.4Lowpressureconfiguration...................................................................................................16
2.2.5Productionandrecovery.........................................................................................................17
2.2.7Condensateproduction............................................................................................................20
2.2.6Discussion......................................................................................................................................21
2.3 Economicresults............................................................................................................................22
2.3.1NPVandcashflow......................................................................................................................22
2.3.2Discussion......................................................................................................................................24
2.4Sensitivityanalysis..............................................................................................................................24
2.4.1TornadoDiagram........................................................................................................................28
2.4.2Discussion......................................................................................................................................30
3. Conclusionsandrecommendations...............................................................................................30
4. References.................................................................................................................................................31
5. Appendices................................................................................................................................................33
AppendixA:Initialconditionsandparameters.............................................................................33
AppendixB:Calculationsheets.............................................................................................................34
AppendixC:CompressormappingWGC...........................................................................................38
AppendixD:Totalproductionofgasandcondensate................................................................43
AppendixE:Economicalcalculations.................................................................................................44

3
1. Introduction
GullfaksSouthisasatellitetothemainGullfaksfieldandwasdiscoveredin1978[1].It
is situated in thenorthernNorth Sea, figure1, and includesblocks34/10and33/12.
The field is developed with subsea
production installations with tiebacks to
GullfaksAandCplatforms.Eventhoughit
wasdiscoveredasearlyas1978,itdidn’t
comeonstreamuntil1998.Asopposedto
the Gullfaks main field, which produces
oil, Gullfaks South produces mainly gas
andsomecondensate.
The reservoirs of the Gullfaks South field are located at depths of 2400‐3400 m in
rotatedfaultblocks.Thereservoirsareheavilysegmentedwithanabundanceofinternal
faults.Theinitialreservoirpressurewas450baratdatumdepthof3300mbelowmean
sea level.Overtheyears, the fieldhasbeenproducedbypressuremaintenancebygas
injection to some extent, but this was discontinued in 2009. Today, the reservoir
produces by the means of natural pressure decline. The relevant reservoir for this
project is located in the Brent group of middle Jurassic age and has good reservoir
properties. The reservoirs in question are produced by two templates, the L‐ andM‐
template, and are located approximately 14 km from the Gullfaks C platform. The
Gullfaksfieldlayoutwithitssatellitesisshowninfigure2below.
InMay2012StatoilandpartnerPetorodecidedtoinvestintheinstallationofawetgas
compressorontheseabed.Theobjectiveofinstallingthecompressoristoboostthegas
pressure before transportation in the pipeline and separation on the platform. The
compressorwillcontributetokeepingaplateauproductionforalongerperiod.Thiswill
Figure1:LocationoftheGullfakslicence

4
result ina longer lifetimeof the field thusdepletingmoreof the remaining resources,
yieldingahigherrecoveryfactor.
Figure2:Gullfaksfieldlayoutwithsatellites
Theproductionof the fieldhasbeendeclining for years after reaching amaximum in
2005,asshowninfigure3,whiletherearestillresourcesleftinthereservoir.
The objective of the Gullfaks
Village 2013 is to simplify this
case from reality and to do
production and economic
calculations. Statoil wants to see
if the village can produce similar
resultswithmuchsimplertoolsand
methods.
Figure3:Totalproductionofoilequivalents(MSm3)

5
2. Gullfaks C subsea wet gas compression
This project is based on a pilot project in development by Statoil and Framo
Engineering.StatoilistheoperatoroftheGullfakslicenceandFramoEngineeringisthe
manufacturer of the new compressor module Statoil wants to install. The innovative
aspectofthisprojectistheuseofaspeciallydesignedwetgascompressormodulethat
will be placed subsea.When the field is producing, the pressure in the reservoirwill
decline.Therewillbeadditionalpressurelossinthewellandpipesthateventuallymake
the pressure too low to enter the first stage of separation. The main issue that the
compressorwill resolve iskeeping thepressurehighenoughwhen thegasenters the
separatortopside.
Today a similar subsea compression system is used on the Åsgard field. This set up
includesa separator,onepumpandonecompressor[2].ThebenefitofaWGCsubsea
compressionsystemisthatitexcludestheneedofasubseaseparatorandmakestheset‐
upmuchsimpler.This technology isverypromising,extending the life timeofmature
gasfieldspotentiallyincreasingtherecoveryfactor.
2.1 Design basis and technical specifications Thelayoutoftheproductionsystemisshowninfigure4.TemplateLproducesfrom4
wells while template M also has 4 wells, but only produces from 3. The reservoir
pressuresfortheL‐andM‐templatesin2008were240and210bararespectively.Over
time (at constant flow rates) the pressure potential over the chokes decreases as the
reservoirdepletes.ThetargetproductionratessetbyStatoil(4and6MSm3/d)fromthe
L‐andM‐templatecannotbemaintainedafteracertaintime.Insteadofdecreasingthe
flowratesrapidlybecauseof lackofpressurepotential todrive thegas to the topside
separator, Statoilwants to addpressurebyusing the compressormodule tomaintain
themaximumproductionforalongerperiod.

6
Figure4:Productionlayoutafterinstallationofcompressor
Initially,beforethecompressormoduleisinstalled,thegasflowsfromthetemplatesin
12’’pipestoatowheadthatcombinestheflows.Thegasthentravelsfromthetowhead
totheseparatorintwo14’’pipesoveradistanceof14km.Aftertheinstallationofthe
compressors,theflowswillbedivertedtogothroughthecompressormodule.Thereisa
valve at the inlet of each compressor. When the compressor is run in parallel, both
valvesareopen.Theswitchtoseriescompressionisdonebyclosingoneofthevalves
andopeningthevalveonthepipelinethatgoesbetweenthecompressors.Thereisone
passivecooler,usingseawater,mountedinfrontofeachcompressor.
Thecompressormodulewillconsistoftwo5MWwetgascounterrotatingcompressors
thatcanoperateeitherinparallelorinseries.Theboostingpressurecapacityis32and
60barforparallelandseriesrespectively.Themaximumflowrateifrunninginseriesis
5MSm3/d.CompressormapsandoperationspecificationsareprovidedbyFRAMO.
The reservoirs are modelled as isothermal tanks. Chokes on each well are used to
controltheflowratesfromtheL‐andM‐templatesuchthatthepressureinthetowhead

7
will be the same from the two templates. There are some options regarding
transportation,howeveronlythe12’’pipesfromthetemplatestothetowheadareused
in thecalculations.Fromthe towhead to theseparator thegas is transported inequal
amountsintwo14’’pipes.Adowntimeof10%isassumedintheinitialcalculations.The
height difference in the piping is neglected. The final assumption is the dry gas
assumption.Alltheflowequationsandthematerialbalanceequationusedapplyfordry
gas only. This implies that some of the extra pressure drop thatwould occur for gas
condensate is neglected. These assumptions are made to assess if Statoil could have
used easier and simpler methods for the studies concerning the subsea wet gas
compressionproject.
2.1 Method of execution
2.1.1 Gas production calculations
The main tool used to perform the calculations is Microsoft Excel with use of VBA
(VisualBasics forApplications)programming.AspenHYSYSwasalsousedtogenerate
blackoiltablestocalculatecondensateproduction.
The reservoirproduction is calculatedusinga simplematerialbalanceequationgiven
by:
PR Pi
zR
zi
1Gp
G
(1)
wherePR is thereservoirpressure for the followingyear (i+1),andPi is thereservoir
pressurecurrentyear(i).Thez‐factorsarethecompressibilityfactorsaccountingforthe
non‐ideal gasbehaviour. zR is the compressibility factor at the reservoir conditions in
year (i+1) and zi is the compressibility factor in year (i). Gp is the cumulative gas
production,andGisthegasinitiallyinplace.ThetermGp/Gistherecoveryfactor.
Thewellbottomholeflowingpressure,Pwf,iscalculatedbythe“inflow”equation:

8
qgsc CR PR2 Pwf
2 n (2)
whereqgsc is thewell flowrate,CR is the inflowbackpressurecoefficientandn is the
backpressureexponent.
Thepressureatthewellhead,Pwhiscalculatedfromthepressuredropinthetubing.The
tubingequationusedis:
qgsc CT
Pin2
es Pout2
0.5
(3)
whereCTisthetubingcoefficientfora7’’tubewithaninnerdiameterof6.094’’.Poutwill
be Pwh and Pin will be Pwf. The exponent of 0.5 applies for turbulent flow. S is the
elevation coefficient. This is given as 0.43 and 0.34 for the L‐ and M‐template
respectively.
Thepressureintheseparatoris65bara,thusthepressurerequiredinthetowheadcan
beback calculatedusing thehorizontal flow line equation (eq.4). In reality there is a
heightdifferenceof about178mwhich is not taken into accountusing this equation.
Thepressureinthetemplateisthenbackcalculatedfromthetowhead.
qgsc CFL Pin2 Pout
2 0.5 (4)
whereCFListheflowlinecoefficient.
The equation used for the compressibility factor is based on the Hall & Yarborough
equationfittedtoStanding‐KatzChart(eq.5)[3].
z0.06125Pprte
1.2 1t 2
y (5
Where t=Tc/T, the critical temperaturedividedby the reservoir temperature,andy isthereduceddensitywhichisthesolutionof:

9
y 0.06125Pprte
1.2 1t 2 y y2 y3 y4
1 y 3 14.76t 9.76t 2 4.58t 3 y2
90.7t 242.2t 2 42.4t 3 y 2.182.82t 0
(6)
ThebasicdataobtainedfromStatoilneededtodothecalculationsisgiveninAppendix
A.
Afterthechokesoneachwellarefullyopened,thepressureinthetowheadfromboth
templatesmustbethesame.Toachievethis,anerrorcolumnforthepressuredifference
in the towhead from the L‐ and M‐template is made. The flow rates from the two
templates are adjusted using the solver in excel to minimize the error in the error
column.AftertheinstallationoftheWGC,anothercolumnforthecompressionratioand
thecompressionpressureismade.Againthesolverisusedtooptimizetheproduction
by maximizing the pressure differential over the compressor according to the
specificationsgivenbyFRAMO.
2.1.2 Condensate production and validation of dry gas assumption Inordertocalculatethecondensateproduction,blackoiltablesaregeneratedinHYSYS
inorderto findtheoil ingasratio.Thesetablesarealsousedinan in‐housesoftware
calledIPT‐MATBAL.Thisprogramisbasedonamaterialbalance[4],calculatingthereal
reservoirpressureandrealgascondensate(GC)production.Theseresultsarecompared
tothereservoirpressureandcondensateproductioncalculatedfromthedrygas(DG)
materialbalance(figure5).

10
Figure5:Reservorpressureandcondensateproductioncomparison
It is clear from the figure that thedrygas assumption is a valid assumption since the
discrepancy between reservoir pressures and condensate productions are acceptably
small.
2.2 Cases studied
The project is divided into twomain aspects, production and economics, where each
aspectisdividedintosubseacompressorcase(WGC),subseacompressorcasewith15%
downtime (WGC 15% downtime) and subsea compressor case with low pressure
modificationfrom2018(WGC+LP2018).Theobjectiveistocomparethesethreecases
with a reference case, without subsea compressor, both in terms of production
developmentandeconomicimpact.
Thesubseacompressorcaseinvolvesinstallingthecompressorwhenrequired.Forthe
secondcase,subseacompressorwith15%downtime, thedowntime is increasedfrom
10% to 15%. This is to be expected when installing brand new equipment, which is
boundtohavesomeissuesinthebeginning.Thelastcase,alowpressuremodification,
is an additional attempt to increase the recovery from the field. This involves doing

11
modificationstopsideontheplatformtoreducethepressureinthefirstseparatorfrom
65to25bara.
The economic analysis is carried out according to theNorwegianMinistry of Finance
taxationrulesofpetroleumactivities[5].AccordingtoStatoilthesubseaWGCwillcost
anestimated3000MNOKwhiletheLPconversionwillincuranadditionalcostofabout
1000MNOK [6]. The contractors of the subseaWGC project are FRAMOEngineering,
Nexans,Subsea7andApplySørco.Table1showsthemaincontractsandcontractorsfor
thesubseaWGCproject.
Table1:ContractsrelatedtotheGullfakssubseaWGCproject[7‐10]
Contractor Worth
Framo
Engineering
WGC design, testing and
construction
900MNOK
Nexans Umbilical 70MUSD
Subsea7 Engineering services and
equipment
16MEUR
ApplySørco Installation, upgrading and
service
375MNOK
Total 1800MNOK
InordertocalculatetheworthaddedbytheWGCprojectareferencecaseismadeuntil
2029.Fromthisreferencecasetheincrementalgasandcondensatesalesvolumes,ofthe
respective cases, are calculated. A gas price of 2.3 NOK/Sm3 and an oil price of 110
USD/bbl are used in the calculations. Tariffs for oil and gas are not included in the
economic calculations. The operating expenditures (OPEX) are obtained from Statoil
(Baard Haugse). These values include CO2 and NOX taxes and also the loss in sales
volume of gas which is burned off in a gas turbine which generates power for the
compressors. Every3rd year theOPEX is higherdue tomaintenance and theordinary
revision‐stop. It is importanttoemphasizethattheOPEXvaluesusedarenotthetotal
operatingcost for theGullfaksCplatform,but the increase inOPEXdue to thesubsea
WGCinstallation.

12
Theinvestmentdistributionusedinthecalculationsisn‐2:20%,n‐1:40%andn:40%,
where n represents the year of installation of the subsea WGC. The total capital
expenditure(CAPEX)isdepreciatedlinearlyover6yearsaccordingtothedepreciation
rules of petroleum activities. However, the sales incomes are subtracted for OPEX.
Depreciationandlossescarriedforwardyieldingtheordinarytaxbasewhichistaxedat
28%.Theupliftis7.5%ofthecostpriceofthedepreciableoperatingassets.Theupliftis
subtractedfromtheordinarytaxbase,yieldingthespecialtaxbasewhichistaxedat50
%.Thegrossprofitandcashflowsofeverycalendaryeararecalculated.Eventuallythe
presentvalues,andnetpresentvalues(NPVs)areobtained.Thediscountrate(costof
capital)issetto8%,andinflationisneglected.
2.2 Production Results
2.2.1 The Reference case:
The target gas production rate is 10 MSm3/d , and the initial configuration is that
templateLproduces6MSm3/dwhile theM‐templateproduces4 MSm3/d .Eachwell
producesthesameamount.Theobjectiveistomaintaintheplateauproductionrateas
longaspossiblebygraduallyopening thechokes.As longas there isenoughavailable
pressuretomeet therequiredpressure, thechokeswillbeadjustedtoget thedesired
productionrate.Asthepressuredeclines,thechokeswillbegraduallyopeneduntilthey
arefullyopen.Whenthechokesarefullyopen,andtheavailablepressureisequaltothe
requiredpressure,productionbynaturaldecline isno longerpossible if thegoal is to
maintain a production of 10MSm3/d. The rate configuration of 6 and 4MSm3/d can
continue for some years, but eventually theM‐reservoir,which is smaller than the L‐
reservoircannolongersustainthe4MSm3/drate.Thisisillustratedinfigure6and7.

13
Figure6:PressuredevelopmentfortheM‐templateatthetargetproductionrate
Figure7:PressuredevelopmentfortheL‐templateatthetargetproductionrate

14
SincethereisstillpotentialenergyleftintheL‐templatereservoirwhentheM‐template
reservoir shuts down, there is an option of trying tomanipulate the rates from each
templatesothattheplateauproductioncancontinueforlongersuchthatthereservoirs
stopproducingnaturallyat thesametime.By increasing therate fromtheL‐template
from 2013 and simultaneously decreasing the rate from the M‐template, the plateau
productioncanbemaintaineduntilthemiddleof2016.Itisassumedthatinstallmentof
thecompressorwillmakeitpossibletomaintainaproductionof10MSm3/dforalonger
time.Therefore,thecompressorshouldbeinstalledwellbeforethelimitisreachedwith
naturaldepletion.
Allthecasesarebasedonatimeframeofproductionuntil2029.Attheendof2029,the
productionrateisdownto1.64MSm3/d.This isprobablyundertheeconomiclimitof
the field, and thereevenmightbe liquidaccumulation.However the reference case is
doneuntil2029 forcomparison.Thecumulativeproductionofgaswillbe44.4billion
Sm3withrecoveryfactorsof0.62and0.63respectivelyforL‐andM‐templatesin2029.
2.2.2 Subsea WGC case InthecalculationstheWGCstartsoperatingin2016(oneassumenostopinproduction
duringtheinstallationoftheWGCmodule).Thiswillprolongthe10MSm3/dproduction
rate until the middle of 2018. Without the compressors, this limit would have been
roughlytwoyearsearlieraccordingtothereferencecase(AppendixB).
From2016thecompressorsruninparallelwithapressuredifferencefromthesuction
sideandthedischargesideof5.54bara.For2017thispressuredifferenceincreasesto
20.59bara.Thisimpliesthatthecompressorsrunundermoresevereconditionsin2017
to sustain a production of 10MSm3/d. This is illustrated in the compressormaps in
AppendixCwhichshowstheoperatingpointofthecompressorsforthedifferentyears
inacompressormap.Thecompressorsreachtheirmaximumloadforaproductionof10
MSm3/d in the middle 2016 (The operating point move to the boundary of the
compressormap).

15
In2018theproductionrateof10MSm3/dcannolongerbemaintained.Theproduction
rateisdecreasedto9.59MSm3/d.Thetotalproductionisreducedinthefollowingyears
untilthemiddleof2024wheretherateis5.0MSm3/d.Thesuctionpressure(towhead
pressure)isreducedfrom41.97bara(2018.6)to37.12bara(2024.5).
Aftertheproductionisreducedto5MSm3/dtheoptionofrunningthecompressorsin
seriesbecomefeasible.Thismakesitpossibletomaintainthe5MSm3/dproductionrate
untilthefirstquarterof2026.Theproductiondevelopmentafterthispointwilldecline
to 3.47 MSm3/d in 2029. FRAMO claims to have tested the compressors down to a
suction pressure of 13 bara. However the minimum suction pressure used in the
calculationsis20bara.
In2029thecumulativeproductionfortheL‐andM‐templateisestimatedto38.7billion
Sm3and13.9billionSm3respectively. Thisyieldsarecovery factorof0.71 for theL‐
templateand0.79fortheM‐template.ThepressureprofilesfortheL‐andM‐template
areillustratedinfigure8and9.
Figure8:PressuredevelopmentfortheM‐templatewithmanipulatedproductionratesandWGCinstalled

16
Figure9:PressuredevelopmentfortheL‐templatewithmanipulatedproductionratesandWGCinstalled
2.2.3 Subsea WGC with downtime increased Ifthedowntimeincreasesfrom10%to15%theoperatingdaysfortheLandMwillbe
309 and 311 days respectively. Due to less production days, the production will be
reduced. The production of 10.0 MSm3/d will be endured until 2019.8 and the
5.0MSm3/dlimitwillbereachedin2025.Theaccumulativeproductionin2029willbe
51.7 billion Sm3. This results in recovery factors of 0.70 for L and 0.78 for the M‐
template.
2.2.4 Low pressure configuration The low pressure modification is done in addition to the compressor. The lower
pressure in the separatorallows the10millionSm3/dproductionplateau to continue
foranother sixmonths compared to theWGCcase.Theproductionratedeclinesuntil
2029,andthetotalproductionrateis3.18millionSm3/d.Thecumulativeproductionis
53.35billionSm3andtherecoveryfactorsare0.72and0.81forLandMrespectively.

17
2.2.5 Production and recovery
Figure10:Annualproductionforthereferencecase,theWGCandtheWGC+LP2018
In figure 10 the annual production for all the cases are compared. Table 2 gives asummaryofthemainresultsfromthecalculationsinAppendixB.

18
Table2:Summaryof themainresults in termsofproductionrates,accumulativeproductionandrecoveryfactors
Situation CASE YEAR Total qf
(million
Sm3/d)
TotalGp
(billion
Sm3)
Gp/G (L‐
Template)
Gp/G (M‐
Template)
End of 10
MSm3/d
natural
plateau
Allcases 2016.5 10 24.65 0.31 0.44
End of 10
MSm3/d
compressor
plateau
Referencecase ‐
Withcompressor 2017.6 10 31.5 0.41 0.53
Compressor+15%
downtime
2017.8 10 31.9 0.41 0.54
Low pressure
modification
2019.1 10 33.19 0.43 0.56
5 million
Sm3
Economic
limit
Referencecase ‐
*Withcompressor 2025.3 5 47.7 0.644 0.735
*Compressor+15%
downtime
2025.6 5 47.2 0.636 0.729
Low pressure
modification
2025.5 5 47.71 0.64 0.75
Continue
production
until2029
Referencecase 2029 1.64 44.4 0.62 0.63
Withcompressor 2029 3.47 52.6 0.71 0.79
Compressor+15%
downtime
2029 3.73 51.7 0.70 0.78
Low pressure
modification
2029 3.18 53.35 0.72 0.81
*Seriesoperationofcompressorused.
The production rates and recovery factors for every calendar year are displayed in
figure11and12fortheM‐andL‐templaterespectively.

19
Figure11:ProductionratesandrecoveryfactorsfortheM‐templateforallcases
Figure12:ProductionratesandrecoveryfactorsfortheL‐templateforallcases

20
2.2.7 Condensate production Associatedwith thegasproduction therewillalsobeaproductionofcondensate.The
relationbetweencondensateproductionandreservoirpressure is illustrated in figure
13fortheWGCcase.
Figure13:DevelopmentinreservoirpressureandcondensategasratiofortheL‐andM‐template
The condensate production relative to the gas production is given in figure 14. The
condensateproductionismuchlowerthanthegasproduction.Howeverthecondensate
productionisstillvaluableandwillbeevaluatedintheeconomicpart.

21
Figure14:Totalannularcondensateandgasproductionforthedifferentcases
2.2.6 Discussion Theproductionsummarytablegivesthedataforthemostimportantmilestonesforthe
field.ItisapparentthattheLPcaseisthemostbeneficialprojectintermsofrecovery.
This applies both for the 5MSm3/d limit and for productionuntil 2029.This is to be
expected, since thepressure requiredby theseparator ismuch lower.Becauseof this
lowpressure,itisnotnecessarytorunthecompressorinseries.Therefore,noeffortis
made trying tokeepasecondplateauof5.0MSm3/d(aswasdone for theWGCcase).
Thisbecomesevidentinfigure10,whereinitiallytheyearlycumulativeproductionfor
thelowpressurecaseishigherthanfortheWGCcase.Aswitchhappensaround2025,
when theWGC case starts to operate in series to maintain the plateau. The LP‐case
productioncontinuestodecreaseevenly.Despitethis,thetotalproductionisstillhigher
fortheLPcase,duetothehigherproductionintheearlystages.
Whenthedowntimeincreasesfrom10to15%,itbasicallymeansthattheproductionis
postponed,anditislesscomparedtotheWGCcase.Fromtable2,therecoveryforthe
increased downtime case actually is bigger than for the regular case when the first

22
plateauends.Thisisbecausetheendofthecompressorplateauisdelayed,duetolower
production.Thiseffectstartstodiminishovertime,asseenattheendofthe5MSm3/d
limit,where the recovery for the regular case ishigher than thedowntime case, even
though it ends earlier. Figures 11 and12 give a clear picture of the recoveries for the
differentcasesaswellasproductionrate.Eventhoughthisresultstatesclearlythatthe
low pressure modification gives the highest recovery, it is important to evaluate the
economicaspectof thecasewhichincludesanextra investment.Oneshouldnotmake
thesedecisionsbasedonproductiondataalone.
2.3 Economic results
2.3.1 NPV and cash flow
An increase in downtime to 15% (afterWGC installation)willmake the project less
profitable.TheNPV fora timehorizonof2029 is reduced from859.5MNOK to596.8
MNOK(AppendixE).Actually,an increase indowntimedue to thesubseaWGCwould
decrease the total production for the first year after installation, compared to just
continuingwith normal productionwithout the compressor. However these losses in
productionfor2016canbecarriedforwardyieldingalowertaxbasethefollowingyear.
The cash flows generated by the sales volume of gas and the sales volume of oil
(condensate),aregivenforallthecasesinAppendixE.Table3displaystheeffectofan
increaseindowntimeto15%.TheeffectintermsofNPVfora15yeartimehorizonis
265.4MNOK,andthisdifferencewillgethigherforalongertimespan.
Table3:Keyeconomicnumbers
IRR NPV(MNOK) Break‐even gas price
(NOK/Sm3)
Year/case WGC WGC
15%
WGC +
LP2018
WGC WGC
15%
WGC +
LP2018
WGC WGC
15%
WGC +
LP2018
2023 9.6% 7.4% 10.4% 168.0 ‐63.9 279.7 2.01 2.43 1.91
2026 12.3% 10.2% 12.7% 553.9 284.3 647.3 1.56 1.85 1.57
2029 13.7% 12.0% 13.8% 859.5 596.8 900.3 1.32 1.52 1.40

23
Figure15:CumulativecashflowdiagramfortheWGC,WGC15%andWGC+LP2018
Figure15indicatesthatbothcaseswillbreakevenaround2019.Underalowpressure
conversionofthetopside, theproductionhastobestoppedforashortperiodoftime.
Thestop inproductionwillprobably last fora fewweeks.However,by increasing the
production rate immediately after the stop, the lost production is assumed to be
regained.
TheLPconversionisfavorable,generatingaNPVof900.3MNOKforatimehorizonuntil
2029comparedtoaNPVof859.5MNOKwithouttheLPconversion.Thedropat2018
for theLPconversioncase is causedby thenew investmentof1000MNOK(affiliated
withtheconversion.)SomekeyvaluesastheinternalrateofreturnandNPVaregivenin
table3.

24
2.3.2 Discussion
TheeconomicresultsupportstheWGC+LP2018case.Probably,thisoptionwillbeeven
more beneficial compared to the WGC case since the compressor is operating at a
maximum for an extended period.More severe operating conditionsmay causemore
wearonthecompressorwhichwillhaveaneconomicimpactontheproject.After2021
the LP2018 becomes the most profitable, as seen in figure 15, where the green line
crossestheblue line.Themost important factortodeterminetherealNPVwillbethe
lifetime of the field. In addition, after a certain number of years, the incremental
production ratewill probablybe the total production.This is because the fieldhas to
shutdowna lotearlier ifnoproject iscarriedout.TherealNPVvaluemaybegreater
thanthevaluescalculatedinthisproject.
2.4 Sensitivity analysis Inthissection,attemptsaremadetopredicthowtheprojectwillbeaffectedbychanges
incertaineconomicparameters.Here,threeeconomicparameters,namely;CAPEX,gas
price,andcostofcapital,areconsidered.Thissensitivityanalysisiscarriedoutonlyfor
theWGCcasewithout increase indowntime.The target is togiveSTATOILoptions in
makingdecisionsonhowtoinvestbasedontheeffectsofchangesintheaforementioned
parameterson theNPV.Thisanalysis is importantas it enablesone to find the factor
thatwillhavethebiggestimpactontheprojectandtheeffectsofthebestandworstcase
for NPV. In this light, sensitivity analyses is carried out for +/‐ 30% CAPEX, +/‐9%
NOK/Sm3 gas price, and +/‐25% cost of capital on NPV over the entire period of
productionuntil2029.
(i) EffectonNPV+/‐30%changeinCAPEX
Fromfigure16,itisconcludedinallthecasestheNPV’saresensitiveduetochangeof
CAPEX.Thisprojectcanbreak‐evenin2020iftheCAPEXis30%less.Ontheotherhand,
thecompanyhastowaituntil2024tomakeprofitiftheinvestmentis30%higherthan
theinitialcase.Attheendoftheyear2029,theNPVsare1180,859and538MNOKfor‐
30%CAPEX,initialCAPEXand+30%CAPEXrespectively.

25
Figure16:EffectonNPVbychangeinCAPEX
(ii) EffectofchangeofNPVingaspriceInfigure17theeffectofchangesingaspriceonNPVisdisplayed.Theprojectisnotvery
sensitivebychangesingasprice.Theprofithasslightlyincreasingtrendfromtheyear
2023 till 2029. However, 2.5 NOK/Sm3 gas price is the favorable situation when the
profitisthemajorconcern.Attheendof2029theNPVsare1035,860and684MNOK
for2.5NOK/Sm3,2.3NOK/Sm3and2.1NOK/Sm3respectively.

26
Figure17:EffectonNPVbychangeingasprice
(iii) EffectofchangeofcostofcapitalonNPV
Infigure18,onecanseethevariationinNPVbychangingdiscountrate.Thebestwayto
earnmoremoneyistoreducediscountrateby25%. At8%discountrate, theproject
startstoyieldprofitin2022.However,theprojectisstilleconomicallyfeasibleincaseof
25%incrementindiscountrate.Itonlydelaysthepaybacktimeforanotherthreeyears,
comparedtothatofreductionincostofcapital.TheNPV’sare1294,860and505 MNOK
for ‐25%, initialdiscount rate and+25%discount rate respectively at the endof year
2029.Thedetailsofthetotalcashflowisshowntable4.

27
Figure18:EffectonNPVbychangeindiscountrate
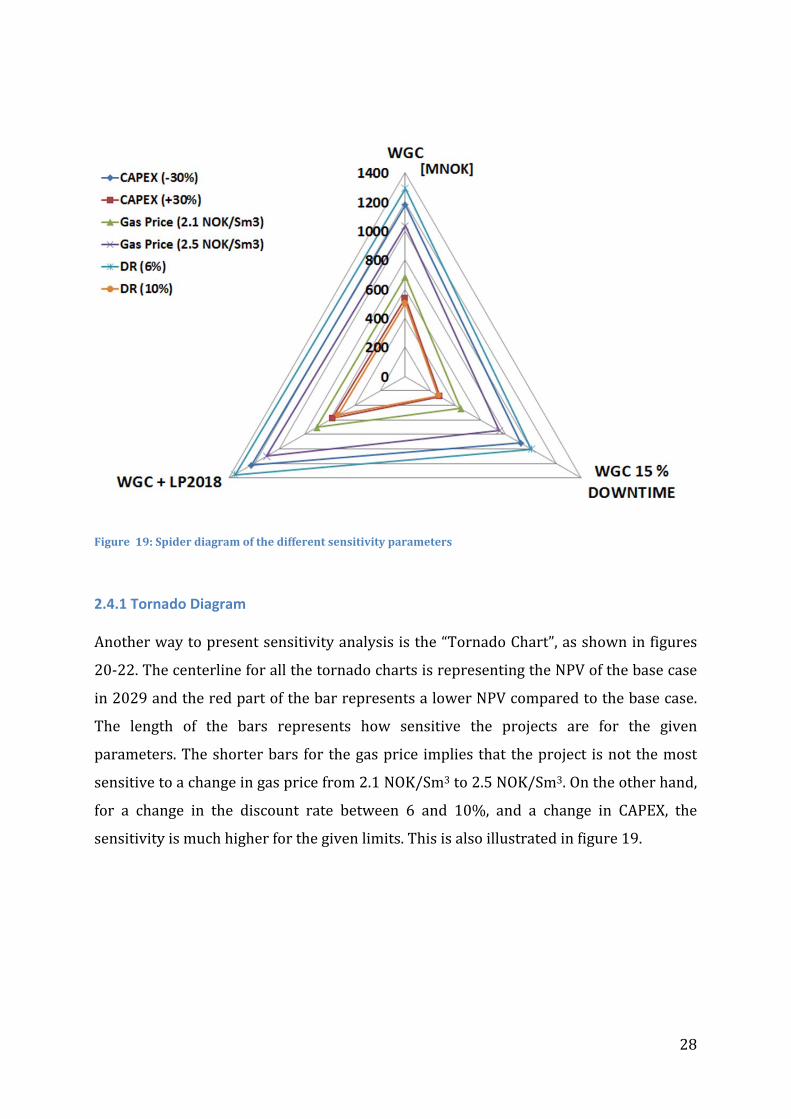
Figure 19 represents a spider diagram of the NPV sensitivities. The three economic
parameters are used to compare NPV at the end of year 2029. More profit can be
obtained by usingWGC+LPmodification. After that, it can be underlined that the LP
conversionisthebestcasetomakeprofitfollowedbyWGCandWGC15%downtimein
thatorder.TheNPVdecreasesasthelinesmovetowardsthecenterofthefigure.
Table4:NPVsinMNOK2029
Cases
CAPEX(‐30%)
CAPEX(+30%)
GasPrice(‐9%)
GasPrice(+9%)
DR(‐25%)
DR(+25%)
WGC10%downtime 1180.6 538.3 684.1 1034.8 1294.3 504.7WGC15%downtime 917.9 275.6 443.7 749.8 1003.4 266.5WGC+LPconversion 1221.5 579.2 701.0 1099.7 1351.7 531
28
Figure19:Spiderdiagramofthedifferentsensitivityparameters
2.4.1 Tornado Diagram Anotherwaytopresentsensitivityanalysisisthe“TornadoChart”,asshowninfigures
20‐22.ThecenterlineforallthetornadochartsisrepresentingtheNPVofthebasecase
in2029andtheredpartofthebarrepresentsalowerNPVcomparedtothebasecase.
The length of the bars represents how sensitive the projects are for the given
parameters.Theshorterbars for thegasprice implies that theproject isnot themost
sensitivetoachangeingaspricefrom2.1NOK/Sm3to2.5NOK/Sm3.Ontheotherhand,
for a change in the discount rate between 6 and 10%, and a change in CAPEX, the
sensitivityismuchhigherforthegivenlimits.Thisisalsoillustratedinfigure19.

29
Figure20:TornadodiagramfortheCPAEXsensitivity
Figure21:Tornadodiagramforthegaspricesensitivity
Figure22:Tornadodiagramforthediscountratesensitivity

30
2.4.2 Discussion
The project seems robust, as none of the tested sensitivities yield a negative NPV,
assumingthattheproductionwillcontinueuntilat least2029.Thesensitivityanalysis
showsthattheprojectismoresensitivetochangesinCAPEXvaluesthanchangesinthe
gasprice.EventhoughthedifferentdiscountrateshavealargeimpactontheNPV,the
discountrateisusuallynottheparameterwiththelargestvariationsandremainsfairly
constantovertime.
3. Conclusions and recommendations FromthisreportitisevidentthatStatoilshouldcarryonwiththesubseaWGCproject
onGullfaksSouth.ThecompressorshouldbeinstalledasplannedbyStatoilinOctober
of2015.
ByinstallingtheWGCmoduletheproductionplateaucanbeextendedby2years. The
WGCmodulewillincreasetherecoveryfactorfrom0.62to0.71fortheL‐templateand
from 0.63 to 0.79 for the M‐template. However by going forward with low pressure
modificationtopsidein2018,therecoveryfactorsmaybefurtherenhancedto0.72and
0.81fortheL‐andM‐templaterespectively.
TheeconomicanalysisrecommendsgoingthroughwiththeWGCinstallation,andalso
makingaLPconversionin2018.ThefinalNPVfortheprojectwillbe900.3MNOK(for
productionuntil2029).Sensitivityanalysis shows thata change in theCAPEXhas the
largestimpactontheproject.
In addition the Gullfaks subseaWGC project gives Statoil, if successful; the option to
utilize this technologyonother fieldsotherplaces in theworld.Thisoptionwillbeof
considerableworth.

31
4. References
[1] Norwegian Petroleum Directorate (NPD):
http://factpages.npd.no/factpages/Default.aspx?culture=no
Retrieved21.04.13
[2]Statoil:
http://www.statoil.com/no/NewsAndMedia/PressRoom/PressKitAsgardCompression/
Pages/default.aspx
Download“Åsgardundervanns‐gasskompresjon–faktaark”
Retrieved23.04.13
[3]K.Dune andO. Bright: “A new computerized approach to z‐factor determination”,
TransnationalJournalofScienceandTechnologyAugust2012editionvol.2,No.7
[4] C. Whitson and M. Brulé: “Phase behavior” SPE Monograph volume 20,Society of
PetroleumEngineers,2000
[5]NorwegianMinistryofFinance:
http://www.regjeringen.no/en/dep/fin/Selected‐topics/taxes‐and‐
duties/bedriftsbeskatning/Taxation‐of‐petroleum‐activities.html?id=417318
Retrieved15.04.13
[6]Statoil:
http://www.statoil.com/no/NewsAndMedia/News/2012/Pages/21May_Gullfaks_Comp
ression.aspx
Retrieved11.02.13
[7]Statoil:
http://www.statoil.com/no/NewsAndMedia/News/2012/Pages/12April12FramoComp
ressionContract.aspx
Retrieved15.04.13

32
[8]Nexans:
http://www.nexans.com/eservice/Corporate‐en/navigatepub_291712_‐
31920/Nexans_awarded_16_million_Euro_umbilical_contract_.html
Retrieved15.04.13
[9]Rigzone:
http://www.rigzone.com/news/oil_gas/a/121985/Subsea_7_Wins_Gullfaks_C_Contract
Retrieved15.04.13
[10]Offshore.no:
http://www.offshore.no/sak/35574_gullfaks_c_kontrakt_til_apply
Retrieved15.04.13

33
5. Appendices
Appendix A: Initial conditions and parameters
Gullfkas South L‐M satellite system
Pre‐comression Phase (Start Jan 2009)
East Tank
L‐Template
Fault Block 13
Brent Formation
West Tank
M‐Template
Fault Block 14
Brent Formation
G=GIIP-Gas cap (31 December 2008) 17,5E+9 Sm3
Condnsate from Gas Cap (31 December 2008) 4,4E+6 Sm3
oil legs: STOIIP (31 December 2008) 7,5E+6 Sm3
Gas in Solution (from oil leg) 1,9E+9 Sm3
Rs Solution Gas oil Ratio (oil leg) (31 December 2008) 248 Sm3/Sm3
rs Condensate gas ratio (gas cap) (31 December 2008) 251 Sm3/MSm3
STOIIP + Condensate (31 December 2008) 34,5E+6 Sm3
GIIP + diss.gas (31 December 2008) 54,2E+9 Sm3
Daily Plateau production rate (per template)-Precompression mode 6,0E+6 4,0E+6 Sm3/d
Wells per template (Pre compression) 4 3
Production days per year 328 330 day
TR 128 112oC
Pi, initial Res pressure (01 Jan 2009) 240 210 bara
Pi, initial Res pressure (1999) 459 446
C, inflow Back pressure coefficient 1000 700 Sm3/bar^2n
n, backpressure, exponent 0,8 0,8
Tubing MD 3515 2800
Tubing TVD 3100 2500
Ct, Tubing coefficient 7" (ID=6.094") 38152,4 41163 Sm3/bar
Elevation coeff Tubing, S 0,43 0,34
CFL 12".Template L-to-Towhead 66 m (ID=) Pre-compression spool 1403054 Sm3/bar
CFL 8" Template-to-Towhead 62 m (Id=) 466786 Sm3/bar
CFL 12".Template M-to-Towhead 64 m (ID=) compression spool 1397663 Sm3/bar
CPL Pipeline 14" Towhead-to-GFC 14000m (ID=0.32m) 148220 148220 Sm3/bar
CPL Pipeline 8" Towhead-to-GFC 14000m (N-Line) (ID=0.197m) 32967 32967 Sm3/bar
Separator pressure GFC (Inlet Sep) 60 60 bara
Tope GFC riser pressure (High pressue mode) 65 65
Tope GFC riser pressure (Low pressue mode) 25 25
Gas molecular weight (Methane) 19 19 kg/kmole
Gas specific gravity 0,66 0,66 Gas specific gravity

34
Appendix B: Calculation sheets Referencecase
2x14''
Calen
der yea
rqf
Gp
Gp/G
PR
Zqw
pwf
pwh
qf
Gp
Gp/G
PR
Zqw
pwf
pwh
psep
ptowhead
ptem
pDpCHoke
psep
ptowhead
ptem
pDpchoke
Calen
der yea
rCalen
der yea
rTotal p
roductio
nPtowheadL
PtowheadM
PtowheadAerro
r
Sm3/day
Sm3
bara
Sm3/day
bara
bara
Sm3/day
Sm3
bara
Sm3/day
bara
bara
bara
bara
bara
bar
bara
bara
bara
bar
31st d
ecember
1st ja
nuary
Sm3/day
bara
bara
bara
bara^2
2008
6,00E+0
6000,0E+0
0,00
240
0,95676
1,5E+6
220
173
4,00E+0
6000,0E+0
0,00
210
0,92636
1,3E+0
6178
146
65
73
73,4
99,8
65
73
73,3
72,7
2008
2009
1,0E+0
7‐
‐‐
‐
2009
6,00E+0
62,0E+9
0,04
231
0,95257
1,5E+6
210
165
4,00E+0
61,3E+9
0,08
194
0,92148
1,3E+0
6158
129
65
73
73,4
91,9
65
73
73,3
56,2
2009
2010
1,0E+0
7‐
‐‐
‐
2010
6,00E+0
63,9E+9
0,07
222
0,94835
1,5E+6
199
156
4,00E+0
62,6E+9
0,15
177
0,91818
1,3E+0
6137
111
65
73
73,4
83,0
65
73
73,3
37,8
2010
2011
1,0E+0
7‐
‐‐
‐
2011
6,00E+0
65,9E+9
0,11
212
0,94464
1,5E+6
189
147
4,00E+0
64,0E+9
0,23
161
0,91689
1,3E+0
6116
92
65
73
73,4
74,0
65
73
73,3
18,5
2011
2012
1,0E+0
7‐
‐‐
‐
2012
7,00E+0
68,2E+9
0,15
201
0,94107
1,8E+6
171
130
3,00E+0
65,0E+9
0,28
149
0,91719
1,0E+0
6116
95
65
73
73,4
56,7
65
73
73,3
21,3
2012
2013
1,0E+0
7‐
‐‐
‐
2013
7,00E+0
610,5E+9
0,19
190
0,93820
1,8E+6
158
119
3,00E+0
65,9E+9
0,34
137
0,91851
1,0E+0
6100
81
65
73
73,4
45,6
65
73
73,3
7,7
2013
2014
1,0E+0
7‐
‐‐
‐
2014
7,50E+0
613,0E+9
0,24
179
0,93593
1,9E+6
140
102
2,50E+0
66,8E+9
0,39
128
0,92035
8,3E+0
597
79
65
73
73,4
28,9
65
73
73,3
5,5
2014
2015
1,0E+0
7‐
‐‐
‐
2015
8,00E+0
615,6E+9
0,29
167
0,93438
2,0E+6
121
82
2,00E+0
67,4E+9
0,42
120
0,92229
6,7E+0
596
79
65
73
73,5
9,0
65
73
73,2
5,6
2015
2016
1,0E+0
7‐
‐‐
‐
2015,5
8,00E+0
616,9E+9
0,31
161
0,93393
2,0E+6
112
74
2,00E+0
67,8E+9
0,44
116
0,92338
6,7E+0
591
75
65
73
73,5
0,8
65
73
73,2
1,6
2015,5
2016,5
1,0E+0
7
2016
7,60E+0
618,1E+9
0,33
156
0,93372
1,9E+6
109
73
1,91E+0
68,1E+9
0,46
113
0,92453
6,4E+0
588
72
65
72
72,7
0,0
65
72
72,5
0,0
2016
2017
9,5E+0
672,48
72,48
72,48
1,96E‐1
6
2017
6,74E+0
620,3E+9
0,37
147
0,93377
1,7E+6
103
71
1,62E+0
68,6E+9
0,49
107
0,92670
5,4E+0
586
71
65
71
71,0
0,0
65
71
70,9
0,0
2017
2018
8,4E+0
670,85
70,85
70,85
6,15E‐1
1
2018
5,98E+0
622,2E+9
0,41
138
0,93430
1,5E+6
99
70
1,37E+0
69,0E+9
0,52
102
0,92874
4,6E+0
584
70
65
70
69,7
0,0
65
70
69,6
0,0
2018
2019
7,4E+0
669,57
69,57
69,57
2,06E‐1
1
2019
5,31E+0
624,0E+9
0,44
131
0,93515
1,3E+6
95
69
1,16E+0
69,4E+9
0,54
97
0,93061
3,9E+0
582
69
65
69
68,7
0,0
65
69
68,6
0,0
2019
2020
6,5E+0
668,56
68,56
68,56
9,93E‐1
1
2020
4,71E+0
625,5E+9
0,47
124
0,93618
1,2E+6
92
68
9,79E+0
59,7E+9
0,56
93
0,93229
3,3E+0
581
68
65
68
67,9
0,0
65
68
67,8
0,0
2020
2021
5,7E+0
667,77
67,77
67,77
1,43E‐1
0
2021
4,18E+0
626,9E+9
0,50
118
0,93731
1,0E+6
90
67
8,22E+0
510,0E+9
0,57
90
0,93377
2,7E+0
580
67
65
67
67,2
0,0
65
67
67,2
0,0
2021
2022
5,0E+0
667,15
67,15
67,15
7,79E‐1
2
2022
3,70E+0
628,1E+9
0,52
113
0,93848
924,7E+3
88
67
6,86E+0
510,2E+9
0,59
88
0,93505
2,3E+0
579
67
65
67
66,7
0,0
65
67
66,7
0,0
2022
2023
4,4E+0
666,66
66,66
66,66
6,06E‐1
3
2023
3,27E+0
629,2E+9
0,54
109
0,93965
817,7E+3
86
66
5,70E+0
510,4E+9
0,60
86
0,93614
1,9E+0
579
66
65
66
66,3
0,0
65
66
66,3
0,0
2023
2024
3,8E+0
666,28
66,28
66,28
1,35E‐1
2
2024
2,89E+0
630,1E+9
0,56
105
0,94078
7,2E+0
585
66
4,70E+0
510,6E+9
0,61
84
0,93707
1,6E+0
578
66
65
66
66,0
0,0
65
66
66,0
0,0
2024
2025
3,4E+0
665,98
65,98
65,98
7,99E‐1
1
2025
2,54E+0
631,0E+9
0,57
101
0,94186
6,4E+0
584
66
3,84E+0
510,7E+9
0,61
82
0,93785
1,3E+0
578
66
65
66
65,8
0,0
65
66
65,7
0,0
2025
2026
2,9E+0
665,75
65,75
65,75
3,87E‐1
3
2026
2,23E+0
631,7E+9
0,58
98
0,94286
5,6E+0
583
66
3,12E+0
510,8E+9
0,62
81
0,93848
1,0E+0
578
66
65
66
65,6
0,0
65
66
65,6
0,0
2026
2027
2,5E+0
665,56
65,56
65,56
1,81E‐1
1
2027
1,95E+0
632,3E+9
0,60
95
0,94378
4,9E+0
582
65
2,50E+0
510,9E+9
0,62
80
0,93900
8,3E+0
478
65
65
65
65,4
0,0
65
65
65,4
0,0
2027
2028
2,2E+0
665,42
65,42
65,42
9,59E‐1
4
2028
1,70E+0
632,9E+9
0,61
93
0,94462
4,3E+0
582
65
1,99E+0
511,0E+9
0,63
79
0,93942
6,6E+0
478
65
65
65
65,3
0,0
65
65
65,3
0,0
2028
2029
1,9E+0
665,32
65,32
65,32
8,13E‐1
3
2029
1,48E+0
633,4E+9
0,62
91
0,94537
3,7E+0
582
65
1,56E+0
511,0E+9
0,63
79
0,93975
5,2E+0
477
65
65
65
65,2
0,0
65
65
65,2
0,0
2029
2030
1,6E+0
665,23
65,23
65,23
5,96E‐1
3
2030
1,28E+0
633,8E+9
0,62
89
0,94605
3,2E+0
581
65
1,21E+0
511,1E+9
0,63
78
0,94000
4,0E+0
477
65
65
65
65,2
0,0
65
65
65,2
0,0
2030
2031
1,4E+0
665,17
65,17
65,17
1,22E‐1
6
2031
1,10E+0
634,2E+9
0,63
88
0,94664
2,8E+0
581
65
9,23E+0
411,1E+9
0,63
78
0,94020
3,1E+0
477
65
65
65
65,1
0,0
65
65
65,1
0,0
2031
2032
1,2E+0
665,12
65,12
65,12
3,62E‐1
1
2032
9,45E+0
534,5E+9
0,64
86
0,94716
2,4E+0
581
65
6,93E+0
411,1E+9
0,64
78
0,94035
2,3E+0
477
65
65
65
65,1
0,0
65
65
65,1
0,0
2032
2033
1,0E+0
665,09
65,09
65,09
1,83E‐1
3
2033
8,04E+0
534,7E+9
0,64
85
0,94760
2,0E+0
581
65
5,11E+0
411,1E+9
0,64
78
0,94045
1,7E+0
477
65
65
65
65,1
0,0
65
65
65,1
0,0
2033
2034
8,6E+0
565,06
65,06
65,06
3,74E‐1
2
East tank, L‐te
mplate
, 4 wells
West tan
k, M‐te
mplate
, 3 wells

35
WGCbasecase
2x14''
Calen
der yea
rqf
Gp
Gp/G
PR
Zqw
pwf
pwh
qf
Gp
Gp/G
PR
Zqw
pwf
pwh
psep
ptowhead
ptem
pDpCHoke
psep
ptowhead
ptem
pDpchoke
Total p
roductio
nPtowheadL
PtowheadM
PtowheadAerro
r dPcomp
rp co
mp
dPcomp, fixerro
r
Sm3/day
Sm3
bara
Sm3/day
bara
bara
Sm3/day
Sm3
bara
Sm3/day
bara
bara
bara
bara
bara
bar
bara
bara
bara
bar
Sm3/day
bara
bara
bara
bara^2
bara
bara
bara^2
2008
6,00E+0
6000,0E+0
0,00
240
0,95676
1,5E+6
220
173
4,00E+0
6000,0E+0
0,00
210
0,92636
1,3E+0
6178
146
65
73,2
73,4
99,8
65
73,2
73,3
72,7
1,00E+0
7‐
‐‐
‐‐
‐‐
‐
2009
6,00E+0
62,0E+9
0,04
231
0,95257
1,5E+6
210
165
4,00E+0
61,3E+9
0,08
194
0,92148
1,3E+0
6158
129
65
73,2
73,4
91,9
65
73,2
73,3
56,2
1,00E+0
7‐
‐‐
‐‐
‐‐
‐
2010
6,00E+0
63,9E+9
0,07
222
0,94835
1,5E+6
199
156
4,00E+0
62,6E+9
0,15
177
0,91818
1,3E+0
6137
111
65
73,2
73,4
83,0
65
73,2
73,3
37,8
1,00E+0
7‐
‐‐
‐‐
‐‐
‐
2011
6,00E+0
65,9E+9
0,11
212
0,94464
1,5E+6
189
147
4,00E+0
64,0E+9
0,23
161
0,91689
1,3E+0
6116
92
65
73,2
73,4
74,0
65
73,2
73,3
18,5
1,00E+0
7‐
‐‐
‐‐
‐‐
‐
2012
7,00E+0
68,2E+9
0,15
201
0,94107
1,8E+6
171
130
3,00E+0
65,0E+9
0,28
149
0,91719
1,0E+0
6116
95
65
73,2
73,4
56,7
65
73,2
73,3
21,3
1,00E+0
7‐
‐‐
‐‐
‐‐
‐
2013
7,00E+0
610,5E+9
0,19
190
0,93820
1,8E+6
158
119
3,00E+0
65,9E+9
0,34
137
0,91851
1,0E+0
6100
81
65
73,2
73,4
45,6
65
73,2
73,3
7,7
1,00E+0
7‐
‐‐
‐‐
‐‐
‐
2014
7,50E+0
613,0E+9
0,24
179
0,93593
1,9E+6
140
102
2,50E+0
66,8E+9
0,39
128
0,92035
8,3E+0
597
79
65
73,2
73,4
28,9
65
73,2
73,3
5,5
1,00E+0
7‐
‐‐
‐‐
‐‐
‐
2015
8,00E+0
615,6E+9
0,29
167
0,93438
2,0E+6
121
82
2,00E+0
67,4E+9
0,42
120
0,92229
6,7E+0
596
79
65
73,2
73,5
9,0
65
73,2
73,2
5,6
1,00E+0
7‐
‐‐
‐‐
‐‐
‐
2015,5
8,00E+0
616,9E+9
0,31
161
0,93393
2,0E+6
112
74
2,00E+0
67,8E+9
0,44
116
0,92338
6,7E+0
591
75
65
73,2
73,5
0,8
65
73,2
73,2
1,6
1,00E+0
7
2016
7,88E+0
618,2E+9
0,34
156
0,93371
2,0E+6
106
68
2,12E+0
68,1E+9
0,46
112
0,92480
7,1E+0
583
68
65
73,2
73,4
65
73,2
73,2
1,00E+0
767,71
67,67
67,69
9,99E‐0
45,54
1,08
2017
7,71E+0
620,7E+9
0,38
145
0,93385
1,9E+6
91
53
2,29E+0
68,9E+9
0,51
103
0,92804
7,6E+0
566
53
65
73,2
73,4
65
73,2
73,3
1,00E+0
752,66
52,62
52,64
1,00E‐0
320,59
1,39
2017,6
7,62E+0
622,2E+9
0,41
138
0,93428
1,9E+6
81
42
2,38E+0
69,4E+9
0,53
98
0,93025
7,9E+0
555
42
65
73,2
73,4
65
73,2
73,3
1,00E+0
741,99
41,95
41,97
1,00E‐0
331,26
1,74
2018
7,33E+0
623,1E+9
0,43
134
0,93468
1,8E+6
78
41
2,26E+0
69,6E+9
0,55
95
0,93172
7,5E+0
553
41
65
72,6
72,8
65
72,6
72,6
9,59E+0
640,58
40,62
40,60
1,00E‐0
332,00
1,79
32
2,44E‐2
6
2019
6,58E+0
625,3E+9
0,47
125
0,93598
1,6E+6
72
39
1,95E+0
610,3E+9
0,59
87
0,93527
6,5E+0
550
39
65
71,1
71,2
65
71,1
71,1
8,52E+0
639,05
39,10
39,07
1,00E‐0
332,00
1,82
32
3,22E‐1
4
2020
5,91E+0
627,2E+9
0,50
117
0,93760
1,5E+6
67
38
1,68E+0
610,8E+9
0,62
81
0,93862
5,6E+0
548
38
65
69,9
70,0
65
69,9
69,9
7,60E+0
637,85
37,89
37,87
1,00E‐0
332,00
1,85
32
3,01E‐1
5
2021
5,31E+0
628,9E+9
0,53
110
0,93939
1,3E+6
63
37
1,45E+0
611,3E+9
0,65
75
0,94172
4,8E+0
546
37
65
68,9
69,0
65
68,9
68,9
6,76E+0
637,21
37,26
37,24
1,00E‐0
331,65
1,85
32
1,22E‐0
1
2022
4,76E+0
630,5E+9
0,56
103
0,94128
1,2E+6
60
37
1,24E+0
611,7E+9
0,67
71
0,94452
4,1E+0
546
37
65
68,1
68,2
65
68,1
68,1
6,00E+0
637,18
37,22
37,20
1,00E‐0
330,88
1,83
32
1,26E+0
0
2023
4,27E+0
631,9E+9
0,59
97
0,94318
1,1E+6
58
37
1,05E+0
612,1E+9
0,69
67
0,94702
3,5E+0
545
37
65
67,4
67,5
65
67,4
67,4
5,32E+0
637,24
37,28
37,26
1,00E‐0
330,18
1,81
32
3,32E+0
0
2023,5
4,05E+0
632,6E+9
0,60
94
0,94412
1,0E+6
57
37
9,79E+0
512,2E+9
0,70
65
0,94816
3,3E+0
545
37
65
67,2
67,2
65
67,2
67,2
5,03E+0
637,09
37,14
37,12
1,00E‐0
330,06
1,81
32
3,75E+0
0
2024
3,99E+0
633,2E+9
0,61
92
0,94515
1,0E+0
653
34
1,01E+0
612,4E+9
0,71
63
0,94951
3,4E+0
541
34
65
67,2
67,2
65
67,2
67,2
5,00E+0
633,56
33,64
33,60
2,55E‐0
333,55
1,41
2025
3,92E+0
634,5E+9
0,64
86
0,94725
9,8E+0
544
25
1,08E+0
612,7E+9
0,73
58
0,95231
3,6E+0
531
25
65
67,2
67,2
65
67,2
67,2
5,00E+0
624,61
24,71
24,66
5,17E‐0
342,49
1,65
2025,3
3,90E+0
634,9E+9
0,64
85
0,94786
9,7E+0
542
22
1,10E+0
612,9E+9
0,73
57
0,95311
3,7E+0
528
22
65
67,2
67,2
65
67,2
67,2
5,00E+0
621,66
21,70
21,68
1,00E‐0
345,47
1,76
2026
3,67E+0
635,7E+9
0,66
81
0,94937
9,2E+0
539
21
1,02E+0
613,1E+9
0,75
55
0,95505
3,4E+0
526
20
65
66,9
66,9
65
66,9
66,9
4,69E+0
620,40
20,44
20,42
1,00E‐0
346,48
1,81
60
1,83E+0
2
2027
3,34E+0
636,8E+9
0,68
76
0,95142
8,3E+0
537
20
8,97E+0
513,4E+9
0,76
51
0,95752
3,0E+0
526
20
65
66,5
66,6
65
66,5
66,6
4,23E+0
620,29
20,34
20,31
1,00E‐0
346,24
1,81
60
1,89E+0
2
2028
3,04E+0
637,8E+9
0,70
72
0,95338
7,6E+0
535
20
7,90E+0
513,6E+9
0,78
48
0,95976
2,6E+0
525
20
65
66,3
66,3
65
66,3
66,3
3,83E+0
620,21
20,25
20,23
1,00E‐0
346,04
1,81
60
1,95E+0
2
2029
2,77E+0
638,7E+9
0,71
68
0,95527
6,9E+0
534
20
6,98E+0
513,9E+9
0,79
45
0,96179
2,3E+0
525
20
65
66,0
66,1
65
66,0
66,0
3,47E+0
620,14
20,18
20,16
9,99E‐0
445,88
1,81
60
1,99E+0
2
2030
2,53E+0
639,5E+9
0,73
65
0,95705
6,3E+0
532
20
6,17E+0
514,1E+9
0,80
43
0,96362
2,1E+0
525
20
65
65,9
65,9
65
65,9
65,9
3,14E+0
620,08
20,13
20,10
1,00E‐0
345,76
1,81
60
2,03E+0
2
2031
2,31E+0
640,3E+9
0,74
62
0,95875
5,8E+0
531
20
5,47E+0
514,3E+9
0,81
41
0,96527
1,8E+0
524
20
65
65,7
65,7
65
65,7
65,7
2,86E+0
620,04
20,08
20,06
1,00E‐0
345,65
1,81
60
2,06E+0
2
2032
2,11E+0
641,0E+9
0,76
59
0,96035
5,3E+0
530
20
4,86E+0
514,4E+9
0,82
39
0,96677
1,6E+0
524
20
65
65,6
65,6
65
65,6
65,6
2,60E+0
620,00
20,04
20,02
1,00E‐0
345,57
1,81
60
2,08E+0
2
2033
1,94E+0
641,6E+9
0,77
56
0,96186
4,8E+0
529
20
4,31E+0
514,6E+9
0,83
37
0,96811
1,4E+0
524
20
65
65,5
65,5
65
65,5
65,5
2,37E+0
619,97
20,01
19,99
1,00E‐0
345,50
1,81
60
2,10E+0
2
East tank, L‐te
mplate
, 4 wells
West tan
k, M‐te
mplate
, 3 wells

36
WGCincreaseddowntime(15%)
2x14''
Calen
der yea
rqf
Gp
Gp/G
PR
Zqw
pwf
pwh
qf
Gp
Gp/G
PR
Zqw
pwf
pwh
psep
ptowhead
ptem
pDpCHoke
psep
ptowhead
ptem
pDpchoke
Calen
der yea
rCalen
der yea
rTotal p
roductio
nPtowheadL
PtowheadM
PtowheadAerro
r dPcomp
rp co
mp
dPcomp, fixerro
r
Sm3/day
Sm3
bara
Sm3/day
bara
bara
Sm3/day
Sm3
bara
Sm3/day
bara
bara
bara
bara
bara
bar
bara
bara
bara
bar
31st d
ecember
1st ja
nuary
Sm3/day
bara
bara
bara
bara^2
bara
bara
bara^2
2008
6,00E+0
6000,0E+0
0,00
240
0,95676
1,5E+6
220
173
4,00E+0
6000,0E+0
0,00
210
0,92636
1,3E+0
6178
146
65
73,2
73,4
99,8
65
73,2
73,3
72,7
2008
2009
1,00E+0
7‐
‐‐
‐‐
‐‐
‐
2009
6,00E+0
62,0E+9
0,04
231
0,95257
1,5E+6
210
165
4,00E+0
61,3E+9
0,08
194
0,92148
1,3E+0
6158
129
65
73,2
73,4
91,9
65
73,2
73,3
56,2
2009
2010
1,00E+0
7‐
‐‐
‐‐
‐‐
‐
2010
6,00E+0
63,9E+9
0,07
222
0,94835
1,5E+6
199
156
4,00E+0
62,6E+9
0,15
177
0,91818
1,3E+0
6137
111
65
73,2
73,4
83,0
65
73,2
73,3
37,8
2010
2011
1,00E+0
7‐
‐‐
‐‐
‐‐
‐
2011
6,00E+0
65,9E+9
0,11
212
0,94464
1,5E+6
189
147
4,00E+0
64,0E+9
0,23
161
0,91689
1,3E+0
6116
92
65
73,2
73,4
74,0
65
73,2
73,3
18,5
2011
2012
1,00E+0
7‐
‐‐
‐‐
‐‐
‐
2012
7,00E+0
68,2E+9
0,15
201
0,94107
1,8E+6
171
130
3,00E+0
65,0E+9
0,28
149
0,91719
1,0E+0
6116
95
65
73,2
73,4
56,7
65
73,2
73,3
21,3
2012
2013
1,00E+0
7‐
‐‐
‐‐
‐‐
‐
2013
7,00E+0
610,5E+9
0,19
190
0,93820
1,8E+6
158
119
3,00E+0
65,9E+9
0,34
137
0,91851
1,0E+0
6100
81
65
73,2
73,4
45,6
65
73,2
73,3
7,7
2013
2014
1,00E+0
7‐
‐‐
‐‐
‐‐
‐
2014
7,50E+0
613,0E+9
0,24
179
0,93593
1,9E+6
140
102
2,50E+0
66,8E+9
0,39
128
0,92035
8,3E+0
597
79
65
73,2
73,4
28,9
65
73,2
73,3
5,5
2014
2015
1,00E+0
7‐
‐‐
‐‐
‐‐
‐
2015
8,00E+0
615,6E+9
0,29
167
0,93438
2,0E+6
121
82
2,00E+0
67,4E+9
0,42
120
0,92229
6,7E+0
596
79
65
73,2
73,5
9,0
65
73,2
73,2
5,6
2015
2016
1,00E+0
7‐
‐‐
‐‐
‐‐
‐
2015,5
8,00E+0
616,9E+9
0,31
161
0,93393
2,0E+6
112
74
2,00E+0
67,8E+9
0,44
116
0,92338
6,7E+0
591
75
65
73,2
73,5
0,8
65
73,2
73,2
1,6
2015,5
2016,5
1,00E+0
7
2016
7,89E+0
618,0E+9
0,33
156
0,93372
2,0E+6
106
69
2,11E+0
68,1E+9
0,46
113
0,92463
7,0E+0
584
68
65
73,2
73,4
65
73,2
73,2
2016
2017
1,00E+0
768,51
68,47
68,49
1,00E‐0
34,74
1,07
2017
7,72E+0
620,4E+9
0,38
146
0,93379
1,9E+6
92
55
2,28E+0
68,8E+9
0,50
104
0,92761
7,6E+0
568
55
65
73,2
73,4
65
73,2
73,3
2017
2018
1,00E+0
754,57
54,52
54,54
1,00E‐0
318,69
1,34
2017,8
7,61E+0
622,3E+9
0,41
138
0,93432
1,9E+6
80
42
2,39E+0
69,4E+9
0,54
98
0,93043
8,0E+0
554
41
65
73,2
73,4
65
73,2
73,3
2017,8
2018,8
1,00E+0
741,18
41,14
41,16
1,00E‐0
332,07
1,78
2018
7,46E+0
622,7E+9
0,42
136
0,93450
1,9E+6
79
41
2,32E+0
69,5E+9
0,54
96
0,93111
7,7E+0
553
41
65
72,9
73,1
65
72,9
72,9
2018
2019
9,78E+0
640,87
40,91
40,89
1,00E‐0
332,00
1,78
32
5,20E‐1
2
2019
6,74E+0
624,8E+9
0,46
127
0,93566
1,7E+6
73
40
2,01E+0
610,1E+9
0,58
89
0,93449
6,7E+0
551
39
65
71,4
71,5
65
71,4
71,4
2019
2020
8,75E+0
639,36
39,41
39,38
1,00E‐0
332,00
1,81
32
3,92E‐2
1
2020
6,09E+0
626,7E+9
0,49
119
0,93712
1,5E+6
69
38
1,75E+0
610,7E+9
0,61
83
0,93772
5,8E+0
548
38
65
70,2
70,3
65
70,2
70,2
2020
2021
7,84E+0
638,20
38,15
38,17
1,00E‐0
332,00
1,84
32
1,91E‐2
0
2021
5,50E+0
628,4E+9
0,52
112
0,93878
1,4E+6
65
38
1,52E+0
611,2E+9
0,64
77
0,94072
5,1E+0
547
38
65
69,2
69,3
65
69,2
69,2
2021
2022
7,02E+0
637,57
37,62
37,60
1,00E‐0
331,58
1,84
32
1,77E‐0
1
2022
4,97E+0
629,9E+9
0,55
106
0,94053
1,2E+6
61
37
1,31E+0
611,6E+9
0,66
72
0,94347
4,4E+0
546
37
65
68,4
68,5
65
68,4
68,4
2022
2023
6,29E+0
637,14
37,18
37,16
1,00E‐0
331,21
1,84
32
6,18E‐0
1
2023
4,48E+0
631,3E+9
0,58
100
0,94233
1,1E+6
59
37
1,13E+0
611,9E+9
0,68
68
0,94596
3,8E+0
546
37
65
67,7
67,8
65
67,7
67,7
2023
2024
5,62E+0
637,18
37,22
37,20
1,00E‐0
330,50
1,82
32
2,24E+0
0
2024
4,05E+0
632,5E+9
0,60
94
0,94413
1,0E+0
657
37
9,77E+0
512,2E+9
0,70
65
0,94819
3,3E+0
545
37
65
67,2
67,2
65
67,2
67,2
2024
2025
5,03E+0
637,09
37,14
37,12
1,00E‐0
330,06
1,81
32
3,75E+0
0
2024,05
4,04E+0
632,6E+9
0,60
94
0,94416
1,0E+0
657
37
9,78E+0
512,2E+9
0,70
65
0,94821
3,3E+0
545
37
65
67,2
67,2
65
67,2
67,2
2024,05
2025,05
5,02E+0
637,13
37,09
37,11
1,00E‐0
330,06
1,81
32
3,76E+0
0
2025
3,96E+0
633,8E+9
0,62
89
0,94604
9,9E+0
549
30
1,04E+0
612,5E+9
0,72
61
0,95068
3,5E+0
537
30
65
67,2
67,2
65
67,2
67,2
2025
2026
5,00E+0
629,95
30,07
30,01
6,48E‐0
337,14
1,50
2025,6
3,92E+0
634,5E+9
0,64
86
0,94727
9,8E+0
544
25
1,08E+0
612,8E+9
0,73
58
0,95242
3,6E+0
531
24
65
67,2
67,2
65
67,2
67,2
2025
2026
5,00E+0
624,47
24,43
24,45
1,00E‐0
342,70
1,66
2026
3,89E+0
635,0E+9
0,65
84
0,94807
9,7E+0
541
21
1,10E+0
612,9E+9
0,74
57
0,95341
3,7E+0
527
21
65
67,1
67,2
65
67,1
67,1
2026
2027
4,99E+0
620,70
20,75
20,72
1,00E‐0
346,42
1,80
60
1,84E+0
2
2027
3,55E+0
636,1E+9
0,67
80
0,95005
8,9E+0
539
21
9,74E+0
513,2E+9
0,75
53
0,95589
3,2E+0
526
21
65
66,8
66,8
65
66,8
66,8
2027
2028
4,52E+0
620,58
20,63
20,61
9,99E‐0
446,16
1,80
60
1,92E+0
2
2028
3,24E+0
637,1E+9
0,68
75
0,95196
8,1E+0
537
21
8,62E+0
513,5E+9
0,77
50
0,95815
2,9E+0
526
21
65
66,5
66,5
65
66,5
66,5
2028
2029
4,11E+0
620,49
20,53
20,51
1,00E‐0
345,95
1,80
60
1,97E+0
2
2029
2,97E+0
638,0E+9
0,70
71
0,95379
7,4E+0
535
21
7,65E+0
513,7E+9
0,78
47
0,96021
2,5E+0
525
20
65
66,2
66,2
65
66,2
66,2
2029
2030
3,73E+0
620,41
20,46
20,44
1,00E‐0
345,77
1,80
60
2,02E+0
2
2030
2,72E+0
638,8E+9
0,72
68
0,95555
6,8E+0
534
20
6,80E+0
513,9E+9
0,79
45
0,96208
2,3E+0
525
20
65
66,0
66,0
65
66,0
66,0
2030
2031
3,40E+0
620,35
20,39
20,37
1,00E‐0
345,63
1,80
60
2,06E+0
2
2031
2,50E+0
639,6E+9
0,73
65
0,95722
6,2E+0
532
20
6,06E+0
514,1E+9
0,81
42
0,96378
2,0E+0
525
20
65
65,8
65,9
65
65,8
65,8
2031
2032
3,10E+0
620,30
20,34
20,32
1,00E‐0
345,52
1,80
60
2,10E+0
2
2032
2,29E+0
640,3E+9
0,74
62
0,95881
5,7E+0
531
20
5,40E+0
514,3E+9
0,81
40
0,96532
1,8E+0
525
20
65
65,7
65,7
65
65,7
65,7
2032
2033
2,83E+0
620,26
20,30
20,28
1,00E‐0
345,42
1,80
60
2,13E+0
2
2033
2,11E+0
641,0E+9
0,76
59
0,96032
5,3E+0
530
20
4,82E+0
514,4E+9
0,82
39
0,96672
1,6E+0
525
20
65
65,6
65,6
65
65,6
65,6
2033
2034
2,59E+0
620,22
20,26
20,24
1,00E‐0
345,34
1,80
60
2,15E+0
2
East tank, L‐te
mplate
, 4 wells
West tan
k, M‐te
mplate
, 3 wells

37
WGC+LP2018
2x14''
Calen
der yea
rqf
Gp
Gp/G
PR
Zqw
pwf
pwh
qf
Gp
Gp/G
PR
Zqw
pwf
pwh
psep
ptowhead
ptem
pDpCHoke
psep
ptowhead
ptem
pDpchoke
Total p
roductio
nPtowheadL
PtowheadM
PtowheadAerro
r dPcomp
rp co
mp
dPcomp, fixerro
r
Sm3/day
Sm3
bara
Sm3/day
bara
bara
Sm3/day
Sm3
bara
Sm3/day
bara
bara
bara
bara
bara
bar
bara
bara
bara
bar
Sm3/day
bara
bara
bara
bara^2
bara
bara
bara^2
2008
6,00E+0
6000,0E+0
0,00
240
0,95676
1,5E+6
220
173
4,00E+0
6000,0E+0
0,00
210
0,92636
1,3E+0
6178
146
65
73,2
73,4
99,8
65
73,2
73,3
72,7
1,00E+0
7‐
‐‐
‐‐
‐‐
‐
2009
6,00E+0
62,0E+9
0,04
231
0,95257
1,5E+6
210
165
4,00E+0
61,3E+9
0,08
194
0,92148
1,3E+0
6158
129
65
73,2
73,4
91,9
65
73,2
73,3
56,2
1,00E+0
7‐
‐‐
‐‐
‐‐
‐
2010
6,00E+0
63,9E+9
0,07
222
0,94835
1,5E+6
199
156
4,00E+0
62,6E+9
0,15
177
0,91818
1,3E+0
6137
111
65
73,2
73,4
83,0
65
73,2
73,3
37,8
1,00E+0
7‐
‐‐
‐‐
‐‐
‐
2011
6,00E+0
65,9E+9
0,11
212
0,94464
1,5E+6
189
147
4,00E+0
64,0E+9
0,23
161
0,91689
1,3E+0
6116
92
65
73,2
73,4
74,0
65
73,2
73,3
18,5
1,00E+0
7‐
‐‐
‐‐
‐‐
‐
2012
7,00E+0
68,2E+9
0,15
201
0,94107
1,8E+6
171
130
3,00E+0
65,0E+9
0,28
149
0,91719
1,0E+0
6116
95
65
73,2
73,4
56,7
65
73,2
73,3
21,3
1,00E+0
7‐
‐‐
‐‐
‐‐
‐
2013
7,00E+0
610,5E+9
0,19
190
0,93820
1,8E+6
158
119
3,00E+0
65,9E+9
0,34
137
0,91851
1,0E+0
6100
81
65
73,2
73,4
45,6
65
73,2
73,3
7,7
1,00E+0
7‐
‐‐
‐‐
‐‐
‐
2014
7,50E+0
613,0E+9
0,24
179
0,93593
1,9E+6
140
102
2,50E+0
66,8E+9
0,39
128
0,92035
8,3E+0
597
79
65
73,2
73,4
28,9
65
73,2
73,3
5,5
1,00E+0
7‐
‐‐
‐‐
‐‐
‐
2015
8,00E+0
615,6E+9
0,29
167
0,93438
2,0E+6
121
82
2,00E+0
67,4E+9
0,42
120
0,92229
6,7E+0
596
79
65
73,2
73,5
9,0
65
73,2
73,2
5,6
1,00E+0
7‐
‐‐
‐‐
‐‐
‐
2015,5
8,00E+0
616,9E+9
0,31
161
0,93393
2,0E+6
112
74
2,00E+0
67,8E+9
0,44
116
0,92338
6,7E+0
591
75
65
73,2
73,5
0,8
65
73,2
73,2
1,6
1,00E+0
7
2016
7,88E+0
618,2E+9
0,34
156
0,93371
2,0E+6
106
68
2,12E+0
68,1E+9
0,46
112
0,92480
7,1E+0
583
68
65
73,2
73,4
65
73,2
73,2
1,00E+0
767,71
67,67
67,69
9,99E‐0
45,54
1,08
2017
7,71E+0
620,7E+9
0,38
145
0,93385
1,9E+6
91
53
2,29E+0
68,9E+9
0,51
103
0,92804
7,6E+0
566
53
65
73,2
73,4
65
73,2
73,3
1,00E+0
752,66
52,62
52,64
1,00E‐0
320,59
1,39
2018
7,57E+0
623,2E+9
0,43
134
0,93472
1,9E+6
74
34
2,43E+0
69,7E+9
0,55
94
0,93203
8,1E+0
546
33
25
42,0
42,3
25
42,0
42,0
1,00E+0
733,12
33,08
33,10
1,00E‐0
38,89
1,27
32
5,34E+0
2
2018,1
7,55E+0
623,4E+9
0,43
133
0,93483
1,9E+6
73
32
2,45E+0
69,8E+9
0,56
93
0,93229
8,2E+0
544
31
25
42,0
42,3
25
42,0
42,0
1,00E+0
731,09
31,14
31,12
1,00E‐0
310,87
1,35
32
4,46E+0
2
2019
7,04E+0
625,5E+9
0,47
124
0,93616
1,8E+6
64
23
2,25E+0
610,4E+9
0,60
85
0,93622
7,5E+0
534
22
25
40,1
40,4
25
40,1
40,1
9,29E+0
622,12
22,17
22,14
1,00E‐0
317,94
1,81
32
1,98E+0
2
2020
6,34E+0
627,6E+9
0,51
115
0,93796
1,6E+6
58
21
1,95E+0
611,1E+9
0,63
78
0,94022
6,5E+0
531
21
25
37,5
37,8
25
37,5
37,5
8,29E+0
620,74
20,70
20,72
1,00E‐0
316,78
1,81
32
2,32E+0
2
2021
5,71E+0
629,4E+9
0,54
108
0,93997
1,4E+6
53
21
1,69E+0
611,6E+9
0,66
72
0,94398
5,6E+0
529
20
25
35,3
35,6
25
35,3
35,3
7,39E+0
620,20
20,16
20,18
1,00E‐0
315,14
1,75
32
2,84E+0
2
2022
5,14E+0
631,1E+9
0,57
100
0,94211
1,3E+6
49
20
1,46E+0
612,1E+9
0,69
66
0,94744
4,9E+0
528
20
25
33,5
33,7
25
33,5
33,5
6,61E+0
620,12
20,17
20,14
1,00E‐0
313,35
1,66
32
3,48E+0
2
2023
4,61E+0
632,6E+9
0,60
94
0,94427
1,2E+6
46
22
1,25E+0
612,5E+9
0,72
61
0,95056
4,2E+0
528
21
25
31,9
32,0
25
31,9
31,9
5,86E+0
621,52
21,48
21,50
1,00E‐0
310,37
1,48
32
4,68E+0
2
2024
4,19E+0
634,0E+9
0,63
88
0,94644
1,0E+0
643
21
1,10E+0
612,9E+9
0,74
57
0,95343
3,7E+0
527
21
25
30,7
30,9
25
30,7
30,7
5,29E+0
620,82
20,87
20,84
1,00E‐0
39,87
1,47
32
4,90E+0
2
2025
3,82E+0
635,3E+9
0,65
83
0,94858
9,5E+0
540
20
9,77E+0
513,2E+9
0,75
53
0,95607
3,3E+0
526
20
25
29,8
29,9
25
29,8
29,8
4,79E+0
619,98
20,02
20,00
1,00E‐0
39,77
1,49
32
4,94E+0
2
2026
3,45E+0
636,4E+9
0,67
78
0,95065
8,6E+0
538
21
8,50E+0
513,5E+9
0,77
50
0,95844
2,8E+0
526
20
25
28,9
29,0
25
28,9
28,9
4,30E+0
620,49
20,44
20,46
1,00E‐0
38,44
1,41
32
5,55E+0
2
2027
3,14E+0
637,4E+9
0,69
74
0,95265
7,9E+0
536
20
7,50E+0
513,7E+9
0,78
47
0,96059
2,5E+0
525
20
25
28,2
28,3
25
28,2
28,2
3,89E+0
620,37
20,32
20,35
1,00E‐0
37,89
1,39
32
5,81E+0
2
2028
2,84E+0
638,4E+9
0,71
70
0,95455
7,1E+0
535
21
6,50E+0
513,9E+9
0,80
44
0,96249
2,2E+0
526
21
25
27,6
27,7
25
27,6
27,6
3,49E+0
620,95
20,91
20,93
1,00E‐0
36,71
1,32
32
6,40E+0
2
2029
2,60E+0
639,2E+9
0,72
66
0,95637
6,5E+0
533
21
5,80E+0
514,1E+9
0,81
42
0,96423
1,9E+0
525
21
25
27,2
27,3
25
27,2
27,2
3,18E+0
620,57
20,61
20,59
1,00E‐0
36,62
1,32
32
6,44E+0
2
2030
2,39E+0
640,0E+9
0,74
63
0,95810
6,0E+0
531
20
5,25E+0
514,3E+9
0,82
40
0,96582
1,8E+0
524
20
25
26,9
26,9
25
26,9
26,9
2,92E+0
619,98
20,02
20,00
1,00E‐0
36,87
1,34
32
6,32E+0
2
2031
2,16E+0
640,7E+9
0,75
60
0,95972
5,4E+0
531
21
4,50E+0
514,5E+9
0,83
38
0,96721
1,5E+0
525
21
25
26,5
26,6
25
26,5
26,5
2,61E+0
620,80
20,75
20,78
1,00E‐0
35,73
1,28
32
6,90E+0
2
2032
1,98E+0
641,4E+9
0,76
57
0,96124
5,0E+0
530
21
4,00E+0
514,6E+9
0,83
36
0,96846
1,3E+0
525
21
25
26,3
26,3
25
26,3
26,3
2,38E+0
620,75
20,70
20,73
1,00E‐0
35,53
1,27
32
7,01E+0
2
2033
1,81E+0
641,9E+9
0,77
55
0,96267
4,5E+0
530
21
3,50E+0
514,7E+9
0,84
35
0,96957
1,2E+0
525
21
25
26,0
26,1
25
26,0
26,0
2,16E+0
620,87
20,91
20,89
1,00E‐0
35,15
1,25
32
7,21E+0
2
East tank, L‐te
mplate
, 4 wells
West tan
k, M‐te
mplate
, 3 wells

38
Appendix C: Compressor mapping WGC 2016
2017
2018

39
2019
2020
2021

40
2022
2023
2024

41
2025
2026
2027

42
2028
2029

43
Appendix D: Total production of gas and condensate
L‐Template M‐Template L‐Template M‐Template L‐Template M‐Template L‐Template M‐Template
2013 7,00E+06 3,00E+06 3,29E+09 5,89E+02 1,02E+02 2,27E+05 7,00E+06 3,00E+06 3,29E+09 5,89E+02 1,02E+02 2,27E+05
2014 7,50E+06 2,50E+06 3,29E+09 5,58E+02 7,17E+01 2,07E+05 7,50E+06 2,50E+06 3,29E+09 5,58E+02 7,17E+01 2,07E+05
2015 8,00E+06 2,00E+06 3,28E+09 5,23E+02 5,01E+01 1,88E+05 8,00E+06 2,00E+06 3,28E+09 5,23E+02 5,01E+01 1,88E+05
2016 7,60E+06 1,91E+06 3,12E+09 4,36E+02 4,74E+01 1,59E+05 7,88E+06 2,12E+06 3,28E+09 4,52E+02 4,72E+01 1,64E+05
2017 6,74E+06 1,62E+06 2,74E+09 3,44E+02 4,69E+01 1,28E+05 7,71E+06 2,29E+06 3,28E+09 3,89E+02 4,55E+01 1,42E+05
2018 5,98E+06 1,37E+06 2,41E+09 2,75E+02 4,57E+01 1,05E+05 7,33E+06 2,26E+06 3,15E+09 3,28E+02 3,99E+01 1,21E+05
2019 5,31E+06 1,16E+06 2,12E+09 2,24E+02 4,19E+01 8,72E+04 6,58E+06 1,95E+06 2,80E+09 2,64E+02 3,12E+01 9,69E+04
2020 4,71E+06 9,79E+05 1,87E+09 1,84E+02 3,46E+01 7,19E+04 5,91E+06 1,68E+06 2,49E+09 2,16E+02 2,49E+01 7,92E+04
2021 4,18E+06 8,22E+05 1,64E+09 1,53E+02 2,90E+01 5,97E+04 5,31E+06 1,45E+06 2,22E+09 1,80E+02 2,02E+01 6,57E+04
2022 3,70E+06 6,86E+05 1,44E+09 1,28E+02 2,45E+01 5,01E+04 4,76E+06 1,24E+06 1,97E+09 1,51E+02 1,67E+01 5,51E+04
2023 3,27E+06 5,70E+05 1,26E+09 1,08E+02 2,08E+01 4,24E+04 4,27E+06 1,05E+06 1,75E+09 1,28E+02 1,38E+01 4,66E+04
2024 2,89E+06 4,70E+05 1,10E+09 9,19E+01 1,79E+01 3,61E+04 3,99E+06 1,01E+06 1,64E+09 1,15E+02 1,29E+01 4,18E+04
2025 2,54E+06 3,84E+05 9,61E+08 7,80E+01 1,55E+01 3,07E+04 3,92E+06 1,08E+06 1,64E+09 1,08E+02 1,35E+01 4,00E+04
2026 2,23E+06 3,12E+05 8,35E+08 6,65E+01 1,35E+01 2,63E+04 3,67E+06 1,02E+06 1,54E+09 9,76E+01 1,26E+01 3,62E+04
2027 1,95E+06 2,50E+05 7,24E+08 5,70E+01 1,18E+01 2,26E+04 3,34E+06 8,97E+05 1,39E+09 8,62E+01 1,11E+01 3,19E+04
2028 1,70E+06 1,99E+05 6,25E+08 4,89E+01 1,05E+01 1,95E+04 3,04E+06 7,90E+05 1,26E+09 7,72E+01 9,74E+00 2,85E+04
2029 1,48E+06 1,56E+05 5,37E+08 4,18E+01 9,36E+00 1,68E+04 2,77E+06 6,98E+05 1,14E+09 6,95E+01 8,59E+00 2,56E+04
WGCReference caseTotal
[Sm3/year]
Gas [Sm3/d] Total
[Sm3/year]
Gas [Sm3/d]Condensate [Sm3/d] Total
[Sm3/year]
Total
[Sm3/year]
Condensate [Sm3/d]
L‐Template M‐Template L‐Template M‐Template L‐Template M‐Template L‐Template M‐Template
2013 7,00E+06 3,00E+06 3,10E+09 5,89E+02 1,02E+02 2,14E+05 7,00E+06 3,00E+06 3,29E+09 5,89E+02 1,02E+02 2,27E+05
2014 7,50E+06 2,50E+06 3,10E+09 5,58E+02 7,17E+01 1,95E+05 7,50E+06 2,50E+06 3,29E+09 5,58E+02 7,17E+01 2,07E+05
2015 8,00E+06 2,00E+06 3,09E+09 5,23E+02 5,01E+01 1,77E+05 8,00E+06 2,00E+06 3,28E+09 5,23E+02 5,01E+01 1,88E+05
2016 7,89E+06 2,11E+06 3,09E+09 4,54E+02 4,71E+01 1,55E+05 7,88E+06 2,12E+06 3,28E+09 4,52E+02 4,72E+01 1,64E+05
2017 7,72E+06 2,28E+06 3,09E+09 3,93E+02 4,57E+01 1,36E+05 7,71E+06 2,29E+06 3,28E+09 3,89E+02 4,55E+01 1,42E+05
2018 7,46E+06 2,32E+06 3,03E+09 3,39E+02 4,15E+01 1,18E+05 7,57E+06 2,43E+06 3,28E+09 3,38E+02 4,27E+01 1,25E+05
2019 6,74E+06 2,01E+06 2,71E+09 2,76E+02 3,28E+01 9,54E+04 7,04E+06 2,25E+06 3,05E+09 2,81E+02 3,56E+01 1,04E+05
2020 6,09E+06 1,75E+06 2,43E+09 2,28E+02 2,64E+01 7,85E+04 6,34E+06 1,95E+06 2,72E+09 2,29E+02 2,82E+01 8,44E+04
2021 5,50E+06 1,52E+06 2,17E+09 1,90E+02 2,15E+01 6,55E+04 5,71E+06 1,69E+06 2,43E+09 1,90E+02 2,30E+01 7,00E+04
2022 4,97E+06 1,31E+06 1,95E+09 1,62E+02 1,79E+01 5,55E+04 5,14E+06 1,46E+06 2,17E+09 1,59E+02 1,92E+01 5,86E+04
2023 4,48E+06 1,13E+06 1,74E+09 1,37E+02 1,50E+01 4,71E+04 4,61E+06 1,25E+06 1,93E+09 1,35E+02 1,59E+01 4,95E+04
2024 4,05E+06 9,77E+05 1,56E+09 1,18E+02 1,26E+01 4,05E+04 4,19E+06 1,10E+06 1,74E+09 1,18E+02 1,37E+01 4,31E+04
2025 3,96E+06 1,04E+06 1,55E+09 1,12E+02 1,32E+01 3,86E+04 3,82E+06 9,77E+05 1,57E+09 1,03E+02 1,21E+01 3,78E+04
2026 3,89E+06 1,10E+06 1,54E+09 1,06E+02 1,37E+01 3,69E+04 3,45E+06 8,50E+05 1,41E+09 9,01E+01 1,05E+01 3,30E+04
2027 3,55E+06 9,74E+05 1,40E+09 9,33E+01 1,20E+01 3,26E+04 3,14E+06 7,50E+05 1,28E+09 8,03E+01 9,24E+00 2,94E+04
2028 3,24E+06 8,62E+05 1,27E+09 8,33E+01 1,06E+01 2,91E+04 2,84E+06 6,50E+05 1,15E+09 7,18E+01 7,99E+00 2,62E+04
2029 2,97E+06 7,65E+05 1,16E+09 7,53E+01 9,42E+00 2,62E+04 2,60E+06 5,80E+05 1,05E+09 6,49E+01 7,12E+00 2,36E+04
Condensate [Sm3/d]Total
[Sm3/year]
Gas [Sm3/d]
WGC 15% downtime WGC + LP2018Total
[Sm3/year]
Total
[Sm3/year]
Gas [Sm3/d] Condensate [Sm3/d] Total
[Sm3/year]

44
Appendix E: Economical calculations WGCbasecase
WGCincreaseddowntime
WGCLP2018
2013 ‐600 ‐2,7 ‐602,7 ‐602,7 ‐602,7
2014 ‐1200 ‐2,9 ‐1202,9 ‐1113,8 ‐1716,5
2015 ‐1200 ‐31,0 ‐500,0 ‐531,0 ‐531,0 148,7 265,5 ‐816,8 ‐700,3 ‐2416,8
2016 1,63E+08 3,18E+04 375,4 21,0 ‐35,1 ‐500,0 ‐36,6 ‐175,3 ‐175,3 49,1 87,7 498,0 395,3 ‐2021,4
2017 5,41E+08 8,96E+04 1243,4 59,1 ‐37,5 ‐500,0 765,1 ‐75,0 840,1 ‐214,2 ‐420,0 630,8 463,7 ‐1557,7
2018 7,34E+08 9,61E+04 1689,2 63,4 ‐52,1 ‐500,0 1200,5 ‐75,0 1275,5 ‐336,1 ‐637,8 726,6 494,5 ‐1063,2
2019 6,75E+08 6,15E+04 1553,3 40,6 ‐33,7 ‐500,0 1060,3 ‐75,0 1135,3 ‐296,9 ‐567,6 695,8 438,4 ‐624,8
2020 6,27E+08 4,63E+04 1442,0 30,6 ‐31,4 ‐500,0 941,2 ‐75,0 1016,2 ‐263,5 ‐508,1 669,6 390,7 ‐234,1
2021 5,80E+08 3,82E+04 1333,5 25,2 ‐45,9 1312,7 1312,7 ‐367,6 ‐656,4 288,8 156,0 ‐78,1
2022 5,30E+08 3,14E+04 1219,6 20,7 ‐30,7 1209,7 1209,7 ‐338,7 ‐604,8 266,1 133,1 55,1
2023 4,88E+08 2,59E+04 1121,7 17,1 ‐30,2 1108,6 1108,6 ‐310,4 ‐554,3 243,9 113,0 168,0
2024 5,40E+08 3,63E+04 1242,1 24,0 ‐41,8 1224,3 1224,3 ‐342,8 ‐612,1 269,3 115,5 283,5
2025 6,81E+08 5,83E+04 1567,4 38,5 ‐26,8 1579,1 1579,1 ‐442,2 ‐789,6 347,4 138,0 421,5
2026 7,05E+08 6,24E+04 1622,2 41,2 ‐26,7 1636,7 1636,7 ‐458,3 ‐818,4 360,1 132,4 553,9
2027 6,66E+08 5,87E+04 1532,7 38,8 ‐41,2 1530,3 1530,3 ‐428,5 ‐765,1 336,7 114,6 668,5
2028 6,32E+08 5,70E+04 1453,4 37,6 ‐26,4 1464,6 1464,6 ‐410,1 ‐732,3 322,2 101,6 770,1
2029 6,01E+08 5,55E+04 1381,9 36,7 ‐26,6 1391,9 1391,9 ‐389,7 ‐696,0 306,2 89,4 859,5
Losses Carried
Forward NPV
Calendar
Year CAPEX
Increment. Gas
Prod. [Sm3]
Increment.
Condensate
Prod. [bbl] Cash Flow PV of CF
Ordinary
Tax Base Uplift
Special Tax
Base
Ordinary
Tax 28%
Special
Tax 50%
Sales
Income Gas
Sales
Income
Condensate OPEX Depreciation
2013 ‐600 ‐2,7 ‐602,7 ‐602,7 ‐602,7
2014 ‐1200 ‐2,9 ‐1202,9 ‐1113,8 ‐1716,5
2015 ‐1200 ‐31,0 ‐500,0 ‐531,0 ‐531,0 148,7 265,5 ‐816,8 ‐700,3 ‐2416,8
2016 ‐2,68E+07 ‐2,41E+04 ‐61,7 ‐15,9 ‐35,1 ‐500,0 ‐612,7 ‐612,7 171,6 306,3 365,2 289,9 ‐2126,8
2017 3,51E+08 4,77E+04 806,4 31,5 ‐37,5 ‐500,0 ‐114,2 186,2 ‐75,0 261,2 ‐52,1 ‐130,6 617,6 454,0 ‐1672,9
2018 6,12E+08 7,76E+04 1408,7 51,2 ‐52,1 ‐500,0 907,8 ‐75,0 982,8 ‐254,2 ‐491,4 662,2 450,7 ‐1222,2
2019 5,83E+08 5,20E+04 1341,0 34,3 ‐33,7 ‐500,0 841,6 ‐75,0 916,6 ‐235,7 ‐458,3 647,7 408,1 ‐814,0
2020 5,59E+08 4,20E+04 1284,6 27,7 ‐31,4 ‐500,0 780,9 ‐75,0 855,9 ‐218,7 ‐428,0 634,3 370,1 ‐443,9
2021 5,30E+08 3,66E+04 1219,4 24,2 ‐45,9 1197,6 1197,6 ‐335,3 ‐598,8 263,5 142,3 ‐301,6
2022 5,06E+08 3,40E+04 1163,4 22,4 ‐30,7 1155,1 1155,1 ‐323,4 ‐577,6 254,1 127,1 ‐174,5
2023 4,77E+08 2,92E+04 1096,0 19,3 ‐30,2 1085,0 1085,0 ‐303,8 ‐542,5 238,7 110,6 ‐63,9
2024 4,55E+08 2,81E+04 1045,4 18,6 ‐41,8 1022,2 1022,2 ‐286,2 ‐511,1 224,9 96,4 32,6
2025 5,86E+08 4,96E+04 1348,7 32,7 ‐26,8 1354,7 1354,7 ‐379,3 ‐677,3 298,0 118,4 150,9
2026 7,09E+08 6,71E+04 1630,9 44,3 ‐26,7 1648,5 1648,5 ‐461,6 ‐824,3 362,7 133,4 284,3
2027 6,76E+08 6,26E+04 1554,5 41,3 ‐41,2 1554,7 1554,7 ‐435,3 ‐777,3 342,0 116,4 400,7
2028 6,46E+08 6,02E+04 1485,4 39,7 ‐26,4 1498,7 1498,7 ‐419,6 ‐749,4 329,7 103,9 504,7
2029 6,18E+08 5,91E+04 1421,9 39,0 ‐26,6 1434,2 1434,2 ‐401,6 ‐717,1 315,5 92,1 596,8
PV of CF NPV
Ordinary
Tax Base Uplift
Special Tax
Base
Ordinary
Tax 28%
Special
Tax 50% Cash Flow
Sales
Income Gas
Sales
Income
Condensate OPEX Depreciation
Losses Carried
Forward
Calendar
Year CAPEX
Increment. Gas
Prod. [Sm3]
Increment.
Condensate
Prod. [bbl]
2013 ‐600 ‐2,7 ‐602,7 ‐602,7 ‐602,7
2014 ‐1200 ‐2,9 ‐1202,9 ‐1113,8 ‐1716,5
2015 ‐1200 ‐31,0 ‐500,0 ‐531,0 ‐531,0 148,7 265,5 ‐816,8 ‐700,3 ‐2416,8
2016 1,63E+08 3,18E+04 375,4 21,0 ‐35,1 ‐500,0 ‐36,6 ‐175,3 ‐175,3 49,1 87,7 498,0 395,3 ‐2021,4
2017 5,41E+08 8,96E+04 1243,4 59,1 ‐37,5 ‐666,7 598,4 ‐75,0 673,4 ‐167,5 ‐336,7 760,8 559,2 ‐1462,2
2018 ‐1000 8,71E+08 1,23E+05 2003,0 81,5 ‐52,1 ‐666,7 1365,7 ‐75,0 1440,7 ‐382,4 ‐720,4 ‐70,4 ‐47,9 ‐1510,1
2019 9,27E+08 1,04E+05 2131,3 68,9 ‐33,7 ‐666,7 1500,0 ‐112,5 1612,5 ‐420,0 ‐806,2 940,4 592,6 ‐917,5
2020 8,54E+08 7,91E+04 1964,2 52,2 ‐31,4 ‐666,7 1318,3 ‐112,5 1430,8 ‐369,1 ‐715,4 900,5 525,4 ‐392,1
2021 7,88E+08 6,47E+04 1812,6 42,7 ‐45,9 ‐166,7 1642,7 ‐37,5 1680,2 ‐460,0 ‐840,1 509,3 275,2 ‐116,9
2022 7,30E+08 5,38E+04 1678,9 35,5 ‐30,7 ‐166,7 1517,1 ‐37,5 1554,6 ‐424,8 ‐777,3 481,7 241,0 124,1
2023 6,64E+08 4,45E+04 1527,9 29,3 ‐30,2 1527,0 1527,0 ‐427,6 ‐763,5 335,9 155,6 279,7
2024 6,35E+08 4,41E+04 1460,2 29,1 ‐41,8 1447,4 1447,4 ‐405,3 ‐723,7 318,4 136,6 416,2
2025 6,13E+08 4,44E+04 1410,9 29,3 ‐26,8 1413,5 1413,5 ‐395,8 ‐706,7 311,0 123,5 539,7
2026 5,78E+08 4,25E+04 1328,3 28,0 ‐26,7 1329,7 1329,7 ‐372,3 ‐664,8 292,5 107,6 647,3
2027 5,54E+08 4,27E+04 1274,6 28,2 ‐41,2 1261,7 1261,7 ‐353,3 ‐630,8 277,6 94,5 741,8
2028 5,22E+08 4,20E+04 1201,2 27,7 ‐26,4 1202,6 1202,6 ‐336,7 ‐601,3 264,6 83,4 825,2
2029 5,08E+08 4,30E+04 1168,3 28,4 ‐26,6 1170,0 1170,0 ‐327,6 ‐585,0 257,4 75,1 900,3
Calendar
Year CAPEX
Increment. Gas
Prod. [Sm3]
Increment.
Condensate
Prod. [bbl]
Sales
Income Gas
Sales
Income
Condensate DepreciationOPEX
Losses Carried
Forward Cash Flow PV of CF NPV
Ordinary
Tax Base Uplift
Special Tax
Base
Ordinary
Tax 28%
Special
Tax 50%