Embed Size (px)
Citation preview

Cuckoo search algorithm and wind driven optimization based study ofsatellite image segmentation for multilevel thresholding using Kapur’sentropy
Ashish Kumar Bhandari a, Vineet Kumar Singh a, Anil Kumar a,⇑, Girish Kumar Singh b,1
a Indian Institute of Information Technology Design and Manufacturing, Jabalpur 482011, Madhya Pradesh, IndiabDepartment of Electrical Engineering, Indian Institute Technology Roorkee, Uttrakhand 247667, India
a r t i c l e i n f o
Keywords:Image segmentationMultilevel thresholdingKapur’s entropyCuckoo search algorithmWind driven optimizationParticle swarm optimizationSwarm intelligence
a b s t r a c t
The objective of image segmentation is to extract meaningful objects. A meaningful segmentation selectsthe proper threshold values to optimize a criterion using entropy. The conventional multilevel threshold-ing methods are efficient for bi-level thresholding. However, they are computationally expensive whenextended to multilevel thresholding since they exhaustively search the optimal thresholds to optimizethe objective functions. To overcome this problem, two successful swarm-intelligence-based global opti-mization algorithms, cuckoo search (CS) algorithm and wind driven optimization (WDO) for multilevelthresholding using Kapur’s entropy has been employed. For this purpose, best solution as fitness functionis achieved through CS and WDO algorithm using Kapur’s entropy for optimal multilevel thresholding. Anew approach of CS andWDO algorithm is used for selection of optimal threshold value. This algorithm isused to obtain the best solution or best fitness value from the initial random threshold values, and toevaluate the quality of a solution, correlation function is used. Experimental results have been examinedon standard set of satellite images using various numbers of thresholds. The results based on Kapur’sentropy reveal that CS, ELR-CS and WDO method can be accurately and efficiently used in multilevelthresholding problem.
� 2013 Elsevier Ltd. All rights reserved.
1. Introduction
Image segmentation is a critical and challenging task using mul-tilevel thresholding technique. Now a day’s multilevel thresholdingis a powerful and famous tool, and it is extensively used in the fieldof image processing. Basically, it is a technique of partitioning theoriginal image into some distinct classes for meaningful informa-tion. Segmentation is having major importance and elementaryplace in image processing for interpretation of any image. Segmen-tation is in fact the method of subdividing an image into its constit-uent regions or objects, based on shape, size, color, position ortexture of image regions.
There are various methods for image segmentation. Over theyears numerous schemes for image segmentation have beenexploited and anticipated in the literature. It was found that thethresholding technique is the most popular technique out of all
the existing approaches used for segmentation of various typesof images (Akay, 2013)
Motivation behind the extensive use of thresholding techniqueis due to its easy implementation and computationally efficientperformance. Basically, thresholding is used to identify and extracta target from its background on the basis of distribution of graylevels or texture in image objects (Liao, Chen, & Chung, 2001).Understanding or analysis of any image requires the image to beaccurately segmented into significant regions. Therefore, multi-level thresholding plays a very important role. It is well known thatthe image segmentation deals with subdividing the image into ob-jects of meaningful information, which is useful in various applica-tions such as satellite image processing, medical imaging, patternrecognition, biomedical imaging, and remote sensing, etc.
If the images are segmented into two regions, such as the back-ground and object of interest or foreground, it is known as bi-levelthresholding. To achieve more than two classes, it is extended intomultilevel thresholding. Bi-level or multilevel thresholding is asimple and effective technique. However, it requires an optimumthreshold value to classify foreground from their background be-cause each objects have their own distinct gray-level distributions(Huang & Wang, 2009). The foremost objective of using bi-levelthresholding or multilevel thresholding for image segmentation
0957-4174/$ - see front matter � 2013 Elsevier Ltd. All rights reserved.http://dx.doi.org/10.1016/j.eswa.2013.10.059
⇑ Corresponding author. Tel.: +91 9425805412.E-mail addresses: [email protected] (A.K. Bhandari), [email protected]
(V.K. Singh), [email protected] (A. Kumar), [email protected] (G.K. Singh).1 Department of Electrical Engineering, University of Malaya, 50603 Kuala Lumpur,
Malaysia.
Expert Systems with Applications 41 (2014) 3538–3560
Contents lists available at ScienceDirect
Expert Systems with Applications
journal homepage: www.elsevier .com/locate /eswa

is to determine a best threshold value. In which, bi-level threshold-ing selects only one threshold to separate the pixel values into twodistinct classes where multilevel thresholding used to performmultiple thresholds through which pixels can be divided into sev-eral groups (Horng, 2011). Over the years there are several imagethresholding examines in the literature. In favor of multilevelthresholding techniques, various studies have been reported inthe literature for segmentation of images to classify the significantpatterns of interest (Ghamisi, Couceiro, Benediktsson, & Ferreira,2012; Ghamisi, Couceiro, Martins, & Benediktsson, 2013; Ham-mouche, Diaf, & Siarry, 2010; Melo-Pinto et al., 2013; Penga, Zhang,& Zhang, 2013). Many techniques for multilevel thresholding havebeen developed over the years to recognize the patterns (Dirami,Hammouchea, Diaf, & Siarry, 2013; Manikandan, Ramar, Iruthay-arajan, & Srinivasagan, 2014; Xue & Titterington, 2011).
The reason behind using global thresholding is that backgroundand object of interest areas in an image can be interpreted by tak-ing its histogramwith probabilities for each gray level. However, incase of remote sensing images or real life images, bi-level thres-holding does not give appropriate performance. As a result, thereis strong requirement of multilevel thresholding, which splits his-togram of the image into the number of classes of homogenousgray levels such that some criterion is optimized (Agrawal, Panda,Bhuyan, & Panigrahi, 2013). Hence, various criteria in literaturehave been presented to achieve multi-level thresholding.
Over the years, many thresholding techniques have been devel-oped. Otsu (1979) and Liao, Chung, and Chen (2001) technique isused to maximize the sum of between-class variances to get seg-mented regions in an image. Tsai (1985) has used the moment-pre-serving principle to select thresholds of input gray-level imagecalled Tsallis entropy technique widely used for image threshold-ing operation. Kittler and Illingworth (1986) assume that the graylevels of each object in an image are normally distributed. Theabove nonparametric approaches are simple and effective in bi-level thresholding.
Kapur, Sahoo, and Wong (1985) proposed a method for gray-level picture thresholding using entropy of the histogram. Since,Kapur’s criterian is used to maximize the entropy of each distinctiveclass or the sum of entropies based on information theory. Thethreshold values are determined in such a way that the gray-levelmoments of an input image are preserved in the output image.Amongst all the remarkable image thresholding methods, entro-py-based approaches have drawn the attentions of many research-ers. Superior performance of Kapur’s method was recognized bythe researchers (Akay, 2013; Hammouche et al., 2010) as comparedto other thresholding techniques.
Kapur’s entropy measures always lead to positive probabilitiesand a global maximum for the entropy. The researcher Sezginand Sankur (2004) have reported that the results using Kapur’s en-tropy gives improved performance, and it produces better averagescores than the other entropy-based calculations on nondestruc-tive sample images. Therefore, in this paper, Kapur’s entropy is se-lected as the entropy computation due to its achievability andbetter performance for segmentation purpose. Now a day’s evolu-tionary computational algorithms are most extensively used due tooptimum solution properties for finding the best threshold values,and it has drawn the attention of researchers because of computa-tional inefficiency of the conventional comprehensive techniques(Akay, 2013).
Over the years, in the literature, numerous works on the topichas been presented based on swarm algorithms, including geneticalgorithm (GA) (Hammouche, Diaf, & Siarry, 2008; Tao, Tian, & Liu,2003; Yin, 1999), PSO (Akay, 2013; Maitra & Chatterjee, 2008; Yin,2007), artificial bee colony (ABC) (Akay, 2013; Cuevas, Sencion,Zaldivar, Perez-Cisneros, & Sossa, 2012; Horng, 2011; Horng &Jiang, 2010; Zhang & Wu, 2011), ant colony optimization (ACO)
(Tao, Jin, & Liu, 2007; Ye et al., 2005), bacterial foraging (BF) (Sat-hya & Kayalvizhi, 2010; Sathya & Kayalvizhi, 2011; Sathya & Kay-alvizhi, 2011; Sathya & Kayalvizhi, 2011), and honey bee matingoptimization (HBMO) (Horng, 2010). Yin (1999) has presented anefficient and fast scheme using genetic algorithm to obtain optimalthreshold values for multilevel thresholding. After that Yin (2007)has proposed a PSO based multilevel minimum cross entropythreshold selection method to achieve near-optimal thresholds.The researchers Zhang andWu (2011) used ABC algorithm for opti-mizing the Tsallis entropy. Thereafter, Akay (2013) proposed astudy for multilevel thresholding using PSO and ABC algorithmfor optimizing the Kapur’s entropy. PSO was formulated by Ken-nedy and Eberhart (1995) and Eberhart and Shi (2001), which isa swarm-based stochastic optimization technique that is basedon the social behavior of bird flocking or fish schooling. These tech-niques successfully give optimum performance using distinct ver-sions of the basic algorithms and different objective functions, suchas maximum entropy, Tsallis entropy, between-class variance andKapur’s entropy. In 2009, Yang and Deb (2009) and Yang and Deb(2010) formulated a new metaheuristic algorithm, called cuckoosearch algorithm which is based on the interesting breedingbehavior such as brood parasitism of certain species of Cuckoos,and the preliminary studies show that it is very promising andcould outperform the existing algorithms such as GA, PSO, ABC,ACO, BF and HBMO (Cuevas et al., 2012; Eberhart and Shi, 2001;Hammouche et al., 2008; Horng, 2010; Horng & Jiang, 2010; Ken-nedy and Eberhart, 1995; Maitra & Chatterjee, 2008; Sathya & Kay-alvizhi, 2010; Sathya & Kayalvizhi, 2011; Tao et al., 2007; Ye et al.,2005; Yin, 2007; Zhang & Wu, 2011; Sathya & Kayalvizhi, 2011;Sathya & Kayalvizhi, 2011).
Metaheuristic algorithms are very popular and well-known glo-bal optimization schemes. These techniques attempt to reproducesocial behavior or natural phenomena. In order to solve differentoptimization problems, numerous novel metaheuristic algorithmsare proposed which is useful in various applications. Such algo-rithms can increase the computational efficiency, solve largerproblems, and implement robust optimization codes. Recently,Gandomi et al. have proposed a metaheuristic approach to solvestructural optimization problems using cuckoo search algorithmin combination with Lévy flights (Gandomi, Yang, & Alavi,2013a). In addition to solve unconstrained and constrained globaloptimization, a new coupled eagle strategy in combination withthe efficient differential evolution has been introduced (Gandomi,Yang, Talatahari, & Deb, 2012). Furthermore, to increase the globalsearch mobility in case of robust global optimization, a novel tech-nique named Firefly algorithm in combination with chaos has beendeveloped (Gandomi, Yang, Talatahari, & Alavi, 2013b). The aim ofdeveloping modern metaheuristic algorithms is to expand the car-rying out global search ability in terms of three major reasons:solving problems faster, solving large problems, and obtaining ro-bust algorithms (Gandomi et al., 2012, 2013a,b; Panda, Agrawal,& Bhuyan, 2013).
The working nature of CS algorithm is inspired by the life ofcuckoo bird in combination with Lévy flight behavior of some birdsand fruits flies. On the other hand, ABC algorithm may also be con-sidered as a typical swarm-based approach for optimization, inwhich the search algorithm is inspired by the foraging behaviorof bee colonies (Cuevas, Sención-Echauri, Zaldivar, & Pérez, 2013;Horng, 2013; Kumar, Kumar, Sharma, & Pant, 2013). The studiesshow that the CS algorithm is remarkably promising and could out-perform the other known algorithms, such as WDO. In this paper,CS algorithm is used for finding a global optimal solution using Ka-pur’s entropy. Aim of this paper is to examine the search abilities ofCS, ELR-CS and WDO algorithms for segmentation using multi-le-vel thresholding. In addition, study of the fitness functions aregained for better comprehensive comparative investigation of both
A.K. Bhandari et al. / Expert Systems with Applications 41 (2014) 3538–3560 3539
the process. Evolutionary technique based multilevel thresholdingis examined as a constrained optimization problem.
Satellite images are used in many applications such as geo-graphical information system, astronomy and geoscience studies.Image segmentation is a decisive and fundamental step for remotesensing information retrieval and classification. Satellite imagesegmentation is typically used to locate objects and boundaries(lines, curves, etc.) in images. So, extracting the target informationfrom the high resolution remote sensing images has become achallenging problem (Bhandari, Kumar, & Padhy, 2011; Kumar,Bhandari, & Padhy, 2012; Soni, Bhandari, Kumar, & Singh, 2013).Therefore, to solve such problem, in this paper, CS algorithm,ELR-CS, and WDO based satellite image segmentation for multi-level thresholding using Kapur’s entropy is examined. The pre-sented scheme is used for maximizing the Kapur’s entropy.Experimental image thresholding results are obtained for a qualita-tive analysis. Quantitative results defined by peak signal-to-noiseratio (PSNR), structural similarity index (SSIM) and feature similar-ity index (FSIM). The performance improvement of CS and ELR-CSalgorithm based segmentation approach is measured in terms ofPSNR, SSIM and FSIM, in comparison with WDO techniques.
The rest of the paper is organized as follows: Section 2 presentsthe problem formulation of thresholding operation and concepts ofKapur’s entropy. Section 3 gives brief explanations of the algo-rithms such as WDO and the concepts of CS algorithm. In Section 4,a brief overview of swarm intelligence, CS and WDO is discussed.Section 5 reports the visual, qualitative and quantitative resultsof the employed method supported by PSNR, SSIM and FSIM, andalso provides some discussions. Finally, conclusions are drawn inSection 6.
2. Problem assessment of optimum multilevel thresholding
For multilevel thresholding, Kapur’s entropy (Akay, 2013) isfound to be one of the best threshold selection processes for gen-eral real world images with regard to uniformity and shape mea-sures. However, inefficient formulation of between-class varianceyields the process computationally insignificant.
Global thresholding using an appropriate threshold function T isdefined in (1). If g(x,y) is a thresholded version of f(x,y) at someglobal threshold T,
gðx; yÞ ¼ 1 if f ðx; yÞ > T
0 if f ðx; yÞ 6 T
� �ð1Þ
Variable thresholding can be obtained if T can change over theimage. Local or regional thresholding can be measured if T dependson a neighborhood of (x,y). However, adaptive thresholding can beobtained if T is a function of (x,y).
2.1. Bi-level thresholding
Assume that an image can be represented by L gray levels, bi-le-vel thresholding as defined in (2). Kapur has developed the algo-rithm for bi-level thresholding and this bi-level thresholding canbe described as follows:
M0 ¼ fgðx; yÞ 2 Ij0 6 gðx; yÞ 6 t � 1gM1 ¼ fgðx; yÞ 2 Ijt 6 gðx; yÞ 6 L� 1g ð2Þ
2.2. Multilevel thresholding
Thresholding generates binary images from grey-level ones byturning all pixels below some threshold to zero and all pixels aboutthat threshold to one. Multilevel thresholding uses more than one
threshold value and creates an output image with multiple groups(3):
M0 ¼ fgðx; yÞ 2 Ij0 6 gðx; yÞ 6 t1 � 1gM1 ¼ fgðx; yÞ 2 Ijt1 6 gðx; yÞ 6 t2 � 1gMi ¼ fgðx; yÞ 2 Ijti 6 gðx; yÞ 6 tiþ1 � 1gMm ¼ fgðx; yÞ 2 Ijtm 6 gðx; yÞ 6 L� 1g
ð3Þ
where, ti (i = 1, . . . ,m) is the ith threshold value, and the m is thenumber of thresholds.
On the basis of problem formulation, it is examined that the bi-level thresholding is straightforward technique to obtain thresholdfor segmentation. However, estimating thresholds for multilevelthresholding requires high computational efforts.
2.3. Concept of Kapur’s entropy
The Kapur method maximizes the entropy measure of the seg-mented histogram such that each separated region has more cen-tralized distribution (Sathya & Kayalvizhi, 2010). If the object issharply distinguishable from its background then the gray-levelhistogram will be classified so that threshold value for segmenta-tion process can be chosen at the bottom of the valley. However,bimodal process of gray-level histogram cannot be easily achieved.
In order to get better thresholding function, entropy-basedthresholding technique has found an efficient and significant seg-mentation routine, which is incorporated with probability distri-bution of the gray level histogram. Many multilevel imagethresholding techniques were anticipated in the literature. Amongthose methods, Kapur’s entropy (Kapur et al., 1985) based thres-holding technique has been cited as an efficient and frequentlyused method.
Kapur et al. assumed two probability distributions, one for theobject and the other for the background. Further, in order to findthe best threshold level, total entropy of the partitioned imagehas been maximized. However, if the optimal thresholds for seg-menting the classes are assigned appropriately then only the en-tropy will be maximum and most suitable. So for, the main aimof this paper is to find the optimal thresholds or best fitness valueyielding the maximum entropy using Kapur’s entropy techniqueand CS algorithm.
The entropy of a discrete source is often obtained from theprobability distribution p = pi, where, pi is the probability of thesystem in possible state i. The probability of each gray level i isthe relative occurrence frequency of the gray level i, normalizedby the total number of gray levels (4):
pi ¼hiPL�1
i¼0 hðiÞ; i ¼ 0; . . . ; L� 1 ð4Þ
H0 ¼ �Xt�1
i¼0
pi
x0ln
pi
x0; x0 ¼
Xt�1
i¼0
pi
H1 ¼ �XL�1
i¼t
pi
x1ln
pi
x1; x1 ¼
XL�1
i¼t
pi
ð5Þ
If the addition of class entropies is maximum then only theoptimum threshold value can be achieved which is obtained by (6).
t� ¼ arg maxðH0 þ H1Þ ð6ÞFurther, Kapur’s entropy (Akay, 2013) is extended for multilevelthresholding problem (Sathya & Kayalvizhi, 2010; Sathya & Kay-alvizhi, 2011; Sathya & Kayalvizhi, 2011) as followed by (7)
3540 A.K. Bhandari et al. / Expert Systems with Applications 41 (2014) 3538–3560

H0 ¼ �Xt1�1
i¼0
pi
x0ln
pi
x0; x0 ¼
Xt1�1
i¼0
pi
H1 ¼ �Xt2�1
i¼t1
pi
x1ln
pi
x1; x1 ¼
Xt2�1
i¼t1
pi
H2 ¼ �Xt3�1
i¼t2
pi
x2ln
pi
x2; x2 ¼
Xt3�1
i¼t2
pi
Hj ¼ �Xtjþ1�1
i¼tj
pi
xjln
pi
xj; xj ¼
Xtjþ1�1
i¼tj
pi
Hm ¼ �XL�1
i¼tm
pi
xmln
pi
xm; xm ¼
XL�1
i¼tm
pi
ð7Þ
The optimal multilevel thresholding problem is configured as anm-dimensional optimization problem. In order to solve multilevelsegmentation problem, m-dimensional optimal thresholds are ob-tained by (8) that is used to maximize the objective function:
ð~tÞ� ¼ argmaxXmi¼0
Hi
!ð8Þ
The aim of the proposed, CS algorithm based technique is to maxi-mize the Kapur’s objective function using above equation.
3. Brief introduction of WDO and CS algorithm
Optimization is the process of making something better thanthe previous form. In other words, optimization is the method ofmodifying the inputs to or characteristics of a device, mathemati-cal process, or experiment to find the minimum or maximum out-put or result. The input consists of variables: the process orfunction is known as the cost function, objective function, or fit-ness function; and the output is the cost or fitness (Haupt & Haupt,2004). A brief description of the PSO and the CS algorithms is givenin the following subsections.
3.1. Wind driven optimization technique
Motivation for WDO appears from the earth’s atmosphere,where wind blows in an attempt to equalize horizontal imbalancesin the air pressure. WDO is a modern nature-inspired global opti-mization method based on atmospheric motion (Bayraktar, Ko-murcu, Bossard, & Werner, 2013). It is revealed that WDO is easyto execute and highly effective in solving multidimensionalnumerical optimization problems. Basically, this technique isworking on the population based iterative heuristic global optimi-zation algorithm for multi-dimensional and multi-modal problemswith the ability to implement constraints on the search domain.WDO is similar to other nature inspired optimization algorithms,in which population based heuristic iterative process can be foundfor solving multidimensional optimization problems. At its center,a population of infinitesimally small air parcels navigates over anN-dimensional search space employing Newton’s second law ofmotion that is exploited to express the motion of air parcels insidethe earth’s atmosphere. As compared to similar particle based pro-cedures, WDO exploits additional terms in the velocity updateequation such as gravitation and Coriolis forces, which is used toprovide robustness and extra degrees of freedom to fine tune.
3.2. CS algorithm
In this paper, a new evolutionary optimization algorithm isintroduced which is inspired by the lifestyle of a bird family calledcuckoo. CS optimization method is a nature inspired meta-heuris-
tic algorithm, which is based on the obligate brood parasitic behav-ior of some cuckoo spices in combination with Lévy flightdistribution of some birds and fruit flies (Payne, Sorenson, & Klitz,2005). Most of the nature optimization algorithms are modeled asrandom walk because of following the intrinsic steps for searchingthe whole search space. The effectiveness of metaheuristicalgorithms can be recognized to the fact that they imitate the bestfeatures in nature. There are two essential properties of metaheu-ristics algorithms which are classified as intensification and diver-sification. The aim of intensification is to search around the currentbest solutions and select the best candidates or solutions. Diversi-fication intends to explore the search space more efficiently, fre-quently by randomization (Gandomi et al., 2012; Gandomi et al.,2013a). Diversification and intensification should be intrinsic toany meta-heuristic algorithm. In cuckoo search, diversification isachieved by the use of Lévy flight probability distribution whichis exploited to search the solution most exhaustively than Gaussianbased Brownian motion.
Many nature inspired algorithms have been used for multilevelimage segmentation but the region behind using cuckoo search isdue to the following properties:
1. CS is a population based algorithm. The entry wise product issimilar to PSO but random walk via Lévy flight is more efficientin discovering the search space as its step length is much longerin the lengthy execution.
2. The number of parameters tuned are much less than GA, PSOand ABC and hence, it is potentially more suitable for a wideclass of the optimization procedures.
4. Explanations of the algorithms in the study for multilevelthresholding
In this paper, Lévy flight based cuckoo search have beenselected although many variation of the same have also been pro-posed in Walton, Hassan, Morgan, and Brown (2011), because ofbetter searching ability in the large search space. However, consid-ering the multi-dimensional space, authors in Yang and Deb (2009,2010), Gandomi et al. (2013) proved that the CS algorithm provideefficient means for maximizing the objective function where theoptimal solution is required.
4.1. Cuckoo search algorithm
Cuckoo search (CS) algorithm is proposed by Yang and Deb(2009, 2010). Basically, CS is a population oriented stochasticglobal search algorithm that is mainly used for finding a globaloptimal solution. It is observed that the quality or fitness of a solu-tion can easily be proportional to the value of objective function.Without any exhaustive search, CS is proficient in obtaining theoptimized solutions in case of complicated problems. Hence, CSmay be helpful for non-linear problems and multi-objectiveoptimizations.
In order to describe the cuckoo search more clearly, the inter-esting breed behavior of certain cuckoo species is briefly reviewedin the next subsection.
4.1.1. Breeding behavior of cuckoo birdCuckoos are fascinating birds, not only because of the beautiful
sounds but due to aggressive reproduction strategy. There are basi-cally three types of brood parasitism strategy: intraspecific broodparasitism, cooperative breeding and nest takeover. Cuckoos canengage in direct conflict with the host birds. Host birds can eitherthrow the alien eggs out of the nest or they abandon the nest andmake new ones.
A.K. Bhandari et al. / Expert Systems with Applications 41 (2014) 3538–3560 3541

4.1.2. Lévy flight distributionIn Lévy flight distribution, it is found that animals and birds
search for food in a random or quasi random manner, and essen-tially follow a random walk because the next step is based onthe current place and the transition probability to the next state.Such behavior has been applied in cuckoo search optimization byYang and Deb (2010), and have demonstrated its superiority overother distribution based random walk problems.
This type of behavior can be modeled mathematically. Usually,Lévy flight distribution is expressed by taking its Fourier transformas followed by (9)
IðsÞ ¼ exp �kjsjl� �; 0 < l 6 2 ð9Þ
where, k represents a scaling parameter. The inverse transform doesnot have explicit analytical formulae except for special case of theparameter. In case of l = 2, the equations changed as
IðsÞ ¼ exp �ks2� � ð10Þ
The inverse transform of (10) provides Gaussian distribution. Ingeneral, the inverse integral becomes:
MðsÞ ¼ 1p
Z 1
0cosðnsÞ exp �kjnjl� �
dn ð11Þ
This can be calculated just for greater values of s as followed by (12)
MðsÞ ¼ klCðlÞ sinðpl=2Þpjsj1þl
when s ! 1 ð12Þ
CðyÞ ¼Z 1
0f y�1e�f df ð13Þ
where, C(y) is the Gamma function.
4.1.3. Explanation of efficiency Lévy flight distributionLévy flights are known to be more efficient than the Brownian
random walks in exploring large scale search space. A completeflowchart routine for the Lévy flight based CS algorithm methodis shown in Fig. 1.
The reason behind expressing the above phenomenon (Yang,2010) is due to the fact that variance of Lévy flights is
s2ðf Þ � f 3�l; 1 6 l 6 2 ð14Þ
Which expand at a greater rate than the linear relationship ofBrownian random walks followed by s2(f)? f.
4.1.4. Implementation of Lévy flight distributionFrom implementation point of view, the generation of Lévy
flight distributed numbers can be achieved by following two steps:
1. The choice of a random direction.2. The generation of steps should obey the chosen Lévy
distribution.
There are many ways of implementing this but one of the eas-iest ways (Yang, 2010) is Mantegna algorithm for a symmetric Lévystable distribution. The step length p is (Civicioglu & Besdok, 2013),calculated for Mantegna algorithm by (15):
p ¼ w
jdj1=lð15Þ
In which y and z are derived from normal distributions.
w � Q 0; s2w� �
s � Q 0; s2s� � ð16Þ
ru ¼ Cð1þ lÞ sinðpl=2ÞC 1þl
2
h il2
l�12
8><>:9>=>;
1=l
& ss ¼ 1 ð17Þ
These setting follow the Lévy distribution for |p|P |p0|, where, p0 isthe smallest step and it is chosen to be anywhere between the value0.1–1.
4.1.5. Concept of cuckoo search algorithmThere are three idealized rules in the cuckoo search algorithm
proposed by Yang and Deb (2009, 2010). The underlying idealizedrules as an optimization tool of CS algorithm are:
1. Each cuckoo lays one egg at a time and dumps it in a randomlychosen nest.
2. The best nests with high quality of eggs will carry over to thenext generation.
3. The number of available host nest is fixed, and the egg laid by acuckoo is discovered by the host bird with a probability ofpa 2 [0,1].
For maximization or minimization problems, the fitness func-tion is chosen as the objective function itself. For generating newsolution, x(t+1) for cuckoo i, a Lévy flight is performed as (18):
xðtþ1Þi ¼ xti þ a� Le
0vyðkÞ ð18Þ
where, a is the step size (a > 1) and is related to size of the problem.In most cases, a = 1 is used. The product �deals with entry wisemultiplications process. However, Lévy flights provide a random
Begin
Objective function *
0
( ) g maxm
ii
t ar H=
⎛ ⎞⎜ ⎟=⎜ ⎟⎝ ⎠∑
Generate initial population of n host nests
t < Max Generation)or (stop criterion)
Get a cuckoo randomly by Lévy flights evaluate its quality/fitness F Choose a nest among n (say, j)
randomly ( 1) ( )t ti ix x Levyα λ+ = + ⊕
(Fi > Fj)
A fraction (pa) of worse nests are abandoned and new ones are built; Keep the best solutions (or
nests with quality solutions); Rank the solutions and find the current best
Replace j by the new solution
No
Yes
End
Fig. 1. Flow chart of the Lévy flight based CS algorithm.
3542 A.K. Bhandari et al. / Expert Systems with Applications 41 (2014) 3538–3560

walk whereas their random step lengths are drawn from a Lévydistribution for large steps defined by (19):
Levy � u ¼ t�k; where 1 < k 6 3 ð19ÞL’evy function can be changed according to application.
Mantegna’s algorithm is one of the L’evy function. It has an infinitevariance and infinite mean.
4.2. ELR-CS algorithm based multilevel thresholding
Similar to other evolutionary algorithms, CS algorithm beginswith an initial population of cuckoos. The initial cuckoos containfew eggs to lay in some host birds’ nests. In which only some eggscomparable to the host bird’s eggs have possibility to grow up andbecome a mature cuckoo. Rests of the birds are become aware ofhost birds and are killed. The mature eggs express the appropriate-ness of the nests in that particular region. If maximum eggs stayalive in a region, that signify more profit is achieved in that region.Therefore, the position where more eggs survive will be the termthat cuckoo optimization algorithm (COA) is going to optimize(Rajabioun, 2011).
A complete flowchart routine for the ELR-CS algorithm is shownin Fig. 2.
To resolve cuckoo optimization problem, values of problemvariables should be formed as an array and it is known as habitat.In order to Nvar-dimensional optimization problem, a habitat is anarray of 1 � Nvar, indicating current living position of cuckoo. It ischaracterized as follows:
habitat ¼ ½x1; x2; . . . ; xNvar � ð20Þ
Every variable values (x1,x2, . . . ,xNvar ) represents the floatingpoint number, in which the profit of a habitat is found by evalua-tion of profit function fp at a habitat of (x1,x2, . . . ,xNvar ) as followedby (21):
Profit ¼ fpðhabitatÞ ¼ fpðx1; x2; . . . ; xNvar Þ ð21Þ
To utilize COA in cost minimization problems, the profit functioncan be simply maximized by (22):
Profit ¼ �CostðhabitatÞ ¼ �fpðx1; x2; . . . ; xNvar Þ ð22Þ
Moreover to begin optimization algorithm, a candidate habitat ma-trix of size Npop � Nvar is developed.
To start the optimization algorithm, a candidate habitat matrixof size Npop � Nvar is generated. Afterward few arbitrarily generatednumbers of eggs is assumed for every initial cuckoo habitat. Basi-cally, each cuckoo lays from 5 to 20 eggs in nature. These valuesare used as the upper and lower limits of egg with respect to eachcuckoo at various iterations. Furthermore, real cuckoos are used tolay their eggs within a maximum distance from their habitat,which is known as egg laying radius (ELR) (Rajabioun, 2011). Foroptimization problem, upper limit is denoted by varhi and lowerlimit as varlow for variables. Each cuckoo has an egg laying radiusthat is proportional to the total number of eggs, number of currentcuckoo’s eggs and also variable limits of varhi and varlow. Therefore,ELR is defined by (23):
ELR ¼ a� Number of current cuckoo’s eggsTotal number of eggs
� ðvarhi � varlowÞð23Þ
where, a is an integer, supposed to handle the maximum value ofELR.
4.3. Wind driven optimization technique
WDO is a modern nature-inspired global optimization methodbased on atmospheric motion (Civicioglu & Besdok, 2013). It is re-vealed that WDO is easy to execute and highly effective in solvingmultidimensional numerical optimization problems. Basically, thistechnique is working on the population based iterative heuristicglobal optimization algorithm for multi-dimensional and multi-modal problems with the ability to implement constraints on thesearch domain. WDO is similar to other nature inspired optimiza-tion algorithms, in which population based heuristic iterative pro-cess can be found for solving the multidimensional optimizationproblems. As compared to similar particle based procedures,WDO exploits additional terms in the velocity update equationsuch as gravitation and Coriolis forces, which is used to providerobustness and extra degrees of freedom to fine tune.
Furthermore, along with theory and terminology of WDO, anumerical study for tuning the WDO parameters has been intro-duced in Bayraktaret al. (2010). WDO is further expanded in vari-ous applications of electromagnetic optimization problems(Bayraktar, Turpin, & Werner, 2011; Bayraktar et al., 2011). Thesepapers signify that WDO, in some cases, gives superior perfor-mance in comparison to other well-known techniques such asPSO and GA. However, WDO is found to be more appropriate andefficient for both types of problems with discrete and continuousvalued parameters.
The execution of WDO is demonstrated in Fig. 3. It representsthat the algorithm begins with initialization step, where eachparameters are associated to WDO and other parameters are con-nected to the optimization problem.
As can be seen in the flowchart, the algorithm starts with theinitialization stage, where all the parameters related to WDO as
Determine egg laying radius for each cuckoo
Move all cuckoo’s towards best environment
Determine cuckoo societies
Find nests with best survival rate
Let eggs grow
Begin
Initialize the random solution (Cuckoos) to the Kapur’s entropy function
Population is less than the max value?
Lay eggs in different nests
Some eggs are detected and killed
Check the values of fitness function
Stop condition satisfied?
Get threshold values to the image
End
Fig. 2. Flowchart of ELR-CS algorithm.
A.K. Bhandari et al. / Expert Systems with Applications 41 (2014) 3538–3560 3543

well as the other parameters related to the optimization problemhave to be defined.
4.3.1. Theoretical background and motivation of WDOIn the atmosphere, wind blows in an effort to make equal air
pressure. More exclusively, the air is used to move from high pres-sure to low pressure at a velocity, which is proportional to thepressure gradient (Thompson, 2002; Wallace & Hobbs, 2006). Fur-thermore, some assumptions and simplifications are formulated inderivation of the WDO algorithm. The beginning step of WDO issupported by the Newton’s second law of motion, which is usedto determine the accurate results specifically for the analysis ofatmospheric motion (Ahrens, 2007; Riehl, 1978).
q~a ¼X
~Fi ð24Þ
where, a is the acceleration vector, q is the air density for an infin-itesimal element of volume, and Fi are the forces acting on the mass.The equation that relates air pressure to its density and tempera-ture is given by the ideal gas law:
P ¼ qRT ð25Þwhere, P is the pressure, R is the universal gas constant and T is thetemperature.
There are four main forces in Eq. (24), that either cause the windto move in a specific direction or deflect it from its path. The mostobservable force causing the air to move is the pressure gradient
force (FPG), although the friction force (FF) simply acts to opposesuch motion as described in Eq. (29). Whereas the gravitationalforce (FG) acts as a vertical force in three-dimensional atmospherewhen it is mapped to N-dimensional space. The Coriolis force (FC) iscaused by the rotation of earth, and deflects the path of wind fromone dimension to another. In WDO, it is implemented as a motionin one dimension that affects the velocity in another (Bayraktaret al., 2010).
The physical equations that govern each of these forces are gi-ven below:
~FPG ¼ �rPdV ð26Þ
~FG ¼ qdV~g ð27Þ
~Fc ¼ �2X�~u ð28Þ
~FF ¼ �qa~u ð29Þ
where, rP is the pressure gradient, dV represents an infinitesimalair volume, X represents rotation of the earth, g is the gravitationalacceleration, and u is the velocity vector of the wind.
The summation of all four forces can be obtained by (30):
q~uDt ¼ ðqdV~gÞ þ ð�rPdVÞ þ ð�qa~uÞ þ ð�2X�~uÞ ð30ÞIf an infinitesimal air parcel is considered which is moving with
the wind then the velocity update equation can be determined by(31). On the basis of ideal gas law equation from (25), q can bewritten in terms of pressure, and a unity time step (Dt = 1) canbe assumed for simplicity. The velocity update equation is:
~unew ¼ ðð1� aÞ~uoldÞ þ gð�~xoldÞ þ Pmax
Pold� 1
���� ����RTðxmax � xoldÞ�
þ �cotherdimold
Pold
� ð31Þ
In Eq. (31), updated velocity for the next iteration, unew,depends on the current iteration velocity (uold), current locationof air parcel in search space (xold), distance from the highestpressure point that has been found (xmax), maximum pressure
Start
Initialization:Population size, max number of iterations,
coefficients, boundaries, and pressure function definition
Max number of iterations?
Yes
No
Assign random position and velocity
Evaluate the pressure for each air parcel
Update velocity and check velocity limits
Update position and check boundaries
End
Fig. 3. Flowchart of WDO technique.
Table 1Parameters used for CS.
Parameters Value
Number of nests 25Number of iterations 3000Mutation probability value (pa) 0.25Scale factor (b) 1.5
Table 2Parameters used for ELR-CS.
Parameters Value
Number of initial population 4Minimum number of eggs 2Maximum number of eggs 6Maximum iteration 100Number of clusters 1Motion coefficients 2Radius coefficients 5Population variance 1e�15Maximum No. of cuckoo’s 20
Table 3Parameters used for WDO.
Parameters Value
Population size 20Maximum number of iteration 500RT coefficient 2Gravitational constant 0.2Constant in the update equation 0.5Coriolis effect 0.4Maximum allowed speed 0.3
3544 A.K. Bhandari et al. / Expert Systems with Applications 41 (2014) 3538–3560

(Pmax), pressure at the current location (Pold), temperature (T), grav-itational acceleration (g), and constants R, a, and c.
In WDO expression (31), the pressure term is analogous to thefitness of a chromosome in GA terminology. If WDO is comparedwith PSO, similar velocity update equations can be realized. Afterthe velocity of parcel is updated by Eq. (31), the position of air par-cel can be updated by Eq. (32)
~xnew ¼~xold þ ð~unew � DtÞ ð32ÞIn Eq. (32),~xold represents that the air parcel would continue to
move on its previous path with some opposition that is createddue to friction. ~unew is an attractive force that pulls against the
center of coordinate system. Dt indicates the force against positionof maximum pressure that is assumed to be the global best positionfor the optimization problem.~xnew follows the Coriolis force, in fact,which is a deflecting force. In this manner, WDO offers a simple yethighly effective way to solve the complex optimization problems.
For each dimension, WDO permits the air parcels to move onlywithin the bounds of [�1,1]. In literature, a variety of boundaryconditions have been anticipated for particle-based optimization(Robinson & Rahmat-Samii, 2004), but in case of WDO, if an airparcel tries to pass outside of these specified limitations in anydimension, its position in that individual dimension is set to theboundary value.
Table 4Description of WDO parameters.
Terminology Description
Air parcel An individual member, whose coordinate values signifies solution to the optimization problem at handPopulation A group comprised of a predetermined number of diverse air parcelsPosition The coordinates of an air parcel, which are mapped to the dimensions of the optimization problem at handVelocity The amount of position displacement per iterationPressure A number assigned to air parcels, which establishes how well an air parcel meets the desired design performance. Analogies can be made with fitness,
cost, or penalty functionsRanking Shorting the air parcels at each iteration based on their pressure values
Table 5Comparison of best objective function values and their corresponding threshold values between CS, ELR-CS and WDO based technique.
Test images m Best objective function values Optimum threshold values
CS ELR-CS WDO CS ELR-CS WDO
1 2 13.093956 13.093956 13.093956 72164 72164 65 1673 16.409648 16.409648 16.409648 60125191 60125191 601251914 19.446564 19.44628 19.446073 4898149201 48101152201 40981552155 22.276398 22.276398 20.85616 4282125169211 4282125169211 41128155186214
2 2 13.221844 13.221844 13.221844 83170 83170 841693 16.483182 16.483182 16.483058 64127190 64127190 741181904 19.490216 19.490216 19.490042 53103153204 53103153204 62991432075 22.301381 22.301359 22.300529 4589131173215 4589130172214 4189122174216
3 2 13.268855 13.268855 13.268855 85169 85169 851693 16.545721 16.545721 16.545721 64127190 64127190 611211974 19.569695 19.569695 19.569695 51102153203 51102153203 441011522105 22.389132 22.389095 22.389132 4284126168211 4284127169211 4397115166210
4 2 13.289346 13.289346 13.289346 85170 85170 881673 16.569472 16.569472 16.568888 64127191 64127191 701291894 19.599259 19.599259 19.588158 51102153204 51102153204 581011441955 22.43009 22.429873 22.421319 4386129171213 4386128170213 4686125168206
5 2 13.274499 13.274499 13.274477 86171 86171 881673 16.551318 16.551318 16.548976 65128191 65128191 701271794 19.573961 19.573961 19.565116 52103154204 52103154204 61991531955 22.395121 22.394997 22.307695 4385127169212 4486128171213 66104136179211
6 2 11.98426 11.98426 11.98426 67144 67144 651443 15.31419 15.31419 15.31419 67140206 67140206 611482054 18.272048 18.272048 18.172048 64120165217 64120165217 661071612025 21.178153 21.178153 21.141813 3278138188221 3278138188221 6385127183228
7 2 13.141319 13.141319 13.141319 79163 79163 791633 16.397053 16.397053 16.396776 57121183 57121183 571221864 19.46177 19.46177 19.461391 49101154207 49101154207 501021572055 22.353762 22.353762 22.352793 4489133176220 4489133176220 4787121177222
8 2 13.272708 12.443851 15.538424 84168 117184 971492013 16.553637 15.539323 15.539323 63126190 99152204 961542064 19.581344 18.389539 18.389318 51102153204 87130172214 841351702215 22.411434 21.057269 21.05696 4385127169212 74110147184221 74108145188221
9 2 13.091214 13.091214 13.091214 72164 72164 711623 16.398031 16.398031 16.398031 61125192 61125192 741261764 19.401898 19.401898 19.401483 53102152204 53102152204 461021582115 22.194527 22.194527 22.186527 4890130171214 4890130171214 3984130168211
10 2 12.424538 13.29426 12.424538 105169 86170 1041683 15.482372 16.578978 15.482372 97148200 64128191 921502084 18.313726 19.612016 18.313525 84124166209 51102153204 831221612065 21.069418 22.443599 21.067877 5596135175215 4386129171213 5293139165213
A.K. Bhandari et al. / Expert Systems with Applications 41 (2014) 3538–3560 3545

The gravitational force ultimately influences every air parcelsthat are trapped at the boundaries back into the search space. Itshould also be examined that the updated velocities of air parcelsare restricted to a maximum value per iteration. The reason behindthis is to avoid air parcels from taking huge steps and overlookingcertain regions in the search space. Once the velocity magnitudegoes beyond the specialized maximum in any dimension thenthe velocity in that dimension is limited according to Eq. (33):
u�new ¼ umax if unew > umax
�umax if unew < �umax
� �ð33Þ
where, the direction of motion is preserved but the magnitude islimited to be not more than |umax| at any dimension, and ju�
maxj rep-resents the adjusted velocity after it is limited to maximum speed.
5. Experiments and results
In this section, the experimental results are presented. There-fore, the performance of CS, ELR-CS and WDO algorithm basedmultilevel thresholding using Kapur’s entropy is evaluated by con-sidering fidelity of segmented image to the original image. For thispurpose, PSNR, SSIM and FSIM fidelity assessment parameters areconsidered. A variety of satellite images are included to demonstratethe usefulness of this algorithm. The algorithms are developed
using MATLAB Release 2010. Tables 1–4 represent the necessaryparameters used for CS, ELR-CS and WDO algorithms basedmethodology.
Satellite images often need segmentation in the presence ofuncertainty, caused due to the factors like highly dependent onenvironmental conditions, poor resolution and poor illumination,and have very low spatial resolution. Therefore, in this paper, anew approach using CS, ELR-CS and WDO algorithm for multilevelthresholding has been introduced towards the efficient segmenta-tion of satellite images. Furthermore, satellite image segmentationusing Kapur’s entropy have been never examined with CS, ELR-CSand WDO techniques. Owing to complexity problem in satelliteimage processing, most of the existing segmentation work havebeen examined in the normal date set or only in the gray levelimages. In satellite images, rate of information are very high be-cause of that existing features in the image is very dense due tothat rate of change from one region to other region is very rapid.Therefore, in case of segmentation of remote sensing images or sa-tellite images, accurate segmentation is a very challenging task.Hence, to achieve accurate segmentation of satellite images, tworobust techniques named CS and WDO are utilized in this paper,which shows the effectiveness of their segmented result.
In this paper, for experimental results, ten satellite images areconsidered for segmentation purpose and better comparison ofresults. However, optimal thresholds are determined by the
Table 6Comparison of PSNR (dB) values between CS, ELR-CS and WDO based technique.
Test images m PSNR (dB)
CS ELR-CS WDO
1 2 24.639121 24.639121 24.6027323 24.826993 24.826993 24.8269934 25.038809 25.014335 24.9654395 25.29373 25.29373 25.182942
2 2 24.621724 24.621724 24.6205933 24.838544 24.838544 24.8299224 25.038328 25.038328 25.0572455 25.934003 25.281408 25.281293
3 2 24.640031 24.640031 24.6400313 24.832817 24.832817 24.8339864 25.047936 25.047936 25.0281545 25.942532 25.264161 25.247987
4 2 24.563031 24.563031 24.5686383 24.771162 24.771162 24.7648934 24.976431 24.976431 24.9776095 25.980564 25.192972 25.194571
5 2 24.576461 24.576461 24.5831453 24.790011 24.790011 24.5914394 24.964785 24.964785 25.0012865 25.918649 25.209058 25.218661
6 2 24.501616 24.501616 24.482413 24.536597 24.536597 24.4297274 24.910702 24.910702 25.1336585 25.504945 24.805936 25.302908
7 2 24.737993 24.737993 24.7379933 24.929184 24.929184 24.9414994 25.133625 25.133625 25.1486095 25.293711 25.293711 25.244286
8 2 24.59334 24.51934 24.5649543 24.78037 24.738067 24.7254394 24.971963 24.970647 24.9609245 25.506412 25.237553 25.245693
9 2 24.70188 24.70188 24.6899523 24.79065 24.79065 24.9395014 24.994862 24.994862 24.9635885 25.533382 25.234412 25.24042
10 2 24.437244 24.586956 24.4424823 24.578512 24.804029 24.6036724 25.360937 24.988611 24.9380395 25.869381 25.23066 25.291832
3546 A.K. Bhandari et al. / Expert Systems with Applications 41 (2014) 3538–3560

proposed method. For multilevel thresholding, the number ofthresholds (m) investigated in this experiment were 2-level, 3-le-vel, 4-level and 5-level thresholding for visual perception and fidel-ity assessment.
The multilevel thresholding problem deals with the finding ofoptimal thresholds within the range [0,L � 1] that maximizes a fit-ness criterion. The dimension of optimization problem is the num-ber of thresholds (m), and the search space is [0,L � 1]m. In thisstudy, optimal multilevel thresholding has been considered withan unsupervised global-level nonparametric way. For that CS,ELR-CS and WDO algorithms have been used individually, andthe search efficiencies of CS have been compared with WDO. TheKapur’s entropy has been examined as the fitness criteria for mul-tilevel segmentation.
PSNR block computes the peak signal-to-noise ratio, in decibelsbetween two images. This ratio is often used as a quality measure-ment between the original and improved images. For evaluation ofthe results, PSNR, SSIM and FSIM are reported, in subsequence tothe values of fitness functions, thresholds and segmented images.PSNR gives the similarity of an image against a reference imagebased on the MSE of each pixel. Performance of this method ismeasured in terms of following significant parameters:
RMSE ¼ffiffiffiffiffiffiffiffi1
MN
r XMi¼1
XNj¼1
½Iði; jÞ �eIði; jÞ�2 ð34Þ
PSNRðin dBÞ ¼ 20log10255RMSE
� �ð35Þ
where, M, N are the size of image, I is the original image and eI is thethresholded image at a particular level. Higher PSNR signifies betterquality of thresholding. MSE represents the cumulative squared er-ror between the enhanced and original image, whereas PSNR repre-sents a measure of the peak error.
CS, ELR-CS and WDO algorithms are compared in terms of bestobjective function values, optimal threshold values and results areshown in Table 5. CS and WDO algorithms are also compared interms of PSNR, SSIM, FSIM, and the results are displayed in Tables6 and 7.
The SSIM is used to compare the structures of the original andthresholded image (Zhou, Alan, Hamid, & Eero, 2004). The SSIM in-dex is calculated as:
SSIMðI;eIÞ ¼ ð2lIleI þ C1Þð2rIeI þ C2Þ
ðl2I þ l2eI C1Þðr2
I þ r2eI þ C2Þð36Þ
Table 7Comparison of SSIM and FSIM between CS, ELR-CS and WDO based technique.
Test images m SSIM FSIM
CS ELR-CS WDO CS ELR-CS WDO
1 2 0.9419405 0.9419405 0.9351092 0.9239183 0.9239183 0.91770283 0.9668088 0.9668088 0.9668088 0.9616412 0.9616412 0.96164124 0.9787562 0.9781585 0.9735854 0.9742176 0.9738006 0.96829355 0.9851868 0.9851868 0.9598725 0.9815124 0.9815124 0.944696
2 2 0.9447942 0.9447942 0.9450207 0.9185442 0.9185442 0.91696813 0.9688697 0.9688697 0.9652858 0.9469764 0.9469764 0.94086714 0.9794166 0.9794166 0.976847 0.960478 0.960478 0.9545675 0.9927239 0.9854565 0.9843081 0.9858892 0.9687494 0.9688311
3 2 0.941236 0.941236 0.941236 0.9012991 0.9012991 0.90129913 0.9667713 0.9667713 0.9658308 0.9446878 0.9446878 0.9495014 0.978438 0.978438 0.9774203 0.9646774 0.9646774 0.96814725 0.9853617 0.9849749 0.9813379 0.9854529 0.9757129 0.9703706
4 2 0.9402418 0.9232127 0.9398225 0.9232127 0.9402418 0.91830083 0.9664264 0.9634264 0.9653642 0.9581155 0.9531155 0.95178474 0.9785624 0.9785624 0.9770014 0.9733944 0.9733944 0.96556085 0.984563 0.9851008 0.9845905 0.9861864 0.9810648 0.9778633
5 2 0.9411843 0.9411843 0.9415298 0.904854 0.904854 0.89967293 0.9666816 0.9666816 0.9304156 0.9432954 0.9432954 0.83004164 0.9782005 0.9782005 0.9764156 0.9606097 0.9606097 0.94958155 0.9849488 0.9847518 0.9795323 0.9714218 0.9713342 0.9521618
6 2 0.9516496 0.9516496 0.9488835 0.8191333 0.8191333 0.81351463 0.9548384 0.9548384 0.9391237 0.8319345 0.8319345 0.79199134 0.9700105 0.9700105 0.978433 0.8902163 0.8902163 0.89699365 0.973379 0.973379 0.9828881 0.9099035 0.8799035 0.898722
7 2 0.9540227 0.9540227 0.9540227 0.8209217 0.8209217 0.82092173 0.971732 0.971732 0.9711662 0.8814601 0.8814601 0.88288124 0.9779742 0.9779742 0.9782567 0.9210337 0.9210337 0.92239135 0.9834209 0.9834209 0.9815663 0.9440869 0.9440869 0.935286
8 2 0.9417343 0.9048641 0.9227454 0.9150223 0.8863045 0.79569043 0.9666021 0.9471623 0.950702 0.9553696 0.922516 0.93090994 0.9782531 0.9679055 0.9693913 0.9740228 0.9435826 0.95726765 0.9849118 0.9825889 0.9825461 0.982347 0.9655211 0.9650223
9 2 0.9424953 0.9424953 0.9427869 0.9248925 0.9248925 0.9217663 0.9671923 0.9671923 0.9657649 0.9629682 0.9629682 0.93606284 0.9789192 0.9789192 0.9761794 0.9760618 0.9760618 0.97654345 0.9847674 0.9847674 0.9841077 0.9822973 0.9822973 0.9805852
10 2 0.8721184 0.940629 0.8738872 0.8096218 0.8543579 0.81155113 0.8895574 0.9660731 0.8987611 0.8421869 0.9096936 0.84274884 0.9203583 0.9777045 0.9251178 0.8314321 0.9366304 0.86659115 0.9978023 0.98447 0.9807661 0.9814791 0.9530193 0.9289869
A.K. Bhandari et al. / Expert Systems with Applications 41 (2014) 3538–3560 3547
Fig. 4. Results of test satellite image 1 using CS and WDO algorithm. (a) Original satellite image, (b) gray scale image of input image, (c) histogram of original image, (d–g) 2-level to 5-level thresholding based segmented image with the best thresholds obtained from CS algorithm using Kapur’s entropy criterion, (h–k) 2-level to 5-levelcorresponding histogram labeled with the best threshold values obtained from CS algorithm based on the Kapur’s entropy criterion, (l–o) 2-level to 5-level thresholding basedsegmented image with the best thresholds obtained from WDO algorithm using Kapur’s entropy criterion, (p–s) 2-level to 5-level corresponding histogram labeled with thebest threshold values obtained from WDO algorithm based on the Kapur’s entropy criterion.
3548 A.K. Bhandari et al. / Expert Systems with Applications 41 (2014) 3538–3560

Fig. 5. Results of test satellite image 2 using CS and WDO algorithm. (a) Original satellite image, (b) gray scale image of input image, (c) histogram of original image, (d–g) 2-level to 5-level thresholding based segmented image with the best thresholds obtained from CS algorithm using Kapur’s entropy criterion, (h–k) 2-level to 5-levelcorresponding histogram labeled with the best threshold values obtained from CS algorithm based on the Kapur’s entropy criterion, (l–o) 2-level to 5-level thresholding basedsegmented image with the best thresholds obtained from WDO algorithm using Kapur’s entropy criterion, (p–s) 2-level to 5-level corresponding histogram labeled with thebest threshold values obtained from WDO algorithm based on the Kapur’s entropy criterion.
A.K. Bhandari et al. / Expert Systems with Applications 41 (2014) 3538–3560 3549

Fig. 6. Results of test satellite image 3 using CS and WDO algorithm. (a) Original satellite image, (b) gray scale image of input image, (c) histogram of original image, (d–g) 2-level to 5-level thresholding based segmented image with the best thresholds obtained from CS algorithm using Kapur’s entropy criterion, (h–k) 2-level to 5-levelcorresponding histogram labeled with the best threshold values obtained from CS algorithm based on the Kapur’s entropy criterion, (l–o) 2-level to 5-level thresholding basedsegmented image with the best thresholds obtained from WDO algorithm using Kapur’s entropy criterion, (p–s) 2-level to 5-level corresponding histogram labeled with thebest threshold values obtained from WDO algorithm based on the Kapur’s entropy criterion.
3550 A.K. Bhandari et al. / Expert Systems with Applications 41 (2014) 3538–3560

Fig. 7. Results of test satellite image 4 using CS and WDO algorithm. (a) Original satellite image, (b) gray scale image of input image, (c) histogram of original image, (d–g) 2-level to 5-level thresholding based segmented image with the best thresholds obtained from CS algorithm using Kapur’s entropy criterion, (h–k) 2-level to 5-levelcorresponding histogram labeled with the best threshold values obtained from CS algorithm based on the Kapur’s entropy criterion, (l–o) 2-level to 5-level thresholding basedsegmented image with the best thresholds obtained from WDO algorithm using Kapur’s entropy criterion, (p–s) 2-level to 5-level corresponding histogram labeled with thebest threshold values obtained from WDO algorithm based on the Kapur’s entropy criterion.
A.K. Bhandari et al. / Expert Systems with Applications 41 (2014) 3538–3560 3551

Fig. 8. Results of test satellite image 5 using CS and WDO algorithm. (a) Original satellite image, (b) gray scale image of input image, (c) histogram of original image, (d–g) 2-level to 5-level thresholding based segmented image with the best thresholds obtained from CS algorithm using Kapur’s entropy criterion, (h–k) 2-level to 5-levelcorresponding histogram labeled with the best threshold values obtained from CS algorithm based on the Kapur’s entropy criterion, (l–o) 2-level to 5-level thresholding basedsegmented image with the best thresholds obtained from WDO algorithm using Kapur’s entropy criterion, (p–s) 2-level to 5-level corresponding histogram labeled with thebest threshold values obtained from WDO algorithm based on the Kapur’s entropy criterion.
3552 A.K. Bhandari et al. / Expert Systems with Applications 41 (2014) 3538–3560

Fig. 9. Results of test satellite image 6 using CS and WDO algorithm. (a) Original satellite image, (b) gray scale image of input image, (c) histogram of original image, (d–g) 2-level to 5-level thresholding based segmented image with the best thresholds obtained from CS algorithm using Kapur’s entropy criterion, (h–k) 2-level to 5-levelcorresponding histogram labeled with the best threshold values obtained from CS algorithm based on the Kapur’s entropy criterion, (l–o) 2-level to 5-level thresholding basedsegmented image with the best thresholds obtained from WDO algorithm using Kapur’s entropy criterion, (p–s) 2-level to 5-level corresponding histogram labeled with thebest threshold values obtained from WDO algorithm based on the Kapur’s entropy criterion. Yellowstone Recovers from 1988 Fires, June 30, 2009. http://visibleearth.nasa.gov/view.php?id=39125.
A.K. Bhandari et al. / Expert Systems with Applications 41 (2014) 3538–3560 3553

Fig. 10. Results of test satellite image 7 using CS andWDO algorithm. (a) Original satellite image, (b) gray scale image of input image, (c) histogram of original image, (d–g) 2-level to 5-level thresholding based segmented image with the best thresholds obtained from CS algorithm using Kapur’s entropy criterion, (h–k) 2-level to 5-levelcorresponding histogram labeled with the best threshold values obtained from CS algorithm based on the Kapur’s entropy criterion, (l–o) 2-level to 5-level thresholding basedsegmented image with the best thresholds obtained from WDO algorithm using Kapur’s entropy criterion, (p–s) 2-level to 5-level corresponding histogram labeled with thebest threshold values obtained fromWDO algorithm based on the Kapur’s entropy criterion. Frozen Franz Josef Land, August 19, 2011. http://earthobservatory.nasa.gov/IOTD/view.php?id=76883.
3554 A.K. Bhandari et al. / Expert Systems with Applications 41 (2014) 3538–3560
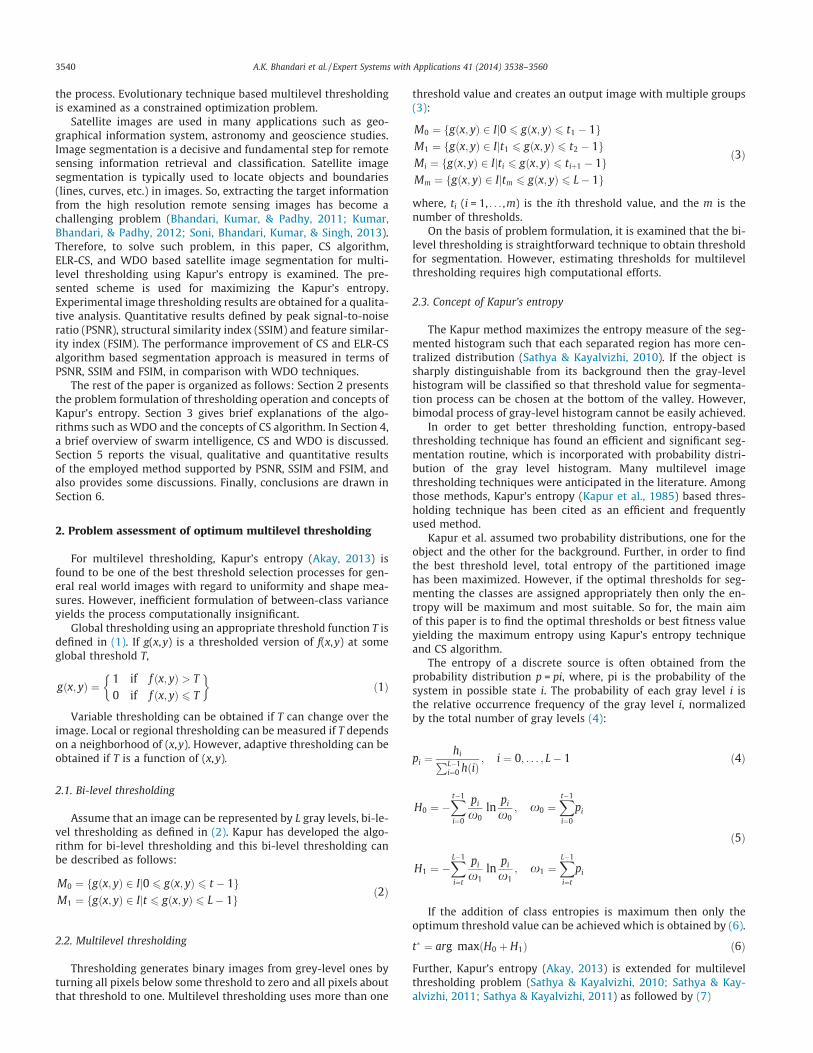
Fig. 11. Results of test satellite image 8 using CS andWDO algorithm. (a) Original satellite image, (b) gray scale image of input image, (c) histogram of original image, (d–g) 2-level to 5-level thresholding based segmented image with the best thresholds obtained from CS algorithm using Kapur’s entropy criterion, (h–k) 2-level to 5-levelcorresponding histogram labeled with the best threshold values obtained from CS algorithm based on the Kapur’s entropy criterion, (l–o) 2-level to 5-level thresholding basedsegmented image with the best thresholds obtained from WDO algorithm using Kapur’s entropy criterion, (p–s) 2-level to 5-level corresponding histogram labeled with thebest threshold values obtained from WDO algorithm based on the Kapur’s entropy criterion. Effects of the Tohoku Tsunami on the Kitakami River, March 9, 2012. http://visibleearth.nasa.gov/view.php?id=77379.
A.K. Bhandari et al. / Expert Systems with Applications 41 (2014) 3538–3560 3555

Fig. 12. Results of test satellite image 9 using CS andWDO algorithm. (a) Original satellite image, (b) gray scale image of input image, (c) histogram of original image, (d–g) 2-level to 5-level thresholding based segmented image with the best thresholds obtained from CS algorithm using Kapur’s entropy criterion, (h–k) 2-level to 5-levelcorresponding histogram labeled with the best threshold values obtained from CS algorithm based on the Kapur’s entropy criterion, (l–o) 2-level to 5-level thresholding basedsegmented image with the best thresholds obtained from WDO algorithm using Kapur’s entropy criterion, (p–s) 2-level to 5-level corresponding histogram labeled with thebest threshold values obtained from WDO algorithm based on the Kapur’s entropy criterion. Paris image, MATLAB Image Processing Toolbox User Manual.
3556 A.K. Bhandari et al. / Expert Systems with Applications 41 (2014) 3538–3560

Fig. 13. Results of test satellite image 10 using CS and WDO algorithm. (a) Original satellite image, (b) gray scale image of input image, (c) histogram of original image, (d–g)2-level to 5-level thresholding based segmented image with the best thresholds obtained from CS algorithm using Kapur’s entropy criterion, (h–k) 2-level to 5-levelcorresponding histogram labeled with the best threshold values obtained from CS algorithm based on the Kapur’s entropy criterion, (l–o) 2-level to 5-level thresholding basedsegmented image with the best thresholds obtained from WDO algorithm using Kapur’s entropy criterion, (p–s) 2-level to 5-level corresponding histogram labeled with thebest threshold values obtained from WDO algorithm based on the Kapur’s entropy criterion. New ISS Eyes see Rio San Pablo, March 1, 2013. http://visibleearth.nasa.gov/view.php?id=80561.
A.K. Bhandari et al. / Expert Systems with Applications 41 (2014) 3538–3560 3557

lI ¼ 1=NXNi¼1
Ii ð37Þ
where, lI is the mean intensity of image I.
rIeI ¼ 1=ðN � 1Þ
XNi¼1
ðIi � lIÞðeIi � leI Þ ð38Þ
where, rIeI is the standard deviation.
C1 and C2 are the constants, and are included to avoid instabil-ity when l2I + l2 eIare very close to zero. Here, C1 = C2 = 0.065. Ahigher value of SSIM shows better performance.
FSIM is used to calculate the similarity between two images(Lin, Lei, Xuanqin, & David, 2011). It is calculated between twoimages I, eI asFSIM ¼
PX2XSLðXÞPCmðXÞP
X2XPCmðXÞ ð39Þ
where,
SLðXÞ ¼ SPCðXÞSGðXÞ;
SPCðXÞ ¼ 2PC1ðXÞPC2ðXÞ þ T1
PC21ðXÞ þ PC2
2ðXÞ þ T1
;
SGðXÞ ¼ 2G1ðXÞG2ðXÞ þ T2
G21ðXÞ þ G2
2ðXÞ þ T2
ð40Þ
where, T1 and T2 are constants. Here, T1 = 0.85 and T2 = 160 has beentaken. G represents the gradient magnitude (GM) of an image and isdefined as:
G ¼ffiffiffiffiffiffiffiffiffiffiffiffiffiffiffiffiffiG2
x þ G2y
qð41Þ
PC is the phase congruence and is expressed as:
PCðXÞ ¼ EðXÞðeþPnAnðXÞÞ ð42Þ
An(X) represents the local amplitude on scale n and E(X) denotes themagnitude of response vector at position X on scale n and e is asmall positive constant. A higher value of FSIM implies betterperformance.
In this study, 5 satellite images of Jabalpur region having 3 banddata, and 5 satellite images of different region having 7 band data(http://earthobservatory.nasa.gov.) are considered for threshold-ing. The image thresholding results are demonstrated in Figs. 4–13. The thresholding results using CS are also compared withWDO algorithm, and the displayed figures show effectiveness ofboth the algorithms using Kapur’s entropy criterion. In case of seg-mented image, the output with 5-level thresholding of all the sa-tellite images using CS based on Kapur’s entropy shown inFigs. 4–13(g) appears qualitatively better as compared to 5-levelthresholding using WDO as shown in Figs. 4–13(o). Similarly, incase of other level of thresholding, shown in this paper, also revealthe fact that thresholding results obtained by CS method seems tobe feature wise better as compared to WDO. Furthermore, fromFigs. 4–13, it was also found that the thresholding performancesare qualitatively better when the numbers of thresholds are moreas shown in Tables 5–7.
For instant, if the histogram image of 6th satellite image isconsidered as shown in Fig. 10(c), it is multimode in character.Therefore, it can be the reason behind the thresholding result using5-level thresholding (of 6th satellite image) shown in Fig. 10(g)seems to be much better than the 2-level thresholding (of 6th sa-tellite image) shown in Fig. 10(d). Similarly, this condition is oc-curred with all the satellite images. On the basis of a preliminaryinvestigation with some satellite images, it can be concluded that
the entropic method based thresholding gives better threshold va-lue for all the images.
5.1. A brief discussion on CS and WDO algorithms
In this study, two swarm-based algorithms CS and WDO havebeen considered. These two techniques are straightforward mod-els, which can be merely applied to any type of optimization prob-lem. Despite the fact that these algorithms have been initialized bythe similar conditions and also same objective function is taken,but they have very diverse search nature. The CS algorithm con-trols the boundary conditions in every computation steps. As a re-sult, when the value of an attribute overflows the allowed searchspace limits, then the value of related attribute is updated withthe value of a closer limit value to the related attribute. Beforestarting the iterative search process, CS algorithm distinguishesthe most successful pattern as Xbest pattern.
WDO is a population based iterative global optimization meth-od, where the velocity and position of wind controlled air parcelsare updated based on the physical equations that govern the atmo-spheric motion. The effectiveness of WDO as a tool in multilevelthresholding optimization problems is shownwith its performanceon satellite images. WDO is well-suited for problems with both dis-crete and continuous-valued parameters. Accordingly, in imple-mentation of the WDO method, the air parcels are assumed to bedimensionless and weightless that is used to simplify the equa-tions while preserving the accuracy of physical interpretation. Itis used to work on an N-dimensional search space. Hence, the threedimensional atmospheric dynamic equations must be re-mappedto handle the multi-dimensional optimization problems. This canonly be realized via certain assumptions and simplifications. Itstates that the total force applied on an air parcel causes it to accel-erate with acceleration in the same direction as the applied totalforce according to Eq. (12). The implementation of WDO is illus-trated in Fig. 3. As depicted in the flowchart, algorithm starts withthe initialization stage, where all the parameters related to WDO aswell as other parameters related to the optimization problem haveto be defined which is illustrated in Table 4.
Once the pressure values have been estimated, population iscategorized on their pressure basis. After that the velocity updateis applied according to Eq. (31) along with the restrictions givenin Eq. (33). The positions for the next iteration are updated by uti-lizing Eq. (32), and the boundaries are verified to avoid any air par-cel from the exiting search space. If each updates are taken out,parcel pressures at the new locations are calculated. This routinecontinues until the maximum number of iterations is obtained.Lastly, the best pressure location at the end of last iteration isgained as the optimization result, and thus the best candidate solu-tion to the problem.
5.1.1. Practical implicationsIn this paper, CS, ELR-CS and WDO algorithms with Kapur’s
method are employed. This method is considered for satelliteimages and remotely sensed images are having some band combi-nation such as in case of INSAT image it is having 3 band data, andin case of LANDSAT images it is having 7 band data. In this study,five INSAT and five LANDAT images with different features are usedfor better comparison of the results. Generally, any kind of practi-cal processing of satellite images has been performed in the threebands named NIR, Red and Green bands. The specification of the allband combination is given in Table 8.
Owing to the presence of different bands with different wave-length region in the satellite images, efficiency of the algorithmsis effected and containing high resolution is one more cause ofinefficiency as a result it leads to computational complexity duringsegmentation. In case of satellite images, precisely finding the
3558 A.K. Bhandari et al. / Expert Systems with Applications 41 (2014) 3538–3560

object of interest in the existence of inherent uncertainty andambiguity is a challenging task in satellite image processing. Atpresent one is commonly faced with a situation that appealsappropriate segmentation. Multilevel thresholding can be usedprecisely to locate the area of interest, detect, identify and assistin the satellite image segmentation. Such suitable and accuratesplitting of a region can appreciably support the applications innumerous fields ranging amongst agriculture, defense, geology,environmental science, etc. Usually, an image holds several ill-de-fined and ambiguous areas. The grey value allocated to a pixel isalso the typical reflectance of many kinds of land covers. Therefore,appointing proper group labels with firmness is an inherent prob-lem for satellite images.
6. Conclusion
In this study, CS, ELR-CS and WDO algorithms with Kapur’smethod are exploited to maximize the Kapur’s entropy to find opti-mum multilevel thresholds. The results evaluated by statisticaltools suggest that the CS algorithm with the Kapur’s entropy crite-rion can be efficiently used in multilevel thresholding for satelliteimage segmentation. When the number of thresholds is two,ELR-CS algorithm and WDO algorithm can be used effectively butin case of five level of threshold, cuckoo search algorithm outper-form with slight margin. For the entire test of satellite images thathave been considered, the CS performs as well as, or is better thanthe ELR-CS and WDO. The study of results suggests that CS, ELR-CSand WDO would be the good methods to use in situations whereobjective function evaluations are computationally expensive overother evolutionary technique. The numerical illustrations for mostof the sample images, considered in this paper, demonstrate thatthe CS outperforms over WDO at high numbers of iteration andperforms comparably well elsewhere. However, the computationcomplexity is a little high because of using 3000 iteration in favorof CS. On the other hand, only 500 iteration has been needed to ob-tain comparative result in case of WDO. Fidelity assessments sug-gest that the cuckoo search and WDO may be the best method ofchoice for satellite image segmentation in combination with theKapur’s criteria. The best part of WDO is its computational effi-ciency over cuckoo search whereas CS is better in the accuracyand keeping features after segmentation. In addition, cuckoosearch algorithm is efficiently used for persevering edge informa-tion after segmentation by selection of optimized thresholds.
Previous optimal thresholding methods are very effective in bi-level thresholding case, while they cost exponential time in case ofmultilevel thresholding. To make the optimal thresholding meth-ods more practical, a fast scheme has been employed to executethese methods using CS algorithm. In this paper, a distinct studyon the application of CS, which is inspired by the lifestyle of a bird
called cuckoo, and WDO algorithm which is inspired by theatmospheric motion, is made using Kapur’s entropy for multilevelthresholding for image segmentation. The experimental results re-veal that the CS algorithms using Kapur’s entropy criterion can beefficiently used in multilevel thresholding. The Cuckoo searchalgorithm seems to be very effective over other optimizationtechniques as it involves only few parameters for tuning. Theadvantage of Kapur’s entropy is that it uses a global and objectiveproperty of the histogram because of its general nature; this crite-rion can be used for segmentation purpose. The results were alsoevaluated in terms of PSNR, FSIM and SSIM as presented in Tables5–7. The validity and stability of the method is justified qualita-tively and quantitatively both.
The experimental result is very promising and it encouragesfuture research for applying CS and WDO to complex image pro-cessing, remote sensing and computer vision problems. The futurework will include introduction of multi-objective criteria formultilevel thresholding. Furthermore, WDO is very new type ofnature-inspired global optimization methodology based on theatmospheric motion which can be easily extended to other applica-tions of image processing like satellite image enhancement, imageclassification and other satellite image application. In addition, theperformance of different objective functions such as Otsu’s meth-od, Tsallis entropy, minimum cross entropy and Renyi’s entropycan be estimated using these two robust techniques for standardset of images as well as for satellite images.
References
Agrawal, S., Panda, R., Bhuyan, S., & Panigrahi, B. K. (2013). Tsallis entropy basedoptimal multilevel thresholding using cuckoo search algorithm. Swarm andEvolutionary Computation, 11, 16–30.
Ahrens, C. D. (2007). Meteorology today: an introduction to weather, climate, andthe environment, Cengage, Learning.
Akay, B. (2013). A study on particle swarm optimization and artificial bee colonyalgorithms for multilevel thresholding. Applied Soft Computing, 13(6),3066–3091.
Bayraktar, Z., Komurcu, M., & Werner, D. H. (2010). Wind driven optimization(WDO): A novel nature-inspired optimization algorithm and its application toelectromagnetics. In Proceeding IEEE international symposium on antennas andpropagation society (APSURSI) (pp. 1–4).
Bayraktar, Z., Komurcu, M., Jiang, Z. H., Werner, D. H., & Werner, P. L. (2011). Stub-loaded inverted-F antenna synthesis via wind driven optimization. InProceeding IEEE international symposium on antennas and propagation(APSURSI) (pp. 2920–2923).
Bayraktar, Z., Komurcu, M., Bossard, J., & Werner, D. (2013). The wind drivenoptimization technique and its application in electromagnetics. IEEETransactions on Antennas and Propagation, 61(5), 2745–2757.
Bayraktar, Z., Turpin, J. P., & Werner, D. H. (2011). Nature-inspired optimization ofhigh-impedance metasurfaces with ultra-small interwoven unit cells. IEEEAntennas and Wireless Propagation Letters, 10, 1563–1566.
Bhandari, A. K., Kumar, A., & Padhy, P. K. (2011). Enhancement of low contrastsatellite images using discrete cosine transform and singular valuedecomposition. World Academy of Science, Engineering and Technology, 55,35–41.
Civicioglu, P., & Besdok, E. (2013). A conceptual comparison of the cuckoo-search,particle swarm optimization, differential evolution and artificial bee colonyalgorithms. Artificial Intelligence Review, 1–32.
Cuevas, E., Sencion, F., Zaldivar, D., Perez-Cisneros, M., & Sossa, H. (2012). A multi-threshold segmentation approach based on artificial bee colony optimization.Applied Intelligence, 37(3), 321–336.
Cuevas, E., Sención-Echauri, F., Zaldivar, D., & Pérez, M. (2013). Image segmentationusing artificial Bee colony optimization. In Handbook of optimization. Intelligentsystems reference library (Vol. 38, pp. 965–990). Berlin Heidelberg: Springer.
Dirami, A., Hammouchea, K., Diaf, M., & Siarry, P. (2013). Fast multilevelthresholding for image segmentation through a multiphase level set method.Signal Processing, 93, 139–153.
Eberhart, R. C., & Shi, Y. (2001). Particle swarm optimization: developments,applications and resources. In Proceeding IEEE international conference onevolutionary computation (Vol. 1, pp. 81–86).
Gandomi, A. H., Yang, X. S., & Alavi, A. H. (2013a). Cuckoo search algorithm: ametaheuristic approach to solve structural optimization problems. Engineeringwith Computers, 29(1), 17–35.
Gandomi, A. H., Yang, X. S., Talatahari, S., & Alavi, A. H. (2013b). Firefly algorithmwith chaos. Communications in Nonlinear Science and Numerical Simulation,18(1), 89–98.
Table 8Thematic bands of NASA are as LANDSAT satellite.
BandNo.
Name Wavelength(lm)
Characteristics and use
1 Visible blue 0.45–0.52 Maximum water penetration2 Visible green 0.52–0.60 Good for measuring plant
vigor3 Visible blue 0.63–0.69 Vegetation discrimination4 Near infrared 0.76–0.90 Biomass and shoreline
mapping5 Middle
infrared1.55–1.75 Moisture content of soil
6 Thermalinfrared
10.4–12.5 Soil moisture, thermalmapping
7 Middleinfrared
2.08–2.35 Mineral mapping
A.K. Bhandari et al. / Expert Systems with Applications 41 (2014) 3538–3560 3559
Gandomi, A. H., Yang, X. S., Talatahari, S., & Deb, S. (2012). Coupled eagle strategyand differential evolution for unconstrained and constrained globaloptimization. Computers & Mathematics with Applications, 63(1), 191–200.
Ghamisi, P., Couceiro, M. S., Benediktsson, J. A., & Ferreira, N. M. (2012). An efficientmethod for segmentation of images based on fractional calculus and naturalselection. Expert Systems with Applications, 39(16), 12407–12417.
Ghamisi, P., Couceiro, M. S., Martins, F. M., & Benediktsson, J. A. (2013). Multilevelimage segmentation based on fractional-order Darwinian particle swarmoptimization. IEEE Transactions on Geoscience and Remote Sensing, 1–13.
Hammouche, K., Diaf, M., & Siarry, P. (2008). A multilevel automatic thresholdingmethod based on a genetic algorithm for a fast image segmentation. ComputerVision and Image Understanding, 109(2), 163–175.
Hammouche, K., Diaf, M., & Siarry, P. (2010). A comparative study of various meta-heuristic techniques applied to the multilevel thresholding problem’.Engineering Applications of Artificial Intelligence, 23(5), 676–688.
Haupt, R. L., & Haupt, S. E. (2004). Practical genetic algorithms (second ed.). NewJersey: John Wiley & Sons.
Horng, M.-H. (2010). Multilevel minimum cross entropy threshold selection basedon the honey bee mating optimization. Expert Systems with Applications, 37,4580–4592.
Horng, M. H. (2011). Multilevel thresholding selection based on the artificial beecolony algorithm for image segmentation. Expert Systems with Applications,38(11), 13785–13791.
Horng, M. H. (2013). Multilevel minimum cross entropy image thresholding usingartificial bee colony algorithm. TELKOMNIKA Indonesian Journal of ElectricalEngineering, 11(9), 5229–5236.
Horng, M.-H., & Jiang, T.-W. (2010). Multilevel image thresholding selection usingthe artificial bee colony algorithm. Artificial Intelligence and ComputationalIntelligence, 6320, 318–325.
<http://earthobservatory.nasa.gov/>.Huang, D. Y., & Wang, C. H. (2009). Optimal multi-level thresholding using a two-
stage Otsu optimization approach. Pattern Recognition Letters, 30(3), 275–284.Kapur, J. N., Sahoo, P. K., & Wong, A. K. C. (1985). A new method for gray-level
picture thresholding using the entropy of the histogram. Computer VisionGraphics Image Processing, 29, 273–285.
Kennedy, J., & Eberhart, R. C. (1995). Particle swarm optimization. In IEEEinternational conference on neural networks (Vol. 4, 1942–1948).
Kittler, J., & Illingworth, J. (1986). Minimum error thresholding. Pattern Recognition,19, 41–47.
Kumar, A., Bhandari, A. K., & Padhy, P. (2012). Improved normalised differencevegetation index method based on discrete cosine transform and singular valuedecomposition for satellite image processing. IET Signal Processing, 6(7),617–625.
Kumar, S., Kumar, P., Sharma, T. K., & Pant, M. (2013). Bi-level thresholding usingPSO, artificial Bee colony and MRLDE embedded with Otsu method. MemeticComputing, 1–12.
Liao, P. S., Chen, T. S., & Chung, P. C. (2001). A fast algorithm for multilevelthresholding. Journal of Information Science and Engineering, 17(5), 713–727.
Liao, P.-S., Chung, P.-C., & Chen, T.-S. (2001). A fast algorithm for multilevelthresholding. Journal of Information Science and Engineering, 17, 713–727.
Lin, Z., Lei, Z., Xuanqin, M., & David Zhang, Z. (2011). FSIM: A feature similarity indexfor image quality assessment. IEEE Transactions on Image Processing, 20(8),2378–2386.
Maitra, M., & Chatterjee, A. (2008). A hybrid cooperative–comprehensive learningbased PSO algorithm for image segmentation using multilevel thresholding.Expert Systems with Applications, 34, 1341–1350.
Manikandan, S., Ramar, K., Iruthayarajan, M. W., & Srinivasagan, K. G. (2014).Multilevel thresholding for segmentation of medical brain images using realcoded genetic algorithm. Measurement, 47, 558–568.
Melo-Pinto, P., Couto, P., Bustince, H., Barrenechea, E., Pagola, M., & Fernandez, J.(2013). Image segmentation using Atanassov’s intuitionistic fuzzy sets. ExpertSystems with Applications, 40(1), 15–26.
Otsu, N. (1979). A threshold selection method from gray-level histograms. IEEETransactions on Systems Man and Cybernetics SMC, 9(1), 62–66.
Panda, R., Agrawal, S., & Bhuyan, S. (2013). Edge magnitude based multilevelthresholding using cuckoo search technique. Expert Systems with Applications,40(18), 7617–7628.
Payne, R. B., Sorenson, M. D., & Klitz, K. (2005). The cuckoos (Vol. 15). OxfordUniversity Press.
Penga, B., Zhang, L., & Zhang, D. (2013). A survey of graph theoretical approaches toimage segmentation. Pattern Recognition, 46(3), 1020–1038.
Rajabioun, R. (2011). Cuckoo optimization algorithm. Applied Soft Computing, 11(8),5508–5518.
Riehl, H. (1978). Introduction to the atmosphere. McGraw Hill.Robinson, J., & Rahmat-Samii, Y. (2004). Particle swarm optimization in
electromagnetics. IEEE Transactions Antennas Propagation, 52(2), 397–407.Sathya, P. D., & Kayalvizhi, R. (2010). Optimum multi level image thresholding
based on Tsallis entropy method with bacterial foraging algorithm. InternationalJournal of Computer Science, 7(5), 336–343.
Sathya, P. D., & Kayalvizhi, R. (2010). A new multilevel thresholding method usingswarm intelligence algorithm for image segmentation. Journal of IntelligentLearning Systems and Applications, 2, 126–138.
Sathya, P. D., & Kayalvizhi, R. (2011). Modified bacterial foraging algorithm basedmultilevel thresholding for image segmentation. Expert Systems withApplications, 24, 595–615.
Sathya, P. D., & Kayalvizhi, R. (2011). Optimal multilevel thresholding usingbacterial foraging algorithm. Expert Systems with Applications, 38(12),15549–15564.
Sathya, P. D., & Kayalvizhi, R. (2011). Optimal segmentation of brain MRI based onadaptive bacterial foraging algorithm. Neurocomputing, 74(14–15), 2299–2313.
Sezgin, M., & Sankur, B. (2004). Survey over image thresholding techniques andquantitative performance evaluation. Journal of Electronic Imaging, 13(1),146–165.
Soni, V., Bhandari, A. K., Kumar, A., & Singh, G. K. (2013). Improved sub-bandadaptive thresholding function for denoising of satellite image based onevolutionary algorithms. IET Signal Processing, 7(8), 720–730.
Tao, W., Jin, H., & Liu, L. (2007). Object segmentation using ant colony optimizationalgorithm and fuzzy entropy. Pattern Recognition Letters, 28(7), 788–796.
Tao, W. B., Tian, J. W., & Liu, J. (2003). Image segmentation by three-levelthresholding based on maximum fuzzy entropy and genetic algorithm. PatternRecognition Letters, 24(16), 3069–3078.
Thompson, R. D. (2002). Atmospheric processes and systems, Routledge Chicago.Tsai, W. (1985). Moment-preserving thresholding: A new approach. Computer Vision
Graphics and Image Processing, 29, 377–393.Wallace, J. M., & Hobbs, P. V. (2006). Atmospheric science: An introductory survey (Vol.
92). Academic press.Walton, S., Hassan, O., Morgan, K., & Brown, M. R. (2011). Modified cuckoo search: A
new gradient free optimization algorithm. Chaos, Solitons & Fractals, 44(9),710–718.
Xue, J. H., & Titterington, D. M. (2011). Median-based image thresholding. Image andVision Computing, 29(9), 631–637.
Yang, X. S. (2010). Nature-inspired metaheuristic algorithms. Luniver Press.Yang, X. S., & Deb, S. (2009). Cuckoo search via levey flights. In Proceedings of the
World congress on nature and biologically inspired computing (Vol. 4, pp. 210–214). NABIC: Coimbatore.
Yang, X. S., & Deb, S. (2010). Engineering optimization by cuckoo search.International Journal of Mathematical Modelling & Numerical Optimization, 1(4),330–343.
Ye, Z., Zheng, Z., Yu, X., & Ning, X. (2005). Automatic threshold selection based onant colony optimization algorithm. In Proceeding IEEE international conference onneural networks and brain (Vol. 2, pp. 728–732).
Yin, P-Y. (1999). A fast scheme for multilevel thresholding using genetic algorithms.Signal Processing, 72, 85–95.
Yin, P. Y. (2007). Multilevel minimum cross entropy threshold selection based onparticle swarm optimization. Applied Mathematics and Computation, 184(2),503–513.
Zhang, Y., & Wu, L. (2011). Optimal multi-level thresholding based on maximumTsallis entropy via an artificial bee colony approach. Entropy, 13, 841–859.
Zhou, W., Alan, C. B., Hamid, S. R., & Eero, S. P. (2004). Image quality assessment:From error visibility to structural similarity. IEEE Transactions on ImageProcessing, 13(4), 600–612.
3560 A.K. Bhandari et al. / Expert Systems with Applications 41 (2014) 3538–3560


![Controller Design of STATCOM for Power System … · than SVC [6, 7]. The STATCOM is based on the principle that a voltage source inverter generates ... differences between HBMO algorithm](https://img.dokumen.tips/doc/110x75/5b5db8887f8b9ac6028ef856/controller-design-of-statcom-for-power-system-than-svc-6-7-the-statcom-is.jpg)