Embed Size (px)
Citation preview

1 | P a g e
THE USE OF MOLECULAR LINE PROBE ASSAY FOR THE DETECTION OF RESISTANCE TO SECOND-LINE ANTI-TUBERCULOSIS DRUGS
EXPERT GROUP MEETING REPORT GENEVA: FEBRUARY 2013
This report contains the collective views of an international group of experts, and does not necessarily represent the decisions or the stated policy of the World Health Organization. Mention of a technology does not imply endorsement of any specific commercial product.

2 | P a g e
© World Health Organization 2013 All rights reserved. Publications of the World Health Organization are available on the WHO web site (www.who.int) or can be purchased from WHO Press, World Health Organization, 20 Avenue Appia, 1211 Geneva 27, Switzerland (tel.: +41 22 791 3264; fax: +41 22 791 4857; e-mail: [email protected]). Requests for permission to reproduce or translate WHO publications – whether for sale or for noncommercial distribution – should be addressed to WHO Press through the WHO web site (http://www.who.int/about/licensing/copyright_form/en/index.html). The designations employed and the presentation of the material in this publication do not imply the expression of any opinion whatsoever on the part of the World Health Organization concerning the legal status of any country, territory, city or area or of its authorities, or concerning the delimitation of its frontiers or boundaries. Dotted lines on maps represent approximate border lines for which there may not yet be full agreement. The mention of specific companies or of certain manufacturers’ products does not imply that they are endorsed or recommended by the World Health Organization in preference to others of a similar nature that are not mentioned. Errors and omissions excepted, the names of proprietary products are distinguished by initial capital letters. All reasonable precautions have been taken by the World Health Organization to verify the information contained in this publication. However, the published material is being distributed without warranty of any kind, either expressed or implied. The responsibility for the interpretation and use of the material lies with the reader. In no event shall the World Health Organization be liable for damages arising from its use.
WHO/HTM/TB/2013.01

3 | P a g e
Executive summary
Background Genotypic (molecular) methods have considerable advantages for scaling up programmatic management and surveillance of drug-resistant TB, offering speed of diagnosis, standardised testing, potential for high through-put, and fewer requirements for laboratory biosafety. Molecular line probe assay (LPA) technology for rapid detection of multi-drug resistant tuberculosis (MDR-TB) was endorsed by the World Health Organization (WHO) in 2008. In 2009, Hain Lifescience introduced a new LPA, the Genotype MTBDRsl® test, for the rapid determination of genetic mutations associated with resistance to fluoroquinolone, aminoglycosides (kanamycin, amikacin), cyclic peptides (capreomycin), ethambutol, and streptomycin. The assay format is similar to the Genotype MTBDRplus assay for the detection of mutations conferring rifampicin and isoniazid resistance, endorsed by WHO in 2008, and allows for testing and reporting results within 24 hours. In September 2010, FIND presented the results of its field evaluation studies to an Expert Group convened by WHO, that additionally considered data from other published and unpublished studies. The FIND studies were conducted at the US Centers for Disease Control and Prevention (CDC), the Korea International Tuberculosis Research Center (ITRC), and the University of Cape Town (UCT). The Expert Group concluded that although the available data suggested possible use of the assay for testing culture isolates, too few data on direct testing on sputum specimens were available to develop policy guidance on its use. As well as a paucity of data on direct testing, the Expert Group recommended that additional data from other geographic locations as well as genetic sequencing information from isolates with discordant LPA and phenotypic DST results were needed. Subsequently, FIND implemented a study of direct testing at ITRC (150 sputum specimens), at Hinduja Hospital in Mumbai, Infis (170 sputum specimens), and provided additional support to UCT for a study that included direct testing of 270 sputum specimens. In addition, the National Health Laboratory Services in Cape Town, South Africa, provided FIND with the results of direct testing on 657 specimens. In March 2012, WHO again convened an Expert Group that evaluated the utility of the Genotype MTBDRsl as a replacement test for conventional drug susceptibility testing (DST). This report summarizes the evidence evaluated by the Expert Group, from 11 published and 7 unpublished studies on the MTBDRsl® assay, including results from direct testing on clinical specimens and indirect testing of M. tuberculosis isolates. Pooled estimates for sensitivity and specificity for each class of second-line anti-TB drug were determined, for both direct and indirect testing.
Summary of results Diagnostic accuracy for the detection of fluoroquinolone resistance: Thirteen studies evaluated indirect testing for fluoroquinolone resistance among 2,354 individuals. Eight of these studies used a cross-sectional design and five studies used a case-control design. Sensitivity varied from 57.1% to 97.4% and specificity from 77.3% to 100.0%. One small study, Lacoma et al. 2011 (n=29) that evaluated DST for moxifloxacin, had outlier estimates for sensitivity (57.1%) and specificity (77.3%). When this study was excluded, the range in sensitivity and specificity estimates was still wide at 70.3% to 97.4% and 88.1% to 100% respectively. 11 studies specifically evaluated ofloxacin resistance among 2,110 individuals. Sensitivity varied from 70.3% to 97.4% and specificity from 88.1% to 100.0%. Seven studies evaluated the diagnostic accuracy for the detection of fluoroquinolone resistance with direct testing among 1,121 individuals. Sensitivity varied from 37.5%-100.0% and specificity from 93.7% to 100.0%. Six of these studies specifically evaluated ofloxacin resistance among 1,069

4 | P a g e
individuals. Sensitivity varied from 68.2% to 100.0% and specificity from 93.7% to 100.0%. One small study, Lacoma et al. 2011 (n=52) that evaluated DST for moxifloxacin, had a sensitivity estimate of 37.5%. When this study was excluded, the range in sensitivity estimates remained wide at 68.2% to 100.0%. Overall, indirect testing for fluoroquinolones showed a pooled sensitivity of 88.8% (95%CI 82.7, 92.9) and pooled specificity of 97.9% (95% CI 94.8, 99.2). Direct testing for fluoroquinolones showed a pooled sensitivity of 83.5% (95%CI 69.1, 91.9) and pooled specificity of 97.4% (95% CI 95.7, 98.4). Diagnostic accuracy for the detection of kanamycin resistance Ten studies evaluated indirect testing for kanamycin resistance among 1,976 individuals. Six of these studies used a cross-sectional design and four studies used a case-control design. Sensitivity varied from 25.0% to 100.0% and specificity from 86.4% to 100%. Four studies evaluated the diagnostic accuracy for the detection of kanamycin resistance with direct testing among 400 individuals. Sensitivity varied from 25.0% to 100.0% and specificity from 86.4% to 100.0%. Overall, indirect testing showed a pooled sensitivity of 67.0% (95%CI 50.4, 80.2) and pooled specificity of 99.4% (95% CI 97.0, 99.9). Direct testing showed a pooled sensitivity of 96.2% (95%CI 67.5, 99.7) and pooled specificity of 99.0% (95% CI 78.4, 100.0). Diagnostic accuracy for the detection of amikacin resistance Seven studies evaluated indirect testing for amikacin resistance among 1,213 individuals. Four of these studies used a cross-sectional design and three studies used a case-control design. Sensitivity varied from 80.4% to 100.0% and specificity from 94.2% to 100%. Six cross-sectional studies evaluated the diagnostic accuracy for the detection of kanamycin resistance with direct testing among 1021 individuals. Sensitivity varied from 75.0% to 100.0% and specificity from 89.4% to 100.0%. Overall, indirect testing showed a pooled sensitivity of 89.6% (95%CI 84.0, 93.5) and pooled specificity of 99.5% (95% CI 96.1, 100). Direct testing showed a pooled sensitivity of 93.2% (95%CI 76.8, 98.3) and pooled specificity of 99.4% (95% CI 95.7, 100.0). Diagnostic accuracy for the detection of capreomycin resistance Nine studies evaluated indirect testing for capreomycin resistance among 1,539 individuals. Five of these studies used a cross-sectional design and four studies used a case-control design. Sensitivity varied from 21.2% to 100.0% and specificity from 80.5% to 100%. Four studies, predominately cross-sectional in design, evaluated the diagnostic accuracy for the detection of capreomycin resistance with direct testing among 461 individuals. Sensitivity varied from 66.7%-100.0% and specificity from 86.2% to 100.0%. Overall, indirect testing showed a pooled sensitivity of 80.3% (95%CI 64.7, 90.1) and pooled specificity of 97.1% (95% CI 92.5, 98.9). Direct testing showed a pooled sensitivity of 97.4% (95%CI 70.4, 99.8) and pooled specificity of 96.6% (95% CI 88.9, 99.0). Diagnostic accuracy for the detection of extensively drug resistant – TB (XDR-TB) Six predominately cross-sectional studies evaluated the utility of indirect testing for the detection of XDR-TB among 1,652 individuals. One study used a case-control design. Sensitivity varied from 22.6% to 100.0% and specificity from 93.9% to 100%. Four studies with cross-sectional design evaluated the diagnostic accuracy for the detection of XDR-TB with direct testing among 840 individuals. Sensitivity varied from 80.0%-95.2% and specificity from 91.8% to 100.0%.

5 | P a g e
Overall, indirect testing showed a pooled sensitivity of 63.3% (95%CI 36.8, 83.5) and pooled specificity of 98.5% (95% CI 96.0, 99.4). Direct testing showed a pooled sensitivity of 90.2% (95%CI 79.0, 95.8) and pooled specificity of 96.6% (95% CI 93.8, 99.9).
Expert Group findings The Expert Group concluded that the Genotype MTBDRsl assay shows moderate test sensitivity for the detection of fluoroquinolone and second-line injectable resistance, with high test specificity. There was significant heterogeneity in the sensitivity for the detection of kanamycin across studies, resulting in the assay being considered to be insufficient. Despite high pooled specificity estimates for all second-line drugs evaluated, the lower pooled sensitivity estimates mean that negative results for resistance cannot be considered to reliably rule-out resistance, as rates of false-negative results were variable among the reported studies and quite high for the detection of resistance to kanamycin. The Expert Group found that while the test has the potential to be used as a rule-in test for XDR-TB where capacity to use line probe assays is available, it cannot be used as a replacement test for conventional phenotypic drug susceptibility testing (DST). Furthermore, the Expert Group noted that there is incomplete cross-resistance between the second-line injectables, and that the assay does not allow for specific resistance to individual second-line injectables to be determined. Due to the concerns regarding incomplete cross-resistance, the Expert Group concluded that the results of the Genotype MTBDRsl assay could not be reliably used to adjust and optimize a Category IV treatment regimen1. The Expert Group noted that given high assay specificity for detecting resistance to fluoroquinolones and second-line injectables the results of the Genotype MTBDRsl assay could be used to guide the implementation of additional infection control precautions pending the results of phenotypic DST results.
Furthermore, the Expert Group also concluded that phenotypic DST should remain the reference standard for XDR-TB until more data are available, and that countries without LPA capacity should not invest resources in establishing Genotype MTBDRsl capacity in the interim. The GRADE process was used to evaluate the quality of the evidence presented to the Expert Group to determine the suitability of Genotype MTBDRsl® assay as a replacement test for conventional phenotypic second-line DST. The quality of evidence was determined to be very low quality. The evidence was downgraded due to inconsistency in the results across studies, imprecision in the confidence intervals for pooled sensitivity and specificity estimates and for indirectness.
Expert Group Recommendations
The Expert Group recommended that the Genotype MTBDRsl assay cannot be used as a replacement test for conventional phenotypic DST
Strong recommendation - Very Low Quality of Evidence
Remarks:
1. The Genotype MTBDRsl may be used as a rule-in test for XDR-TB but cannot be used to define XDR-TB for surveillance purposes;
2. As cross-resistance between the second-line injectables is incomplete, the Genotype MTBDRsl cannot be used to identify individual drugs to be used for treatment;
1 World Health Organization. Guidelines for the programmatic management of drug-resistant tuberculosis – 2011 update.
WHO/HTM/TB 2011.6. Geneva, Switzerland: WHO, 2011

6 | P a g e
3. The Genotype MTBDRsl may be used to guide infection control precautions while awaiting confirmatory results from conventional phenotypic testing.

7 | P a g e
Contents 1. BACKGROUND .................................................................................................................................... 10 2. EVIDENCE SYNTHESIS ......................................................................................................................... 11
2.1 Meeting objectives ...................................................................................................................... 12 2.2 GRADE evaluation ....................................................................................................................... 12 2.3 Meeting procedural issues .......................................................................................................... 15
3. FINDINGS ............................................................................................................................................ 15 3.1 Diagnostic accuracy for the detection of fluoroquinolone resistance. ............................................ 15 3.2 Diagnostic accuracy for the detection of kanamycin resistance ...................................................... 17 3.3 Diagnostic accuracy for the detection of amikacin resistance ......................................................... 18 3.4 Diagnostic accuracy for the detection of capreomycin resistance ................................................... 19 3.5 Diagnostic accuracy for the detection of XDR-TB ............................................................................. 20
4. GRADE evidence profile and summary of test accuracy .................................................................... 20 4.1 Grade evidence profiles .............................................................................................................. 20 4.2 Quality of Evidence ..................................................................................................................... 22 4.3 Expert Group Findings ................................................................................................................. 22 4.4 Expert Group Recommendations ..................................................................................................... 22
4. Annexes .............................................................................................................................................. 46 Annex 1. LIST OF PARTICIPANTS ............................................................................................................. 46 Annex 2. Meeting Agenda ...................................................................................................................... 49 Annex 3: Declarations of Interest ........................................................................................................... 51 Annex 4. Published and Unpublished stuidies ....................................................................................... 52

8 | P a g e
List of Tables
Table 1: QUADAS-2 Assessment Tool (Source: http://www.bris.ac.uk/quadas/quadas-2) ....................... 13 Table 2: Significance of the four levels of evidence .................................................................................... 14 Table 3: Sensitivity and specificity estimates (and 95%CI) for studies using indirect testing with the Genotype MTBDRsl for the detection of fluoroquinolone resistance as compared to phenotypic drug-susceptibility testing. (TP, True Positive; FP, False Positive; FN, False Negative; TN, True Negative) ........ 15 Table 4: Sensitivity and specificity estimates (and 95%CI) for studies using indirect testing with the Genotype MTBDRsl for the detection of ofloxacin resistance as compared to phenotypic drug-susceptibility testing. (TP, True Positive; FP, False Positive; FN, False Negative; TN, True Negative) ........ 16 Table 5: Sensitivity and specificity estimates (and 95%CI) for studies using direct testing with the Genotype MTBDRsl for the detection of fluoroquinolone resistance as compared to phenotypic drug-susceptibility testing. (TP, True Positive; FP, False Positive; FN, False Negative; TN, True Negative) ........ 16 Table 6: Sensitivity and specificity estimates (and 95%CI) for studies using direct testing with the Genotype MTBDRsl for the detection of ofloxacin resistance as compared to phenotypic drug-susceptibility testing. (TP, True Positive; FP, False Positive; FN, False Negative; TN, True Negative) ........ 17 Table 7: Sensitivity and specificity estimates (and 95%CI) for studies using indirect testing with the Genotype MTBDRsl for the detection of kanamycin resistance as compared to phenotypic drug-susceptibility testing. (TP, True Positive; FP, False Positive; FN, False Negative; TN, True Negative) ........ 17 Table 8: Sensitivity and specificity estimates (and 95%CI) for studies using direct testing with the Genotype MTBDRsl for the detection of kanamycin resistance as compared to phenotypic drug-susceptibility testing. (TP, True Positive; FP, False Positive; FN, False Negative; TN, True Negative) ........ 18 Table 9: Sensitivity and specificity estimates (and 95%CI) for studies using indirect testing with the Genotype MTBDRsl for the detection of amikacin resistance as compared to phenotypic drug-susceptibility testing. (TP, True Positive; FP, False Positive; FN, False Negative; TN, True Negative) ........ 18 Table 10: Sensitivity and specificity estimates (and 95%CI) for studies using direct testing with the Genotype MTBDRsl for the detection of amikacin resistance as compared to phenotypic drug-susceptibility testing. (TP, True Positive; FP, False Positive; FN, False Negative; TN, True Negative) ........ 19 Table 11: Sensitivity and specificity estimates (and 95%CI) for studies using indirect testing with the Genotype MTBDRsl for the detection of capreomycin resistance as compared to phenotypic drug-susceptibility testing. (TP, True Positive; FP, False Positive; FN, False Negative; TN, True Negative) ........ 19 Table 12: Sensitivity and specificity estimates (and 95%CI) for studies using direct testing with the Genotype MTBDRsl for the detection of capreomycin resistance as compared to phenotypic drug-susceptibility testing. (TP, True Positive; FP, False Positive; FN, False Negative; TN, True Negative) ........ 19 Table 13: Sensitivity and specificity estimates (and 95%CI) for studies using indirect testing with the Genotype MTBDRsl for the detection of XDR-TB as compared to phenotypic drug-susceptibility testing. (TP, True Positive; FP, False Positive; FN, False Negative; TN, True Negative) .............................. 20 Table 14: Sensitivity and specificity estimates (and 95%CI) for studies using direct testing with the Genotype MTBDRsl for the detection of XDR-TB as compared to phenotypic drug-susceptibility testing. (TP, True Positive; FP, False Positive; FN, False Negative; TN, True Negative) .............................. 20 Table 15: GRADE Evidence Profiles: GenoType® MTBDRsl assay as a replacement test for conventional DST for fluoroquinolone resistance (published and unpublished studies) ........................... 23 Table 16: GRADE Evidence Profiles: GenoType® MTBDRsl assay as a replacement test for conventional DST for ofloxacin resistance (published and unpublished studies) ...................................... 26 Table 17: GRADE Evidence Profiles: GenoType® MTBDRsl assay as a replacement test for conventional DST for kanamycin resistance (published and unpublished studies).................................... 29 Table 18: GRADE Evidence Profiles: GenoType® MTBDRsl assay as a replacement test for conventional DST for amikacin resistance (published and unpublished studies) ...................................... 32 Table 19: GRADE Evidence Profiles: GenoType® MTBDRsl assay as a replacement test for conventional DST for capreomycin resistance (published and unpublished studies) ................................ 35

9 | P a g e
Table 20: GRADE Evidence Profiles: GenoType® MTBDRsl assay as a replacement test for conventional DST for the diagnosis of XDR-TB (published and unpublished studies) ................................ 38 Table 21: GRADE Summary of Findings Table: GenoType® MTBDRsl assay (published and unpublished studies). ....................................................................................................................................................... 41 List of Figures Figure 1: Genotype MTBDRsl® assay format (Available at: http://www.hain-lifescience.de/en/products/microbiology/mycobacteria/genotype-mtbdrsl.htm) ................................... 11

10 | P a g e
THE USE OF MOLECULAR LINE PROBE ASSAY FOR THE DETECTION OF RESISTANCE TO SECOND-LINE ANTI-TUBERCULOSIS DRUGS
1. BACKGROUND
Genotypic (molecular) methods have considerable advantages for scaling up programmatic management and surveillance of drug-resistant TB, offering speed of diagnosis, standardised testing, potential for high through-put, and fewer requirements for laboratory biosafety. Molecular line probe assay (LPA) technology for rapid detection of multi-drug resistant tuberculosis (MDR-TB) was endorsed by WHO in 2008. LPA technology involves the following steps: First, DNA is extracted from M. tuberculosis isolates (indirect testing) or directly from clinical specimens (direct testing). Next, polymerase chain reaction (PCR) amplification of the resistance-determining region of the gene under question is performed using biotinylated primers. Following amplification, labeled PCR products are hybridized with specific oligonucleotide probes immobilized on a strip. Captured labeled hybrids are detected by colorimetric development, enabling detection of the presence of M. tuberculosis complex, as well as the presence of wild-type and mutation probes for resistance. If a mutation is present in one of the target regions, the amplicon will not hybridize with the relevant probe. Mutations are therefore detected by lack of binding to wild-type probes, as well as by binding to specific probes for the most commonly occurring mutations. The post hybridization reaction leads to the development of coloured bands on the strip at the site of probe binding. In 2009, Hain Lifescience introduced a new LPA, the Genotype MTBDRsl® test, for the rapid determination of genetic mutations associated with resistance to fluoroquinolones, aminoglycosides (kanamycin, amikacin), cyclic peptides (capreomycin), ethambutol, and streptomycin. The identification of resistance to fluoroquinolones is enabled by the detection of the most significant mutations of the gyrA gene (coding for DNA gyrase). For the detection of resistance to aminoglycosides/cyclic peptides, the 16S rRNA gene (rrs) and for detection of resistance to ethambutol the embB gene (which, together with the genes embA and embC, codes for arabinosyl transferase) are examined. The assay format is similar to the Genotype MTBDRplus assay for the detection of mutations conferring rifampicin and isoniazid resistance, endorsed by WHO in 2008, and allows for testing and reporting results within 24 hours. (Figure 1)

11 | P a g e
Figure 1: Genotype MTBDRsl
® assay format (Available at: http://www.hain-
lifescience.de/en/products/microbiology/mycobacteria/genotype-mtbdrsl.htm)
In September 2010, FIND presented the results of its field evaluation studies to an Expert Group convened by WHO, that additionally considered data from other published and unpublished studies. The FIND studies were conducted at the US Centers for Disease Control and Prevention (CDC), the Korea International Tuberculosis Research Center (ITRC), and the University of Cape Town (UCT). The Expert Group concluded that although the available data suggested possible use of the assay for testing culture isolates, too few data on direct testing on sputum specimens were available to develop policy guidance on its use. As well as a paucity of data on direct testing, the Expert Group recommended that additional data from other geographic locations as well as genetic sequencing information from isolates with discordant LPA and phenotypic DST results were needed. Subsequently, FIND implemented a study of direct testing at ITRC (150 sputum specimens), at Hinduja Hospital in Mumbai, India (170 sputum specimens), and provided additional support to UCT for a study that included direct testing of 270 sputum specimens. In addition, the National Health Laboratory Services in Cape Town, SA, provided FIND with the results of direct testing on 657 specimens.
2. EVIDENCE SYNTHESIS
In order to facilitate rapid policy guidance on the use of new diagnostic tools, new methods, and/or novel approaches using existing tools, WHO has developed a systematic, structured, evidence-based process. The first step involves a systematic review of available data, using standard methods appropriate for diagnostic accuracy studies. The second step involves the convening of an Expert Group to evaluate the strength of the evidence base and recommend operational and logistical considerations for mainstreaming such tools/approaches into national TB control programmes, and/or identify gaps to be addressed in future research. The third step involves WHO policy guidance on the use of these tools/approaches, presented to the WHO Strategic and Technical

12 | P a g e
Advisory Group for TB (STAG-TB) for endorsement, and subsequent dissemination to Member States for implementation.
This document presents the findings and recommendations from the Expert Group meeting on the Genotype MTBDRsl® assay convened by WHO in Geneva, Switzerland on 21st March 2012. The Expert Group (Annex 1) consisted of researchers, clinicians, epidemiologists, end-users (programme and laboratory representatives), a community representative and an evidence synthesis expert. The Expert Group meeting followed a structured agenda (Annex 2) and was co-chaired by WHO and a clinical epidemiologist with expertise and extensive experience in evidence synthesis and guideline development.
2.1 Meeting objectives
To review available data from laboratory validation and field evaluation studies on the performance characteristics of MTBDRsl® line probe assay, for the diagnosis of second-line drug resistance;
To outline issues to be addressed by WHO in subsequent policy recommendations
2.2 GRADE evaluation
To comply with current standards for evidence assessment in formulation of policy recommendations, the GRADE system (www.gradeworkinggroup.org), adopted by WHO for all policy and guidelines development,2 was used. The GRADE approach, assessing both the quality of evidence and strength of recommendations, aims to provide a comprehensive and transparent approach for developing policy guidance.
The Expert Group reviewed the evidence from all known published and unpublished evaluations of the Genotype MTBDRsl® assay (Annex 3).
Evaluation of the available evidence followed the GRADE system for grading quality of evidence and strength of recommendations for diagnostic tests, based on the formulation of an a priori agreed question (the PICO question) by the Expert Group. PICO refers to elements that should be in a question governing a systematic search of the evidence. Elements of PICO for this review are defined below.
Types of studies: randomized controlled trials, cross-sectional studies, cohort studies, and case-control studies
Population targeted by the action/intervention: Persons suspected of having pulmonary TB with resistance to second-line anti-TB drugs;
Intervention being considered: Genotype MTBDRsl® assay
Outcome: Diagnostic accuracy of Genotype MTBDRsl® assay (sensitivity, specificity) Target conditions: fluoroquinolone resistance: ofloxacin resistance; kanamycin resistance; amikacin resistance; capreomycin resistance; XDR-TB Reference standard: Conventional second-line drug susceptibility testing (DST) Purpose of testing: Genotype MTBDRsl® assay as a replacement test for conventional second-line DST
The quality of evidence was evaluated according to six criteria:
2 World Health Organization. Handbook for Guideline Development, 2012. World Health Organization: Geneva.

13 | P a g e
Overall study design: Cross-sectional (preferred): Random or consecutive selection of patients/specimens at risk; Case-control: Selection of patients/specimens according to reference standard.
Limitations (as reflected by the QUADAS-2 tool3): assessment of studies for risk of bias in four domains: patient selection, index test, reference standard, and flow and timing, (Table 1).
Directness: Presence of direct evidence of impact on patient-important outcomes and generalisability.
Inconsistency: Unexplained inconsistency in sensitivity or specificity estimates.
Imprecision: Wide confidence intervals for pooled sensitivity or specificity estimates.
Publication bias: Publications of research based on their nature and outcome, e.g. studies showing poor performance not being published, language bias, etc.
Table 1: QUADAS-2 Assessment Tool (Source: http://www.bris.ac.uk/quadas/quadas-2)
DOMAIN PATIENT SELECTION INDEX TEST REFERENCE
STANDARD FLOW AND TIMING
Description Describe methods of patient selection: Describe included patients (prior testing, presentation, intended use of index test and setting):
Describe the index test and how it was conducted and interpreted:
Describe the reference standard and how it was conducted and interpreted:
Describe any patients who did not receive the index test(s) and/or reference standard or who were excluded from the 2x2 table (refer to flow diagram): Describe the time interval and any interventions between index test(s) and reference standard:
Signalling questions (yes/no/unclear)
Was a consecutive or random sample of patients enrolled?
Were the index test results interpreted without knowledge of the results of the reference standard?
Is the reference standard likely to correctly classify the target condition?
Did all patients receive a reference standard?
Was a case-control design avoided?
If a threshold was used, was it pre-specified?
Were the reference standard results interpreted without knowledge of the results of the index test?
Did all patients receive the same reference standard?
Did the study avoid inappropriate exclusions?
Were all patients included in the analysis?
Risk of bias: High/low/unclear
Could the selection of patients have introduced bias?
Could the conduct or interpretation of the index test have introduced bias?
Could the reference standard, its conduct, or its interpretation have introduced bias?
Could the patient flow have introduced bias?
Concerns regarding applicability: High/low/unclear
Are there concerns that the included patients do not match
Are there concerns that the index test, its conduct, or
Are there concerns that the target condition as
3 Whiting PF, Rutjes AW, Westwood ME, Mallett S, Deeks JJ, Reitsma JB, et al. QUADAS-2: a revised tool for the quality assessment of diagnostic accuracy studies. Annals of Internal Medicine 2011;155(8):529–36.

14 | P a g e
the review question? interpretation differ from the review question?
defined by the reference standard does not match the review question?
QUADAS-2 consists of four domains: patient selection, index test, reference standard, and flow and timing. All domains were assessed for the potential for risk of bias. Core signalling questions were used for each domain to form judgments about the risk of bias. As there is currently overlap between GRADE and QUADAS-2 regarding applicability, applicability concerns were considered under ‘indirectness’ in the GRADE profiles.
GRADE categorises the quality of evidence as high, moderate, low or very low (Table 2). These quality ratings apply to the body of evidence assessed for the PICO question and not to individual studies.
Table 2: Significance of the four levels of evidence
(Source: World Health Organization. Handbook for Guideline Development, 2012. World Health Organization: Geneva). Quality Definition Implications
High The guideline development group is very confident that the true effect lies close to that of the estimate of effect
Further research is very unlikely to change confidence in the estimate of effect
Moderate The guideline development group is moderately confident in the effect estimate: the true effect is likely to be close to the estimate of effect, but there is a possibility that it is substantially different
Further research is likely to have an important impact on confidence in the estimate of effect and may change the estimate
Low Confidence in the effect estimate is limited: the true effect may be substantially different from the estimate of the true effect
Further research is very likely to have an important impact on confidence in the estimate of effect and is likely to change the estimate
Very low The group has very little confidence in the effect estimate: the true effect is likely to be substantially different from the estimate of effect
Any estimate of effect is very uncertain
As called for by GRADE, the Expert Group also considered the strength of the recommendation (strong or conditional), based on a balance of effects (advantages weighed against disadvantages), patient values and preferences, and costs. The GRADE process also assesses the impact on an intervention on patient-important outcomes and the generalisability of results to the target population, the diagnostic test used, the comparator to the test and whether tests were directly or indirectly compared.

15 | P a g e
Given the absence of relevant data from the studies reviewed, assumed patient values and preferences were assessed by test accuracy as a proxy measure, based on the relative importance/impact of false-positive and false-negative results:
True positives: Benefit to patients and community from earliest diagnosis and treatment;
True negatives: Patients spared unnecessary treatment; benefit of reassurance and alternative diagnosis;
False positives: Likely patient anxiety and morbidity from additional testing, unnecessary treatment; may halt further diagnostic evaluation;
False negatives: Increased risk of patient morbidity and mortality, and continued risk of community transmission of TB.
Details of the GRADE assessment for the Genotype MTBDRsl® assay are provided in section 4.
2.3 Meeting procedural issues
FIND prepared a summary report which was made available to the Expert Group for scrutiny before the meeting. As agreed, interchange by Expert Group meeting participants was restricted to those who attended the Expert Group meeting in person, both for the discussion and follow-up dialogue. The Expert Group members were familiar with the GRADE process and had completed an online course on GRADE prior to the meeting.
Expert Group members were asked to submit completed Declaration of Interest (DOI) forms. These were reviewed by the WHO Legal Department prior to the Expert Group meeting. A summary is attached in Annex 4. DOI statements were summarised by the co-chair (WHO-STB) of the Expert Group meeting at the start of the meeting.
Selected individuals with intellectual and/or research involvement in the Genotype MTBDRsl® assay were invited as observers to provide technical input and answer technical questions. These individuals did not participate in the GRADE evaluation process and were excluded from the Expert Group discussions when recommendations were developed.
3. FINDINGS
3.1 Diagnostic accuracy for the detection of fluoroquinolone resistance. Thirteen studies evaluated indirect testing for fluoroquinolone resistance among 2,354 individuals (Table 3). Eight of these studies used a cross-sectional design and five studies used a case-control design. Sensitivity varied from 57.1% to 97.4% and specificity from 77.3% to 100.0%. One small study, Lacoma et al. 2011 (n=29) that evaluated DST for moxifloxacin, had outlier estimates for sensitivity (57.1%) and specificity (77.3%). When this study was excluded, the range in sensitivity and specificity estimates was still wide at 70.3% to 97.4% and 88.1% to 100% respectively. 11 studies specifically evaluated ofloxacin resistance among 2,110 individuals. Sensitivity varied from 70.3% to 97.4% and specificity from 88.1% to 100.0% (Table 4).
Table 3: Sensitivity and specificity estimates (and 95%CI) for studies using indirect testing with the Genotype MTBDRsl for the detection of fluoroquinolone resistance as compared to phenotypic drug-susceptibility testing. (TP, True Positive; FP, False Positive; FN, False Negative; TN, True Negative)

16 | P a g e
Table 4: Sensitivity and specificity estimates (and 95%CI) for studies using indirect testing with the Genotype MTBDRsl for the detection of ofloxacin resistance as compared to phenotypic drug-susceptibility testing. (TP, True Positive; FP, False Positive; FN, False Negative; TN, True Negative)
Seven studies evaluated the diagnostic accuracy for the detection of fluoroquinolone resistance with direct testing among 1,121 individuals (Table 5). Sensitivity varied from 37.5%-100.0% and specificity from 93.7% to 100.0%. Six of these studies specifically evaluated ofloxacin resistance among 1,069 individuals. Sensitivity varied from 68.2% to 100.0% and specificity from 93.7% to 100.0%. One small study, Lacoma et al. 2011 (n=52) that evaluated DST for moxifloxacin, had a sensitivity estimate of 37.5%. When this study was excluded, the range in sensitivity estimates remained wide at 68.2% to 100.0%.
Table 5: Sensitivity and specificity estimates (and 95%CI) for studies using direct testing with the Genotype MTBDRsl for the detection of fluoroquinolone resistance as compared to phenotypic drug-susceptibility testing. (TP, True Positive; FP, False Positive; FN, False Negative; TN, True Negative)
17 | P a g e
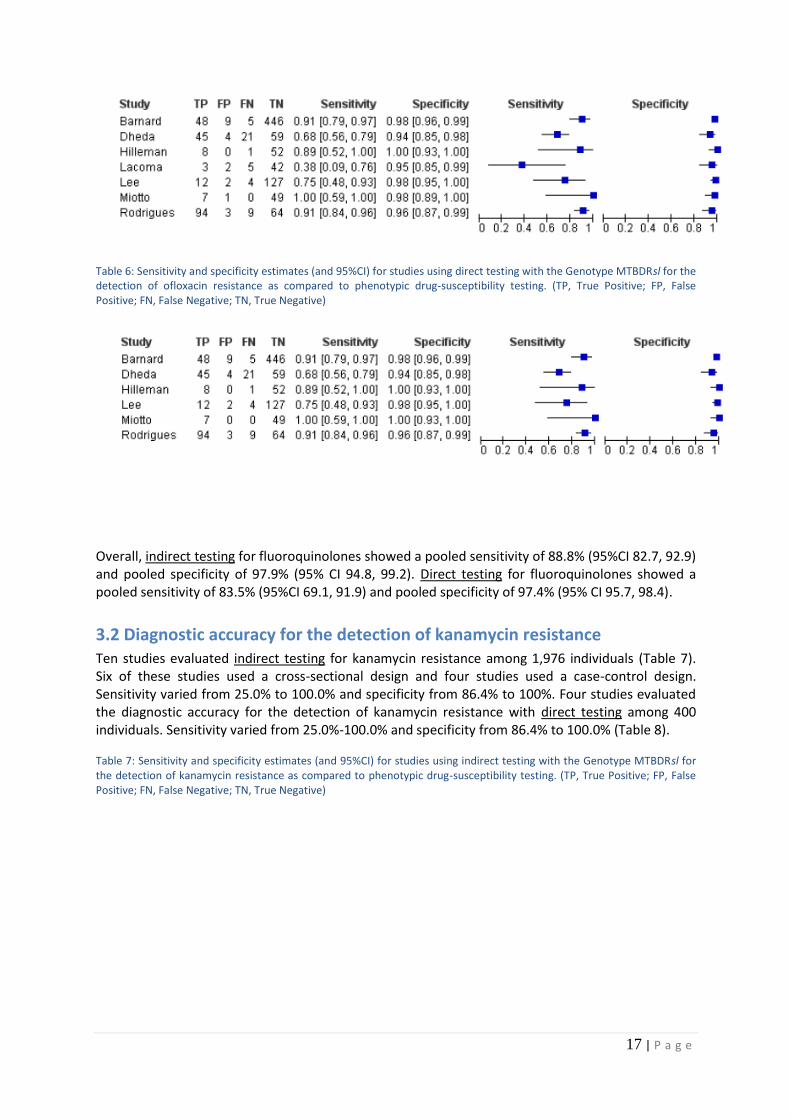
Table 6: Sensitivity and specificity estimates (and 95%CI) for studies using direct testing with the Genotype MTBDRsl for the detection of ofloxacin resistance as compared to phenotypic drug-susceptibility testing. (TP, True Positive; FP, False Positive; FN, False Negative; TN, True Negative)
Overall, indirect testing for fluoroquinolones showed a pooled sensitivity of 88.8% (95%CI 82.7, 92.9) and pooled specificity of 97.9% (95% CI 94.8, 99.2). Direct testing for fluoroquinolones showed a pooled sensitivity of 83.5% (95%CI 69.1, 91.9) and pooled specificity of 97.4% (95% CI 95.7, 98.4).
3.2 Diagnostic accuracy for the detection of kanamycin resistance Ten studies evaluated indirect testing for kanamycin resistance among 1,976 individuals (Table 7). Six of these studies used a cross-sectional design and four studies used a case-control design. Sensitivity varied from 25.0% to 100.0% and specificity from 86.4% to 100%. Four studies evaluated the diagnostic accuracy for the detection of kanamycin resistance with direct testing among 400 individuals. Sensitivity varied from 25.0%-100.0% and specificity from 86.4% to 100.0% (Table 8).
Table 7: Sensitivity and specificity estimates (and 95%CI) for studies using indirect testing with the Genotype MTBDRsl for the detection of kanamycin resistance as compared to phenotypic drug-susceptibility testing. (TP, True Positive; FP, False Positive; FN, False Negative; TN, True Negative)

18 | P a g e
Table 8: Sensitivity and specificity estimates (and 95%CI) for studies using direct testing with the Genotype MTBDRsl for the detection of kanamycin resistance as compared to phenotypic drug-susceptibility testing. (TP, True Positive; FP, False Positive; FN, False Negative; TN, True Negative)
Overall, indirect testing showed a pooled sensitivity of 67.0% (95%CI 50.4, 80.2) and pooled specificity of 99.4% (95% CI 97.0, 99.9). Direct testing showed a pooled sensitivity of 96.2% (95%CI 67.5, 99.7) and pooled specificity of 99.0% (95% CI 78.4, 100.0).
3.3 Diagnostic accuracy for the detection of amikacin resistance Seven studies evaluated indirect testing for amikacin resistance among 1,213 individuals (Table 9). Four of these studies used a cross-sectional design and three studies used a case-control design. Sensitivity varied from 80.4% to 100.0% and specificity from 94.2% to 100%. Six cross-sectional studies evaluated the diagnostic accuracy for the detection of amikacin resistance with direct testing among 1021 individuals (Table 10). Sensitivity varied from 75.0%-100.0% and specificity from 89.4% to 100.0%.
Table 9: Sensitivity and specificity estimates (and 95%CI) for studies using indirect testing with the Genotype MTBDRsl for the detection of amikacin resistance as compared to phenotypic drug-susceptibility testing. (TP, True Positive; FP, False Positive; FN, False Negative; TN, True Negative)

19 | P a g e
Table 10: Sensitivity and specificity estimates (and 95%CI) for studies using direct testing with the Genotype MTBDRsl for the detection of amikacin resistance as compared to phenotypic drug-susceptibility testing. (TP, True Positive; FP, False Positive; FN, False Negative; TN, True Negative)
Overall, indirect testing showed a pooled sensitivity of 89.6% (95%CI 84.0, 93.5) and pooled specificity of 99.5% (95% CI 96.1, 100). Direct testing showed a pooled sensitivity of 93.2% (95%CI 76.8, 98.3) and pooled specificity of 99.4% (95% CI 95.7, 100.0).
3.4 Diagnostic accuracy for the detection of capreomycin resistance Nine studies evaluated indirect testing for capreomycin resistance among 1,539 individuals (Table 11). Five of these studies used a cross-sectional design and four studies used a case-control design. Sensitivity varied from 21.2% to 100.0% and specificity from 80.5% to 100%. Four studies, predominately cross-sectional in design, evaluated the diagnostic accuracy for the detection of capreomycin resistance with direct testing among 461 individuals (Table 12). Sensitivity varied from 66.7%-100.0% and specificity from 86.2% to 100.0%.
Table 11: Sensitivity and specificity estimates (and 95%CI) for studies using indirect testing with the Genotype MTBDRsl for the detection of capreomycin resistance as compared to phenotypic drug-susceptibility testing. (TP, True Positive; FP, False Positive; FN, False Negative; TN, True Negative)
Table 12: Sensitivity and specificity estimates (and 95%CI) for studies using direct testing with the Genotype MTBDRsl for the detection of capreomycin resistance as compared to phenotypic drug-susceptibility testing. (TP, True Positive; FP, False Positive; FN, False Negative; TN, True Negative)

20 | P a g e
Overall, indirect testing showed a pooled sensitivity of 80.3% (95%CI 64.7, 90.1) and pooled specificity of 97.1% (95% CI 92.5, 98.9). Direct testing showed a pooled sensitivity of 97.4% (95%CI 70.4, 99.8) and pooled specificity of 96.6% (95% CI 88.9, 99.0).
3.5 Diagnostic accuracy for the detection of XDR-TB Six predominately cross-sectional studies evaluated the utility of indirect testing for the detection of XDR-TB among 1,652 individuals (Table13). One study used a case-control design. Sensitivity varied from 22.6% to 100.0% and specificity from 93.9% to 100%. Four studies with cross-sectional design evaluated the diagnostic accuracy for the detection of XDR-TB with direct testing among 840 individuals (Table 14). Sensitivity varied from 80.0%-95.2% and specificity from 91.8% to 100.0%.
Table 13: Sensitivity and specificity estimates (and 95%CI) for studies using indirect testing with the Genotype MTBDRsl for the detection of XDR-TB as compared to phenotypic drug-susceptibility testing. (TP, True Positive; FP, False Positive; FN, False Negative; TN, True Negative)
Table 14: Sensitivity and specificity estimates (and 95%CI) for studies using direct testing with the Genotype MTBDRsl for the detection of XDR-TB as compared to phenotypic drug-susceptibility testing. (TP, True Positive; FP, False Positive; FN, False Negative; TN, True Negative)
Overall, indirect testing showed a pooled sensitivity of 63.3% (95%CI 36.8, 83.5) and pooled specificity of 98.5% (95% CI 96.0, 99.4). Direct testing showed a pooled sensitivity of 90.2% (95%CI 79.0, 95.8) and pooled specificity of 96.6% (95% CI 93.8, 99.9).
4. GRADE EVIDENCE PROFILE AND SUMMARY OF TEST ACCURACY
4.1 Grade evidence profiles
The GRADE process was used to evaluate the quality of the evidence presented to the Expert Group to determine the suitability of Genotype MTBDRsl® assay as a replacement test for conventional phenotypic second-line DST. Sensitivity and specificity of the Genotype MTBDRsl® assay was determined using phenotypic DST as the reference test. The meta-analyses and preparation of the

21 | P a g e
GRADE tables was performed by Karen R Steingart, MD, MPH, Editor, Cochrane Infectious Diseases Group, Liverpool, UK. The QUADAS-2 tool (Table 1) was used for assessing the quality of studies and for each outcome, quality of evidence started at high when there were randomized controlled trials or high quality observational studies (cross-sectional studies with diagnostic uncertainty and direct comparison of index test results with a reference standard) and at low for case-control studies. The quality of evidence was downgraded one point when there was a serious issue identified or two points when there was a very serious issue identified in any of the five following criteria used to judge the quality of evidence: limitations, indirectness, inconsistency, imprecision, and publication bias
Study limitations
Of the thirteen studies evaluated, eight used a cross-sectional design and five studies used a case-control design. Using the QUADAS-2 tool the evidence was downgraded by one point if more than 50% of studies did not explicitly report blinding and by one point if more than 50% of studies did not report manner of patient selection or reported convenience sampling. Eleven of the thirteen studies selected samples in a consecutive or random manner. Nine studies reported blinding of MTBDRsl assay results to reference standard results. The risk of bias was of low concern.
Indirectness
Greater confidence is attributed to results when there is direct evidence. Uncertainty about directness for false negatives relates to possible detrimental effects from delayed diagnosis of drug resistance. Uncertainty about directness for false positives relates to unnecessary treatment with second line anti-TB drugs, potential for adverse events, and unnecessary use of health care resources. Diagnostic accuracy was considered as a surrogate for patient-important outcomes and hence the quality was downgraded one point for indirectness.
Inconsistency in results across studies
Inconsistency refers to the variations in sensitivity or specificity estimates across studies. Inconsistency was assessed by visual inspection of forest plots of sensitivity and specificity estimates (Tables 3-14). Sensitivity varied from 57.1% to 97.4% and specificity from 77.3% to 100.0%. One small study Lacoma et al. 2011 (n=29) which evaluated DST for moxifloxacin, had a sensitivity estimate of 57.1% and specificity estimate of 77.3%. Nonetheless, if Lacoma were excluded, the range in sensitivity and specificity estimates was still wide, 70.3% to 97.4% and 88.1% to 100%, respectively. The variability in sensitivity and specificity estimates may be explained in part by inaccuracy of the phenotypic reference standard. Statistics used to measure heterogeneity in meta-analyses of randomized controlled trials, such as the I-squared statistic, were not considerable suitable for these meta-analyses of diagnostic test accuracy studies. Data quality was therefore downgraded one point for inconsistency.
Imprecision
Imprecision relates to the width of confidence intervals for pooled sensitivity or specificity estimates. The pooled sensitivity estimate had a very wide 95% confidence interval (greater than +/-10% of point estimate). Imprecision in summary estimates was a very serious concern and the evidence was downgraded two points.
Likelihood of publication bias
Unpublished studies were included. Data included did not allow for formal assessment of publication bias using methods such as funnel plots or regression tests because such techniques have not been found to be helpful for diagnostic test accuracy studies. However, being a new test for which there has been considerable attention and scrutiny, reporting bias was considered to be minimal.

22 | P a g e
4.2 Quality of Evidence
FINAL GRADING OF QUALITY OF EVIDENCE: VERY LOW
The GRADE evidence summary is presented in Tables 15-21.
4.3 Expert Group Findings
The Expert Group concluded that the Genotype MTBDRsl assay shows moderate test sensitivity for the detection of fluoroquinolone and second-line injectable resistance, with high test specificity. There was significant heterogeneity in the sensitivity for the detection of kanamycin across studies, resulting in the assay being considered to be insufficient. Despite high pooled specificity estimates for all second-line drugs evaluated, the lower pooled sensitivity estimates mean that negative results for resistance cannot be considered to reliably rule-out resistance, as rates of false-negative results were variable among the reported studies and quite high for the detection of resistance to kanamycin. The Expert Group found that while the test has the potential to be used as a rule-in test for XDR-TB where capacity to use line probe assays is available, it cannot be used as a replacement test for conventional phenotypic drug susceptibility testing (DST). Furthermore, the Expert Group noted that there is incomplete cross-resistance between the second-line injectables, and that the assay does not allow for specific resistance to individual second-line injectables to be determined. Due to the concerns regarding incomplete cross-resistance, the Expert Group concluded that the results of the Genotype MTBDRsl assay could not be reliably used to adjust and optimize a Category IV treatment regimen. The Expert Group noted that given high assay specificity for detecting resistance to fluoroquinolones and second-line injectables the results of the Genotype MTBDRsl assay could be used to guide the implementation of additional infection control precautions pending the results of phenotypic DST results.
Furthermore, the Expert Group also concluded that phenotypic DST should remain the reference standard for XDR-TB until more data are available, and that countries without LPA capacity should not invest resources in establishing Genotype MTBDRsl capacity in the interim.
4.4 Expert Group Recommendations The Expert Group recommended that the Genotype MTBDRsl assay cannot be used as a replacement test for conventional phenotypic DST
Strong recommendation - Very Low Quality of Evidence
Remarks:
1. The Genotype MTBDRsl may be used as a rule-in test for XDR-TB but cannot be used to define XDR-TB for surveillance purposes;
2. As cross-resistance between the second-line injectables is incomplete, the Genotype MTBDRsl cannot be used to identify individual drugs to be used for treatment;
3. The Genotype MTBDRsl may be used to guide infection control precautions while awaiting confirmatory results from conventional phenotypic testing.

23 | P a g e
Table 15: GRADE Evidence Profiles: GenoType® MTBDRsl assay as a replacement test for conventional DST for fluoroquinolone resistance (published and unpublished studies)
No of
Participants
(Studies)
Study Design Limitations Indirectness Inconsistency Imprecision Publication
Bias
Quality of
Evidence
(GRADE)
Importance
Outcome: Diagnostic accuracy for detection of fluoroquinolone resistance, indirect testing
True positives
921
(13)
Cross-sectional
and case-controlA1
No serious
limitationsA2
Serious
indirectnessA3
(-1)
Serious
inconsistencyA4
(-1)
Serious
imprecisionA5
(-1)
UndetectedA6
Very low
Critical
(7-9)
True negatives
1292
(13)
Cross-sectional
and case-controlA1
No serious
limitationsA2
Serious
indirectnessA3
(-1)
Serious
inconsistencyA4
(-1)
Serious
imprecisionA5
(-1)
UndetectedA6
Very low
Critical
(7-9)
False positives
48
(13)
Cross-sectional
and case-controlA1
No serious
limitationsA2
Serious
indirectnessA3
(-1)
Serious
inconsistencyA4
(-1)
Serious
imprecisionA5
(-1)
UndetectedA6
Very low
Critical
(7-9)
False negatives
93
(13)
Cross-sectional
and case-controlA1
No serious
limitationsA2
Serious
indirectnessA3
(-1)
Serious
inconsistencyA4
(-1)
Serious
imprecisionA5
(-1)
UndetectedA6
Very low
Critical
(7-9)
Outcome: Diagnostic accuracy for detection of fluoroquinolone resistance, direct testing
True positives
217
(7)
Mainly cross-
sectionalB1
No serious
limitationsB2
Serious
indirectnessB3
(-1)
Serious
inconsistencyB4
(-1)
Very serious
imprecisionB5
(-2)
UndetectedB6
Very low
Critical
(7-9)
True negatives
839
(7)
Mainly cross-
sectionalB1
No serious
limitationsB2
Serious
indirectnessB3
(-1)
Serious
inconsistencyB4
(-1)
Very serious
imprecisionB5
(-2)
UndetectedB6
Very low
Critical
(7-9)
False positives
20
(7)
Mainly cross-
sectionalB1
No serious
limitationsB2
Serious
indirectnessB3
(-1)
Serious
inconsistencyB4
(-1)
Very serious
imprecisionB5
(-2)
UndetectedB6
Very low
Critical
(7-9)
False negatives

24 | P a g e
45
(7)
Mainly cross-
sectionalB1
No serious
limitationsB2
Serious
indirectnessB3
(-1)
Serious
inconsistencyB4
(-1)
Very serious
imprecisionB5
(-2)
UndetectedB6
Very low
Critical
(7-9)
Indirect testing based on pooled sensitivity 88.8% (95% CI 82.7, 92.9) and pooled specificity 97.9% (95% CI 94.8, 99.2)
Direct testing based on pooled sensitivity 83.5 % (95% CI 69.1, 91.9) and pooled specificity 97.4% (95% CI 95.7, 98.4)
Footnotes 1 For each outcome, quality of evidence started at high when there were randomized controlled trials or high quality observational studies (cross-sectional studies with diagnostic
uncertainty and direct comparison of index test results with a reference standard) and at low for case-control studies. We then downgraded one point when there was a serious issue
identified or two points when there was a very serious issue identified in any of the five following criteria used to judge the quality of evidence: limitations, indirectness,
inconsistency, imprecision, and publication bias.
A1 8/13 of studies used a cross-sectional design; 5/13 studies used a case-control design.
A2 We assessed study limitations using the QUADAS-2 tool. We downgraded the evidence by 1 point if > 50% of studies did not explicitly report blinding and by 1 point if > 50% of
studies did not report manner of patient selection or reported convenience sampling. 11/13 studies selected samples in a consecutive or random manner. 9/13 studies reported
blinding of MTBDRsl assay results to reference standard results. We had low concern about risk of bias. A3
Uncertainty about directness for false negatives relates to possible detrimental effects from delayed diagnosis of drug resistance. Uncertainty about directness for false positives
relates to unnecessary treatment with second line anti-TB drugs, potential for adverse events, and unnecessary use of health care resources. Diagnostic accuracy was considered as a
surrogate for patient-important outcomes; therefore, we downgraded 1 point. A4
Heterogeneity was assessed by visual inspection of forest plots of sensitivity and specificity estimates. Sensitivity varied from 57.1% to 97.4% and specificity from 77.3% to
100.0%. One small study Lacoma et al 2011 (n=29) that evaluated DST for moxifloxacin, had a sensitivity estimate of 57.1% and specificity estimate of 77.3%. Nonetheless, if
Lacoma were excluded, the range in sensitivity and specificity estimates was still wide, 70.3% to 97.4% and 88.1% to 100%, respectively. The variability in sensitivity and
specificity estimates may be explained in part by inaccuracy of the phenotypic reference standard. Statistics used to measure heterogeneity in meta-analyses of randomized controlled
trials, such as the I-squared statistic, were not considerable suitable for these meta-analyses of diagnostic test accuracy studies. We downgraded 1 point. A5
The pooled sensitivity estimate had a wide 95% confidence interval (> +/-5% of point estimate). We downgraded 1 point. A6
Unpublished studies were included. Data included do not allow for formal assessment of publication bias using methods such as funnel plots or regression tests because such
techniques have not been found to be helpful for diagnostic test accuracy studies. However, being a new test for which there is going to be considerable attention and scrutiny, we
believe reporting bias will be minimal.
B1
6/7 studies used a cross-sectional design and 1/7 studies used a case-control design B2
We assessed study limitations using the QUADAS-2 tool. We downgraded the evidence by 1 point if > 50% of studies did not explicitly report blinding and by 1 point if > 50% of
studies did not report manner of patient selection or reported convenience sampling. All studies selected samples in a consecutive or random manner. All studies reported blinding of
MTBDRsl assay results to reference standard results. We had low concern about risk of bias. B3
Uncertainty about directness for false negatives relates to possible detrimental effects from delayed diagnosis of drug resistance. Uncertainty about directness for false positives
relates to unnecessary treatment with second line anti-TB drugs, potential for adverse events, and unnecessary use of health care resources. Diagnostic accuracy was considered as a
surrogate for patient-important outcomes; therefore, we downgraded 1 point. B4
Heterogeneity was assessed by visual inspection of forest plots of sensitivity and specificity estimates. Sensitivity varied from 37.5% to 100.0% and specificity from 93.7% to
100.0%. One small study Lacoma et al 2011 (n=52) that evaluated DST for moxifloxacin, had a sensitivity estimate of 37.5%. Nonetheless, if Lacoma were excluded, the range in
sensitivity estimates was still wide, 68.2% to 100.0%. The variability in sensitivity may be explained in part by inaccuracy of the phenotypic reference standard. Statistics used to

25 | P a g e
measure heterogeneity in meta-analyses of randomized controlled trials, such as the I-squared statistic, were not considerable suitable for these meta-analyses of diagnostic test
accuracy studies. We downgraded 1 point. B5
The pooled sensitivity estimate had a very wide 95% confidence interval (> +/-10% of point estimate). We downgraded 2 points. B6
Unpublished studies were included. Data included do not allow for formal assessment of publication bias using methods such as funnel plots or regression tests because such
techniques have not been found to be helpful for diagnostic test accuracy studies. However, being a new test for which there is going to be considerable attention and scrutiny, we
believe reporting bias will be minimal.

26 | P a g e
Table 16: GRADE Evidence Profiles: GenoType® MTBDRsl assay as a replacement test for conventional DST for ofloxacin resistance (published and unpublished studies)
No of
Participants
(Studies)
Study Design Limitations Indirectness Inconsistency Imprecision Publication
Bias
Quality of
Evidence
(GRADE)
Importance
Outcome: Diagnostic accuracy for detection of ofloxacin resistance, indirect testing
True positives
842
(11)
Cross-sectional
and case-controlC1
No serious
limitationsC2
Serious
indirectnessC3
(-1)
Serious
inconsistencyC4
(-1)
Serious
imprecisionC5
(-1)
UndetectedC6
Very low
Critical
(7-9)
True negatives
1181
(11)
Cross-sectional
and case-controlC1
No serious
limitationsC2
Serious
indirectnessC3
(-1)
Serious
inconsistencyC4
(-1)
Serious
imprecisionC5
(-1)
UndetectedC6
Very low
Critical
(7-9)
False positives
38
(11)
Cross-sectional
and case-controlC1
No serious
limitationsC2
Serious
indirectnessC3
(-1)
Serious
inconsistencyC4
(-1)
Serious
imprecisionC5
(-1)
UndetectedC6
Very low
Critical
(7-9)
False negatives
84
(11)
Cross-sectional
and case-controlC1
No serious
limitationsC2
Serious
indirectnessC3
(-1)
Serious
inconsistencyC4
(-1)
Serious
imprecisionC5
(-1)
UndetectedC6
Very low
Critical
(7-9)
Outcome: Diagnostic accuracy for detection of ofloxacin resistance, direct testing
True positives
214
(6)
Cross-sectionalD1
No serious
limitationsD2
Serious
indirectnessD3
(-1)
Serious
inconsistencyD4
(-1)
Serious
imprecisionD5
(-1)
UndetectedD6
Very low
Critical
(7-9)
True negatives
797
(6)
Cross-sectionalD1
No serious
limitationsD2
Serious
indirectnessD3
(-1)
Serious
inconsistencyD4
(-1)
Serious
imprecisionD5
(-1)
UndetectedD6
Very low
Critical
(7-9)
False positives
18
(6)
Cross-sectionalD1
No serious
limitationsD2
Serious
indirectnessD3
(-1)
Serious
inconsistencyD4
(-1)
Serious
imprecisionD5
(-1)
UndetectedD6
Very low
Critical
(7-9)
False negatives

27 | P a g e
40
(6)
Cross-sectionalD1
No serious
limitationsD2
Serious
indirectnessD3
(-1)
Serious
inconsistencyD4
(-1)
Serious
imprecisionD5
(-1)
UndetectedD6
Very low
Critical
(7-9)
Indirect testing based on pooled sensitivity 89.0% (95% CI 82.5, 93.3) and pooled specificity 98.4% (95% CI 95.9, 99.4)
Direct testing based on pooled sensitivity 87.3% (95% CI 76.2, 93.6) and pooled specificity 97.8% (95% CI 96.0, 98.8)
Footnotes 1 For each outcome, the quality of evidence started at high when there were randomized controlled trials or high quality observational studies (cross-sectional studies with diagnostic
uncertainty and direct comparison of index test results with a reference standard) and at low for case-control studies. We then downgraded one point when there was a serious issue
identified or two points when there was a very serious issue identified in any of the five following criteria used to judge the quality of evidence: limitations, indirectness,
inconsistency, imprecision, and publication bias.
C1 7/11 studies used a cross-sectional design; 4/11 studies used a case-control design.
C2 We assessed study limitations using the QUADAS-2 tool. We downgraded the evidence by 1 point if > 50% of studies did not explicitly report blinding and by 1 point if > 50% of
studies did not report manner of patient selection or reported convenience sampling. 9/11 studies selected samples in a consecutive or random manner; in 2/11 studies, the manner of
sample selection was not reported. 7/11 studies reported blinding of MTBDRsl assay results to reference standard results. We had low concern about risk of bias. C3
Uncertainty about directness for false negatives relates to possible detrimental effects from delayed diagnosis of drug resistance. Uncertainty about directness for false positives
relates to unnecessary treatment with second line anti-TB drugs, potential for adverse events, and unnecessary use of health care resources. Diagnostic accuracy was considered as a
surrogate for patient-important outcomes; therefore, we downgraded 1 point. C4
Heterogeneity was assessed by visual inspection of forest plots of sensitivity and specificity estimates. Sensitivity varied from 70.3% to 97.4% and specificity from 88.1% to
100.0%. The variability in sensitivity and specificity estimates may be explained in part by inaccuracy of the phenotypic reference standard. Statistics used to measure heterogeneity
in meta-analyses of randomized controlled trials, such as the I-squared statistic, were not considerable suitable for these meta-analyses of diagnostic test accuracy studies. We
downgraded 1 point. C5
The pooled sensitivity estimate had a wide narrow 95% confidence interval (> +/-5% of point estimate). We downgraded 1 point. C6
Unpublished studies were included. Data included do not allow for formal assessment of publication bias using methods such as funnel plots or regression tests because such
techniques have not been found to be helpful for diagnostic test accuracy studies. However, being a new test for which there is going to be considerable attention and scrutiny, we
believe reporting bias will be minimal.
D1
All studies used a cross-sectional design. D2
We assessed study limitations using the QUADAS-2 tool. We downgraded the evidence by 1 point if > 50% of studies did not explicitly report blinding and by 1 point if > 50% of
studies did not report manner of patient selection or reported convenience sampling. All studies selected samples in a consecutive or random manner. All studies reported blinding of
results to reference standard results. We had low concern about risk of bias. D3
Uncertainty about directness for false negatives relates to possible detrimental effects from delayed diagnosis of drug resistance. Uncertainty about directness for false positives
relates to unnecessary treatment with second line anti-TB drugs, potential for adverse events, and unnecessary use of health care resources. Diagnostic accuracy was considered as a
surrogate for patient-important outcomes; therefore, we downgraded 1 point. D4
Heterogeneity was assessed by visual inspection of forest plots of sensitivity and specificity estimates. Sensitivity varied from 68.2% to 100.0% and specificity from 93.7% to
100.0%. The variability in sensitivity may be explained in part by inaccuracy of the phenotypic reference standard. Statistics used to measure heterogeneity in meta-analyses of
randomized controlled trials, such as the I-squared statistic, were not considerable suitable for these meta-analyses of diagnostic test accuracy studies. We downgraded 1 point. D5
The pooled sensitivity estimate had a wide 95% confidence interval (~ +/-10% of point estimate). We downgraded 1 point.

28 | P a g e
D6 Unpublished studies were included. Data included do not allow for formal assessment of publication bias using methods such as funnel plots or regression tests because such
techniques have not been found to be helpful for diagnostic test accuracy studies. However, being a new test for which there is going to be considerable attention and scrutiny, we
believe reporting bias will be minimal.

29 | P a g e
Table 17: GRADE Evidence Profiles: GenoType® MTBDRsl assay as a replacement test for conventional DST for kanamycin resistance (published and unpublished studies)
No of
Participants
(Studies)
Study Design Limitations Indirectness Inconsistency Imprecision Publication
Bias
Quality of
Evidence
(GRADE)
Importance
Outcome: Diagnostic accuracy for detection of kanamycin resistance, indirect testing
True positives
301
(10)
Cross-sectional and
case-controlE1
No serious
limitationsE2
Serious
indirectnessE3
(-1)
Very serious
inconsistencyE4
(-2)
Very serious
imprecisionE5
(-2)
UndetectedE6
Very Low
Critical
(7-9)
True negatives
1465
(10)
Cross-sectional and
case-controlE1
No serious
limitationsE2
Serious
indirectnessE3
(-1)
Very serious
inconsistencyE4
(-2)
Very serious
imprecisionE5
(-2)
UndetectedE6
Very Low
Critical
(7-9)
False positives
21
(10)
Cross-sectional and
case-controlE1
No serious
limitationsE2
Serious
indirectnessE3
(-1)
Very serious
inconsistencyE4
(-2)
Very serious
imprecisionE5
(-2)
UndetectedE6
Very Low
Critical
(7-9)
False negatives
189
(10)
Cross-sectional and
case-controlE1
No serious
limitationsE2
Serious
indirectnessE3
(-1)
Very serious
inconsistencyE4
(-2)
Very serious
imprecisionE5
(-2)
UndetectedE6
Very Low
Critical
(7-9)
Outcome: Diagnostic accuracy for detection of kanamycin resistance, direct testing
True positives
58
(4)
Mainly cross-
sectionalF1
No serious
limitationsF2
Serious
indirectnessF3
(-1)
Serious
inconsistencyF4
(-1)
Very serious
imprecisionF5
(-2)
UndetectedF6
Very Low
Critical
(7-9)
True negatives
330
(4)
Mainly cross-
sectionalF1
No serious
limitationsF2
Serious
indirectnessF3
(-1)
Serious
inconsistencyF4
(-1)
Very serious
imprecisionF5
(-2)
UndetectedF6
Very Low
Critical
(7-9)
False positives
8
(4)
Mainly cross-
sectionalF1
No serious
limitationsF2
Serious
indirectnessF3
(-1)
Serious
inconsistencyF4
(-1)
Very serious
imprecisionF5
(-2)
UndetectedF6
Very Low
Critical
(7-9)
False negatives

30 | P a g e
4
(4)
Mainly cross-
sectionalF1
No serious
limitationsF2
Serious
indirectnessF3
(-1)
Serious
inconsistencyF4
(-1)
Very serious
imprecisionF5
(-2)
UndetectedF6
Very Low
Critical
(7-9)
Indirect testing based on pooled sensitivity 67.0% (95% CI 50.4, 80.2) and pooled specificity 99.4% (95% CI 97.0, 99.9)
Direct testing based on pooled sensitivity 96.2% (95% CI 67.5, 99.7) and pooled specificity 99.0% (95% CI 78.4, 100.0)
Footnotes 1 For each outcome, quality of evidence started at high when there were randomized controlled trials or high quality observational studies (cross-sectional studies with diagnostic
uncertainty and direct comparison of index test results with a reference standard) and at low for case-control studies. We then downgraded one point when there was a serious issue
identified or two points when there was a very serious issue identified in any of the five following criteria used to judge the quality of evidence: limitations, indirectness,
inconsistency, imprecision, and publication bias.
E1 6/10 studies used a cross-sectional design; 4/10 studies used a case-control design.
E2 We assessed study limitations using the QUADAS-2 tool. We downgraded the evidence by 1 point if > 50% of studies did not explicitly report blinding and by 1 point if > 50% of
studies did not report manner of patient selection or reported convenience sampling. 8/10 studies selected samples in a consecutive or random manner. 7/10 studies reported blinding
of MTBDRsl assay results to reference standard results. We had low concern about risk of bias. E3
Uncertainty about directness for false negatives relates to possible detrimental effects from delayed diagnosis of drug resistance. Uncertainty about directness for false positives
relates to unnecessary treatment with second line anti-TB drugs, potential for adverse events, and unnecessary use of health care resources. Diagnostic accuracy was considered as a
surrogate for patient-important outcomes; therefore, we downgraded 1 point. E4
Heterogeneity was assessed by visual inspection of forest plots of sensitivity and specificity estimates. Sensitivity varied from 25.0% to 100.0% and specificity from 86.4% to
100.0%. The variability in sensitivity and specificity estimates may be explained in part by inaccuracy of the phenotypic reference standard. Statistics used to measure heterogeneity
in meta-analyses of randomized controlled trials, such as the I-squared statistic, were not considerable suitable for these meta-analyses of diagnostic test accuracy studies. We
downgraded 2 points. E5
The pooled sensitivity estimate had a very wide 95% confidence interval (> +/-10% of point estimate). We downgraded 2 points. E6
Unpublished studies were included. Data included do not allow for formal assessment of publication bias using methods such as funnel plots or regression tests because such
techniques have not been found to be helpful for diagnostic test accuracy studies. However, being a new test for which there is going to be considerable attention and scrutiny, we
believe reporting bias will be minimal.
F1
3/4 studies used a cross-sectional design and 1/4 studies used a case-control study F2
We assessed study limitations using the QUADAS-2 tool. We downgraded the evidence by 1 point if > 50% of studies did not explicitly report blinding and by 1 point if > 50% of
studies did not report manner of patient selection or reported convenience sampling. All studies selected samples in a consecutive or random manner. All studies reported blinding of
MTBDRsl assay results to reference standard results. We had low concern about risk of bias. F3
Uncertainty about directness for false negatives relates to possible detrimental effects from delayed diagnosis of drug resistance. Uncertainty about directness for false positives
relates to unnecessary treatment with second line anti-TB drugs, potential for adverse events, and unnecessary use of health care resources. Diagnostic accuracy was considered as a
surrogate for patient-important outcomes; therefore, we downgraded 1 point. F4
Heterogeneity was assessed by visual inspection of forest plots of sensitivity and specificity estimates. Sensitivity varied from 66.7% to 100.0% and specificity from 86.2% to
100%. The variability in sensitivity and specificity may be explained in part by inaccuracy of the phenotypic reference standard. Statistics used to measure heterogeneity in meta-
analyses of randomized controlled trials, such as the I-squared statistic, were not considerable suitable for these meta-analyses of diagnostic test accuracy studies. We downgraded 1
point.

31 | P a g e
F5 Both pooled sensitivity and specificity estimates had very wide 95% confidence intervals (> +/-10% of point estimate). We downgraded 2 points.
F6 Unpublished studies were included. Data included do not allow for formal assessment of publication bias using methods such as funnel plots or regression tests because such
techniques have not been found to be helpful for diagnostic test accuracy studies. However, being a new test for which there is going to be considerable attention and scrutiny, we
believe reporting bias will be minimal.

32 | P a g e
Table 18: GRADE Evidence Profiles: GenoType® MTBDRsl assay as a replacement test for conventional DST for amikacin resistance (published and unpublished studies)
No of
Participants
(Studies)
Study Design Limitations Indirectness Inconsistency Imprecision Publication
Bias
Quality of
Evidence
(GRADE)
Importance
Outcome: Diagnostic accuracy for detection of amikacin resistance, indirect testing
True positives
361
(7)
Cross-sectional and
case-controlG1
No serious
limitationsG2
Serious
indirectnessG3
(-1)
Serious
inconsistencyG4
(-1)
Serious
imprecisionG5
(-1)
UndetectedG6
Very Low
Critical
(7-9)
True negatives
801
(7)
Cross-sectional and
case-controlG1
No serious
limitationsG2
Serious
indirectnessG3
(-1)
Serious
inconsistencyG4
(-1)
Serious
imprecisionG5
(-1)
UndetectedG6
Very Low
Critical
(7-9)
False positives
13
(7)
Cross-sectional and
case-controlG1
No serious
limitationsG2
Serious
indirectnessG3
(-1)
Serious
inconsistencyG4
(-1)
Serious
imprecisionG5
(-1)
UndetectedG6
Very Low
Critical
(7-9)
False negatives
38
(7)
Cross-sectional and
case-controlG1
No serious
limitationsG2
Serious
indirectnessG3
(-1)
Serious
inconsistencyG4
(-1)
Serious
imprecisionG5
(-1)
UndetectedG6
Very Low
Critical
(7-9)
Outcome: Diagnostic accuracy for detection of amikacin resistance, direct testing
True positives
123
(6)
Cross-sectionalH1
No serious
limitationsH2
Serious
indirectnessH3
(-1)
Serious
inconsistencyH4
(-1)
Very serious
imprecisionH5
(-2)
UndetectedH6
Very Low
Critical
(7-9)
True negatives
875
(6)
Cross-sectionalH1
No serious
limitationsH2
Serious
indirectnessH3
(-1)
Serious
inconsistencyH4
(-1)
Very serious
imprecisionH5
(-2)
UndetectedH6
Very Low
Critical
(7-9)
False positives
9
(6)
Cross-sectionalH1
No serious
limitationsH2
Serious
indirectnessH3
(-1)
Serious
inconsistencyH4
(-1)
Very serious
imprecisionH5
(-2)
UndetectedH6
Very Low
Critical
(7-9)
False negatives

33 | P a g e
14
(6)
Cross-sectionalH1
No serious
limitationsH2
Serious
indirectnessH3
(-1)
Serious
inconsistencyH4
(-1)
Very serious
imprecisionH5
(-2)
UndetectedH6
Very Low
Critical
(7-9)
Indirect testing based on pooled sensitivity 89.6% (95% CI 84.0, 93.5) and pooled specificity 99.5% (95% CI 96.1, 100.0)
Direct testing based on pooled sensitivity 93.2% (95% CI 76.8, 98.3) and pooled specificity 99.4% (95% CI 95.7, 100.0)
Footnotes
1 For each outcome, quality of evidence started at high when there were randomized controlled trials or high quality observational studies (cross-sectional studies with diagnostic
uncertainty and direct comparison of index test results with a reference standard) and at low for case-control studies. We then downgraded one point when there was a serious issue
identified or two points when there was a very serious issue identified in any of the five following criteria used to judge the quality of evidence: limitations, indirectness,
inconsistency, imprecision, and publication bias.
G1 4/7 studies used a cross-sectional design; 3/7 studies used a case-control design.
G2 We assessed study limitations using the QUADAS-2 tool. We downgraded the evidence by 1 point if > 50% of studies did not explicitly report blinding and by 1 point if > 50% of
studies did not report manner of patient selection or reported convenience sampling. 6/7 studies selected samples in a consecutive or random manner. 6/7 studies reported blinding of
MTBDRsl assay results to reference standard results. We had low concern about risk of bias. G3
Uncertainty about directness for false negatives relates to possible detrimental effects from delayed diagnosis of drug resistance. Uncertainty about directness for false positives
relates to unnecessary treatment with second line anti-TB drugs, potential for adverse events, and unnecessary use of health care resources. Diagnostic accuracy was considered as a
surrogate for patient-important outcomes; therefore, we downgraded 1 point. G4
Heterogeneity was assessed by visual inspection of forest plots of sensitivity and specificity estimates. Sensitivity varied from 80.4% to 100.0% and specificity from 94.2% to
100.0%. The variability in sensitivity may be explained in part by inaccuracy of the phenotypic reference standard. Statistics used to measure heterogeneity in meta-analyses of
randomized controlled trials, such as the I-squared statistic, were not considerable suitable for these meta-analyses of diagnostic test accuracy studies. We downgraded 1 point. G5
The pooled sensitivity estimate had a wide 95% confidence interval (> +/-5% of point estimate). We downgraded 1 point. G6
Unpublished studies were included. Data included do not allow for formal assessment of publication bias using methods such as funnel plots or regression tests because such
techniques have not been found to be helpful for diagnostic test accuracy studies. However, being a new test for which there is going to be considerable attention and scrutiny, we
believe reporting bias will be minimal.
H1
All studies used a cross-sectional design. H2
We assessed study limitations using the QUADAS-2 tool. We downgraded the evidence by 1 point if > 50% of studies did not explicitly report blinding and by 1 point if > 50% of
studies did not report manner of patient selection or reported convenience sampling. All studies selected samples in a consecutive or random manner. All studies reported blinding of
MTBDRsl assay results to reference standard results. We had low concern about risk of bias. H3
Uncertainty about directness for false negatives relates to possible detrimental effects from delayed diagnosis of drug resistance. Uncertainty about directness for false positives
relates to unnecessary treatment with second line anti-TB drugs, potential for adverse events, and unnecessary use of health care resources. Diagnostic accuracy was considered as a
surrogate for patient-important outcomes; therefore, we downgraded 1 point. H4
Heterogeneity was assessed by visual inspection of forest plots of sensitivity and specificity estimates. Sensitivity varied from 75.0% to 100.0% and specificity from 89.4% to
100.0%. The variability in sensitivity and specificity estimates may be explained in part by inaccuracy of the phenotypic reference standard. Also sensitivity estimates were found to
be lower in smaller studies with only 6-8 drug resistant isolates. Statistics used to measure heterogeneity in meta-analyses of randomized controlled trials, such as the I-squared
statistic, were not considerable suitable for these meta-analyses of diagnostic test accuracy studies. We downgraded one point. H5
The pooled sensitivity estimate had a very wide 95% confidence interval (> +/-10% of point estimate). We downgraded 2 points.

34 | P a g e
H6 Unpublished studies were included. Data included do not allow for formal assessment of publication bias using methods such as funnel plots or regression tests because such
techniques have not been found to be helpful for diagnostic test accuracy studies. However, being a new test for which there is going to be considerable attention and scrutiny, we
believe reporting bias will be minimal.

35 | P a g e
Table 19: GRADE Evidence Profiles: GenoType® MTBDRsl assay as a replacement test for conventional DST for capreomycin resistance (published and unpublished studies)
No of
Participants
(Studies)
Study Design Limitations Indirectness Inconsistency Imprecision Publication
Bias
Quality of
Evidence
(GRADE)
Importance
Outcome: Diagnostic accuracy for detection of capreomycin resistance, indirect testing
True positives
228
(9)
Cross-sectional and
case-controlI1
No serious
limitationsI2
Serious
indirectnessI3
(-1)
Very serious
inconsistencyI4
(-2)
Very serious
ImprecisionI5
(-2)
UndetectedI6
Very Low
Critical
(7-9)
True negatives
1182
(9)
Cross-sectional and
case-controlI1
No serious
limitationsI2
Serious
indirectnessI3
(-1)
Very serious
inconsistencyI4
(-2)
Very serious
ImprecisionI5
(-2)
UndetectedI6
Very Low
Critical
(7-9)
False positives
61
(9)
Cross-sectional and
case-controlI1
No serious
limitationsI2
Serious
indirectnessI3
(-1)
Very serious
inconsistencyI4
(-2)
Very serious
ImprecisionI5
(-2)
UndetectedI6
Very Low
Critical
(7-9)
False negatives
68
(9)
Cross-sectional and
case-controlI1
No serious
limitationsI2
Serious
indirectnessI3
(-1)
Very serious
inconsistencyI4
(-2)
Very serious
ImprecisionI5
(-2)
UndetectedI6
Very Low
Critical
(7-9)
Outcome: Diagnostic accuracy for detection of capreomycin resistance, direct testing
True positives
58
(5)
Mainly cross-
sectionalJ1
No serious
limitationsJ2
Serious
indirectnessJ3
(-1)
Serious
inconsistencyJ4
(-1)
Very serious
ImprecisionJ5
(-2)
UndetectedJ6
Very Low
Critical
(7-9)
True negatives
383
(5)
Mainly cross-
sectionalJ1
No serious
limitationsJ2
Serious
indirectnessJ3
(-1)
Serious
inconsistencyJ4
(-1)
Very serious
ImprecisionJ5
(-2)
UndetectedJ6
Very Low
Critical
(7-9)
False positives
16
(5)
Mainly cross-
sectionalJ1
No serious
limitationsJ2
Serious
indirectnessJ3
(-1)
Serious
inconsistencyJ4
(-1)
Very serious
ImprecisionJ5
(-2)
UndetectedJ6
Very Low
Critical
(7-9)
False negatives
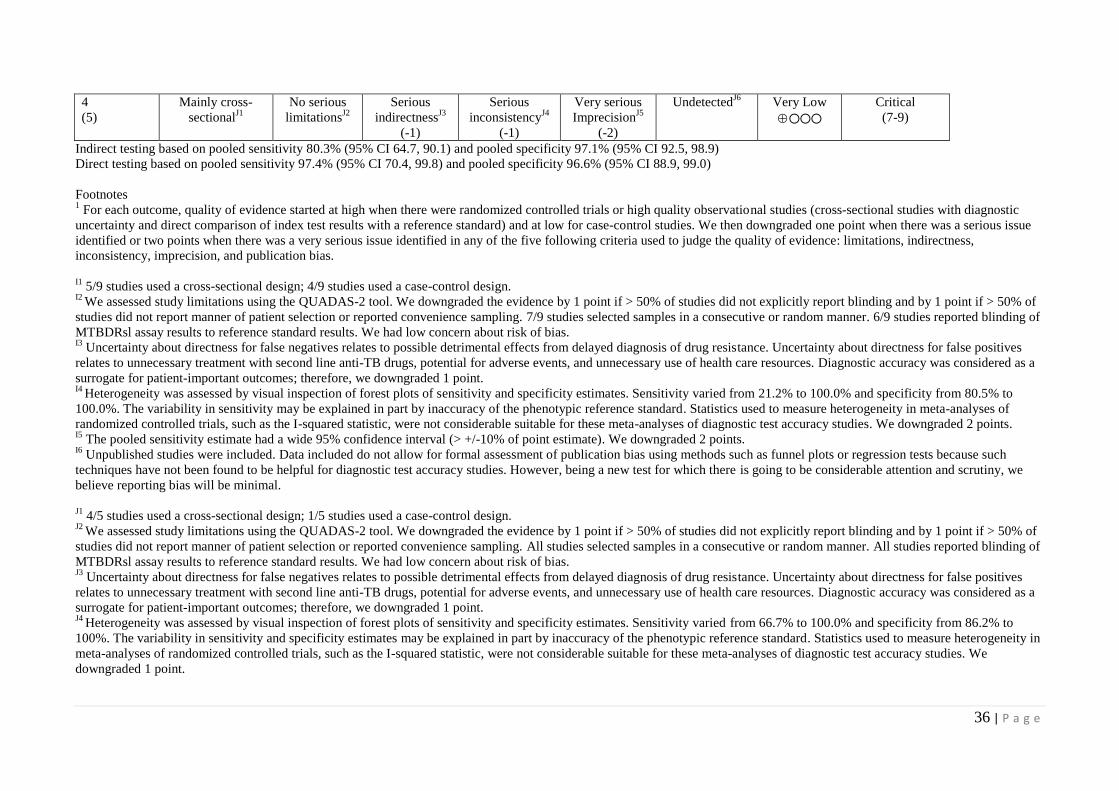
36 | P a g e
4
(5)
Mainly cross-
sectionalJ1
No serious
limitationsJ2
Serious
indirectnessJ3
(-1)
Serious
inconsistencyJ4
(-1)
Very serious
ImprecisionJ5
(-2)
UndetectedJ6
Very Low
Critical
(7-9)
Indirect testing based on pooled sensitivity 80.3% (95% CI 64.7, 90.1) and pooled specificity 97.1% (95% CI 92.5, 98.9)
Direct testing based on pooled sensitivity 97.4% (95% CI 70.4, 99.8) and pooled specificity 96.6% (95% CI 88.9, 99.0)
Footnotes
1 For each outcome, quality of evidence started at high when there were randomized controlled trials or high quality observational studies (cross-sectional studies with diagnostic
uncertainty and direct comparison of index test results with a reference standard) and at low for case-control studies. We then downgraded one point when there was a serious issue
identified or two points when there was a very serious issue identified in any of the five following criteria used to judge the quality of evidence: limitations, indirectness,
inconsistency, imprecision, and publication bias.
I1 5/9 studies used a cross-sectional design; 4/9 studies used a case-control design.
I2 We assessed study limitations using the QUADAS-2 tool. We downgraded the evidence by 1 point if > 50% of studies did not explicitly report blinding and by 1 point if > 50% of
studies did not report manner of patient selection or reported convenience sampling. 7/9 studies selected samples in a consecutive or random manner. 6/9 studies reported blinding of
MTBDRsl assay results to reference standard results. We had low concern about risk of bias. I3
Uncertainty about directness for false negatives relates to possible detrimental effects from delayed diagnosis of drug resistance. Uncertainty about directness for false positives
relates to unnecessary treatment with second line anti-TB drugs, potential for adverse events, and unnecessary use of health care resources. Diagnostic accuracy was considered as a
surrogate for patient-important outcomes; therefore, we downgraded 1 point. I4
Heterogeneity was assessed by visual inspection of forest plots of sensitivity and specificity estimates. Sensitivity varied from 21.2% to 100.0% and specificity from 80.5% to
100.0%. The variability in sensitivity may be explained in part by inaccuracy of the phenotypic reference standard. Statistics used to measure heterogeneity in meta-analyses of
randomized controlled trials, such as the I-squared statistic, were not considerable suitable for these meta-analyses of diagnostic test accuracy studies. We downgraded 2 points. I5
The pooled sensitivity estimate had a wide 95% confidence interval (> +/-10% of point estimate). We downgraded 2 points. I6
Unpublished studies were included. Data included do not allow for formal assessment of publication bias using methods such as funnel plots or regression tests because such
techniques have not been found to be helpful for diagnostic test accuracy studies. However, being a new test for which there is going to be considerable attention and scrutiny, we
believe reporting bias will be minimal.
J1 4/5 studies used a cross-sectional design; 1/5 studies used a case-control design.
J2 We assessed study limitations using the QUADAS-2 tool. We downgraded the evidence by 1 point if > 50% of studies did not explicitly report blinding and by 1 point if > 50% of
studies did not report manner of patient selection or reported convenience sampling. All studies selected samples in a consecutive or random manner. All studies reported blinding of
MTBDRsl assay results to reference standard results. We had low concern about risk of bias. J3
Uncertainty about directness for false negatives relates to possible detrimental effects from delayed diagnosis of drug resistance. Uncertainty about directness for false positives
relates to unnecessary treatment with second line anti-TB drugs, potential for adverse events, and unnecessary use of health care resources. Diagnostic accuracy was considered as a
surrogate for patient-important outcomes; therefore, we downgraded 1 point. J4
Heterogeneity was assessed by visual inspection of forest plots of sensitivity and specificity estimates. Sensitivity varied from 66.7% to 100.0% and specificity from 86.2% to
100%. The variability in sensitivity and specificity estimates may be explained in part by inaccuracy of the phenotypic reference standard. Statistics used to measure heterogeneity in
meta-analyses of randomized controlled trials, such as the I-squared statistic, were not considerable suitable for these meta-analyses of diagnostic test accuracy studies. We
downgraded 1 point.

37 | P a g e
J5 The pooled sensitivity estimate had a very wide 95% confidence interval (> +/-10% of point estimate); the pooled specificity estimate had a wide 95% confidence interval (> +/-
5% of point estimate). We downgraded 2 points. J6
Unpublished studies were included. Data included do not allow for formal assessment of publication bias using methods such as funnel plots or regression tests because such
techniques have not been found to be helpful for diagnostic test accuracy studies. However, being a new test for which there is going to be considerable attention and scrutiny, we
believe reporting bias will be minimal.

38 | P a g e
Table 20: GRADE Evidence Profiles: GenoType® MTBDRsl assay as a replacement test for conventional DST for the diagnosis of XDR-TB (published and unpublished studies)
No of
Participants
(Studies)
Study Design Limitations Indirectness Inconsistency Imprecision Publication
Bias
Quality of
Evidence
(GRADE)
Importance
Outcome: Diagnostic accuracy for detection of XDR-TB, indirect testing
True positives
237
(6)
Mainly cross-
sectionalK1
No serious
limitationsK2
Serious
indirectnessK3
(-1)
Very serious
inconsistencyK4
(-2)
Very serious
imprecisionK5
(-2)
UndetectedK6
Very Low
Critical
(7-9)
True negatives
1385
(6)
Mainly cross-
sectionalK1
No serious
limitationsK2
Serious
indirectnessK3
(-1)
Very serious
inconsistencyK4
(-2)
Very serious
imprecisionK5
(-2)
UndetectedK6
Very Low
Critical
(7-9)
False positives
24
(6)
Mainly cross-
sectionalK1
No serious
limitationsK2
Serious
indirectnessK3
(-1)
Very serious
inconsistencyK4
(-2)
Very serious
imprecisionK5
(-2)
UndetectedK6
Very Low
Critical
(7-9)
False negatives
213
(6)
Mainly cross-
sectionalK1
No serious
limitationsK2
Serious
indirectnessK3
(-1)
Very serious
inconsistencyK4
(-2)
Very serious
imprecisionK5
(-2)
UndetectedK6
Very Low
Critical
(7-9)
Outcome: Diagnostic accuracy for detection of XDR-TB, direct testing
True positives
73
(4)
Cross-sectionalL1
No serious
limitationsL2
Serious
indirectnessL3
(-1)
No serious
inconsistencyL4
Serious
imprecisionL5
(-1)
UndetectedL6
Low
Critical
(7-9)
True negatives
747
(4)
Cross-sectionalL1
No serious
limitationsL2
Serious
indirectnessL3
(-1)
No serious
inconsistencyL4
Serious
imprecisionL5
(-1)
UndetectedL6
Low
Critical
(7-9)
False positives
11
(4)
Cross-sectionalL1
No serious
limitationsL2
Serious
indirectnessL3
(-1)
No serious
inconsistencyL4
Serious
imprecisionL5
(-1)
UndetectedL6
Low
Critical
(7-9)
False negatives

39 | P a g e
9
(4)
Cross-sectionalL1
No serious
limitationsL2
Serious
indirectnessL3
(-1)
No serious
inconsistencyL4
Serious
imprecisionL5
(-1)
UndetectedL6
Low
Critical
(7-9)
Indirect testing based on pooled sensitivity 63.3% (95% CI 36.8, 83.5) and pooled specificity 98.5 % (95% CI 96.0, 99.4)
Direct testing based on pooled sensitivity 90.2% (95% CI 79.0, 95.8) and pooled specificity 99.0% (95% CI 93.8, 99.9)
Footnotes 1 For each outcome, quality of evidence started at high when there were randomized controlled trials or high quality observational studies (cross-sectional studies with diagnostic
uncertainty and direct comparison of index test results with a reference standard) and at low for case-control studies. We then downgraded one point when there was a serious issue
identified or two points when there was a very serious issue identified in any of the five following criteria used to judge the quality of evidence: limitations, indirectness,
inconsistency, imprecision, and publication bias.
K1 5/6 studies used a cross-sectional design; 1/6 studies used a case-control design.
K2 We assessed study limitations using the QUADAS-2 tool. We downgraded the evidence by 1 point if > 50% of studies did not explicitly report blinding and by 1 point if > 50% of
studies did not report manner of patient selection or reported convenience sampling. All studies selected samples in a consecutive or random manner. All studies reported blinding of
MTBDRsl assay results to reference standard results. We had low concern about risk of bias. K3
Uncertainty about directness for false negatives relates to possible detrimental effects from delayed diagnosis of drug resistance. Uncertainty about directness for false positives
relates to unnecessary treatment with second line anti-TB drugs, potential for adverse events, and unnecessary use of health care resources. Diagnostic accuracy was considered as a
surrogate for patient-important outcomes; therefore, we downgraded 1 point. K4
Heterogeneity was assessed by visual inspection of forest plots of sensitivity and specificity estimates. Sensitivity varied from 22.6% to 100.0% and specificity from 93.9% to
100%. The variability in sensitivity estimates may be explained in part by inaccuracy of the phenotypic reference standard. Statistics used to measure heterogeneity in meta-analyses
of randomized controlled trials, such as the I-squared statistic, were not considerable suitable for these meta-analyses of diagnostic test accuracy studies. We downgraded 2 points. K5
Pooled sensitivity estimate had a wide 95% confidence interval (> +/-15% of point estimate). We downgraded 1 additional point. K6
Unpublished studies were included. Data included do not allow for formal assessment of publication bias using methods such as funnel plots or regression tests because such
techniques have not been found to be helpful for diagnostic test accuracy studies. However, being a new test for which there is going to be considerable attention and scrutiny, we
believe reporting bias will be minimal. L1
All studies used a cross-sectional design. L2
We assessed study limitations using the QUADAS-2 tool. We downgraded the evidence by 1 point if > 50% of studies did not explicitly report blinding and by 1 point if > 50% of
studies did not report manner of patient selection or reported convenience sampling. All studies selected samples in a consecutive or random manner. All studies reported blinding of
MTBDRsl assay results to reference standard results. We had low concern about risk of bias. L3
Uncertainty about directness for false negatives relates to possible detrimental effects from delayed diagnosis of drug resistance. Uncertainty about directness for false positives
relates to unnecessary treatment with second line anti-TB drugs, potential for adverse events, and unnecessary use of health care resources. Diagnostic accuracy was considered as a
surrogate for patient-important outcomes; therefore, we downgraded 1 point. L4
Heterogeneity was assessed by visual inspection of forest plots of sensitivity and specificity estimates. Sensitivity varied from 80.0% to 95.2% and specificity from 91.8% to
100.0%. The variability in sensitivity and specificity estimates may be explained in part by inaccuracy of the phenotypic reference standard. Statistics used to measure heterogeneity
in meta-analyses of randomized controlled trials, such as the I-squared statistic, were not considerable suitable for these meta-analyses of diagnostic test accuracy studies. The 95%
CIs were mainly overlapping and we did not downgrade. L5
The pooled sensitivity estimate had a wide 95% confidence interval (> +/-5% of point estimate). We downgraded 1 point.

40 | P a g e
L6 Unpublished studies were included. Data included do not allow for formal assessment of publication bias using methods such as funnel plots or regression tests because such
techniques have not been found to be helpful for diagnostic test accuracy studies. However, being a new test for which there is going to be considerable attention and scrutiny, we
believe reporting bias will be minimal.

41 | P a g e
Table 21: GRADE Summary of Findings Table: GenoType® MTBDRsl assay (published and unpublished studies).
Review question: What is the diagnostic accuracy of MTBDRsl assay for detection of resistance to second-line anti-TB drugs?
Patients/population: Persons suspected of having pulmonary TB with resistance to second-line anti-TB drugs
Setting: Clinical centers and laboratories
Index test: GenoType® MTBDRsl assay
Importance: Compared with conventional drug susceptibility testing, genotypic methods, such as MTBDRsl assay, have considerable advantages for scaling up
programmatic management and surveillance of drug-resistant TB, offering speed of diagnosis, standardized testing, potential for high throughput, and fewer
requirements for laboratory bio-safety
Reference standard: Conventional drug susceptibility testing by solid or liquid culture; some studies used genetic sequencing
Studies: Cross-sectional, cohort, or case-control
Outcomes: TP, TN,
FP, FN
Effect %
(95% CI)
No. of
Participants
(Studies)
What do these results
mean given a 5%
prevalence of
fluoroquinolone resistance
among TB patients with
suspected drug resistance?
What do these results
mean given a 10%
prevalence of
fluoroquinolone resistance
among TB patients with
suspected drug resistance?
What do these results
mean given a 15%
prevalence of
fluoroquinolone resistance
among TB patients with
suspected drug resistance?
Quality of
Evidence
Diagnostic accuracy
for detection of
fluoroquinolone
resistance
Indirect testing Pooled sensitivity
88.8% (95% CI
82.7, 92.9) and
pooled specificity
97.9% (95% CI
94.8, 99.2)
2354
(13)
With a prevalence of 5%,
50/1000 will have
fluoroquinolone resistance.
Of these, 44 (TP) will be
identified; 6 (FN) will be
missed. Of the 950 patients
considered to be susceptible
to fluoroquinolones, 930
(TN) will not be treated; 20
(FP) will be unnecessarily
treated
With a prevalence of 10%,
100/1000 will have
fluoroquinolone resistance.
Of these, 89 (TP) will be
identified; 11 (FN) will be
missed. Of the 900 patients
considered to be susceptible
to fluoroquinolones, 881
(TN) will not be treated; 19
(FP) will be unnecessarily
treated
With a prevalence of 15%,
150/1000 will have
fluoroquinolone resistance.
Of these, 133 (TP) will be
identified; 17 (FN) will be
missed. Of the 850 patients
considered to be susceptible
to fluoroquinolones, 832
(TN) will not be treated; 18
(FP) will be unnecessarily
treated
Very Low
Direct testing Pooled sensitivity
83.5% (95% CI
69.1, 91.9) and
pooled specificity
97.4% (95% CI
95.7, 98.4)
1122
(7)
With a prevalence of 5%,
50/1000 will have
fluoroquinolone resistance.
Of these, 42 (TP) will be
identified; 8 (FN) will be
missed. Of the 950 patients
considered to be susceptible
to fluoroquinolones, 925
(TN) will not be treated; 25
(FP) will be unnecessarily
With a prevalence of 10%,
100/1000 will have
fluoroquinolone resistance.
Of these, 84 (TP) will be
identified; 16 (FN) will be
missed. Of the 900 patients
considered to be susceptible
to fluoroquinolones, 877
(TN) will not be treated; 23
(FP) will be unnecessarily
With a prevalence of 15%,
150/1000 will have
fluoroquinolone resistance.
Of these, 125 (TP) will be
identified; 25 (FN) will be
missed. Of the 850 patients
considered to be susceptible
to fluoroquinolones, 828
(TN) will not be treated; 22
(FP) will be unnecessarily
Very Low

42 | P a g e
treated treated treated
Diagnostic accuracy
for detection of
ofloxacin resistance
What do these results
mean given a 5%
prevalence of ofloxacin
resistance among TB
patients with suspected
drug resistance?
What do these results
mean given a 10%
prevalence of ofloxacin
resistance among TB
patients with suspected
drug resistance?
What do these results
mean given a 15%
prevalence of ofloxacin
resistance among TB
patients with suspected
drug resistance?
Indirect testing Pooled sensitivity
89.0% (95% CI
82.5, 93.3) and
pooled specificity
98.4 % (95% CI
95.9, 99.4)
2145
(11)
With a prevalence of 5%,
50/1000 will have ofloxacin
resistance. Of these, 45 (TP)
will be identified; 5 (FN)
will be missed. Of the 950
patients considered to be
susceptible to ofloxacin, 935
(TN) will not be treated; 15
(FP) will be unnecessarily
treated
With a prevalence of 10%,
100/1000 will have
ofloxacin resistance. Of
these, 89 (TP) will be
identified; 11 (FN) will be
missed. Of the 900 patients
considered to be susceptible
to ofloxacin, 886 (TN) will
not be treated; 14 (FP) will
be unnecessarily treated
With a prevalence of 15%,
150/1000 will have
ofloxacin resistance. Of
these, 134 (TP) will be
identified; 16 (FN) will be
missed. Of the 850 patients
considered to be susceptible
to ofloxacin, 836 (TN) will
not be treated; 14 (FP) will
be unnecessarily treated
Very Low
Direct testing Pooled sensitivity
87.3 % (95% CI
76.2, 93.6) and
pooled specificity
97.8 % (95% CI
96.0, 98.8)
1069
(6)
With a prevalence of 5%,
50/1000 will have ofloxacin
resistance. Of these, 44 (TP)
will be identified; 6 (FN)
will be missed. Of the 950
patients considered to be
susceptible to ofloxacin, 929
(TN) will not be treated; 21
(FP) will be unnecessarily
treated
With a prevalence of 10%,
100/1000 will have
ofloxacin resistance. Of
these, 87 (TP) will be
identified; 13 (FN) will be
missed. Of the 900 patients
considered to be susceptible
to ofloxacin, 880 (TN) will
not be treated; 20 (FP) will
be unnecessarily treated
With a prevalence of 15%,
150/1000 will have
ofloxacin resistance. Of
these, 131 (TP) will be
identified; 19 (FN) will be
missed. Of the 850 patients
considered to be susceptible
to ofloxacin, 831(TN) will
not be treated; 19 (FP) will
be unnecessarily treated
Very Low
Diagnostic accuracy
for detection of
kanamycin
resistance
What do these results
mean given a 5%
prevalence of kanamycin
resistance among TB
patients with suspected
drug resistance?
What do these results
mean given a 10%
prevalence of kanamycin
resistance among TB
patients with suspected
drug resistance?
What do these results
mean given a 15%
prevalence of kanamycin
resistance among TB
patients with suspected
drug resistance?
Indirect testing Pooled sensitivity
67.0% (95% CI
50.4, 80.2) and
pooled specificity
99.4 % (95% CI
97.0, 99.9)
1976
(10)
With a prevalence of 5%,
50/1000 will have
kanamycin resistance. Of
these, 34 (TP) will be
identified; 16 (FN) will be
missed. Of the 950 patients
With a prevalence of 10%,
100/1000 will have
kanamycin resistance. Of
these, 67 (TP) will be
identified; 33 (FN) will be
missed. Of the 900 patients
With a prevalence of 15%,
150/1000 will have
kanamycin resistance. Of
these, 101 (TP) will be
identified; 49 (FN) will be
missed. Of the 850 patients
Very Low

43 | P a g e
considered to be susceptible
to kanamycin, 944 (TN) will
not be treated; 6 (FP) will be
unnecessarily treated
considered to be susceptible
to kanamycin 895 (TN) will
not be treated; 5 (FP) will be
unnecessarily treated
considered to be susceptible
to kanamycin, 845 (TN) will
not be treated; 5 (FP) will be
unnecessarily treated
Direct testing Pooled sensitivity
96.2 % (95% CI
67.5, 99.7) and
pooled specificity
99.0 % (95% CI
78.4, 100.0)
400
(4)
With a prevalence of 5%,
50/1000 will have
kanamycin resistance. Of
these, 48 (TP) will be
identified; 2 (FN) will be
missed. Of the 950 patients
considered to be susceptible
to kanamycin, 941 (TN) will
not be treated; 9 (FP) will be
unnecessarily treated
With a prevalence of 10%,
100/1000 will have
kanamycin resistance. Of
these, 96 (TP) will be
identified; 4 (FN) will be
missed. Of the 900 patients
considered to be susceptible
to kanamycin, 891(TN) will
not be treated; 9 (FP) will be
unnecessarily treated
With a prevalence of 15%,
150/1000 will have
kanamycin resistance. Of
these, 144 (TP) will be
identified; 6 (FN) will be
missed. Of the 850 patients
considered to be susceptible
to kanamycin, 842 (TN) will
not be treated; 8 (FP) will be
unnecessarily treated
Very Low
Diagnostic accuracy
for detection of
amikacin
resistance
What do these results
mean given a 5%
prevalence of amikacin
resistance among TB
patients with suspected
drug resistance?
What do these results
mean given a 10%
prevalence of amikacin
resistance among TB
patients with suspected
drug resistance?
What do these results
mean given a 15%
prevalence of amikacin
resistance among TB
patients with suspected
drug resistance?
Indirect testing Pooled sensitivity
89.6% (95% CI
84.0, 93.5) and
pooled specificity
99.5 % (95% CI
96.1, 100.0)
1213
(7)
With a prevalence of 5%,
50/1000 will have amikacin
resistance. Of these, 45 (TP)
will be identified; 5 (FN)
will be missed. Of the 950
patients considered to be
susceptible to amikacin, 945
(TN) will not be treated; 5
(FP) will be unnecessarily
treated
With a prevalence of 10%,
100/1000 will have
amikacin resistance. Of
these, 90 (TP) will be
identified; 10 (FN) will be
missed. Of the 900 patients
considered to be susceptible
to amikacin, 896 (TN) will
not be treated; 4 (FP) will be
unnecessarily treated
With a prevalence of 15%,
150/1000 will have
amikacin resistance. Of
these, 134 (TP) will be
identified; 16 (FN) will be
missed. Of the 850 patients
considered to be susceptible
to amikacin, 846 (TN) will
not be treated; 4 (FP) will be
unnecessarily treated
Very Low
Direct testing Pooled sensitivity
93.2 % (95% CI
76.8, 98.3) and
pooled specificity
99.4 % (95% CI
95.7, 100.0)
1021
(6)
With a prevalence of 5%,
50/1000 will have amikacin
resistance. Of these, 47 (TP)
will be identified; 3 (FN)
will be missed. Of the 950
patients considered to be
susceptible to amikacin, 944
(TN) will not be treated; 6
(FP) will be unnecessarily
With a prevalence of 10%,
100/1000 will have
amikacin resistance. Of
these, 93 (TP) will be
identified; 7 (FN) will be
missed. Of the 900 patients
considered to be susceptible
to amikacin, 895 (TN) will
not be treated; 5 (FP) will be
With a prevalence of 15%,
150/1000 will have
amikacin resistance. Of
these, 140 (TP) will be
identified; 10 (FN) will be
missed. Of the 850 patients
considered to be susceptible
to amikacin, 845 (TN) will
not be treated; 5 (FP) will be
Very Low

44 | P a g e
treated unnecessarily treated unnecessarily treated
Diagnostic accuracy
for detection of
capreomycin
resistance
What do these results
mean given a 5%
prevalence of capreomycin
resistance among TB
patients with suspected
drug resistance?
What do these results
mean given a 10%
prevalence of capreomycin
resistance among TB
patients with suspected
drug resistance?
What do these results
mean given a 15%
prevalence of capreomycin
resistance among TB
patients with suspected
drug resistance?
Indirect testing Pooled sensitivity
80.3% (95% CI
64.7, 90.1) and
pooled specificity
97.1 % (95% CI
92.5, 98.9)
1371
(9)
With a prevalence of 5%,
50/1000 will have
capreomycin resistance. Of
these, 40 (TP) will be
identified; 10 (FN) will be
missed. Of the 950 patients
considered to be susceptible
to capreomycin, 922 (TN)
will not be treated; 28 (FP)
will be unnecessarily treated
With a prevalence of 10%,
100/1000 will have
capreomycin resistance. Of
these, 80 (TP) will be
identified; 20 (FN) will be
missed. Of the 900 patients
considered to be susceptible
to capreomycin, 874 (TN)
will not be treated; 26 (FP)
will be unnecessarily treated
With a prevalence of 15%,
150/1000 will have
capreomycin resistance. Of
these, 120 (TP) will be
identified; 30 (FN) will be
missed. Of the 850 patients
considered to be susceptible
to capreomycin, 825 (TN)
will not be treated; 25 (FP)
will be unnecessarily treated
Very Low
Direct testing Pooled sensitivity
97.4 % (95% CI
70.4, 99.8) and
pooled specificity
96.6 % (95% CI
88.9, 99.0)
461
(5)
With a prevalence of 5%,
50/1000 will have
capreomycin resistance. Of
these, 49 (TP) will be
identified; 1 (FN) will be
missed. Of the 950 patients
considered to be susceptible
to capreomycin, 918 (TN)
will not be treated; 32 (FP)
will be unnecessarily treated
With a prevalence of 10%,
100/1000 will have
capreomycin resistance. Of
these, 97 (TP) will be
identified; 3 (FN) will be
missed. Of the 900 patients
considered to be susceptible
to capreomycin, 869 (TN)
will not be treated; 31 (FP)
will be unnecessarily treated
With a prevalence of 15%,
150/1000 will have
capreomycin resistance. Of
these, 146 (TP) will be
identified; 4 (FN) will be
missed. Of the 850 patients
considered to be susceptible
to capreomycin, 821 (TN)
will not be treated; 29 (FP)
will be unnecessarily treated
Very Low
Review question: What is the diagnostic accuracy of MTBDRsl assay for detection of XDR-TB?
Patients/population: Persons suspected of having pulmonary TB with resistance to second-line anti-TB drugs
Setting: Clinical centers and laboratories
Index test: MTBDRsl assay
Importance: Compared with conventional drug susceptibility testing, genotypic methods, such as MTBDRsl assay, have considerable advantages for scaling up
programmatic management and surveillance of drug-resistant TB, offering speed of diagnosis, standardized testing, potential for high throughput, and fewer
requirements for laboratory bio-safety
Reference standard: Conventional drug susceptibility testing by solid or liquid culture; some studies used genetic sequencing
Studies: Cross-sectional, cohort, or case-control
Diagnostic accuracy
for detection of
XDR-TB
What do these results
mean given a 5%
prevalence of XDR-TB
What do these results
mean given a 10%
prevalence of XDR-TB
What do these results
mean given a 15%
prevalence of XDR-TB

45 | P a g e
among TB patients with
suspected drug resistance?
among TB patients with
suspected drug resistance?
among TB patients with
suspected drug resistance?
Indirect testing Pooled sensitivity
63.3% (95% CI
36.8, 83.5) and
pooled specificity
98.5 % (95% CI
96.0, 99.4)
1895
(6)
With a prevalence of 5%,
50/1000 will have XDR-TB.
Of these, 32 (TP) will be
identified; 18 (FN) will be
missed. Of the 950 patients
considered to be non-XDR-
TB, 936 (TN) will not be
treated; 14 (FP) will be
unnecessarily treated
With a prevalence of 10%,
100/1000 will have XDR-
TB. Of these, 63 (TP) will
be identified; 37 (FN) will
be missed. Of the 900
patients considered to be
non-XDR-TB, 887 (TN)
will not be treated; 13 (FP)
will be unnecessarily treated
With a prevalence of 15%,
150/1000 will have XDR-
TB. Of these, 95 (TP) will
be identified; 55 (FN) will
be missed. Of the 850
patients considered to be
non-XDR-TB, 837 (TN)
will not be treated; 13 (FP)
will be unnecessarily treated
Very Low
Direct testing Pooled sensitivity
90.2% (95% CI
79.0, 95.8) and
pooled specificity
99.0 % (95% CI
93.8, 99.9)
840
(4)
With a prevalence of 5%,
50/1000 will have XDR-TB.
Of these, 45 (TP) will be
identified; 5 (FN) will be
missed. Of the 950 patients
considered to be non-XDR-
TB, 941 (TN) will not be
treated; 9 (FP) will be
unnecessarily treated
With a prevalence of 10%,
100/1000 will have XDR-
TB. Of these, 90 (TP) will
be identified; 10 (FN) will
be missed. Of the 900
patients considered to be
non-XDR-TB, 891 (TN)
will not be treated; 9 (FP)
will be unnecessarily treated
With a prevalence of 15%,
150/1000 will have XDR-
TB. Of these, 135 (TP) will
be identified; 15 (FN) will
be missed. Of the 850
patients considered to be
non-XDR-TB, 842 (TN)
will not be treated; 8 (FP)
will be unnecessarily treated
Low
TP, true positive; FN, false negative; TN, true negative; FP, false positive

46 | P a g e
4. ANNEXES
Annex 1. LIST OF PARTICIPANTS
Participants Affiliation
1. Richard Anthony
Research Coordinator Tuberculosis
KIT Biomedical Research, Royal Tropical Institute
Meibergdreef 39
1105 AZ Amsterdam, The Netherlands
2. Lucia Barrera Jefe Servicio Micobacterias (Head Mycobacteria Laboratory)
Instituto Nacional de Enfermedades Infecciosas ANLIS Dr CG Malbran,
Velez Sarsfield 563
1281 Buenos Aires, Argentina
3. Catharina Boehme
Foundation for Innovative New Diagnostics (FIND)
Avenue de Budé 16
1202 Geneva, Switzerland
4. Jeremiah Muhwa Chakaya
Chief Research Officer,
Centre for Respiratory Diseases Research
Kenya Medical Research Institute 47855
00100 – Nairobi, Kenya
5. Daniela Cirillo San Raffaele del Monte Tabor Foundation
Emerging Bacterial Pathogens
Via Olgettina 60
20132 Milan, Italy
6. Gerrit Coetzee Consultant
(Former Head, National Tuberculosis Reference Laboratory
National Health Laboratory Service, South Africa)
7. Charles Daley Head, Division of Mycobacterial and Respiratory Infections
National Jewish Medical and Research Center
5301 Nassau Circle E
80113 - Englewood, CO, USA
8. Rumina Hasan Dept of Pathology and Microbiology
Aga Khan University
Stadium Road
P.O. Box 3500
Karachi, 748000, Pakistan

47 | P a g e
9. Hamidah Hussain Director, Research
Interactive Research and Development
Indus Hospital
20-301 Klahani Drive
V3H OC2 - Port Moody, BC, Canada
10. Kai Man Kam TB Reference Laboratory, Department of Health
7/F, Public Health Laboratory Center
382 Nam Cheong Street, Shek Kip Mei
Kowloon, Hong Kong (SAR), China
11. Aamir Khan Director, MDR-TB Control Program
The Indus Hospital
Korangi Crossing
75190 – Karachi, Pakistan
12. Erica Lessem Acting Director, TB/HIV Project
Treatment Action Group
261 Fifth Avenue, Suite 2110
New York, NY 10016, USA
13. Dick Menzies
Director, Respiratory Division, MUHC and McGill University,
Room K1.24, Montreal Chest Institute
3650 St. Urbain St.
Montreal, PQ, H2X 2P4, Canada
14. Beverley Metchock Reference Laboratory Team
Laboratory Branch
Division of Tuberculosis Elimination
Centres for Disease Control and Prevention
1600 Clifton Road, MS-G35, NE
Atlanta, GA 30333, USA
15. Dyah Mustikawati National TB Program Manager
Ministry of Health, Republic of Indonesia
DG DC & EH Office, B Building, 4th Fl.
Jl. Percetakan Negara No. 29
Jakarta, Indonesia
16. Rick O’Brien Foundation for Innovative New Diagnostics (FIND)
P.O Box 2938
Frisco, CO 80443, USA
17. John Ridderhof Senior Advisor for Planning
Laboratory Science, Policy and Practice Program Office
Office of Surveillance, Epidemiology, and Laboratory Services
Centers for Disease Control and Prevention
1600 Clifton Rd. Atlanta, GA 30333, USA

48 | P a g e
18. Sabine Rüsch-Gerdes National Reference Center for Mycobacteria
Forschungszentrium Borstel
Parkallee 18, 23845 Borstel, Germany
19. Holger Schünemann Chair, Department of Clinical Epidemiology & Biostatistics
Department of Clinical Epidemiology & Biostatistics
McMaster University Health Sciences Centre, Room 2C16
1280 Main Street West
Hamilton, ON L8S 4K1, Canada
20. Salman Siddiqi Consultant Mycobacteriologist
15 Glencoe Manor Court
Sparks, MD 21152, USA
21. Thomas M. Shinnick Associate Director for Global Laboratory Activities
Centres for Disease Control and Prevention
1600 Clifton Road, MS-G35, NE
30333 Atlanta,GA, USA
World Health Organization Stop TB Department
22. Dennis Falzon MDR-TB unit
23. Chris Gilpin TB Diagnostics and Laboratory Strengthening unit
24. Jean Iragena TB Diagnostics and Laboratory Strengthening unit
25. Fuad Mirzayev TB Diagnostics and Laboratory Strengthening unit
26. Paul Nunn MDR-TB unit
27. Wayne van Gemert TB Diagnostics and Laboratory Strengthening unit
28. Fraser Wares MDR-TB unit
29. Karin Weyer TB Diagnostics and Laboratory Strengthening unit
30. Matteo Zignol Drug resistance surveillance, TB Monitoring & Evaluation unit

49 | P a g e
Annex 2. Meeting Agenda
WHO Policy Guidance on Genotype MTBDRsl second-line drug molecular line probe assays
- EXPERT GROUP MEETING -
Date: 21 March 2012 Venue: WHO-HQ, D building, room HTM 65, Geneva, Switzerland BACKGROUND In 2008, WHO also published a Policy Statement on molecular line probe assays for rapid screening of patients at risk of multidrug-resistant tuberculosis4. In 2010, an Expert Group meeting was held to review the evidence on use of second-line molecular line probe assays (Hain MTBDRsl®), for detection of resistance to fluoroquinolones and second-line injectable agents to detect XDR-TB. At the time, not enough evidence was available to endorse the use of the tool; additional evidence has since been gathered and needs to be reviewed. WORLD HEALTH ORGANIZATION: EVIDENCE-BASED PROCESS FOR POLICY GUIDANCE In order to facilitate the development of rapid policy guidance, WHO has adopted a systematic, structured, evidence-based process: The first step involves a systematic review and meta-analysis of available data, using standard methods appropriate for diagnostic accuracy studies. The second step involves the convening of an Expert Group to evaluate the strength of the evidence base and recommend operational and logistical considerations for mainstreaming such tools/approaches into national TB control programmes, and/or identify gaps to be addressed in future research. The third and final step involves WHO policy guidance on the use of these tools/approaches, presented to the WHO Strategic and Technical Advisory Group for TB (STAG-TB) for endorsement and subsequent dissemination to Member States for implementation. MEETING OBJECTIVES
To review available data from laboratory validation and field evaluation studies on the performance
characteristics of Hain MTBDRsl® molecular line probe assays, for the diagnosis of second-line drug resistance;
To outline issues to be addressed by WHO in subsequent policy recommendations.
EXPECTED OUTCOMES Evidence-based recommendations on the use of Hain MTBDRsl® molecular line probe assays for the
diagnosis of second-line drug resistance;
Consensus on issues to be addressed in development of subsequent WHO policy recommendations.
4 http://www.who.int/tb/features_archive/policy_statement.pdf

50 | P a g e
PROVISIONAL AGENDA Wednesday, 21 March 2012: 2nd line LPA guidance DAY 1 Chairs: H Schünemann & K Weyer Rapporteur: W van Gemert
Opening session
09:00 – 09:30 Meeting scope and objectives Declarations of interest
W van Gemert
09:30 – 09:45 Overview of WHO policy recommendations on line probe assays C Gilpin
09:45 – 10:00 Findings of 2010 Expert Group Meeting on the Hain MTBDRsl molecular line probe assay (including questions)
C Gilpin
Session 1: Review of available evidence
10:00 – 10:30
Data from laboratory validation and field evaluation studies on the performance characteristics of Hain MTBDRsl molecular line probe assays (including questions)
R. O’Brien
10:30 – 11:00 BREAK
Session 2: Assessment of evidence and formulation of recommendations
11:00 – 12:30 Closed session: Expert Group assessment Expert Group
members
12:30 – 12:45 Final recommendations: use of the Hain MTBDRsl molecular line probe assay for the diagnosis of second-line drug resistance
H Schünemann
12:45 – 13:00 Closing K Weyer

51 | P a g e
Annex 3: Declarations of Interest None declared Lucia Barrera Daniela Cirillo Jeremiah Chakaya Gerrit Coetzee Rumina Hasan Hamidah Hussain Erica Lessem Aamir Khan Dick Menzies Beverley Metchock Dyah Mustikawati John Ridderhof Holger Schünemann Thomas Shinnick Declared, insignificant Charles Daley - Chair, Data Monitoring Board – Otsuka (Otsuka drug not under discussion in this EGM) Kai Man Kam - Provided expert opinion to WHO-WPRO and Hong Kong Government related to MDR-TB Sabine Rüsch-Gerdes -Performed evaluation studies for FIND Richard Anthony - Received funding from FIND for non-related research; developed in 1999 a method using a related technology to identify bacteria from blood culture (no continuing financial interest) Declared, significant (observer status) Salman Siddiqi - Employment and consulting with BD, Otsuka and Global Alliance for TB Rick O’Brien - Presenting data on MTBDRsl performance: FIND consultant and past employment FIND consultancy Catharina Boehme - FIND employment

52 | P a g e
Annex 4. Published and Unpublished stuidies
Published Studies
1. Hillemann D, Rüsch-Gerdes S, Richter E. Feasibility of the GenoType MTBDRsl assay for fluoroquinolone, amikacin-capreomycin, and ethambutol resistance testing of Mycobacterium tuberculosis strains and clinical specimens. J Clin Microbiol. 2009 Jun;47(6):1767-72. Epub 2009 Apr 22.
2. Brossier F, Veziris N, Aubry A, Jarlier V, Sougakoff W. Detection by GenoType MTBDRsl test of complex mechanisms of resistance to second-line drugs and ethambutol in multidrug-resistant Mycobacterium tuberculosis complex isolates. J Clin Microbiol. 2010 May;48(5):1683-9. Epub 2010 Mar 24.
3. van Ingen J, Simons S, de Zwaan R, van der Laan T, Kamst-van Agterveld M, Boeree MJ, van Soolingen D. Comparative study on genotypic and phenotypic second-line drug resistance testing of Mycobacterium tuberculosis complex isolates. J Clin Microbiol. 2010 Aug;48(8):2749-53. Epub 2010 Jun 16.
4. Kiet VS, Lan NT, An DD, Dung NH, Hoa DV, van Vinh Chau N, Chinh NT, Farrar J, Caws M. Evaluation of the MTBDRsl test for detection of second-line-drug resistance in Mycobacterium tuberculosis. J Clin Microbiol. 2010 Aug;48(8):2934-9. Epub 2010 Jun 23.
5. Huang WL, Chi TL, Wu MH, Jou R. Performance assessment of the GenoType MTBDRsl test and DNA sequencing for detection of second-line and ethambutol drug resistance among patients infected with multidrug-resistant Mycobacterium tuberculosis. J Clin Microbiol. 2011 Jul;49(7):2502-8. Epub 2011 May 11.
6. Kontsevaya I, Mironova S, Nikolayevskyy V, Balabanova Y, Mitchell S, Drobniewski F. Evaluation of two molecular assays for rapid detection of mycobacterium tuberculosis resistance to fluoroquinolones in high-tuberculosis and -multidrug-resistance Settings. J Clin Microbiol. 2011 Aug;49(8):2832-7. Epub 2011 Jun 1.
7. Surcouf C, Heng S, Pierre-Audigier C, Cadet-Daniel V, Namouchi A, Murray A, Gicquel B, Guillard B. Molecular detection of fluoroquinolone-resistance in multi-drug resistant tuberculosis in Cambodia suggests low association with XDR phenotypes. BMC Infect Dis. 2011 Sep 28;11:255.
8. Lacoma A, García-Sierra N, Prat C, Maldonado J, Ruiz-Manzano J, Haba L, Gavin P, Samper S, Ausina V, Domínguez J. GenoType MTBDRsl for molecular detection of second-line-drug and ethambutol resistance in Mycobacterium tuberculosis strains and clinical samples. J Clin Microbiol. 2012 Jan;50(1):30-6. Epub 2011 Nov 9
9. Said HM, Kock MM, Ismail NA, Baba K, Omar SV, Osman AG, Hoosen AA, Ehlers MM. Evaluation of the GenoType® MTBDRsl assay for susceptibility testing of second-line anti-tuberculosis drugs. Int J Tuberc Lung Dis. 2012 Jan;16(1):104-9.
10. Miotto P, Cabibbe AM, Mantegani P, Borroni E, Fattorini L, Tortoli E, Migliori GB, Cirillo DM. GenoType MTBDRsl performance on clinical samples with diverse genetic background. Eur Respir J. 2012 Jan 20. [Epub ahead of print]
11. Ignatyeva O, Kontsevaya I, Kovalyov A, Balabanova Y, Nikolayevskyy V, Toit K, Dragan A, Maxim D, Mironova S, Kummik T, Muntean I, Koshkarova E, Drobniewski F. Detection of resistance to second-line antituberculosis drugs using the Genotype(R) MTBDRsl assay: a multi-center evaluation and feasibility study. J Clin Microbiol. 2012 Feb 29. [Epub ahead of print]
Unpublished Studies
12. Alexander H. CDC Evaluation of Hain GenoType MTBDRsl with Clinical Isolates from 8 Countries. 13. Lee J. Hain GenoType® MTBDRsl line probe assay (“SL LPA”) for the rapid diagnosis of extensively drug
resistant tuberculosis (XDR TB). ITRC study report on indirect testing of culture isolates. 14. Feldman K. GENETUP Evaluation Study Report of MTBDRsl testing on culture isolates. 15. Dheda K. University of Cape Town study of MTBDRsl testing on sputum specimens and culture isolates. 16. Lee J. Hain GenoType® MTBDRsl line probe assay (“SL LPA”) for the rapid diagnosis of extensively drug
resistant tuberculosis (XDR TB) from sputum samples. ITRC study report. 17. Barnard M. Preliminary results for the evaluation of the MTBDRsl® LPA from smear positive sputums
exhibiting resistance to Rifampicin and/or Isoniazid based on MTBDRplus® results.
18. Rodrigues C. An Evaluation of the MTBDRsl Line-Probe Test on Sputum Specimens