Embed Size (px)
Citation preview
RIVM letter report 630004001/2008
RIVM Letter report 630004001/2008
Expert Elicitation: Methodological suggestions for its use in environmental health impact assessments
Slottje, P. Sluijs, J.P. van der Knol, A.B. Contacts: Anne Knol National Institute for Public Health and the Environment Centre for Environmental Health Research [email protected] Jeroen P. van der Sluijs Copernicus Institute for Sustainable Development and Innovation Department of Science Technology and Society [email protected]
Deliverable "Expert Elicitation Protocol" of RIVM/SOR project IQARUS: Identification Quantitative Assessment and Reduction of Uncertainties in burden of disease estimates for environmental Stressors (S/630004).

2 RIVM letter report 630004001/2008
© RIVM 2008 Parts of this publication may be reproduced, provided acknowledgement is given to the 'National Institute for Public Health and the Environment', along with the title and year of publication.

RIVM letter report 630004001/2008 3
Structure of document This document contains three parts: (1) an introduction, (2) an overview with building blocks and methodological suggestions for a formal expert elicitation procedure; and (3) a literature list with key sources of information used and suggestions for further reading. A glossary is provided in Appendix 1. Part one starts with the scope and aim of this document, and contin-ues with a brief introduction to the issue of uncertainty in environmental Health Impact As-sessments. The potential usefulness of expert elicitation in exploring particular uncertainties is then issued, thereby focusing on quantifiable input for which no reliable data is available (uncertain quantities), such as a particular exposure-response-function. Part two is intended as guidance to build a formal (i.e. well-developed, structured, systematic, transparent, traceable, and documented) expert elicitation procedure that is tailored to the particular research ques-tion and the uncertainties at hand. To this end, an overview (Figure 1) and possible basic building blocks are provided. For each building block, methodological suggestions are pro-vided with a view to refer the reader to a range (variety) of possible methods. Yet this over-view does not claim to be exhaustive nor representative of all published methodologies for expert elicitation. Key words: expert elicitation, expert judgment, health impact assessment, uncertainty.

4 RIVM letter report 630004001/2008
RIVM letter report 630004001/2008 5
Contents
1 Introduction 7 1.1 Scope and aim 7 1.2 Expert elicitation 7 1.3 Uncertainty 8 1.4 Environmental Health Impact Assessment 8 1.5 Key sources of information (references) 9
2 Building blocks for a formal expert elicitation procedure 11 2.1 General comments (to Figure 1) 11 2.2 First screening of uncertainties, their relative importance and the
need to perform an expert elicitation and its extensiveness 14 2.2.1 Objectives 14 2.2.2 Considerations 14 2.2.3 Practical suggestions/references 16 2.3 Selection of Experts 17 2.3.1 Objective 17 2.3.2 Considerations 17 2.3.3 Practical suggestions/references 19 2.4 Select key uncertainties to be subjected to elaborate expert
elicitation 21 2.4.1 Objective 21 2.4.2 Considerations 22 2.4.3 Practical suggestions/references 22 2.5 Assembly and dissemination of basic information 23 2.5.1 Objective 23 2.5.2 Considerations 24 2.5.3 Practical suggestions/references 26 2.6 Elicitation of expert judgements for uncertain (theoretically)
quantifiable elements 28 2.6.1 Objective 28 2.6.2 Considerations 28 2.6.3 Practical suggestions 28 2.7 Reporting and communication of uncertainties and EE procedure 35 2.7.1 Objective 35 2.7.2 Considerations 36 2.7.3 Practical suggestions/references 36
3 Literature list 37
Appendix 1: Glossary 43
Appendix 2: Uncertainty Matrix and Overview of Tools 50
Appendix 3: Practical examples of Pedigree Matrices 51
Appendix 4: Concept and practical example of Diagnostic Diagram 55

6 RIVM letter report 630004001/2008
RIVM letter report 630004001/2008 7
1 Introduction
1.1 Scope and aim
The aim of this document is to provide a practical guidance and suggestions on when and how to use expert elicitation methods in order to deal with particular uncertainties in envi-ronmental health impact assessments (eHIA). The document focuses primarily on quantifiable input for which no reliable data is available (uncertain quantities), such as a specified expo-sure-response-function. The various types and sources of uncertainties that can be identified in environmental health impact assessment, and environmental burden of disease calculations in particular, are described in more detail elsewhere (Knol et al [a], as is the crucial process of issue framing and output indicator selection (Knol et al [b]). The document is focused on subject-matter experts. In general, this will be scientific and technical experts, but it is increasingly recognized that non-scientific experts can also con-tribute relevant and valuable information to eHIA (Funtowicz & Ravetz, 1993; Stern & Fine-berg, 1996) and are well capable to provide relevant criticism to assumptions made and prob-lem frames chosen in eHIA (Craye et al., 2005, Kasemir et al., 2003, Kloprogge & Van der Sluijs, 2006). Therefore, involving non-scientific stakeholders (for instance a family doctor, a trade unions person who works on occupational health issues, a subject-matter specialist from an environmental NGO, or a government official) could be considered, for example with re-spect to translating a policy question into an assessment framework. For that kind of in-volvement, other participatory methods than expert elicitation might be more suitable (see §3 for references to overviews of participatory methods). For cases where eHIA takes place in a context of societal conflict and scientific controversy, one could choose to involve stake-holders in scientific expert elicitation by means of inviting them to nominate a trusted scien-tific expert. The essential concepts of expert elicitation, uncertainty, and eHIAs will be briefly introduced here; a glossary is also provided in Appendix 1.
1.2 Expert elicitation
Expert elicitation refers to a systematic approach to synthesize subjective judgments of ex-perts on a subject where there is uncertainty due to insufficient data, when such data is unat-tainable because of physical constraints or lack of resources. It seeks to make explicit and utilizable the unpublished knowledge and wisdom in the heads of experts, based on their ac-cumulated experience and expertise, including their insight in the limitations, strengths and weaknesses of the published knowledge and available data. Usually the subjective judgement is represented as a ‘subjective’ probability density function (PDF) reflecting the experts belief regarding the quantity at hand, but it can also be for instance the experts beliefs regarding the shape of a given exposure response function. An expert elicitation procedure should be de-veloped in such a way that minimizes inherent biases in subjective judgment and errors re-lated to that in the elicited outcomes. In practice, the starting point for considering expert elicitation usually is the confrontation with lack of data in the process of executing an eHIA, for example missing exposure-response-functions, missing exposure levels, or missing background prevalence rates. Usu-ally, a sensitivity analysis is then performed post hoc in order to analyse and discuss the im-pact of varying the uncertain values (e.g. arbitrary cut off) on the overall eHIA outcome. This document, however, starts with a screening of uncertainties before the actual execution of the

8 RIVM letter report 630004001/2008
eHIA with a view to (i) a more integrated uncertainty assessment and reporting, and to (ii) increase efficiency, since key uncertainties and the most appropriate methods to explore or reduce them are first identified; expert elicitation is one of them. This document does not present a novel method nor a cookbook for expert elicitation, rather it aims to review and bring together a wide range of existing approaches and practices, with a view to signal both essential building blocks and major challenges and pitfalls in expert elici-tation procedures. For each building block, methodological suggestions are provided (see also Appendix 2) with a view to refer the reader to a range (variety) of possible methods.
1.3 Uncertainty
Uncertainty can be characterised in a three-dimensional way: (1) location, (2) level, and (3) nature (Walker et al., 2003). “Key dimensions of uncertainty in the knowledge base of com-plex environmental problems that need to be addressed are technical (inexactness), methodo-logical (unreliability), epistemological (ignorance), and societal (social robustness). Quantita-tive methods address the technical dimension only. They can, however, be complemented with new qualitative approaching aspects of uncertainty that are hard to quantify […] In the still emerging environmental health science, ignorance and indeterminacy are the predomi-nant forms of uncertainty, largely outweighing in importance methodological and technical aspects” (Van der Sluijs et al., 2005 & 2008). This document focuses on quantitative re-searchers and risk assessors, who are probably more familiar with “quantifiable” uncertain-ties, such as parameter estimations (e.g. exposure-response-curves, exposure/emission lev-els/dose estimates; baseline health prevalence/incidence). It is important to recognise explic-itly that there exists more relevant uncertainty information than can be captured in a quantita-tive approach and that even such quantifiable uncertainties contain qualitative elements; these can also be issued in expert elicitations. Guidance on how to communicate these shortcom-ings of quantitative uncertainty analysis to various audiences can be found in Kloprogge et al. (2007) and Wardekker et al. (2008).
1.4 Environmental Health Impact Assessment
An Environmental Health Impact Assessment (eHIA) can be described as “a combination of procedures, methods and tools by which an environment-related policy, programme or project may be judged as to its potential effects on the health of a population, and the distribution of those effects within the population” (adapted from WHO 1999). Hence, environmental Health Impact Assessments are a form of “Integrated Assessments”. As such, eHIAs are not only typically multidisciplinary by nature, they usually also have a policy dimension, i.e. they are aimed to inform decision makers (stakeholders) (Rotmans & Van Asselt, 2001; Van der Sluijs, 2002).Typically, these types of assessments aim to produce a clear set of summary indicators to communicate the output of the assessment, such as burden of disease estimates, monetary values, or distance to policy target estimates (Knol e.a.[b,c]). Such summary indica-tors are developed to simplify a complex underlying reality – a process in which many as-sumptions have to be made and various types of uncertainties play a role. Indeed, uncertainty is of key concern in integrated eHIAs for two reasons. Firstly, because such assessments are confronted with several sources and types of uncertainties, e.g. the in-herent uncertainty and lack of knowledge in disciplinary sciences and the connecting points between them. Secondly, because they are prone to the accumulation of uncertainties (Van der Sluijs, 1997, Chapters 5 and 6) through the assessment chain which ends in the summary indicators. In order to enable a proper interpretation of these summary indicators and the
RIVM letter report 630004001/2008 9
eHIA in general, it is necessary to be transparent and reflective about all relevant uncertain-ties and assumptions, and to put the assessments results into this context. In some cases, expert elicitation is a way to deal with uncertainties that are due to insufficient (e.g. incomplete or inaccurate) data or knowledge in a particular eHIA, e.g. a missing expo-sure-response-function. The expert elicitation should be well-prepared, executed, analysed and reported in a systematic manner, in order to enable to incorporate the elicited results and the uncertainties related to them into the overall uncertainty analysis of the eHIA results. Fur-thermore, both the multidisciplinary aspect and the policy relevance of eHIAs emphasise the need for a carefully balanced and well-composed panel of experts (RSC, 2004).
1.5 Key sources of information (references)
Much of this document is based or cited from the below mentioned literature. These and addi-tional references for further reading are listed in the Literature list (See §3). Some basic read-ing in advance is certainly recommended, and the mentioned references can form a good starting point. • Morgan & Henrion, 1990 • Van der Sluijs et al., 2005 • Frey HCh, 1998 • Kotra et al., 1996 • Kloprogge et al., 2005 • RSC, 2004 • Risbey et al., 2007 • Loveridge, 2002 • Refsgaard et al., 2007

10 RIVM letter report 630004001/2008
RIVM letter report 630004001/2008 11
2 Building blocks for a formal expert elicita-tion procedure
2.1 General comments (to Figure 1)
Figure 1 shows an overview of the building blocks for a formal expert elicitation procedure (EE), pointing at suggested methods for screening and prioritising uncertainties and executing EE in an eHIA. The following six building blocks are identified: 1. First screening of uncertainties and their relative importance and the need to perform EE 2. Select experts (for number 3 and/or number 5) 3. Further analyse relevant uncertainty types: select key uncertainties to be subjected to EE 4. Assemble and disseminate basic key information to experts 5. Execute the (qualitative and/or quantitative) expert elicitation session(s) 6. Report and communicate the results Below figure 1, a further description of objectives, considerations and practical suggestions, respectively, is provided for these building blocks, with a view to refer the reader to a range (variety) of possible methods (See also Appendix 2). Some general comments need to be ad-dressed first. Firstly, it requires skills and practice to execute an EE, both from the experts and from the moderator (elicitor). Secondly, there is no single way to perform a perfect EE: each EE protocol should be tailored to the study’s aim and objectives. Thus, the research question and the scope of the EE determine which of the building blocks apply and in what order. While the building blocks are listed in a particular numbered sequence, this does not necessarily mean a chronological order. In practice, an iterative process with feedback loops is usually recommended (both as a check and as an aid for eliciting the reasoning behind ex-pert judgements). In general, an expert opinion can be used in two ways: 1. To structure a problem. Experts determine which data and variables are relevant for
analysis, which analytical methods are appropriate and which assumptions are valid. 2. To provide estimates. For example, experts may estimate failure or incidence rates, de-
termine weighting for combining data sources, or characterize uncertainty. Of course, a sequential combination of both these objectives (with the same and/or other ex-perts) is also possible. Thirdly, some of the suggested methods can be used in different build-ing blocks, e.g. sensitivity analyses can be used to identify and select key uncertainties that are to be subjected to a more elaborate quantitative EE (number 3), as well as to assess the potential impact of a selected key uncertainty on the overall eHIA result, using the elicited values from the elaborate quantitative EE (number 5 and 6). Finally, a pragmatic distinction is made in figure 1 between (theoretically) quantifiable elements of an eHIA (data, parameters) and non-quantifiable elements (assumptions, model boundaries and structure), which are shown on the right and left hand, respectively. For example, assumptions such as ‘an autono-mous increase of x% in background concentration Y over next Z years’, are regarded as quan-tifiable (parameter) elements, rather than a non-quantifiable elements. It is important to note that the uncertainty in a quantifiable element results usually form a mixture of sources, some of which are quantifiable and some are hard to capture in a number.
12 RIVM letter report 630004001/2008
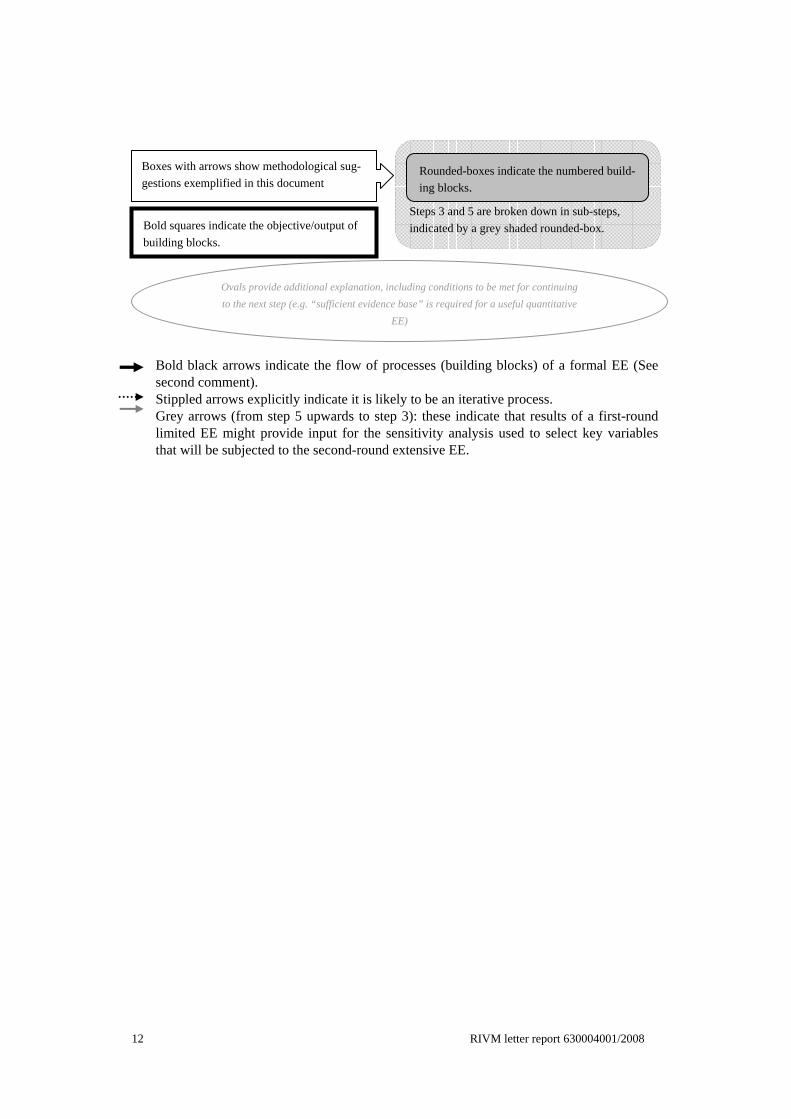
Bold black arrows indicate the flow of processes (building blocks) of a formal EE (See second comment). Stippled arrows explicitly indicate it is likely to be an iterative process. Grey arrows (from step 5 upwards to step 3): these indicate that results of a first-round limited EE might provide input for the sensitivity analysis used to select key variables that will be subjected to the second-round extensive EE.
Steps 3 and 5 are broken down in sub-steps, indicated by a grey shaded rounded-box.
Boxes with arrows show methodological sug-gestions exemplified in this document
Rounded-boxes indicate the numbered build-ing blocks.
Bold squares indicate the objective/output of building blocks.
Ovals provide additional explanation, including conditions to be met for continuing to the next step (e.g. “sufficient evidence base” is required for a useful quantitative
EE)

RIVM letter report 630004001/2008 13
Fig 1: Overview of building blocks and suggested methods for screening and prioritising uncer-
tainties, and executing expert elicitation (EE) for an environmental health impact as-sessment (eHIA).
Legend: a. Knol e.a. [a]; b. Appendix 2; c. Freij, 1998; d. Kloprogge ea, 2005; e. EPA, 1997; f. Saltelli, 2000, 2004, 2008; g. NUSAP; h. Appendix 3; i. Appendix 4; j. Van der Sluijs ea, 2005; k. Morgan, 1990; l. Kotra ea, 1996; m. Risbey ea, 2007, 2008; n. Vennix, 1999; o. Van Kouwen, 2007; p. MNP, 2007; q. Elliot, 2005; Raadgever, 2005; r. Kloprogge ea, 2007; s. Wardekker ea, 2008.
5. Expert Elicitation (theoretically) quantifiable
elements e.g. data or parameter
Pre-elicitation training
Elicitation session
Post-elicitation feedback
Analysis of disparate views and - if appropriate -
aggregation of elicited values
5. Expert Elicitation non-quantifiable elements,
e.g. assumptions, model boundaries or structure
Key uncertainties selected for EE
Semi-Quantitative or qualita-tive sensitivity analysis [d] • In order of importance • Semi-quantitative expert
estimation of influence
Quantitative sensitivity analysis [e,f]: • Monte Carlo analysis with
(expert estimation of) plausi-ble range
• Morris method (e.g. vary each +/- 50% of default)
Pedigree Score Matrix [g,h]
Elicitation Protocol [c,k,l,m]
• Group model building software/ techniques [n,o]
• Participatory methods [p,q,r]
[s,t] • Report full EE procedure; • List the experts names; but report
individual results anonymously; • Implications of uncertainties for
eHIA conclusion • Include uncertainty in executive
summary
Input for eHIA assessment based on Expert Judgment
Diagnostic Diagram [i,j]
6. Reporting & Communication
2. Selection of experts 4. Assembly and dissemi-nation of basic info
Assess estimated impact on final eHIA result (preferably quantitatively, else
qualitatively)
Assess value-ladenness
Assess evidence base
High
High
3. Select key uncertainties to be submitted to formal EE
1. First screening of uncertainties, their relative importance, and need to
perform an EE Uncertainty Matrix [a,b]
Briefing doc [c] Nomination-procedure
eHIA question / problem
Type of uncertainty requiring EE
No EE required (e.g. other techniques better suited)
Sufficient evidence base
14 RIVM letter report 630004001/2008
2.2 First screening of uncertainties, their relative importance and the need to perform an expert elicitation and its extensiveness
2.2.1 Objectives • To identify the relevant type of uncertainty in the eHIA question (i.e. non-quantifiable
model uncertainties and assumptions and/or quantifiable data or parameter uncertainties) and initially judge their relative importance.
• To decide whether or not expert elicitation is a suitable and feasible way to deal with the identified dominant uncertainty.
• If it is decided to use expert elicitation, this screening aims to (preliminary) shape the scope and extensiveness of the expert elicitation procedure, i.e. to identify which building blocks are involved and in what order.
Below some general considerations on when and to what extent to use expert elicitation are first described, followed by references to practical suggestions for screening and the charac-terisation of uncertainties and an overview of appropriate tools to reduce them. In practice, the impetus to consider expert elicitation usually will be a missing value (e.g. a particular exposure-response-function) during the process of executing an eHIA. However, here the starting point is to first screen for and characterise uncertainties related to the research ques-tion (including the particular missing value), in order to select the most important uncertain-ties, and decide upon an appropriate method to quantify or qualitatively explore these key uncertainties. Expert elicitation is one of these possible methods and the one considered here. In some cases a first round expert elicitation might be helpful, for example to provide reason-able/plausible input for sensitivity analyses or a deliberate (semi-)quantitative ranking of the relative importance on the eHIA results. The key uncertainties identified through this sensitiv-ity analyses, could then be subjected to a second round expert elicitation.
2.2.2 Considerations • What major sources and characteristics of uncertainties can be distinguished? Major sources (“locations”) of uncertainties: (See Appendix 2 and Freij, 1998)
o Context uncertainty (ecological, technological, economic, social and political repre-sentation)
o Data uncertainty (measurements, monitoring, survey) o Model uncertainty
▪ Boundary definitions (e.g. which environmental causes, pathological mecha-nisms and health outcomes are included and excluded?)
▪ Input data (measurements, monitoring, survey; proxy measures) ▪ Structure (parameters, relations; [multi-]causality) ▪ Technical (software, hardware)
o Output uncertainty (indicators, statement) Besides this typology, uncertainties are characterised by the following dimensions:
o their ‘value ladenness’: relative sensitivity to differences in subjective interpretations and the extent to what high stakes are involved
o their ‘reducibility’: essential (aleatory) uncertainty (due to natural, unpredictable variation; this cannot be resolved but expert knowledge might be useful in quantify-ing the uncertainty) versus epistemological uncertainty, which is conceptually re-solvable should our knowledge increase e.g. through more research or expert elicita-tion.
RIVM letter report 630004001/2008 15
Also note the distinction between uncertainty and variability (occurring between human be-ings of a population, across time periods or geographical areas). According to Freij (1998) “It is important to distinguish variability” [between subjects and over time] “from uncertainty” [due to imprecision resulting from random and systematic measurements errors or lack of data or the use of proxy measures], “because failure to do so can lead to significant overesti-mates of uncertainty. This is because in many cases we are really concerned about uncertain-ties in mean values, rather than variability from one individual member of a population to another.” The two types of uncertainties can be treated separately in a two-dimensional Monte Carlo Analysis (See EPA, 1997). Finally, uncertainty must be distinguished from ambiguity. Ambiguity is removed by linguis-tic conventions regarding the meaning of words. The two notions of uncertainty and ambigu-ity become contaminated when observations are described in an ambiguous language.” (Cooke & Goossens, 1999). • When to use expert elicitation and how elaborate should the procedure be? At least in theory, expert elicitation can be useful for almost all types of uncertainties (see Table 1 in the MNP/RIVM Uncertainty Toolbox guide: http://www.nusap.net/downloads/toolcatalogue.pdf ). The focus of this document, however, is on its use for (semi) quantifiable elements (parameter and input data). In practice, resources (time, money) will limit or determine the extensiveness of an expert elicitation procedure. Depending on the resources and the research question, this first screen-ing step can be done within the research project team itself (which is usually composed of generalist and subject-matter experts) or with the help of one or more additional independent experts (for types of experts, see Building block 2.2). In the latter case, the extensiveness can vary. On the one hand one might opt for a single “best guess” estimate from one expert, pos-sibly complemented with a simple “sensitivity analysis”, assessing the influence of varying this one uncertain value on the outcome. And, in some cases this approach might give reason-able results, in particular when it is an appropriate expert who is skilled in expert elicitation and when there is plenty consistent scientific data available for making judgments. However, heuristics used by the expert can lead to biases in the estimate of the selected single expert (See § 2.4). On the other hand, one might opt for a full (“academic”) expert elicitation exercise, including development of a tailored “expert elicitation protocol” and “expert sampling procedure”; in-volving experienced elicitor(s) and a balanced and well-composed multidisciplinary sample of experts, who are trained in expert elicitation and represent various relevant viewpoints; and covering various types of uncertainties, e.g. starting with (qualitative) model uncertainties and then moving to (more quantitative) parameter and input uncertainties within the elicited mo-del. In general, conditions that warrant a more elaborate expert elicitation include (Kotra, 1996):
o Empirical data are not reasonably obtainable, or the analysis are not practical to per-form (e.g. long-term mortality due to exposure to traffic-related air pollution)
o Uncertainties are ‘large’ […] and/or related to high stakes (e.g. large input data un-certainties in estimated emission levels compared to compliance with regulations)
o More than one conceptual model can explain, and be consistent with, the available evidence (i.e. model uncertainty, in particular those with high valueladenness)
o Technical judgements are required to assess whether bounding assumptions or calcu-lations are appropriately conservative (e.g. parameter, mathematical modelling and input data uncertainty)
In contrast, one might opt for a more confined approach if, for example:
16 RIVM letter report 630004001/2008
o new information is foreseen in the near future which is expected to affect or diminish the uncertainty at hand significantly. In this case a temporal estimation can be more appropriate for efficiency reasons;
o the extensive body of evidence is consistent (and abundant).
• Required budget of Expert Elicitation procedure Based on a summary of a round-table panel discussion in a conference on expert elicitation (See Cooke & Probst, 2006: “Highlights of the Expert Judgment Policy Symposium and Technical Workshop. Conference Summary, 2006”), it was suggested that: “Regarding budgets, there appears to be a range of estimates on the cost of conducting struc-tured expert judgments studies among the panel. Panelists who work in the United States re-ported that studies (done in support of government regulation) cost $100,000–300,000 or mo-re; studies in Europe tend to cost between one and three ‘person’months, or $30,000–100,000, excluding experts’ time. Of course, there are some differences in the scopes of these studies. In addition, the U.S. regulatory context imposes a high peer review and legitimation burden that may account for higher costs. Paying experts for their time and travel has a strong impact on costs. In the U.S. Nuclear Regulatory Commission–European Union project estimating uncertainty of accident conse-quence codes for nuclear power plants, for example, experts were paid $15,000 each for par-ticipation. They were required to attend a two-day workshop prior to the elicitation and to write up the rationales underlying their assessments in a form suitable for publication. This represents the high end of expert costs. At the low-cost end, experts are designated by their company or institution, do not convene for a common workshop to discuss the issues, and are interviewed in their offices by elicitors. Of course experts’ time always costs money; the question is only on which budget ledger it appears. Most studies fall somewhere between these cases.”
2.2.3 Practical suggestions/references • Screening for and characterisation of uncertainties, and selecting an appropriate tool to
deal with them: RIVM/MNP Guidance on Uncertainty Assessment and Communication o Petersen AC, Janssen PHM, van der Sluijs JP et. al. Mini-Checklist & Quickscan
Questionnaire. RIVM/MNP, 2003: http://www.rivm.nl/bibliotheek/digitaaldepot/Guidance_MC_QS-Q.pdf
o Janssen PHM, Petersen AC, van der Sluijs JP et al. Quickscan Hints & Actions List. RIVM/MNP, 2003: http://www.rivm.nl/bibliotheek/digitaaldepot/Guidance_QS-HA.pdf
o van der Sluijs JP, et al. RIVM/MNP Guidance for Uncertainty Assessment and Communication: Tool Catalogue for Uncertainty Assessment. Report nr: NWS-E-2004-37. ISBN 90-393-3797-7. Utrecht University, & RIVM; Utrecht/ Bilthoven, 2004. http://www.nusap.net/downloads/toolcatalogue.pdf
o Appendix 2: Uncertainty Matrix, including Overview of Tools o Updated typology of uncertainties: Peterse A (PhD Thesis, 2006)
• Papers related to this document on uncertainty assessments with respect to environmental burden of disease estimates, as part of eHIAs: o Knol AB [a], Petersen A, van der Sluijs JP. Characterizing uncertainties in environ-
mental burden of disease calculations (submitted) o Knol AB [b], Kruize H, Kunseler E, Lebret E. Evaluating indicators to support envi-
ronmental health policy (forthcoming)

RIVM letter report 630004001/2008 17
2.3 Selection of Experts
2.3.1 Objective To establish a well-composed and balanced sample of experts, who are apt to make and ex-press judgements on the uncertainties that are to be elicited.
2.3.2 Considerations • Who is an expert? In this document ‘experts’ refers primarily to professionals (scientists, technicians, and physi-cians), although it could indeed be argued that in some (eHIA) cases other stakeholders could equally be regarded as experts (e.g. decision makers with local expertise). • What types of experts are needed in elicitation sessions; and what qualities are re-
quired? The execution of an Expert Elicitation requires skills and experience, and the involvement of different experts. In general, three types of experts can be distinguished: generalists, subject-matter experts, and normative experts (See Kotra et al., 1996, and Loveridge, 2002). In eHIA assessments, the difference between generalists and subject-matter experts may be less strict, e.g. toxicologists, and epidemiologist. Generalists (Kotra, 1996) Typically generalists have substantive knowledge in one relevant discipline and a solid gen-eral understanding of the technical aspects of the problem. Their primary role in expert elici-tations could be the assessment of model uncertainties, problem decomposition, identification and priority-setting of uncertainties. For expert elicitations, ideal generalists would qualify for the following criteria: 1. possess the necessary knowledge and expertise 2. have demonstrated their ability to apply their knowledge and expertise 3. represent a broad diversity of independent opinion and approaches for addressing the
topic(s) in question 4. are willing to be identified publicly with their judgements (at least be willing to be identi-
fied as member of the expert panel, while individual judgements might be reported anonymously)
5. are willing to identify, for the record, any potential conflicts of interest Subject-matter experts (Kotra, 1996) Subject-matter experts typically are at the forefront of a specialty relevant to the problem and are recognized by their peers as authorities because of their sustained and significant research on the topic. They are the prime experts from whom judgements are elicited. Besides the cri-teria (1-5) listed above for generalists, required competences of subject-matter experts in-clude: 6. flexibility of thought and ability to objectively consider evidence that challenges his or
her own conventional wisdom 7. ability to explain complex topics in clear and straightforward terms The technological knowledge, expertise, and the ability to address the topic of the elicitation can be established through examination of the expert’s:
o educational background
18 RIVM letter report 630004001/2008
o professional experience (including research and consulting activities in related prob-lems or studies)
o publication record o previous experience as a peer reviewer for the work of others o membership and leadership positions in professional societies o awards and other indications of peer recognition
Their ability to apply his or her substantive knowledge to the task at hand can be determined by examining the expert’s record of:
o published research o participation in consulting activities in related problems or studies o prior participation in other expert elicitations o experience as a peer reviewer of the work of others
Normative experts (Kotra, 1996) Normative experts have training in probability theory, psychology, and decision analysis. They assist the generalists and subject-matter experts in articulating their professional judge-ments and thought processes in a form suitable for input into a particular technical assess-ment. Their ability to elicit judgements to the task at hand can be determined by examining the expert’s record of:
o educational background o professional experience (including research and consulting activities in related prob-
lems or studies) o prior participation in other expert elicitations
• Characteristics of a ‘good’ sample of experts (RSC, 2004)
o Composition: “What kind of knowledge should the panel have?” Composition thus concerns the mix of expert knowledge and experience needed for the panel to under-stand, analyze, and draw sound conclusions about the issue before it. A well-composed panel is technically competent to deal with the task
o Balance: “What kinds of value judgements may be relevant to the panel’s task?”. Balance thus concerns the even-handed representation of differing points of view that can be expected to affect the conclusions on issue the panel will address. A well-balanced panel has excellent prospects of achieving impartiality in its final conclu-sions and recommendations. Balance can be achieved: ▪ between experts: by having opposing views represented in the panel; ▪ within experts: by having members who are not strong proponents of the con-
tending perspectives, in cases where the opposing views are strongly held and not subject to a factual test.
o Factors to be taken into account: ▪ Scope: restricted to technical problems or more broad issues of public policy? ▪ Degree of controversy (and valueladenness): does the problem have alternative
resolutions that are controversial, affecting parties who have strong emotional, political, or financial stakes in the outcome, or are there no stakeholders with strong commitments to a particular outcome?
▪ Valueladenness: are different reasonable viewpoints equally represented? ▪ Disciplines: do the issues involve a single discipline or are they multidisciplinary ▪ Nationality/geographical spread: national and/or international experts? ▪ Potential (undisclosed) conflicts of interest
NB Because environmental health impacts can be both controversial and multidisciplinary
this stresses the importance of balance and composition. A potential advantage of a mul-
RIVM letter report 630004001/2008 19
tidisciplinary panel is that the disciplines would be the exchange of complementary disci-plinary information. However, some of the elicitation questions might not be applicable to all experts, because they do not consider themselves to be expert on that particular item.
2.3.3 Practical suggestions/references • How to select/sample experts? And how many experts are needed? Based on a summary of a round-table panel discussion in a conference on expert elicitation (See Cooke & Probst, 2006: “Highlights of the Expert Judgment Policy Symposium and Technical Workshop. Conference Summary, 2006”), it was suggested that: “There are a number of ways this [selection of expert] is typically done. If a company or labo-ratory is contracting the study, it may supply its own experts. […]. In other cases, experts are drawn from the broader expert community. The choice of experts is time consuming and of-ten subject to independent review. In some cases, literature reviews are used, perhaps in com-bination with iterated nomination rounds. Attempts may be made to balance opposing schools of thought and include minority viewpoints. In some cases—for example, in the evaluation of the toxicity of new chemical compounds—the number of experts may be very small and widely dispersed. In other areas, for example atmospheric dispersion, there may be a large number of experts from whom to choose. According to the panel, the number of experts for most studies they conducted was targeted to lie between 6 and 12, although constraints of a given study can lead to different numbers of experts. Generally, however, at least six experts should be included; otherwise there may be questions about the robustness of the results. The feeling of the practitioners is that beyond 12 experts, the benefit of including additional experts begins to drop off. Some participants noted that this is quite a small number if the goal is to survey the span of expert judgment.” • How to approach potential candidate experts Suggested general guidelines for performing exploratory interviews with candidate-expert panel members are: (RSC, 2004)
o Identify yourself and your Unit. o Indicate that the context of your call concerns the expert panel nomination process.
Identify the study by title and sponsor. o Discuss the origin and objectives of the project, and the statement of the task. Then
ask the candidate: ▪ To comment on the task and to offer suggestions about it and how the study
might be carried out – this gives an idea about the candidates knowledge and ideas about the subject
▪ What kinds of expertise are required to make an appropriate committee, includ-ing soliciting questions of individuals who meet the requirements
o State that another purpose of the call is to explore the candidate’s interest and avail-ability to serve in the study panel, if nominated. Explain that in order to achieve a balanced panel, this is not the final round in the panel selection process;
o Describe the expected time and demands of the study o Explain that the aim is to achieve a well-balanced panel that is free of direct conflicts
of interest and for that purpose each panel member will be asked to complete a con-fidential form, which aims to disclose any points of view or direct conflicts of inter-est. Positive responses will not necessarily disqualify a candidate member, in most cases it indicates areas that need to be considered when balancing the panel. Ask the candidate about any direct interest in the outcome of the study, due to: ▪ Organizational affiliations

20 RIVM letter report 630004001/2008
▪ Financial interests ▪ Research support ▪ Government service ▪ Public positions
o Express appreciation for the candidates time and thoughtfulness in responding to your questions. Emphasize the exploratory nature of the call and reiterate that a lar-ger slate of nominees will be put forward than will actually serve and that NOT being selected is in no way a judgement on a nominee’s technical qualifications.
o Inquire whether the candidate has suggestions for other panel members o Be prepared to answer the question “What made you consider me a prospective can-
didate to serve on the study?” Do not mention the names of the persons who sug-gested specific candidates or provide information that would permit drawing infer-ences on the matter.
• How to deal with conflicts of interest?
o Consider whether to document these beforehand or not; beforehand can be favour-able in such cases where it is important that any conflicts of interest can shared amongst the experts
o Consider using the method used for scientific publications for documenting conflicts of interest.
• Two-step nomination process to select experts for the elicitation proce-dure Below, one way to establish a sample of experts is exemplified; this concerns a two-step pro-cedure, based on peer-nomination, i.e. first the “population of interest” is defined and identi-fied, after which a sample of experts is drawn from this identified population; these are to be invited for the elicitation. Step I: Define and identify the ‘population of interest’
• Develop a ‘panel profile’ (This profile of the panel should explicitly address both composition and balance, by taking into account of the abovementioned factors [a-c]).
• Identification of initial set of persons (who are or can name experts that would meet the panel profile and are part of the population of interest). Credibility of the elicita-tion can be enhanced when nominations for candidate subject-matter experts can come from: o organizations such as professional and academic societies, o peers in the field, or o reviews of the scientific literature In case the eHIA takes place in a context of societal conflict and scientific contro-versy, one could choose to involve stakeholders in scientific expert elicitation by means of inviting them to nominate a trusted scientific expert.
• A variety of nomination procedures is available, for example: o Simple nomination (convenience sample) o Co-nomination procedure (Loveridge 2002, pages 15-16). This involves a sort of ‘snowball’ sampling survey process:
▪ Starts with a selected group of people who are thought to be representative of the wider group to be explored
▪ Each of these respondents lists a maximum of X people who meet defined criteria
RIVM letter report 630004001/2008 21
▪ This further group is asked to repeat the nomination process under the same rules
▪ With further rounds if necessary Advantages of Co-nomination process versus simple nomination:
▪ The questionnaire makes no reference to the quality of the work, so the no-tion of a ‘popularity contest’ is avoided;
▪ co-nomination avoids ‘prestige’ effects where respondents link themselves to ‘key’ actors;
▪ co-nomination enables a scale that allows the strength of links to be exam-ined at different cut-off levels.
o Peer-nomination to select subject-matter experts, for example: Initial sample of ‘relevant’ experts: ▪ first, second and last author of relevant peer-reviewed papers in recent years
(decade) on the topic of interest; identify these papers through an explicit search strategy (i.e. define key “search terms”, time frame, search en-gine/database)
▪ members of project (management/steering) group of relevant Euro-pean/world-wide large-scale research programs
Peer nomination to find ‘population of interest’: ▪ Ask the identified initial persons (by email) to list a specified number of per-
sons (name+ email+ institute) whom they think meet the criteria (see defini-tion/criteria); − optional: ask them to list person(s) with a different viewpoint, in par-
ticular when uncertainties are highly value-laden (e.g. model uncertain-ties);
− people are allowed to nominate themselves Step II: Sample experts from this ‘population of interest’ Take a deliberate selection of all persons mentioned, e.g.:
• Count the number of times each of the persons identified in step I is mentioned: in-vite the top X number of persons,
• Further additional criteria can be needed, e.g.: o If a person is not able or willing to take part in the elicitation procedure, take the
next on the list; o Only one person per institute (take the first mentioned, skip the others, unless
this person is not able to come to the elicitation session). o Assessment of statements of Conflicts of interest (see below);
2.4 Select key uncertainties to be subjected to elaborate expert elicitation
2.4.1 Objective To prioritise and select key uncertainties for the full (quantitative) expert elicitation, accord-ing to an assessment of: • the impact on the final eHIA result • the value-ladenness • the evidence base
22 RIVM letter report 630004001/2008
2.4.2 Considerations In practice, the number of elicitation questions is limited. Therefore, the focus should be on the most important ones. The key uncertainties include those that have the highest impact on the overall eHIA result, in particular those that are highly value-laden (where the stakes are high). With respect to the evidence base, it seems obvious that, at some point, the scientific evidence base would be so thin as to render quantitative expert judgement useless. Risbey et al. (2007) propose a method in which the subjective assessment of the level of evidence is integrated in the quantitative elicitation and thus conditions the level of precision of the elic-ited judgement (see below: characterization of likelihood according to a gradual range of pre-cision levels from fully specified probability distributions through to qualitative declarations of knowledge and ignorance).
2.4.3 Practical suggestions/references • Methods for Quantitative sensitivity analysis: (Saltelli et al. 2000, 2004, 2008; and
EPA, 1997). • Methods for (semi-)quantitative or qualitative sensitivity analysis: (Kloprogge et al.,
2005, Craye et al., 2008). For example: Kloprogge et al. (2005) used the following steps in a sensitivity analysis applied to assumptions (yet a similar approach can probably be adopted for other types of (semi-quantitative) uncertainty): • Make a list of all implicit and explicit assumptions for each indicator in the calcula-
tion chain (check completeness of the list with experts) • Prioritise key assumptions according to (group) expert judgments:
o Ask each expert to sort the assumptions in order of importance (from the most important =1 to the least important= max number)
o Obtain group ranking: reverse the scores, add scores per assumption, and rank them in order of total score (high score= most important)
• Assess the potential influence of the (key) assumptions in a (semi-) quantitatively way (pedigree-scoring) based on expert judgments o This refers to the Spread component of the NUSAP method. o Ideally perform a sensitivity analysis to assess the influence of each assumption;
however, this is usually not attainable in practice. o A more crude estimation can then be used, i.e. a semi-quantitative estimation of
the influence on results, e.g. the scoring of the assumption a) only has local in-fluence in the causal chain; b) greatly determines the results of the step; c) greatly determines the results of the indicator.
• Assess the potential value-ladenness of the (key) assumptions o Ask the experts to score the potential value-ladenness of each assumption, ac-
cording to the following criteria (each preferably scored on a 5-point scale): ▪ Practical aspect of value-ladenness
− influence of situational (practical) limitations (the extent to which the expert would make different assumptions if there were no restrictions such as availability of data, money, time, software, tools, hardware, hu-man resources)
▪ Epistemic (disciplinary) aspect of value-ladenness − agreement among peers, focused on potential disciplinary value-
ladenness (the degree to which a certain assumption depends on the ex-perts knowledge and perspective regarding the issue. NB this does not fully make explicit the degree of controversy)
RIVM letter report 630004001/2008 23
− plausibility (an intuitive reality-check: the extent to which the assump-tion is in accordance with reality: plausible-acceptable-fictive/speculative)
− choice space (the degree to which alternative assumptions are available) ▪ Socio-political aspect of value-ladenness
− agreement among stakeholders (the degree to which stakeholders would make different assumptions)
− sensitivity to view and interest of the analyst (controversy) • Visualise and analyse the results of individual or all experts per assumption (e.g. ra-
dar diagrams or histograms). For example, see pedigree charts in Wardekker e.a. (2008).
• Tailored Pedigree matrix, which is used to code qualitative expert judgments for each
criterion into a discrete numerical scale (e.g. from 0 – weak – to 4 – strong) with linguis-tic descriptions (modes) of each level of the scale (Van der Sluijs et al., 2005). Appendix 3 provides examples of tailored Pedigree scoring matrices for different uncertainty types:
▪ Pedigree matrix for model parameters (Risbey et al., 2005) ▪ Pedigree matrix for model structure (Refsgaard et al., 2006) ▪ Pedigree matrix for model assumptions (Kloprogge et al., 2005) ▪ Pedigree matrix for the use of models in policy support (Corral, 2000) ▪ Tool for graphical display results pedigree analysis (kite diagram):
www.NUSAP.net • Diagnostic Diagram, which is used to map two independent properties related to uncer-
tainty to reveal the weakest spots and help priority setting for improvement. The x-axis concerns the strength, which expresses the methodological and epistemological limita-tions of the underlying knowledge base. The y-axis concerns the spread, which expresses the inexactness. For example, one could map the strength of model parameters and the sensitivity of the model output to spread in these parameters. Appendix 4 first explains the concept of the diagnostic diagram and then offers an example of its application in practice.
2.5 Assembly and dissemination of basic information
2.5.1 Objective Provide unbalanced key information both on the subject matter of the elicitation procedure and on human judgement to help prevent cognitive biases in the actual elicitation. One of the prime challenges in both the 4th and the 5th building block is to minimize cogni-tive biases in experts judgement; therefore the basic information package, pre-elicitation training, the actual elicitation session as well as the post-elicitation feedback should be tar-geted both at (a) making experts aware of potential cognitive biases and pitfalls in elicitations, and at (b) guiding experts in expressing their judgements in probabilistic terms. A short intro-duction to these themes of potential biases and probabilistic thinking is provided below. Then practical suggestions follow for the basic information that is to be provided before the pre-elicitation training.
24 RIVM letter report 630004001/2008
2.5.2 Considerations • Basics of Human Judgments: Risk of biased responses (Morgan & Henrion, 1990) To make judgments about a certain uncertainty, people use various heuristics. Some of these may introduce bias in the outcome, for example the heuristic procedures of availability, repre-sentativeness, anchoring and adjustment. Bias through the use of availability can arise if the experts’ imagination is affected by factors such as the ease of recall, the memory of recent experience, the plausibility, nature and concreteness of the event (dramatic or salient). Conse-quences of using the representativeness heuristic include that the expert inappropriately gen-eralises a known small behaviour in the large, and paying relatively too much attention to specific details, at the cost of background information, such as base rates. Anchoring and ad-justment refers to the procedure of experts to first select a starting point (an anchor), as a first approximation of the quantity at hand and then to adjust this value to reflect supplementary information. Results are then typically biased towards the anchor, probably explaining part of the frequently observed ‘overconfidence’ of experts, i.e. assigning probabilities that are nearer to certainty than is warranted by their revealed knowledge (page 128). Asking the ex-pert to give reasons and to construct careful arguments in support of their judgements appears to improve the quality of assessments in some circumstances (page 128). A paradox is noted: “the more information experts have about an unknown quantity, the less likely they are to exhibit overconfidence” (page 129). Besides these heuristics, bias in response may also results from motivational bias, e.g. when the response of the expert is influenced by factors such as moral or professional responsibil-ity, legal liability, peer credibility. This may result in ‘underconfidence’ (e.g. too conservative judgements because the expert feels morally or professionally responsible for the conse-quences of his/her subjective judgment) and overconfidence (e.g. too certain response, be-cause experts tend to think this reflects he/she is knowledgeable (peer credibility)). Hindsight bias (page 199) refers to the tendency of people to exaggerate the predictability of reported outcomes, apparently because they fail to think about how things could have turned out differently. Overconfidence might be reduced by asking the experts to list one reason against their choice of response. • Basics of probabilistic thinking (expressing judgements in probabilistic terms) A major disadvantage of eliciting single “point estimates” and “paired comparisons” is that they provide no indication of the uncertainty around the elicited values. Therefore, in expert elicitations of uncertain quantities it is preferred to express the uncertainty in probabilistic terms, i.e. to elicit ranges of probabilities and if possible create ‘probability density functions’ (PDF) or ‘cumulative probability functions’ (CDF). To quote Loveridge (2002): “The first requirement of any practical (quantitative) elicitation process has to be its acceptance by people who do not normally think in terms of uncertainty let alone probability”. The elicitation procedure should thus be aimed to guide the expert in correctly synthesising or constructing such probability values or distributions. In practice, a continuous distribution is usually extrapolated from a series of discrete assessments (e.g. such as the question what the probability is that the value of the unknown quantity is less/ more than X, using a range of X). Another way to enhance the quality of the elicitation is to tailor the response format and jargon to the ones most suitable for each expert, depending on their background. For example, one could fit the response format (probability or odds) to the ex-perts’ preference. Note that words and phrases as expressions of likelihoods (e.g. “likely”, “improbable”) are relatively unreliable as a response mode for probability assessments. The following general information is quoted from the Briefing Paper by (Frey, 1998):
RIVM letter report 630004001/2008 25
“In the so-called "Bayesian" view, the probability of an outcome is your "degree of belief" that the outcome will occur, based on all of the relevant information you currently have about the system. Thus, the probability distribution may be based on empirical data and/or other considerations, such as your own technically-informed judgments or predictions. People with different information may estimate different distributions for the same variable. The assess-ment of uncertainties requires you to think about all possible outcomes and their likelihoods, not just the "most likely" outcome. […] From studies of how well calibrated judgments about uncertainty are, it appears that the most frequent problem encountered is overconfidence. Knowledge about how most people make judgments about probability distributions can be used to design a procedure for eliciting these judgments. The appropriate procedure depends on the background of the expert and the quan-tity for which the judgment is being elicited. For example, if you have some prior knowledge about the shape of the distribution for the quantity, then it may be appropriate to ask you to think about extreme values of the distribution and then to draw the distribution yourself. On the other hand, if you have little statistical background, it may be more appropriate to ask you a series of questions. For example, you might be asked the probability of obtaining a value less than or equal to some value x, and then the question is repeated for a few other values of x. Your judgment can then be graphed by an elicitor, who would review the results of the eli-citation with you to see if you are comfortable with your answers. To overcome the typical problem of overconfidence, it is usual to begin by thinking about extreme high or low values before asking about central values of the distribution. In general, experts' judgments about uncertainties tend to improve when: (1) the expert is forced to con-sider how things could turn out differently than expected (e.g., high and low extremes); and (2) the expert is asked to list reasons for obtaining various outcomes. While the development of expert judgments may be flawed in some respects, it does permit a more robust analysis of uncertainties in a process when limited data are available. Further-more, in many ways, the assessment of probability distributions is qualitatively no different than selecting single "best guess" values for use in a deterministic estimate. For example, a "best guess" value often represents a judgment about the single most likely value that one expects to obtain. The "best guess" value may be selected after considering several possible values. The types of heuristics and biases discussed above may play a similar role in selecting the value. Thus, even when only a single "best guess" number is used in an analysis, a sea-soned engineer (or scientist) usually has at least a "sense" for "how good that number really is". […]” There are several techniques for eliciting probability distributions for continuous random va-riables. They fall under several categories. A few of the most important ones are briefly de-scribed here (Morgan & Henrion, 1990): • Fixed Value Methods. In this approach, the expert is asked to estimate the probability
that the actual value of a quantity is higher (or lower) than some arbitrary number. […] This type of elicitation may be done with the aid of a probability wheel. The probability wheel is a graphical tool for communicating to an expert the meaning of probability.
• Fixed Probability Methods. Here, the expert is asked to estimate the value of a quantity such that the probability of higher or lower values is some specified amount. […]
• Interval Method. These methods involve partitioning the probability distribution into ranges of equal probability. For example, to assess the median of a distribution, the elici-tor may ask the expert to react to an arbitrary value. The value is adjusted until the expert is indifferent as to whether the actual value of the quantity is higher or lower. Then, to as-sess the quartiles (25 and 75 percentiles), the expert is asked whether it is equally likely that the value is within the interval bounded by the extreme or the median.
26 RIVM letter report 630004001/2008
• Reference Lottery. The expert is asked to choose between two bets. One is a reference lottery, in which the probability of winning can be adjusted. The other is whether the ac-tual value of a quantity will be above or below some specified value. The probability of the reference lottery is adjusted until the expert is indifferent between the two best.”
According to Morgan & Henrion (1990), research has indicated that fixed value methods usu-ally result in better calibrated distributions. However, these are applicable in individual ses-sions and computer-assisted group sessions. In other group sessions, consider using the inter-val method. In the words of Cooke & Goossens (1999): “We are concerned with cases in which the uncer-tain quantity can assume values in a continuous range. An expert is confronted with an uncer-tain quantity, say X, and is asked to specify information about his subjective distribution over the possible values of X. The assessment may take a number of different forms. The expert may specify his cumulative distribution function, or his density or mass function (whichever is appropriate). Alternatively, the analyst may require only partial information about the dis-tribution. This partial information might be the mean and standard deviation, or it might be several quantiles of his distribution. […] The 50% quantile is the median of the distribution. Typically, only the 5%, 50% and 95% quantiles are requested, and distributions are fitted to the elicited quantiles.”
2.5.3 Practical suggestions/references • Written information package (Briefing document): See for an example Frey (1998)
o Provide key information on subject matter ▪ Explain nature of the problem and the uncertainties related to it ▪ Provide key literature that substantiates the problem; take considerable care to
balance potential disparate and disciplinary views. • Consider to ask the experts whether they would like to add some information
material or papers, in particular if multiple disciplines are concerned. • Consider whether or not to add a (qualitative or quantitative) summary; this
might unintentionally stimulate the experts to use only the provided material in their judgment, and dismiss any other information they might possess as experts.
▪ Provide “Case Structure” (See also Morgan & Henrion 1990: clairvoyance test) (Cooke & Goossens, 1999): “When expert judgment is cast in the form of distri-butions of uncertain quantities, the issues of conditionalization and dependence are important. When uncertainty is quantified in an uncertainty analysis, it is al-ways uncertainty conditional on something. It is essential to make clear the background information conditional on which the uncertainty is to be assessed. […] Failure to specify background information can lead experts to conditionalize their uncertainties in different ways and can introduce unnecessary "noise" into the assessment process. The background information will not specify values of all relevant variables. Obviously relevant but unspecified variables should be identified, though an exhaustive list of relevant variables is seldom possible. Un-certainty caused by unknown values of unspecified variables must be "folded into" the uncertainty of the target variables. This is an essential task of the ex-perts in developing their assessments. Variables whose values are not specified in the background information can cause dependencies in the uncertainties of target variables. Dependence in uncertainty analysis is an active issue and meth-ods for dealing with dependence are still very much under development. Suffice to say here, that the analyst must pre-identify groups of variables between which
RIVM letter report 630004001/2008 27
significant dependence may be expected, and must query experts about depend-encies in their subjective distributions for these variables.”
▪ Consider providing the exact elicitation questions; this will trigger the experts to start thinking about their response in advance.
▪ Consider whether or not to be flexible during the elicitation session with respect to the exact wording of the questions. Potential advantages of this flexibility would be to start of the discussion and to create consensus on the understanding of the question: what needs to be considered and what not? However, changing the questions would not be possible in individual elicitation sessions and dimin-ishes the comparability of the results with previous similar group elicitations. In addition, it will delay the process, as it might stimulate discussing every detail of each question and it may also be perceived as improper preparation and irritate some experts.
o Information on the elicitation procedure and human judgment in general
▪ Create awareness of biases in human judgement (see above) ▪ Explain the elicitation procedure; what can the experts expect? ▪ Explain that consensus is NOT a primary objective; disparate views may contain
valuable information about the uncertainties ▪ Explain that experts will be asked to explicitly deliberate their reasoning behind
the elicited judgements. Cooke & Goossens (1999) recommend the following: “The elicitation document will be taken into the elicitation, and perhaps sent to the experts in advance. Therefore, it should be intelli-gible without the analyst’s explanations. The following format for the elicitation document is recommended: • Brief statement of the purpose of the study • Statement of the conditions for participation (e.g. time, remuneration, and use of expert
name) • Brief description of subjective probability assessment, including illustrations of quantiles
etc. • Brief explanation of the performance measures • Elicitation questions for query variables (including seed variables) • Elicitation questions for dependencies. • Graphs, tables, and other common reference material.” They also recommend a pre-testing of the information provided to experts, the elicitation questions and procedure, preferably with people outside the selected expert sample (Cooke & Goossens, 1999): “The dry run exercise aims at finding out whether the case structure docu-ment and the elicitation format document are unambiguously outlined and whether they cap-ture all relevant information and questions. One or two persons experienced in the field of interest should be asked to provide comments on both documents. The dry run experts are asked to study the documents and comment on the following during the dry run session: • is the case structure document clear • are the questions clearly formulated • is the additional information provided with each question appreciated • is the time required to complete the elicitation too long or too short The dry run experts should preferably come from outside the selected panel members. If that is difficult to achieve expert panel members may be asked to do the dry run. After the dry run exercise the case structure document and the elicitation format document will be finalized and sent to the experts of the panel.”
28 RIVM letter report 630004001/2008
2.6 Elicitation of expert judgements for uncertain (theoreti-cally) quantifiable elements
2.6.1 Objective To obtain unbiased input for the eHIA assessment, based on balanced and competent expert judgement according to the level of existing relevant knowledge (level of evidence).
2.6.2 Considerations • Group elicitation session (interactive) or separate elicitations per expert? There is no general agreement on whether and in which circumstances group interactions or independent expert elicitations are more appropriate. The potential benefit of group interac-tion is the sharing of knowledge (e.g. filling in each others gaps in knowledge and achieving better appreciation of different informed [disciplinary] viewpoints). However, downsides in-clude inappropriate dominancy of ‘influential experts’ and the implicit suggestion of the ‘need to achieve consensus’, which is usually unwanted because disagreement may indicate important information about the uncertainty. To quote Cook: “An expert who knows more about a particular subject than anyone else may be able to talk an opponent under the table. This does not mean that his opinions are more likely to be true” (quotation in: Loveridge, 2002). With respect to group interactions, according to Clemen & Winkler (1999), “any benefits are most likely to come from exchanges of information (possibly including individual experts’ probability distributions) as opposed to forced consensus through group probability assess-ments. […] interaction is valuable in ironing out differences in definitions and assumptions, clarifying what is to be forecast or assessed, and exchanging information.” • Typical components of elicitation process The elicitation typically involves the following parts, which could be executed in an iterative way:
o Pre-elicitation training (dry run elicitation procedure) o Elicitation session o Post-elicitation feedback o Analysis of disparate views and if appropriate aggregation of elicited judgments
2.6.3 Practical suggestions • Pre-elicitation training (dry-run the elicitation with a test question) Because most experts are unfamiliar with quantifying their degree of belief in terms of prob-abilities (specified percentiles), a training question is recommended with all experts present. Such a meeting is also useful to provide information and discuss the case structure (§2.4). According to Kotra et al. (1996, page 17) “Individuals (or teams of) subject-matter experts should be provided training before the elicitation to:
o familiarize them with the subject matter (including the necessary background infor-mation on why the elicitation is being performed and how the results will be used);
o familiarize them with the elicitation process; o educate them in both uncertainty and probability encoding and the expression of their
judgements, using subjective probability; o provide them practice in formally articulating their judgements as well as explicitly
identifying their associated assumptions and rationale; and
RIVM letter report 630004001/2008 29
o educate them with regard to possible biased that could be present and influence their judgments”.
According to Cooke & Goossens (1999) “A general outline of the topics of the session are listed below:
o Introduction to the project and the expert panel performed by the project leader (typi-cal duration: 30 to 45 minutes).
o Probabilistic training presentation performed by a project staff member with a scien-tific background in subjective probability theory (typical duration: 2 hours).
o Overview of the code(s) or models for which the exercise is done performed by a project staff member who is or was involved in the code or model development (typical duration: ½ to 1 hour).
o Introduction to the panel's field of interest referring to the case structure document and elicitation format document performed by a project staff member who has a sci-entific background and experience in the field of interest, and who is or was prefera-bly involved in the code or model development (typical duration: 1 to 1½ hour).
o Probabilistic training exercise by the experts supervised the project staff member who performed the probabilistic training presentation. For this purpose questions from available experiments may be used. As the experts will be asked to fill in the training exercise format on-the-spot, the experiment may be in principle known to the experts; the questions should not require extensive computing.
o Issues related to uncertainties in the field of interest performed and supervised by a project staff member preferably the person who presented the introduction to the panel's field of interest; in this part ample time for discussion with the experts must be planned (typical duration: 1 to 2 hours).
o Introduction to the processing of the experts' assessments and the performance meas-ures by a project staff member with expertise in the field of probability theory and the computer programs used (typical duration: 1 hour).
o Introduction to the issue of dependencies among uncertainties of the query variables by a project staff member with a scientific background in probability theory (typical duration: 1 hour).
o Assessment of training exercise by the project staff member who performed the probabilistic training presentation and exercise (typical duration: half an hour).
o Explanation of the elicitation procedure and what is expected from the experts; in particular, the experts need to writing is required for the rationales (typical duration: ½ to 1 hour).
o During the whole training session sufficient time must be taken for discussions with the experts on any relevant matter.”
• Elicitation session
o Format for elicitation questions of uncertain quantities (Cooke & Goossens, 1999): “In defining the variables about which experts will be asked, two golden rules apply: i. Ask for values of observable or potentially observable quantities. ii. Formulate questions in a manner consistent with the way in which an expert repre-
sents the relevant information in his knowledge base. If a target variable satisfies the above two rules, then experts can be asked directly to quantify their uncertainty with regard to this variable.” […] - General format for eliciting continuous variables: Conditional on < values of factors
in the case structure assumptions > Please give the 5%, 50% and 95% quantiles of
30 RIVM letter report 630004001/2008
your uncertainty in < Hypothetical experiment > taking into account that values of < uncertainty set > are unknown.
- General format for “uncertainty over the probability of characteristic C”: Condi-tional on < N items satisfying in the case structure assumptions > Please give the 5%, 50% and 95% quantiles of your uncertainty on < number K of items exhibiting char-acteristic C > taking into account that values of < uncertainty set > are unknown.
[…] A probability may be interpreted either as a limiting relative frequency, or as a de-gree of belief. In either case, a probability is not directly observable. Hence, the analyst should not ask ‘ What is your uncertainty on the probability of event X’; for a number of reasons: - It is ambiguous whether “probability” is to be interpreted objectively or subjectively - If “probability“ is interpreted subjectively, i.e. as degree of belief, then it is not
meaningful to quantify uncertainty, as uncertainty concerns potential observations. - If “probability” is interpreted objectively, then it must be interpreted as limiting rela-
tive frequency, and the physical dimensions of frequency must be specified.” • Decide on the response mode, either:
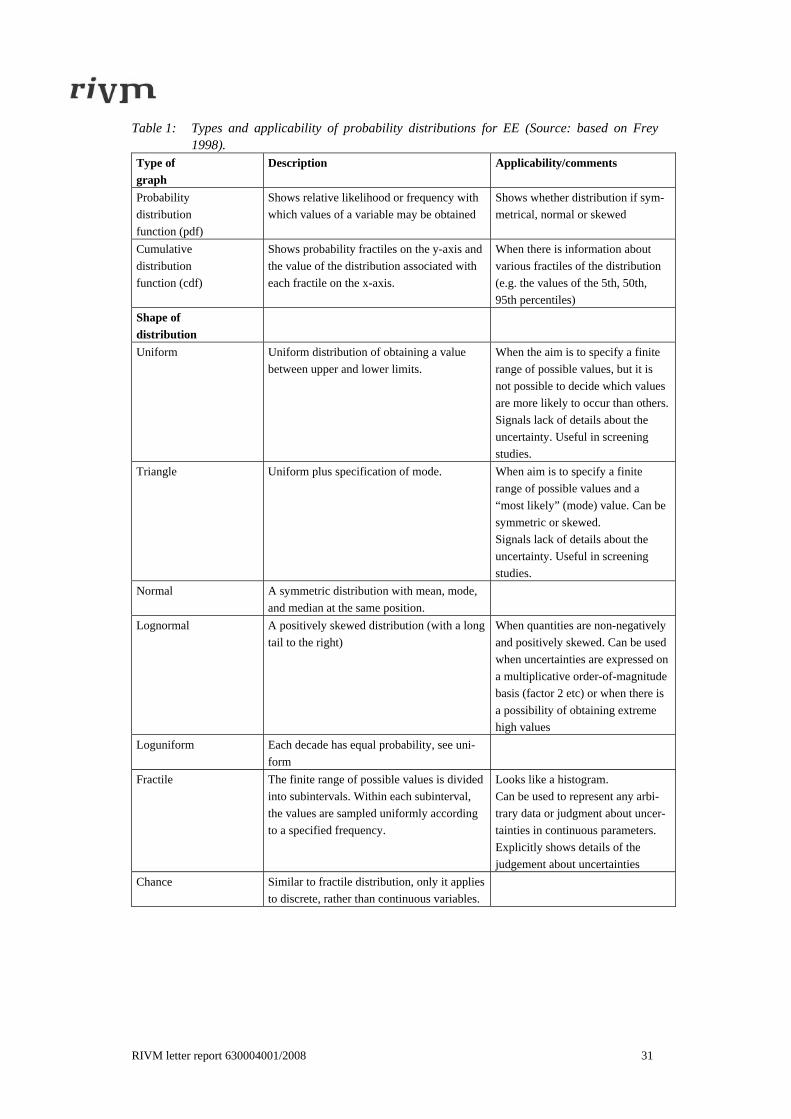
o Dictate the response mode (e.g. specifically ask the experts to define min, max and most likely value or a full probability distribution). See table 1 below for different probability distributions. Such dictation might be easier achieved in computer-assisted (individual or group) elicitation sessions.
o Let the expert decide what format is in his/her opinion in accordance with the level of precision (Risbey & Kandlikar, 2007), and ask for detailed argumentation for this choice. Decide whether to do this from the highest level (full probability density function, as suggested by Risbey & Kandlikar 2007) or the lowest level. In any case, argumentation for the level should be given, including any assumptions made. See table 2 below. NB The initial ‘Pedigree Scoring’ from the previous building block could indicate
the appropriate level and response format. • Order of elicitation questions
o Consider to structure the elicitation session in a way that works from the lower to-wards the upper part of Table 2: the least toward the most certain issues. For exam-ple, first consider the likelihood of a causal relationship between X and Y, and then consider the probability density function of that causal relationship.
RIVM letter report 630004001/2008 31
Table 1: Types and applicability of probability distributions for EE (Source: based on Frey 1998).
Type of graph
Description Applicability/comments
Probability distribution function (pdf)
Shows relative likelihood or frequency with which values of a variable may be obtained
Shows whether distribution if sym-metrical, normal or skewed
Cumulative distribution function (cdf)
Shows probability fractiles on the y-axis and the value of the distribution associated with each fractile on the x-axis.
When there is information about various fractiles of the distribution (e.g. the values of the 5th, 50th, 95th percentiles)
Shape of distribution
Uniform Uniform distribution of obtaining a value between upper and lower limits.
When the aim is to specify a finite range of possible values, but it is not possible to decide which values are more likely to occur than others. Signals lack of details about the uncertainty. Useful in screening studies.
Triangle Uniform plus specification of mode. When aim is to specify a finite range of possible values and a “most likely” (mode) value. Can be symmetric or skewed. Signals lack of details about the uncertainty. Useful in screening studies.
Normal A symmetric distribution with mean, mode, and median at the same position.
Lognormal A positively skewed distribution (with a long tail to the right)
When quantities are non-negatively and positively skewed. Can be used when uncertainties are expressed on a multiplicative order-of-magnitude basis (factor 2 etc) or when there is a possibility of obtaining extreme high values
Loguniform Each decade has equal probability, see uni-form
Fractile The finite range of possible values is divided into subintervals. Within each subinterval, the values are sampled uniformly according to a specified frequency.
Looks like a histogram. Can be used to represent any arbi-trary data or judgment about uncer-tainties in continuous parameters. Explicitly shows details of the judgement about uncertainties
Chance Similar to fractile distribution, only it applies to discrete, rather than continuous variables.

32 RIVM letter report 630004001/2008
Table 2: Characterizations of likelihood for a graduated range of precision levels ranging from fully specified probability distributions through to qualitative declarations of knowledge and igno-rance (Source: Based on Table 5 and related text in: Risbey & Kandlikar, 2007).
Level Measure of likelihood
Justi-fication
Explanation of Step
- - - First define the variable or outcome to be examined and the context in which it is being examined, in order to: • ensure that the outcome in question has a commonly shared under-
standing and can be meaningfully quantified; • facilitate comparison of uncertainties across studies and through time
1 Full prob-ability den-sity function
Robust, well de-fended dis-tribution
This is the full likelihood description. This serves to capture either those variables for which historical data exists, or those for which there is suffi-cient consensus. • Is it reasonable to specify a full probability distribution for the out-
come? If yes, specify the distribution. Justify your choice of distribu-tion and 5/95 percentiles.
• Are there any processes or assumptions that would cause the 5/95 per-centiles to be much wider than you have stated?
• If you cannot provide justifications for why you consider the distribu-tion shape and 5/95 percentiles to be fairly robust, then move to level 2.
2 Bounds Well de-fended per-centile bounds
• Is it reasonable to specify bounds for the distribution of the outcome? If yes, specify 5/95 percentiles.
• Can you describe any processes or assumptions that could lead to broa-der/narrower bounds? If so, describe and revise.
• If the bounds are robust to assumptions, then specify your 5/95 bounds and your reasoning for placing them where you did. If you cannot pro-vide bounds confidently then go to level 3.
• The choice of 5/95 percentiles is by convention. Other ranges (e.g. 10/90) could also be used by different research communities as long as the choice is clear.
3 First order estimates
Order of magnitude assessment
• If appropriate, specify and justify your choice of a first order estimate for the value of the variable, indicating the main assumptions behind the value given. In specifying a value, do not report more precision than is justified.
• For example, if the value is only known to a factor of two or an order of magnitude, then report it in those terms. In some cases, powers of ten may be appropriate; in other cases more nuanced scales may be used so long as they are declared and supported.
• How robust is your estimate to underlying assumptions? If it is not particularly robust to the set of assumptions or outcomes you listed, then go to level 4.
4 Expected sign or trend
Well de-fended trend ex-pectation
• Can you provide a reasonable estimate of the sign or likely trend (in-crease, decrease, no change) of the expected change?
• If so, give the expected trend and explain the reasoning underlying that expectation and why changes of the opposite sign or trend would gen-erally not be expected.
• Describe also any conditions that could lead to a change in trend con-trary to expectations.
• It is reasonable to include in this category changes which have a fair degree of expectation, but which are not certain. The distinction be-tween this category and the following one is that the arguments for the
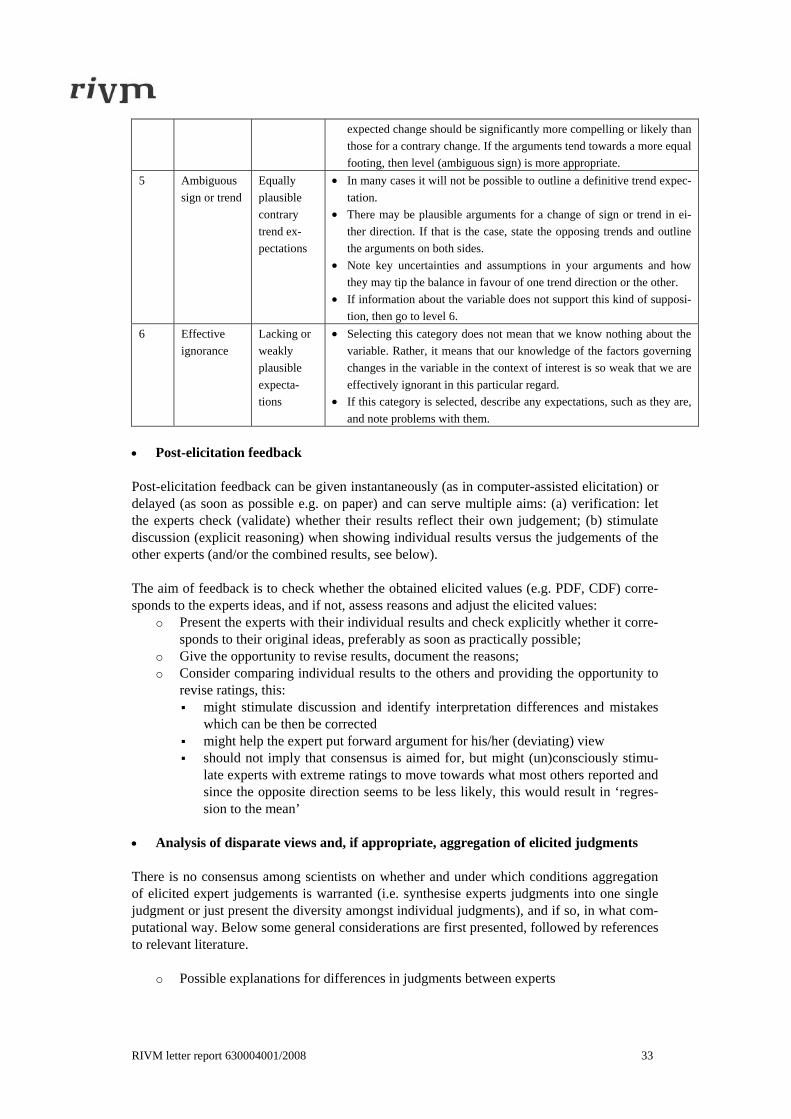
RIVM letter report 630004001/2008 33
expected change should be significantly more compelling or likely than those for a contrary change. If the arguments tend towards a more equal footing, then level (ambiguous sign) is more appropriate.
5 Ambiguous sign or trend
Equally plausible contrary trend ex-pectations
• In many cases it will not be possible to outline a definitive trend expec-tation.
• There may be plausible arguments for a change of sign or trend in ei-ther direction. If that is the case, state the opposing trends and outline the arguments on both sides.
• Note key uncertainties and assumptions in your arguments and how they may tip the balance in favour of one trend direction or the other.
• If information about the variable does not support this kind of supposi-tion, then go to level 6.
6 Effective ignorance
Lacking or weakly plausible expecta-tions
• Selecting this category does not mean that we know nothing about the variable. Rather, it means that our knowledge of the factors governing changes in the variable in the context of interest is so weak that we are effectively ignorant in this particular regard.
• If this category is selected, describe any expectations, such as they are, and note problems with them.
• Post-elicitation feedback Post-elicitation feedback can be given instantaneously (as in computer-assisted elicitation) or delayed (as soon as possible e.g. on paper) and can serve multiple aims: (a) verification: let the experts check (validate) whether their results reflect their own judgement; (b) stimulate discussion (explicit reasoning) when showing individual results versus the judgements of the other experts (and/or the combined results, see below). The aim of feedback is to check whether the obtained elicited values (e.g. PDF, CDF) corre-sponds to the experts ideas, and if not, assess reasons and adjust the elicited values:
o Present the experts with their individual results and check explicitly whether it corre-sponds to their original ideas, preferably as soon as practically possible;
o Give the opportunity to revise results, document the reasons; o Consider comparing individual results to the others and providing the opportunity to
revise ratings, this: ▪ might stimulate discussion and identify interpretation differences and mistakes
which can be then be corrected ▪ might help the expert put forward argument for his/her (deviating) view ▪ should not imply that consensus is aimed for, but might (un)consciously stimu-
late experts with extreme ratings to move towards what most others reported and since the opposite direction seems to be less likely, this would result in ‘regres-sion to the mean’
• Analysis of disparate views and, if appropriate, aggregation of elicited judgments There is no consensus among scientists on whether and under which conditions aggregation of elicited expert judgements is warranted (i.e. synthesise experts judgments into one single judgment or just present the diversity amongst individual judgments), and if so, in what com-putational way. Below some general considerations are first presented, followed by references to relevant literature.
o Possible explanations for differences in judgments between experts

34 RIVM letter report 630004001/2008
“Differences in judgements of the pedigree scores between experts might stem from (a) different background information on which the experts make their judgement; (b) different interpretation of the linguistic descriptions in the pedigree matrix; (c) dis-agreement among experts on a more fundamental level. The first two causes need to be avoided. They can be minimized by a procedure in which a group discussion be-tween experts involved in the scoring precedes the scoring, so that information is shared amongst the experts and interpretation issues are discussed so that a shared understanding is achieved.” (Van der Sluijs 2005).
o Should expert judgements be combined?
▪ Note that consensus is not a primary objective in expert elicitations. Diversity of expert views itself carries valuable information and should be part of the open reporting of the study results. In particular in cases of high value-laden uncer-tainties, it might be more appropriate to report the disparate views and possibly combine judgements according to viewpoint and perform separate analysis in eHIA.
▪ Heterogeneity among experts is highly desirable (“Experts who are very similar [..] tend to provide redundant information, and the high level for dependence means not only minimal gains from aggregation but also difficulties with some modelling approaches due to multicollinearity and the extreme [..] weights that can result” (Clemen & Winkler, 1999).
▪ If there is no compelling reason to combine the judgments, then they need not be combined, obviously. In some cases, however, the judgments are fed into mod-els, or are linked together in a series of other expert panels. In such cases it may not be feasible to propagate all individual expert assessments through the calcu-lations (Cooke & Probst 2006)
o If experts’ judgments are to be combined, how should it be done?
According to Clemen & Winkler 1999, “Combination, or aggregation, procedures are often dichotomized into mathematical and behavioral approaches, although in prac-tice aggregation might involve some aspects of each.”
▪ Mathematical methods for combining experts’ probability functions
“These consist of processes or analytical models that operate on the individual probability distributions to produce a single “combined” probability distribution. Mathematical aggregation methods range from simple summary measures such as arithmetic or geometric means of probabilities to procedures based on axio-matic approaches or on various models of the information-aggregation process requiring inputs regarding characteristics such as the quality of and dependence among the experts’ probabilities […]. Regarding mathematical combining pro-cedures, we believe that simple rules will always play an important role, because of their ease of use, robust performance, and defensibility in public policy set-tings where judgments about the quality of different experts are eschewed. Sim-ple rules do not, however, allow explicit consideration of factors such as over-confidence and dependence among experts” (Clemen & Winkler, 1999). o The simplest method is to give all experts equal weight. o Others advocate the use of weighting factors, i.e. to quantitatively value the
judgments of some experts more than those of others: a performance based linear pooling or weighted averaging model. Examples of these perform-ance-based weighting are (a) “calibration or seed variables”*, (b) ranking by e.g. number of scientific publications or peer-nominations, (c) the experts’
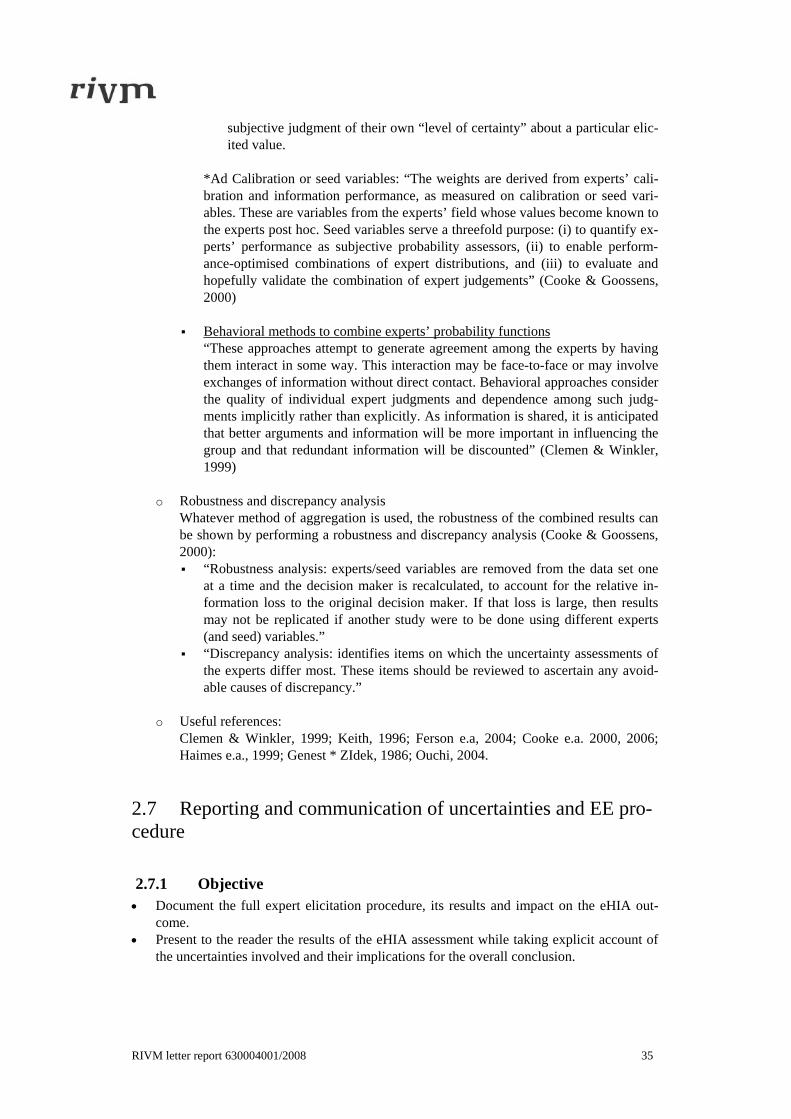
RIVM letter report 630004001/2008 35
subjective judgment of their own “level of certainty” about a particular elic-ited value.
*Ad Calibration or seed variables: “The weights are derived from experts’ cali-bration and information performance, as measured on calibration or seed vari-ables. These are variables from the experts’ field whose values become known to the experts post hoc. Seed variables serve a threefold purpose: (i) to quantify ex-perts’ performance as subjective probability assessors, (ii) to enable perform-ance-optimised combinations of expert distributions, and (iii) to evaluate and hopefully validate the combination of expert judgements” (Cooke & Goossens, 2000)
▪ Behavioral methods to combine experts’ probability functions
“These approaches attempt to generate agreement among the experts by having them interact in some way. This interaction may be face-to-face or may involve exchanges of information without direct contact. Behavioral approaches consider the quality of individual expert judgments and dependence among such judg-ments implicitly rather than explicitly. As information is shared, it is anticipated that better arguments and information will be more important in influencing the group and that redundant information will be discounted” (Clemen & Winkler, 1999)
o Robustness and discrepancy analysis
Whatever method of aggregation is used, the robustness of the combined results can be shown by performing a robustness and discrepancy analysis (Cooke & Goossens, 2000): ▪ “Robustness analysis: experts/seed variables are removed from the data set one
at a time and the decision maker is recalculated, to account for the relative in-formation loss to the original decision maker. If that loss is large, then results may not be replicated if another study were to be done using different experts (and seed) variables.”
▪ “Discrepancy analysis: identifies items on which the uncertainty assessments of the experts differ most. These items should be reviewed to ascertain any avoid-able causes of discrepancy.”
o Useful references:
Clemen & Winkler, 1999; Keith, 1996; Ferson e.a, 2004; Cooke e.a. 2000, 2006; Haimes e.a., 1999; Genest * ZIdek, 1986; Ouchi, 2004.
2.7 Reporting and communication of uncertainties and EE pro-cedure
2.7.1 Objective • Document the full expert elicitation procedure, its results and impact on the eHIA out-
come. • Present to the reader the results of the eHIA assessment while taking explicit account of
the uncertainties involved and their implications for the overall conclusion.
36 RIVM letter report 630004001/2008
2.7.2 Considerations • Reporting of the expert selection process The entire selection process should be systematic and thoroughly documented, with a view of reproducibility and including explicit selection criteria. • Reporting of individual expert judgements Typically, it is favourable for the judgements to be separated from the names of individual experts, so that experts may feel they can respond more freely and avoid some of the possible motivational biases. Consider provision of a list of all participating experts in an acknowl-edgement statement and referring to specific judgements by an arbitrary assigned numbers rather than by the name of each experts.
2.7.3 Practical suggestions/references • Ways to present the results of expert judgements for each criterion in the Pedigree scor-
ing (Van der Sluijs et al., 2005): o Radar diagrams: a line connecting the scores represents the scoring of one expert. o Kite diagrams: showing the minimum, maximum and hence, a band between these
reflecting the disagreement on the pedigree scores. This captures the information from all experts in the group without the need to average expert opinion. [..] One should be very reluctant about averaging pedigree scores elicited from different ex-perts.
• Other useful references: Kloprogge e.a., 2007; Janssen e.a., 2005; Wardekker e.a., 2008
(in press)
RIVM letter report 630004001/2008 37
3 Literature list Basic understanding of human judgment and examples of quantitative expert elicitation pro-tocols and their essential components: • Morgan MG and Henrion M. Uncertainty. A Guide to Dealing with Uncertainty in
Quantitative Risk and Policy Analysis. Chapters 6 & 7. 1990, Cambridge University Press, USA. ISBN 0-521-36542-2.
Methodological suggestions for quantitative and qualitative EE (response format): • Risbey JS. Subjective elements in climate policy advice. Climate Change 2008;85:11-17. • Risbey JS and Kandlikar M. Expressions of likelihood and confidence in the IPCC un-
certainty assessment process. Climate Change 2007;85:19-31. http://www.springerlink.com/content/15314m436j618121/fulltext.pdf
• Van der Sluijs JP, Craye M, Funtowicz S, Kloprogge P, Ravetz J, Risbey J. Combining quantitative and qualitative measures of uncertainty in model-based environmental as-sessment: the NUSAP system. Risk Analysis 2005;25(2): 481-92.
• Kloprogge P, Van der Sluijs JP, Petersen AC. A method for the analysis of assumptions in assessments. MNP Report 550002010/2005, NWS-E-2005-122, Netherlands Environ-mental Assessment Agency (MNP, Copernicus Institute for Sustainable Development and Innovation, Utrecht University, Utrecht, 2005.
• NUSAP literature: http://www.nusap.net/sections.php?op=viewarticle&artid=17 o Examples of pedigree matrices (J van der Sluijs):
http://www.nusap.net/sections.php?op=listarticles&secid=1 o Example of a briefing document (to be used to inform experts):
http://legacy.ncsu.edu/classes/ce456001/www/Background1.html o Frey HCh (1998). BRIEFING PAPER PART 1: Introduction to Uncertainty Analy-
sis. Dept of Civil Engineering. North Carolina State University. Raleigh, NC 27695-7908
o RIVM/MNP Guidance on Uncertainty Assessment and Communication http://www.nusap.net/sections.php?op=viewarticle&artid=17 http://www.nusap.net/downloads/detailedguidance.pdf
o NUSAP Kite diagram maker (Interactive Tool): http://www.nusap.net/sections.php?op=viewarticle&artid=2
• Cooke literature: o Cooke RM and Probst KN. Highlights of the Expert Judgment Policy Symposium
and Technical Workshop. Conference Summary, 2006. http://www.rff.org/expertjudgementdocuments/documents/workshopdocs/RFF-Conf_06-ExpertJudgment.pdf
o Cooke RM and Goossens LLHJ. TU Delft Expert Judgment Data Base. o Cooke RM & Goossens LLHJ. Procedure guide for a structured Expert Elicitation.
Nuclear Science and Technology, EUR 18820, TU Delft, 1999: http://www.rff.org/rff/upload/24770_1.pdf
• Goossens LHJ, Harper FT, Kraan BCP and Métivier H. Expert judgment for a probabil-istic accident consequence uncertainty analysis. Radiation Protection Dosimetry 2000 ; 90(3): 295–301 http://rpd.oxfordjournals.org/cgi/reprint/90/3/295.pdf
Examples expert elicitation procedures: • Kotra JP, Lee MP, Eisenberg NA, DeWispelare AR. Branch Technical Position on the
Use of Expert Elicitation in the High-Level Radioactive Waste Program. 1996 Report no: NUREG-1563. Center for Nuclear Waste Regulatory Analyses, San Antonio, IX 78228-
38 RIVM letter report 630004001/2008
0510, Division of Waste Management, Office of Nuclear Material Safety and Safeguards, U.S. Nuclear Regulatory Commission, Washington, DC 20555-0001. http://www.nrc.gov/reading-rm/doc-collections/nuregs/staff/sr1563/sr1563.pdf
• Risbey JS, Kandlikar M, and Karoly Dj. A protocol to articulate and quantify uncertain-ties in climate change detection and attribution. Climate Research 2000; 16:61-78
• Van der Fels-Klerx HJ, Cooke RM, Nauta MN, Goossens LH, Havelaar AH. A struc-tured expert judgment study for a model of Campylobacter transmission during broiler-chicken processing. Risk Anal 2005;25(1):109-24.
• Leden L and Pulkkine U. Application of a quantitative expert judgment model in traffic safety analysis – two examples showing the advantages and possibilities with the tech-niques. 9th ICTCT Workshop. http://www.ictct.org/workshops/96-Zagreb/Leden.pdf
• Krayer von Krauss MP, Kaiser M, Almaas V, van der Sluijs JP, Kloprogge P. Diagnos-ing and prioritizing uncertainties according to their relevance for policy: The case of transgene silencing. Sci Tot Env 2008; 290:22-34
• Van Gijlswijk R, Coenen P, Pallas T, Van der Sluijs JP. Uncertainty assessment of NOx, SO2, and NH3 emissions in the Netherlands, TNO report R2004/100. 2004. TNO, Apel-doorn. http://www.chem.uu.nl/nws/www/publica/Publicaties2004/e2004-12.pdf
Selection of experts: • RSC The Royal Society of Canada. The Canadian Academy of the Sciences and Humani-
ties. Expert Panels: Manual of Procedures & Guidelines. July 2004 http://www.rsc.ca/files/publications/expert_panels/expert_manual.pdf
• Loveridge D. Discussion Paper Series: Experts and Foresight: Review and experience. Paper 02-09, 2002. Policy Research in Engineering, Science & Technology (PREST). http://www.mbs.ac.uk/Research/engineeringpolicy/publications/documents/PRESTDP02-
09.PDF Communication of uncertainties: • Janssen, P. H. M., A. C. Petersen, J. P. v. d. Sluijs, J. Risbey, J. Ravetz, A guidance for
assessing and communicating uncertainties, Water Science and Technology, 2005, Vol. 52(6), pp. 125-131. http://www.nusap.net/intareseuncertaintytraining/draft_issues%20and%20good%20practice_vs%20180907.pdf
• Wardekker JA, van de Sluijs JP, Janssen PHM, Kloprogge P, Petersen AC. Uncertainty communication in environmental assessments: views from the Dutch science-policy in-terface. Environmental Science and Policy (2008, in press: doi: 10.1016/j.envsci.2008.05.005)
• Kloprogge P, Van der Sluijs J, Wardekker A. Uncertainty Communication. Issues and good practice. Report NWS-E-2007-199, ISBN 978-90-8672-026-2. Netherlands Envi-ronmental Assessment Agency (MNP), Utrecht, December 2007. http://www.nusap.net/downloads/reports/uncertainty_communication.pdf
• Honigh N. Onzekerheden in het Mest- en Ammoniakmodel. Stageverslag. Intern rapport NW&S-I-2004-20, Copernicus Institute for Sustainable Development and Innovation, Universiteit Utrecht.
Further reading on uncertainties and expert elicitation: • Refsgaard JCh, Van der Sluijs JP, Højberg HJ, Vanrolleghem PA. Uncertainty in the
environmental modeling process: A framework and guidance. Environmental Modelling & Software 2007; 22: 1543-56
RIVM letter report 630004001/2008 39
• Rotmans J & Van Asselt MBA. Uncertainty in integrated assessment modelling: A laby-rinthic path. Integrated Assessment 2001;2:43-55.
• Van der Sluijs JP. Integrated Assessment. In: Munn RE and Tolba M (eds.). Encyclo-peadia of lobal Environmental Change, Volume 4, Responding to global environmental change, pp. 250-53. Wiley, London, 2002. Http://ww.chem.uu.nl/nws/www/publica/EGEC-IA.pdf
• Van der Sluijs JP, Anchoring amid uncertainty; On the management of uncertainties in risk assessment of anthropogenic climate change, PhD Thesis, Universiteit Utrecht, 1997, 260 pp. http://www.chem.uu.nl/nws/www/publica/PhDThesisJeroenvanderSluijs1997.pdf
• Van der Sluijs JP, Petersen AC, Janssen PHM, Risbey JS, Ravetz JR (2008) Exploring the quality of evidence for complex and contested policy decisions. Env Res Lett 2008; 3: 024008 (9pp) (http://www.iop.org/EJ/abstract/1748-9326/3/2/024008 )
• Petersen AC. PhD Thesis: Simulating Nature. A philosophical study of computer-simulation uncertainties and their role in climate science and policy advice. Vrije Univer-siteit Amsterdam, 2006.
• Walker KD, Evans JS, Macintosh D. Use of expert judgment in exposure assessment. Part I. Characterization of personal exposure to benzene J Exposure Analysis Environ-mental Epidemiology 2001;11: 308–322.
• Walker WE, Harremoës P, Rotmans J, Van der Sluijs, JP, Van Asselt MBA, Janssen P, Krayer von Krauss MP. Defining Uncertainty: A Conceptual Basis for Uncertainty Man-agement in Model-Based Decision Support Integrated Assessment 2003;4(1):5-17.
• Weiss Ch. Expressing scientific uncertainty. Law, Probability and Risk 2003; 2:25-46. • Weiss Ch. Can there be science-based precaution/ Environ Res Lett 2006;1: 014003.
(http://www.iop.org/EJ/abstract/1748-9326/1/1/014003/) Aggregation of elicited values: • Haimes YY and Lambert JH. Workshop Proceedings for ‘When and How Can You
Specify a Probabiliyu Distribuion When You Don’t Know Much?’ Part II. Workshop Overvew. Risk Analysis 1999; 19(1): 43-7.
• Genest Ch and ZIdek JV. Combining Probability Distributions: A Critique and an Anno-tated bibliography. Statistical Science 1986; 1(1):114-48.
• Clemen RT and Winkler RL. Combining probability distributions from experts in risk analysis Risk Analysis 1999; 19(2): 187-203 http://www.springerlink.com/content/u03574n64401l7t1/fulltext.pdf
• Keith DW. When is it appropriate to Combine Expert Judments? An Editorial Essay. Climate Change 1996; 33(2): 139-43.
• Cooke RM. El Saadany S, Huang X. On the Performance of Social Network and Likeli-hood Based Expert Weighting Schemes. http://www.rff.org/expertjudgementdocuments/documents/relevantdocs/Cookeatall-EJSocNet&Like.pdf
• Cooke RM & Goossens LHJ . Procedures guide for structures expert judgment in acci-dent consequence modelling. Radiation Protection Dosimetry 2000; 90(3): 303–9.
• Ouchi F. A Literature Review on the Use of Expert Opinion in Probabilistic Risk Analy-sis. World Bank Policy Research Working Paper 3201, February 2004. http://www-wds.worldbank.org/external/default/WDSContentServer/IW3P/IB/2004/04/15/000009486_20040415130301/Rendered/INDEX/wps3201Literature.txt
• Ferson S, Joslyn CA, Heltonc JC, Oberkampfd WL, Sentzb K. Summary from the epis-temic uncertainty workshop: consensus amid diversity. Reliability Engineering & System Safety 2004;85(1-3): 355-69.
40 RIVM letter report 630004001/2008
Sensitivity analysis: • EPA, Risk Assessment Forum, Guiding Principles for Monte Carlo Analysis,
EPA/630/R-97/001, 1997 • Saltelli A, Chan K, Scott M. Sensitivity Analysis. John Wiley & Sons Publishers, Prob-
ability and Statistics series, 2000 • Saltelli A, Tarantola S, Campolongo F, Ratto M. Sitivity Analysis in Practice: A Guide
to Assessing Scientific Models. John Wiley & Sons Publishers, 2004 • Saltelli A, et al. Sensitivity Analysis: the primer. John Wiley & Sons Publishers, 2008 (in
press) • Craye M, Laes E, Van der Sluijs J. Re-negotiating the role of external cost calculations
in the Belgian nuclear and sustainable energy debate. In: A. Pereira Guimaraes and S. Funtowicz. Science for Policy, Oxford University Press, forthcoming 2008.
Participatory methods (not issued in this paper): • MNP 2007 Guidance on Stakeholder participation: “Leidraad Stakeholderparticipatie
voor het Milieu en Natuurplanbureau” (MNP 2007) (in Dutch): o Checklist: http://www.mnp.nl/bibliotheek/rapporten/550032004.pdf o Main document: http://www.mnp.nl/bibliotheek/rapporten/550032005.pdf o Praktijkwijzer : http://www.mnp.nl/bibliotheek/rapporten/550032008.pdf
• Elliott J, Heesterbeek S, Lukensmeyer CJ, Slocum N. Participatory Methods Toolkit. A practitioner’s manual. Stef Steyaert (viWTA) and Hervé Lisoir (King Baudouin Founda-tion) (eds). 2005, King Baudouin Foundation and the Flemish Institute for Science and Technology Assessment (viWTA). ISBN 90-5130-506-0. http://www.viwta.be/files/30890_ToolkitENGdef.pdf
• Raadgever GT and Mostert E. Public participation in information management - Over-view of participatory tools and their contribution to adaptive river basin management, Deliverable 1.2.2 of the NeWater project, RBA Centre, TU Delft, 2005. http://www.usf.uni-osnabrueck.de/projects/newater/downloads/newater_wp09.pdf
• Vennix. JAM. Group model-building: tackling messy problems. Syst Dyn Rev 1999; 15:379-401
• Van Kouwen FA. The Quasta Approach. Exploring new pathways to improve the use of knowledge in sustainability challenges. PhD Thesis. 2007. Copernicus Institute for Sus-tainable Development and Innovation, Dept. Environment and Innovation, Utrecht Uni-versity.
Health impact assessment: • Knol AB [a], Petersen A, van der Sluijs JP. Characterizing uncertainties in environ-
mental burden of disease calculations (submitted) • Knol AB [b], Kruize H, Kunseler E, Lebret E. Evaluating indicators to support environ-
mental health policy (Forthcoming) • WHO, 1999 Gothenburg Consensus Paper, European Centre for Health Policy, WHO
Regional Office for Europe, 1999. • Knol AB [c], Lebret E, Briggs D, van Kamp I. Using a causal assessment structure for
complex environmental health problems (Forthcoming) Stakeholder involvement in (uncertainty analysis for) eHIA: • Funtowicz SO & Ravetz JR (1993). Science for the Post-Normal age. Futures, 25(7),
735–55.

RIVM letter report 630004001/2008 41
• Stern PC & Fineberg HV (eds.) (1996) Understanding Risk, Informing Decisions in a Democratic Society, National Research Council, National Academy Press, Washington, DC.
• Craye M, van der Sluijs JP and Funtowicz S. A reflexive approach to dealing with uncer-tainties in environmental health risk science and policy, International Journal for Risk Assessment and Management 2005; 5 (2): 216-36.
• Kasemir B, Jäger J, Jaeger CC and Gardner MT (eds.) (2003) Public Participation in Sustainability Science: A Handbook, Cambridge University Press, Cambridge. http://www.cambridge.org/uk/catalogue/catalogue.asp?isbn=0521521440
• Kloprogge P & van der Sluijs J. The inclusion of stakeholder knowledge and perspec-tives in integrated assessment of climate change. Climatic Change 2006; 75 (3) 359-389.

42 RIVM letter report 630004001/2008
RIVM letter report 630004001/2008 43
Appendix 1: Glossary (Source: http://www.nusap.net/modules.php?op=modload&name=NS-Glossary&file=index, except for those in italics)
Anchoring (bias)
Assessments are often unduly weighted toward the conventional value, or first value given, or to the findings of previous assessments in making an assessment. Thus, they are said to be 'anchored' to this value.
Availability (bias)
This bias refers to the tendency to give too much weight to readily available data or recent experience (which may not be representative of the required data) in making assessments.
Bias (general) A constant or systematic deviation as opposed to a random error. It appears as a persistent over- or under-estimation of the quantity measured, calculated or esti-mated. See also expert bias and value loading.
Cognitive bias
See Expert bias
Coherence (bias)
Events are considered more likely when many scenarios can be created that lead to the event, or if some scenarios are particularly coherent. Conversely, events are considered unlikely when scenarios can not be imagined. Thus, probabilities tend to be assigned more on the basis of one's ability to tell coherent stories than on the basis of intrinsic probability of occurrence.
Disciplinary bias
Science tends to be organized into different disciplines. Disciplines develop somewhat distintive cultures over time. That is, they tend to develop their own character, manner of viewing problems, manner of drawing problem boundaries and selecting the objects of inquiry, and so on. These differences in perspective will translate into forms of bias in viewing problems.
Environ-mental Health Impact As-sessment (eHIA)
A combination of procedures, methods and tools by which an environment-related policy, programme or project may be judged as to its potential effects on the health of a population, and the distribution of those effects within the popula-tion (adapted from WHO, 1999)
Expert bias (cognitive bias)
Experts and lay people alike are subject to a variety of sources of cognitive bias in making assessments. Some of these sources of bias are as follows: overconfidence, anchoring, availability, representativeness, satisficing, unstated assumptions, coherence. A fuller description of sources of cognitive bias in ex-pert and lay elicitation processes is available in Dawes (1988).
Expert Elici-tation
Expert elicitation refers to a systematic approach to synthesize subjective judg-ments of experts on a subject where there is uncertainty due to insufficient data, when such data is unattainable because of physical constraints or lack of re-sources. It seeks to make explicit and utilizable the unpublished knowledge and wisdom in the heads of experts, based on their accumulated experience and ex-pertise, including their insight in the limitations, strengths and weaknesses of the published knowledge and available data.
Expert Judg-ment
An expert is a person with special knowledge or skills in a particular domain. Judgment refers to inferences made in forming opinions. Thus, an expert judg-ment should be the inferential opinion of a domain specialist regarding an issue within the area of expertise.
Global Sensi-tivity analysis
Global sensitivity analysis is a combination of sensitivity and uncertainty analysis in which "a neighbourhood of alternative assumptions is selected and the corre-sponding interval of inferences is identified. Conclusions are judged to be sturdy only if the neighbourhood of assumptions is wide enough to be credible and the

44 RIVM letter report 630004001/2008
corresponding interval of inferences is narrow enough to be useful". Leamer (1990) quoted in Saltelli (2001).
Ignorance (uncertainty)
The deepest of the three sorts of uncertainty distinguished by Funtowicz and Ravetz (1990): Inexactness, unreliability and border with ignorance. Our knowl-edge of the behavior of the data gives us the spread, and knowledge of the proc-ess gives us the assessment, but there is still something more. No process in the field or laboratory is completely known. Even physical constants may vary un-predictably. This is the realm of our ignorance: it includes all the different sorts of gaps in our knowledge not encompassed in the previous sorts of uncertainty. This ignorance may merely be of what is significant, such as when anomalies in experiments are discounted or neglected, or it may be deeper, as is appreciated retrospectively when revolutionary new advances are made. Thus, space-time and matter-energy were both beyond the bounds of physical imagination, and hence of scientific knowledge, before they were discovered. Can we say anything useful about that of which we are ignorant? It would seem by the very definition of ig-norance that we cannot, but the boundless sea of ignorance has shores, which we can stand on and map. The Pedigree qualifier in the NUSAP system maps this border with ignorance in knowledge production. In this way it goes beyond what statistics has provided in its mathematical approach to the management of uncer-tainty. One of the categories on the continuum of uncertainty due to lack of knowledge identified in the PRIMA typology (Van Asselt, 2000). The PRIMA typology dis-tinguishes between: reducible ignorance and irreducible ignorance. Reducible ignorance processes that we do not observe, or theoretically imagine at this point in time, but probably in the future. 'We don't know what we do not know'. Irreducible ignorance there may be processes and interactions between processes that cannot, or not unambiguously, be determined by human capacities and capa-bilities. 'We cannot know'.
Indertermi-nacy
Inderterminacy is a category of uncertainty which refers to the open-endedness (both social and natural) in the processes of environmental damage caused by human intervention. It applies to processes where the outcome cannot (or only partly) be determined from the input. Indeterminacy introduces the idea that con-tingent social behavior also has to be included in the analytical and prescriptive framework. It acknowledges the fact that many knowledge claims are not fully determined by empirical observations but are based on a mixture of observation and interpretation. The latter implies that scientific knowledge depends not only on its degree of fit with nature (the observation part), but also on its correspon-dence with the social world (the interpretation part) and on its success in building and negotiating trust and credibility for the way science deals with the 'interpre-tive space'. One of the categories on the continuum of uncertainty due to lack of knowledge identified in the PRIMA typology (Van Asselt, 2000). Indeterminacy occurs in case of processes of which we understand the principles and laws, but which can never be fully predicted or determined. 'We will never know'.
Inexactness One of the three sorts of uncertainty distinguished by Funtowicz and Ravetz (1990): Inexactness, unreliability and border with ignorance. Quantitative (nu-merical) inexactness is the simplest sort of uncertainty; it is usually expressed by significant digits and error bars. Every set of data has a spread, which may be considered in some contexts as a tolerance or a random error in a calculated measurement. It is the kind of uncertainty that relates most directly to the stated
RIVM letter report 630004001/2008 45
quantity, and is most familiar to student of physics and even the general public. Next to quantitative inexactness one can also distinguish qualitative inexactness which occurs if qualitative knowledge is not exact but comprises a range. One of the categories on the continuum of uncertainty due to lack of knowledge identified in the PRIMA typology (Van Asselt, 2000). Inexactness, also referred to as lack of precision, inaccuracy, metrical uncertainty, measurement errors, or precise uncertainties. 'We roughly know'.
Institutional uncertainty
One of the seven types of uncertainty distinguished by De Marchi (1994) in her checklist for characterizing uncertainty in environmental emergencies: institu-tional, legal, moral, proprietary, scientific, situational, and societal uncertainty. Institutional uncertainty is in some sense a subset of societal uncertainty, and refers more specifically to the role and actions of institutions and their members. Institutional uncertainty stems from the "diverse cultures and traditions, divergent missions and values, different structures, and work styles among personnel of different agencies" (De Marchi, 1994). High institutional uncertainty can hinder collaboration or understanding among agencies, and can make the actions of in-stitutions difficult to predict.
Lack of ob-servations/ measurements
One of the categories on the continuum of uncertainty due to lack of knowledge identified in the PRIMA typology (Van Asselt, 2000). Lack of observa-tions/measurements refers to lacking data that could have been collected, but haven't been. 'We could have known'.
Legal uncer-tainty
One of the seven types of uncertainty distinguished by De Marchi et al. in their checklist for characterizing uncertainty in environmental emergencies: institu-tional, legal, moral, proprietary, scientific, situational, and societal uncertainty. Legal uncertainty is relevant "wherever agents must consider future contingen-cies of personal liability for their actions (or inactions)". High legal uncertainty can result in defensive responses in regard to both decision making and release of information. Legal uncertainty may also play a role where actions are conditioned on the clarity or otherwise of a legal framework in allowing one to predict the consequences of particular actions.
Limited knowledge
One of the sources of uncertainty identified in the PRIMA typology (Van Asselt, 2000). Limited knowledge is a property of the analysts performing the study and/or of our state of knowledge. Also referred to as 'subjective uncertainty', 'in-completeness of the information', 'informative uncertainty', 'secondary uncer-tainty', or 'internal uncertainty'. Limited knowledge results partly out of variabil-ity, but knowledge with regard to deterministic processes can also be incomplete and uncertain. A continuum can be described that ranges from unreliability to structural uncertainty.
Monte Carlo Simulation
Monte Carlo Simulation is a statistical technique for stochastic model-calculations and analysis of error propagation in calculations. It's purpose is to trace out the structure of the distributions of model output. In it's simplest form this distribution is mapped by calculating the deterministic results (realizations) for a large number of random draws from the individual distribution functions of input data and parameters of the model. To reduce the required number of model runs needed to get sufficient information about the distribution in the outcome (mainly to save computation time), advanced sampling methods have been de-signed such as Latin Hyper Cube sampling. The latter makes use of stratification in the sampling of individual parameters and pre-existing information about cor-relations between input variables.
Moral uncer-tainty
One of the seven types of uncertainty distinguished by De Marchi et al. in their checklist for characterizing uncertainty in environmental emergencies: institu-

46 RIVM letter report 630004001/2008
tional, legal, moral, proprietary, scientific, situational, and societal uncertainty. Moral uncertainty stems from the underlying moral issues related to action and inaction in any given case. De Marchi notes that, though similar to legal respon-sibility, moral guilt may occur absent legal responsibility when negative conse-quences might have been limited by the dissemination of prior information or more effective management for example. "Moral uncertainty is linked to the ethi-cal tradition of a given country be it or not enacted in legislation (juridical and societal norms, shared moral values, mores), as well as the psychological charac-teristics of persons in charge, their social status and professional roles" (De Marchi, 1994). Moral uncertainty would typically be high when moral and ethical dimensions of an issue are central and participants have a range of understand-ings of the moral imperatives at stake.
Motivational bias
This occurs when people have an incentive to reach a certain conclusion or see things a certain way. It is a pitfall in expert elicitation. Reasons for occurrence of motivational bias include: a) a person may want to influence a decision to go a certain way; b) the person may perceive that he will be evaluated based on the outcome and might tend to be conservative in his estimates; c) the person may want to suppress uncertainty that he actually believes is present in order to appear knowledgeable or authoritative; and d) the expert has taken a strong stand in the past and does not want to appear to contradict himself by producing a distribution that lends credence to alternative views.
Overconfi-dence (bias)
Experts tend to over-estimate their ability to make quantitative judgements. This can sometimes be seen when an estimate of a quantity and its uncertainty are given, and it is retrospectively discovered that the true value of the quantity lies outside the interval. This is difficult for an individual to guard against; but a gen-eral awareness of the tendency can be important.
NUSAP NUSAP Acronym for Numeral Unit Spread Assessment Pedigree Notational system developed by Silvio Funtowicz and Jerry Ravetz to better man-age and communicate uncertainty in science for policy.
Parameter
A quantity related to one or more variables in such a way that it remains constant for any specified set of values of the variable or variables.
Pedigree Pedigree conveys an evaluative account of the production process of information (e.g. a number) on a quantity or phenomenon, and indicates different aspects of the underpinning of the numbers and scientific status of the knowledge used. Pedigree is expressed by means of a set of pedigree criteria to assess these differ-ent aspects. Examples of such criteria are empirical basis or degree of validation. These criteria are in fact yardsticks for strength. Many of these criteria are hard to measure in an objective way. Assessment of pedigree involves qualitative expert judgement. To minimise arbitrariness and subjectivity in measuring strength a pedigree matrix is used to code qualitative expert judgements for each criterion into a discrete numeral scale from 0 (weak) to 4 (strong) with linguistic descrip-tions (modes) of each level on the scale. Note that these linguistic descriptions are mainly meant to provide guidance in attributing scores to each of the criteria. It is not possible to capture all aspects that an expert may consider in scoring a pedigree in a single phrase. Therefore a pedigree matrix should be applied with some flexibility and creativity. Examples of pedigree matrices can be found in the Pedigree matrices section of the website www.nusap.net
Practically immeasurable
One of the categories on the continuum of uncertainty due to lack of knowledge identified in the PRIMA typology (Van Asselt, 2000). Practically immeasurable refers to lacking data that in principle can be measured, but not in practice (too expensive, too lengthy, not feasible experiments). 'We know what we do not
RIVM letter report 630004001/2008 47
know'. PRIMA ap-proach
Acronym for Pluralistic fRamework of Integrated uncertainty Management and risk Analysis (Van Asselt, 2000). The guiding principle is that uncertainty legiti-mates different perspectives and that as a consequence uncertainty management should consider different perspectives. Central to the PRIMA approach is the issue of disentangling controversies on complex issues in terms of salient uncer-tainties. The salient uncertainties are then 'coulored' according to various perspec-tives. Starting from these perspective-based interpretations, various legitimate and consistent narratives are developed to serve as a basis for integrated analysis of autonomous and policy-driven developments in terms of risk.
Probabilistic Based on the notion of probabilities Probability density func-tion (PDF)
The probability density function of a continuous random variable represents the probability that an infinitely small variable interval will fall at a given value. The probability density function can be integrated to obtain the probability that the random variable takes a value in a given interval.
Proprietary uncertainty
One of the seven types of uncertainty distinguished by De Marchi et al. in their checklist for characterizing uncertainty in environmental emergencies: institu-tional, legal, moral, proprietary, scientific, situational, and societal uncertainty. Proprietary uncertainty occurs due to the fact that information and knowledge about an issue are not uniformly shared among all those who could potentially use it. That is, some people or groups have information that others don't and may assert ownership or control over it. "Proprietary uncertainty becomes most salient when it is necessary to reconcile the general needs for safety, health, and envi-ronment protection with more sectorial needs pertaining, for instance, to indus-trial production and process, or to licensing and control procedures" (De Marchi, 1994). De Marchi notes that 'whistle blowing' is another source of proprietary uncertainty in that there is a need for protection of those who act in sharing in-formation for the public good. Proprietary uncertainty would typically be high when knowledge plays a key role in assessment, but is not widely shared among participants. An example of such would be the case of external safety of military nuclear production facilities.
Representa-tiveness (bias)
This is the tendency to place more confidence in a single piece of information that is considered representative of a process than in a larger body of more gener-alized information.
Satisficing (bias)
This refers to a common tendency to search through a limited number of familiar solution options and to pick from among them. Comprehensiveness is sacrificed for expediency in this case.
Scenario
A plausible description of how the future may develop, based on a coherent and internally consistent set of assumptions about key relationships and driving forces (e.g., rate of technology changes, prices). Note that scenarios are neither predic-tions nor forecasts. The results of scenarios (unlike forecasts) depend on the boundary conditions of the scenario.
Scientific uncertainty
One of the seven types of uncertainty distinguished by De Marchi et al. in their checklist for characterizing uncertainty in environmental emergencies: institu-tional, legal, moral, proprietary, scientific, situational, and societal uncertainty. Scientific uncertainty refers to uncertainty which emanates from the scientific and technical dimensions of a problem as opposed to the legal, moral, societal, institutional, proprietary, and situational dimensions outlined by De Marchi et al. Scientific uncertainty is intrinsic to the processes of risk assessment and forecast-ing.
Sensitivity Sensitivity analysis is the study of how the uncertainty in the output of a model
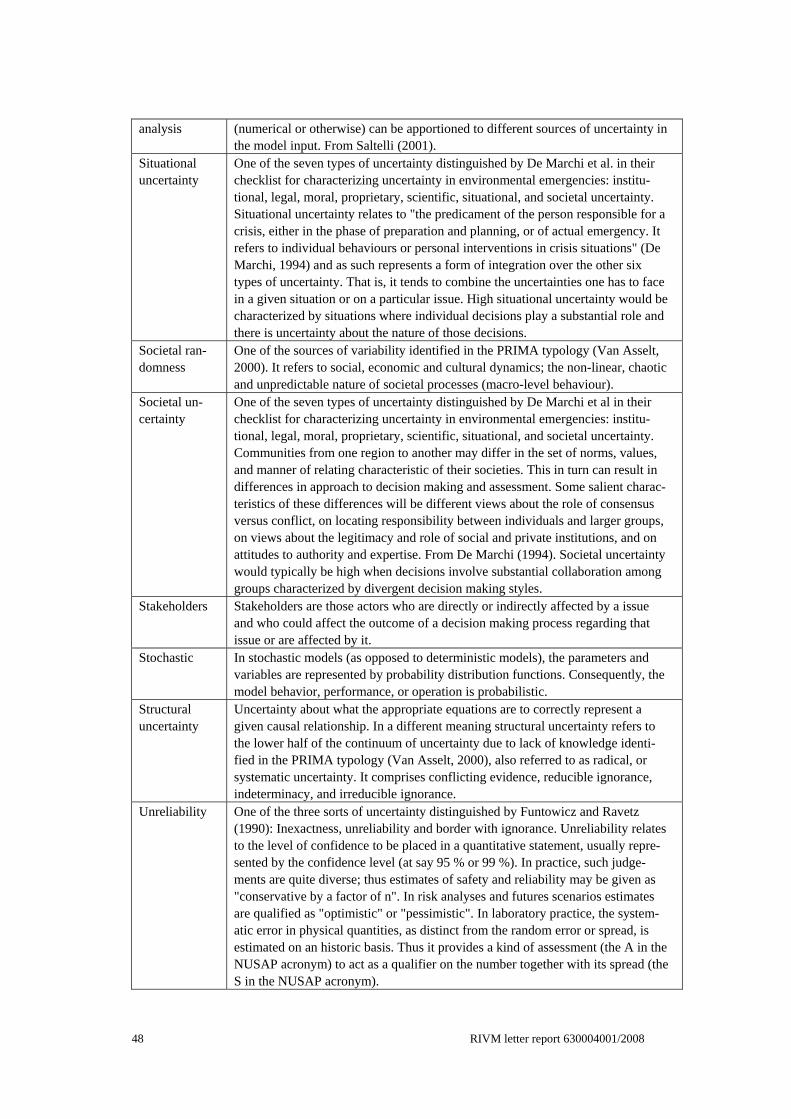
48 RIVM letter report 630004001/2008
analysis (numerical or otherwise) can be apportioned to different sources of uncertainty in the model input. From Saltelli (2001).
Situational uncertainty
One of the seven types of uncertainty distinguished by De Marchi et al. in their checklist for characterizing uncertainty in environmental emergencies: institu-tional, legal, moral, proprietary, scientific, situational, and societal uncertainty. Situational uncertainty relates to "the predicament of the person responsible for a crisis, either in the phase of preparation and planning, or of actual emergency. It refers to individual behaviours or personal interventions in crisis situations" (De Marchi, 1994) and as such represents a form of integration over the other six types of uncertainty. That is, it tends to combine the uncertainties one has to face in a given situation or on a particular issue. High situational uncertainty would be characterized by situations where individual decisions play a substantial role and there is uncertainty about the nature of those decisions.
Societal ran-domness
One of the sources of variability identified in the PRIMA typology (Van Asselt, 2000). It refers to social, economic and cultural dynamics; the non-linear, chaotic and unpredictable nature of societal processes (macro-level behaviour).
Societal un-certainty
One of the seven types of uncertainty distinguished by De Marchi et al in their checklist for characterizing uncertainty in environmental emergencies: institu-tional, legal, moral, proprietary, scientific, situational, and societal uncertainty. Communities from one region to another may differ in the set of norms, values, and manner of relating characteristic of their societies. This in turn can result in differences in approach to decision making and assessment. Some salient charac-teristics of these differences will be different views about the role of consensus versus conflict, on locating responsibility between individuals and larger groups, on views about the legitimacy and role of social and private institutions, and on attitudes to authority and expertise. From De Marchi (1994). Societal uncertainty would typically be high when decisions involve substantial collaboration among groups characterized by divergent decision making styles.
Stakeholders Stakeholders are those actors who are directly or indirectly affected by a issue and who could affect the outcome of a decision making process regarding that issue or are affected by it.
Stochastic In stochastic models (as opposed to deterministic models), the parameters and variables are represented by probability distribution functions. Consequently, the model behavior, performance, or operation is probabilistic.
Structural uncertainty
Uncertainty about what the appropriate equations are to correctly represent a given causal relationship. In a different meaning structural uncertainty refers to the lower half of the continuum of uncertainty due to lack of knowledge identi-fied in the PRIMA typology (Van Asselt, 2000), also referred to as radical, or systematic uncertainty. It comprises conflicting evidence, reducible ignorance, indeterminacy, and irreducible ignorance.
Unreliability One of the three sorts of uncertainty distinguished by Funtowicz and Ravetz (1990): Inexactness, unreliability and border with ignorance. Unreliability relates to the level of confidence to be placed in a quantitative statement, usually repre-sented by the confidence level (at say 95 % or 99 %). In practice, such judge-ments are quite diverse; thus estimates of safety and reliability may be given as "conservative by a factor of n". In risk analyses and futures scenarios estimates are qualified as "optimistic" or "pessimistic". In laboratory practice, the system-atic error in physical quantities, as distinct from the random error or spread, is estimated on an historic basis. Thus it provides a kind of assessment (the A in the NUSAP acronym) to act as a qualifier on the number together with its spread (the S in the NUSAP acronym).
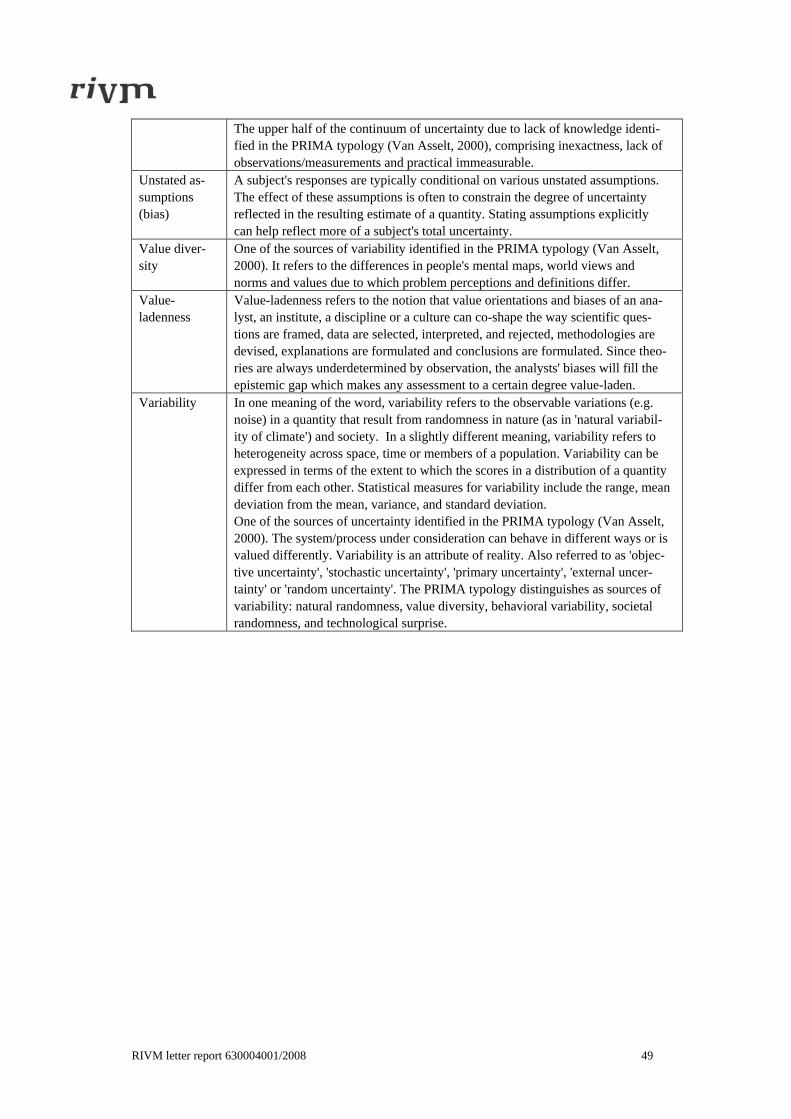
RIVM letter report 630004001/2008 49
The upper half of the continuum of uncertainty due to lack of knowledge identi-fied in the PRIMA typology (Van Asselt, 2000), comprising inexactness, lack of observations/measurements and practical immeasurable.
Unstated as-sumptions (bias)
A subject's responses are typically conditional on various unstated assumptions. The effect of these assumptions is often to constrain the degree of uncertainty reflected in the resulting estimate of a quantity. Stating assumptions explicitly can help reflect more of a subject's total uncertainty.
Value diver-sity
One of the sources of variability identified in the PRIMA typology (Van Asselt, 2000). It refers to the differences in people's mental maps, world views and norms and values due to which problem perceptions and definitions differ.
Value-ladenness
Value-ladenness refers to the notion that value orientations and biases of an ana-lyst, an institute, a discipline or a culture can co-shape the way scientific ques-tions are framed, data are selected, interpreted, and rejected, methodologies are devised, explanations are formulated and conclusions are formulated. Since theo-ries are always underdetermined by observation, the analysts' biases will fill the epistemic gap which makes any assessment to a certain degree value-laden.
Variability In one meaning of the word, variability refers to the observable variations (e.g. noise) in a quantity that result from randomness in nature (as in 'natural variabil-ity of climate') and society. In a slightly different meaning, variability refers to heterogeneity across space, time or members of a population. Variability can be expressed in terms of the extent to which the scores in a distribution of a quantity differ from each other. Statistical measures for variability include the range, mean deviation from the mean, variance, and standard deviation. One of the sources of uncertainty identified in the PRIMA typology (Van Asselt, 2000). The system/process under consideration can behave in different ways or is valued differently. Variability is an attribute of reality. Also referred to as 'objec-tive uncertainty', 'stochastic uncertainty', 'primary uncertainty', 'external uncer-tainty' or 'random uncertainty'. The PRIMA typology distinguishes as sources of variability: natural randomness, value diversity, behavioral variability, societal randomness, and technological surprise.
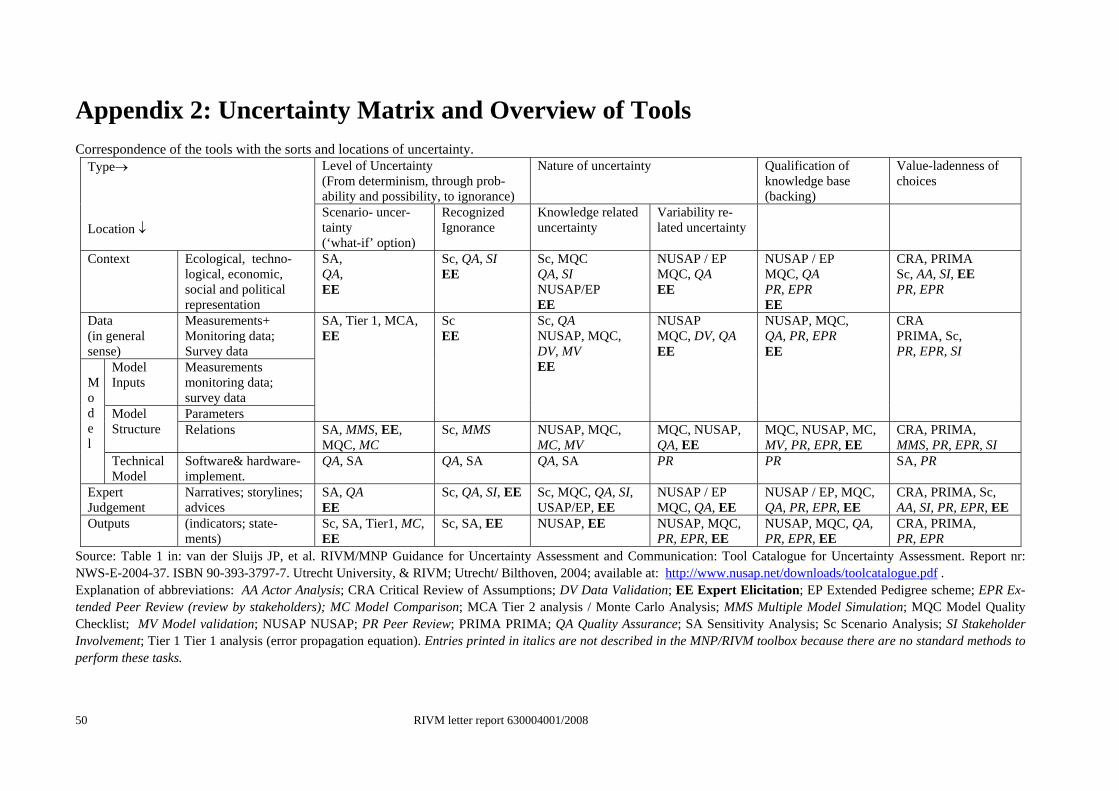
50 RIVM letter report 630004001/2008
Appendix 2: Uncertainty Matrix and Overview of Tools Correspondence of the tools with the sorts and locations of uncertainty.
Level of Uncertainty (From determinism, through prob-ability and possibility, to ignorance)
Nature of uncertainty Qualification of knowledge base (backing)
Value-ladenness of choices
Type→ Location ↓
Scenario- uncer-tainty (‘what-if’ option)
Recognized Ignorance
Knowledge related uncertainty
Variability re-lated uncertainty
Context Ecological, techno-logical, economic, social and political representation
SA, QA, EE
Sc, QA, SI EE
Sc, MQC QA, SI NUSAP/EP EE
NUSAP / EP MQC, QA EE
NUSAP / EP MQC, QA PR, EPR EE
CRA, PRIMA Sc, AA, SI, EE PR, EPR
Data (in general sense)
Measurements+ Monitoring data; Survey data
Model Inputs
Measurements monitoring data; survey data Parameters
SA, Tier 1, MCA, EE
Sc EE
Sc, QA NUSAP, MQC, DV, MV EE
NUSAP MQC, DV, QA EE
NUSAP, MQC, QA, PR, EPR EE
CRA PRIMA, Sc, PR, EPR, SI
Model Structure Relations SA, MMS, EE,
MQC, MC Sc, MMS NUSAP, MQC,
MC, MV MQC, NUSAP, QA, EE
MQC, NUSAP, MC, MV, PR, EPR, EE
CRA, PRIMA, MMS, PR, EPR, SI
Mo d e l
Technical Model
Software& hardware-implement.
QA, SA QA, SA QA, SA PR PR SA, PR
Expert Judgement
Narratives; storylines; advices
SA, QA EE
Sc, QA, SI, EE Sc, MQC, QA, SI, USAP/EP, EE
NUSAP / EP MQC, QA, EE
NUSAP / EP, MQC, QA, PR, EPR, EE
CRA, PRIMA, Sc, AA, SI, PR, EPR, EE
Outputs (indicators; state-ments)
Sc, SA, Tier1, MC, EE
Sc, SA, EE NUSAP, EE NUSAP, MQC, PR, EPR, EE
NUSAP, MQC, QA, PR, EPR, EE
CRA, PRIMA, PR, EPR
Source: Table 1 in: van der Sluijs JP, et al. RIVM/MNP Guidance for Uncertainty Assessment and Communication: Tool Catalogue for Uncertainty Assessment. Report nr: NWS-E-2004-37. ISBN 90-393-3797-7. Utrecht University, & RIVM; Utrecht/ Bilthoven, 2004; available at: http://www.nusap.net/downloads/toolcatalogue.pdf . Explanation of abbreviations: AA Actor Analysis; CRA Critical Review of Assumptions; DV Data Validation; EE Expert Elicitation; EP Extended Pedigree scheme; EPR Ex-tended Peer Review (review by stakeholders); MC Model Comparison; MCA Tier 2 analysis / Monte Carlo Analysis; MMS Multiple Model Simulation; MQC Model Quality Checklist; MV Model validation; NUSAP NUSAP; PR Peer Review; PRIMA PRIMA; QA Quality Assurance; SA Sensitivity Analysis; Sc Scenario Analysis; SI Stakeholder Involvement; Tier 1 Tier 1 analysis (error propagation equation). Entries printed in italics are not described in the MNP/RIVM toolbox because there are no standard methods to perform these tasks.
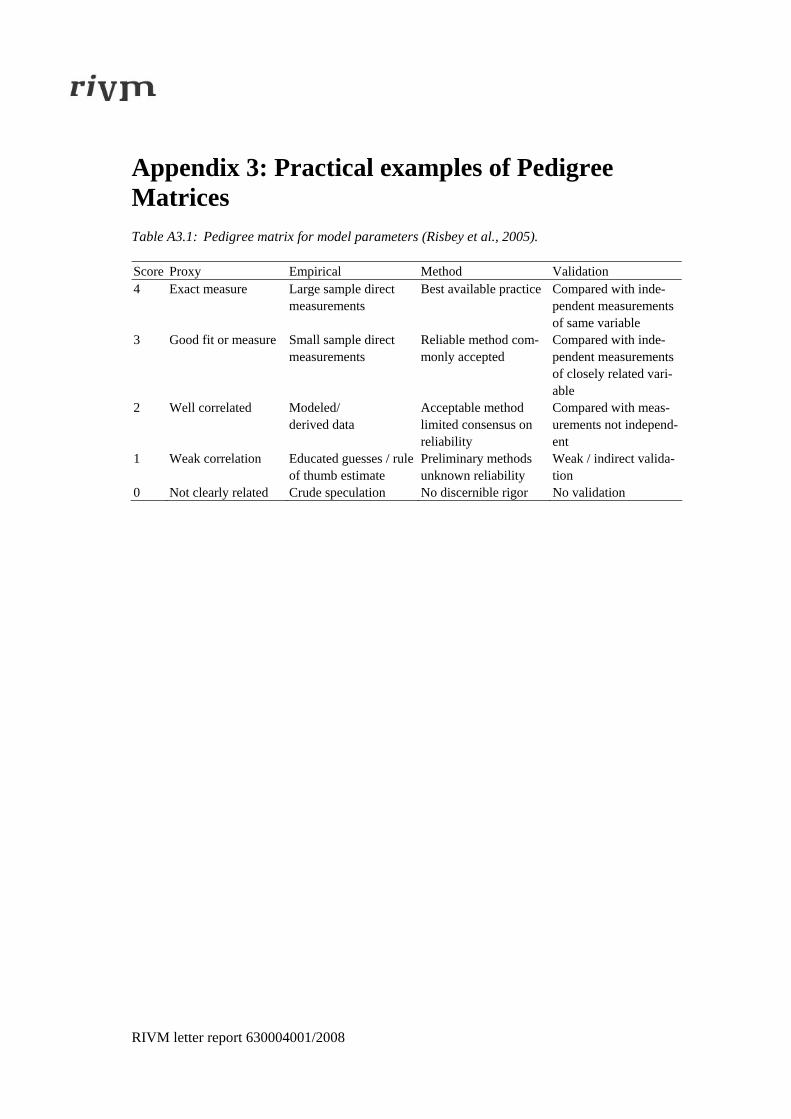
RIVM letter report 630004001/2008
Appendix 3: Practical examples of Pedigree Matrices Table A3.1: Pedigree matrix for model parameters (Risbey et al., 2005). Score Proxy Empirical Method Validation 4 Exact measure Large sample direct
measurements Best available practice Compared with inde-
pendent measurements of same variable
3 Good fit or measure Small sample direct measurements
Reliable method com-monly accepted
Compared with inde-pendent measurements of closely related vari-able
2 Well correlated Modeled/ derived data
Acceptable method limited consensus on reliability
Compared with meas-urements not independ-ent
1 Weak correlation Educated guesses / rule of thumb estimate
Preliminary methods unknown reliability
Weak / indirect valida-tion
0 Not clearly related Crude speculation No discernible rigor No validation
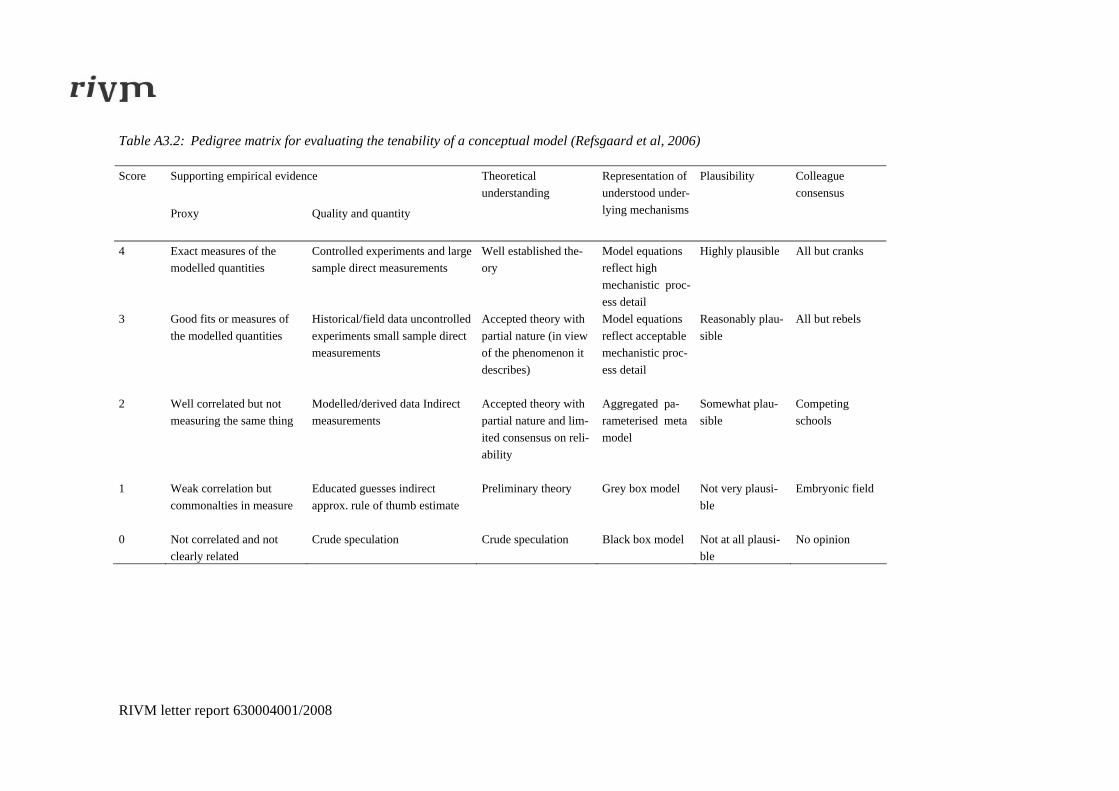
RIVM letter report 630004001/2008
Table A3.2: Pedigree matrix for evaluating the tenability of a conceptual model (Refsgaard et al, 2006)
Supporting empirical evidence Score
Proxy Quality and quantity
Theoretical understanding
Representation of understood under-lying mechanisms
Plausibility Colleague consensus
4 Exact measures of the modelled quantities
Controlled experiments and large sample direct measurements
Well established the-ory
Model equations reflect high mechanistic proc-ess detail
Highly plausible All but cranks
3 Good fits or measures of the modelled quantities
Historical/field data uncontrolled experiments small sample direct measurements
Accepted theory with partial nature (in view of the phenomenon it describes)
Model equations reflect acceptable mechanistic proc-ess detail
Reasonably plau-sible
All but rebels
2 Well correlated but not measuring the same thing
Modelled/derived data Indirect measurements
Accepted theory with partial nature and lim-ited consensus on reli-ability
Aggregated pa-rameterised meta model
Somewhat plau-sible
Competing schools
1 Weak correlation but commonalties in measure
Educated guesses indirect approx. rule of thumb estimate
Preliminary theory Grey box model Not very plausi-ble
Embryonic field
0 Not correlated and not clearly related
Crude speculation Crude speculation Black box model Not at all plausi-ble
No opinion
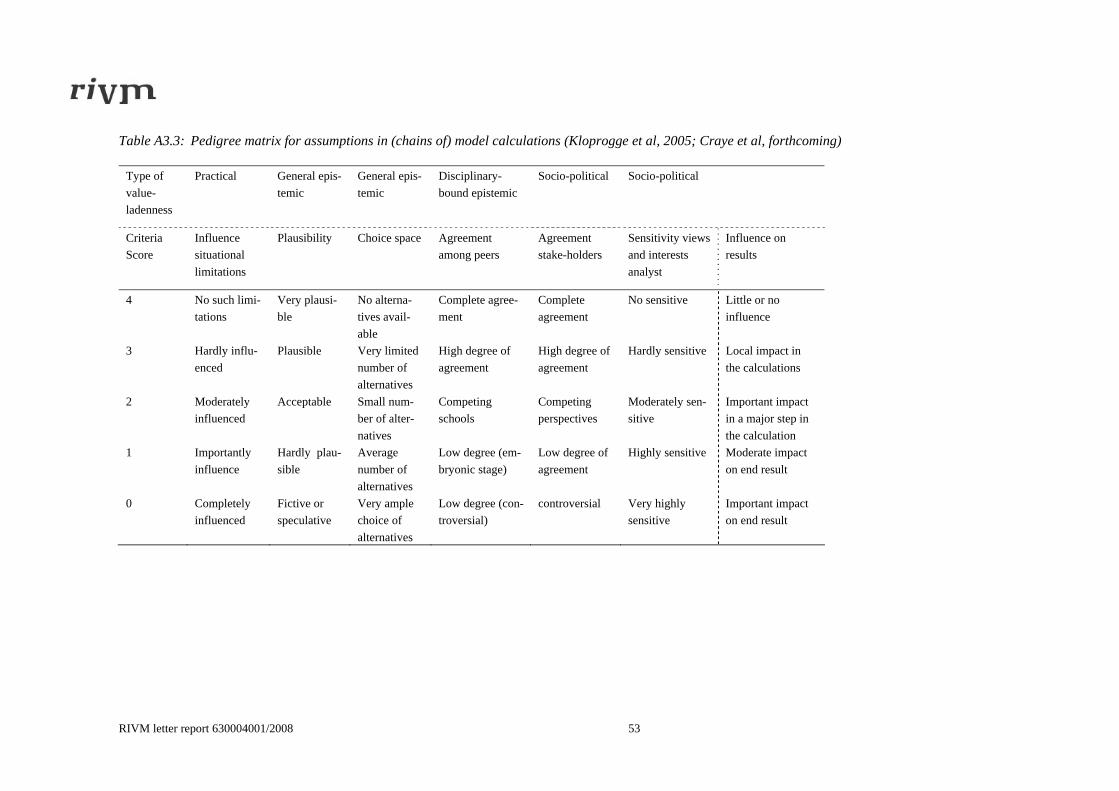
RIVM letter report 630004001/2008 53
Table A3.3: Pedigree matrix for assumptions in (chains of) model calculations (Kloprogge et al, 2005; Craye et al, forthcoming)
Type of value-ladenness
Practical General epis-temic
General epis-temic
Disciplinary-bound epistemic
Socio-political Socio-political
Criteria Score
Influence situational limitations
Plausibility Choice space Agreement among peers
Agreement stake-holders
Sensitivity views and interests analyst
Influence on results
4 No such limi-tations
Very plausi-ble
No alterna-tives avail-able
Complete agree-ment
Complete agreement
No sensitive Little or no influence
3 Hardly influ-enced
Plausible Very limited number of alternatives
High degree of agreement
High degree of agreement
Hardly sensitive Local impact in the calculations
2 Moderately influenced
Acceptable Small num-ber of alter-natives
Competing schools
Competing perspectives
Moderately sen-sitive
Important impact in a major step in the calculation
1 Importantly influence
Hardly plau-sible
Average number of alternatives
Low degree (em-bryonic stage)
Low degree of agreement
Highly sensitive Moderate impact on end result
0 Completely influenced
Fictive or speculative
Very ample choice of alternatives
Low degree (con-troversial)
controversial Very highly sensitive
Important impact on end result

RIVM letter report 630004001/2008
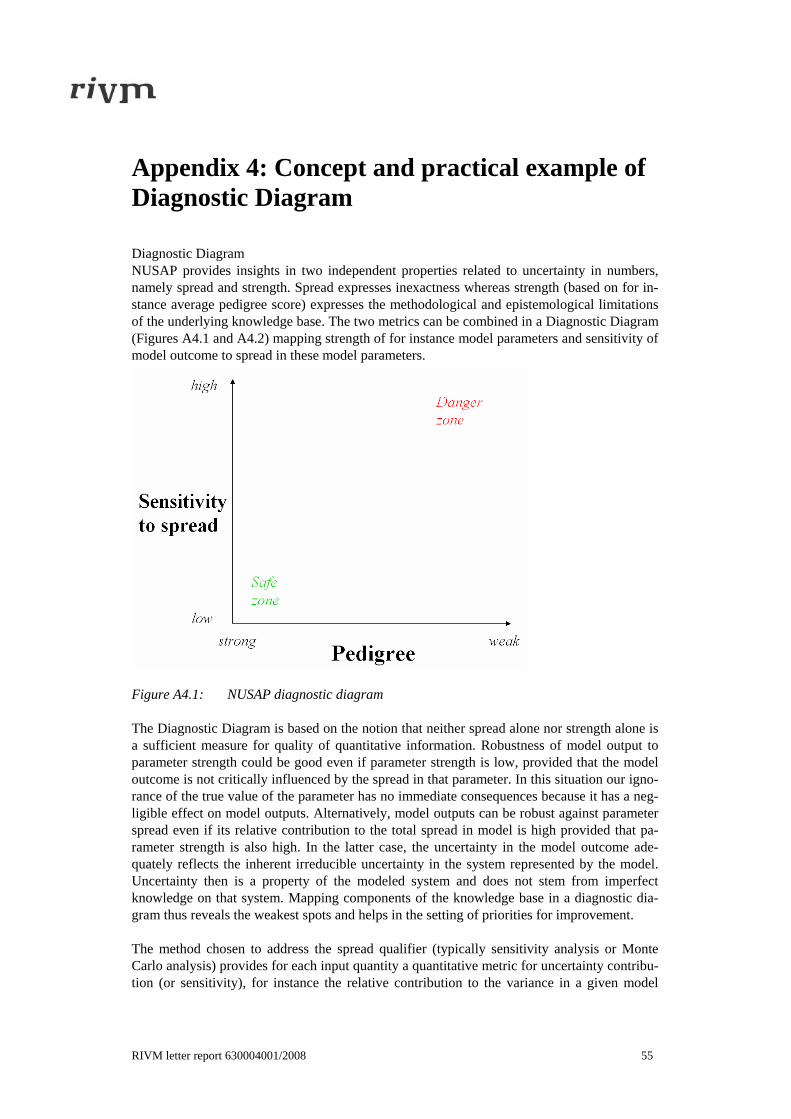
RIVM letter report 630004001/2008 55
Appendix 4: Concept and practical example of Diagnostic Diagram Diagnostic Diagram NUSAP provides insights in two independent properties related to uncertainty in numbers, namely spread and strength. Spread expresses inexactness whereas strength (based on for in-stance average pedigree score) expresses the methodological and epistemological limitations of the underlying knowledge base. The two metrics can be combined in a Diagnostic Diagram (Figures A4.1 and A4.2) mapping strength of for instance model parameters and sensitivity of model outcome to spread in these model parameters.
Figure A4.1: NUSAP diagnostic diagram The Diagnostic Diagram is based on the notion that neither spread alone nor strength alone is a sufficient measure for quality of quantitative information. Robustness of model output to parameter strength could be good even if parameter strength is low, provided that the model outcome is not critically influenced by the spread in that parameter. In this situation our igno-rance of the true value of the parameter has no immediate consequences because it has a neg-ligible effect on model outputs. Alternatively, model outputs can be robust against parameter spread even if its relative contribution to the total spread in model is high provided that pa-rameter strength is also high. In the latter case, the uncertainty in the model outcome ade-quately reflects the inherent irreducible uncertainty in the system represented by the model. Uncertainty then is a property of the modeled system and does not stem from imperfect knowledge on that system. Mapping components of the knowledge base in a diagnostic dia-gram thus reveals the weakest spots and helps in the setting of priorities for improvement. The method chosen to address the spread qualifier (typically sensitivity analysis or Monte Carlo analysis) provides for each input quantity a quantitative metric for uncertainty contribu-tion (or sensitivity), for instance the relative contribution to the variance in a given model
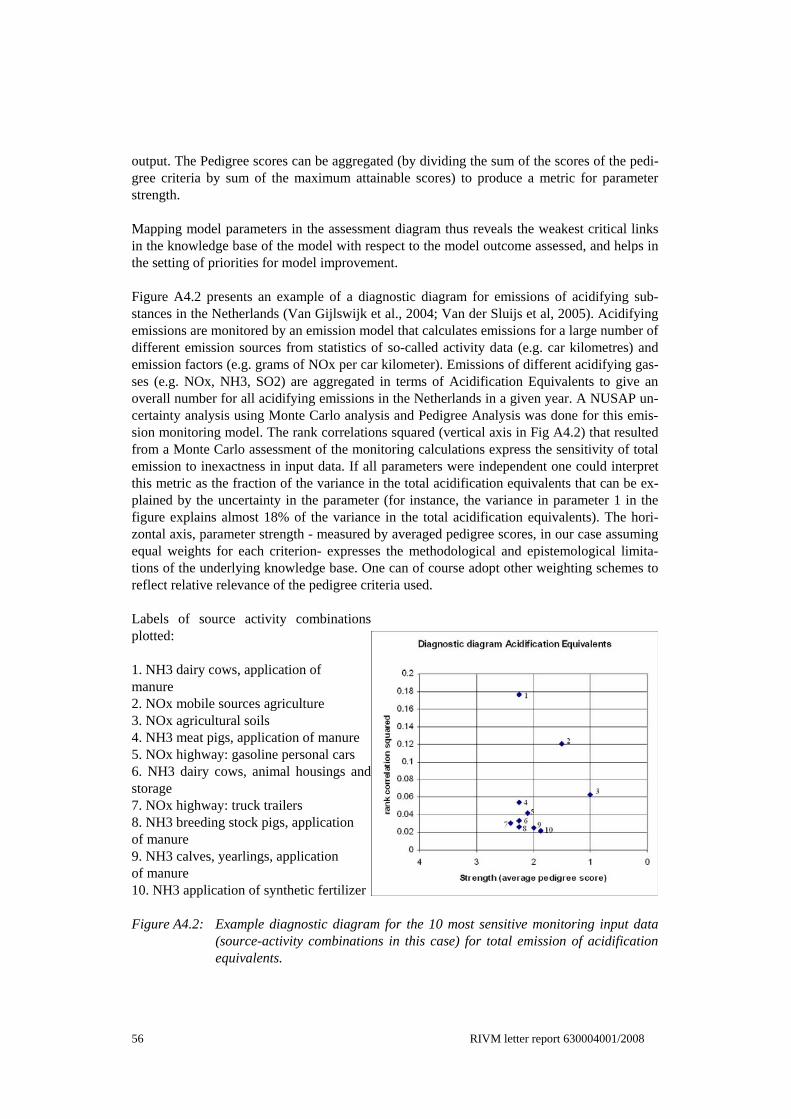
56 RIVM letter report 630004001/2008
output. The Pedigree scores can be aggregated (by dividing the sum of the scores of the pedi-gree criteria by sum of the maximum attainable scores) to produce a metric for parameter strength. Mapping model parameters in the assessment diagram thus reveals the weakest critical links in the knowledge base of the model with respect to the model outcome assessed, and helps in the setting of priorities for model improvement. Figure A4.2 presents an example of a diagnostic diagram for emissions of acidifying sub-stances in the Netherlands (Van Gijlswijk et al., 2004; Van der Sluijs et al, 2005). Acidifying emissions are monitored by an emission model that calculates emissions for a large number of different emission sources from statistics of so-called activity data (e.g. car kilometres) and emission factors (e.g. grams of NOx per car kilometer). Emissions of different acidifying gas-ses (e.g. NOx, NH3, SO2) are aggregated in terms of Acidification Equivalents to give an overall number for all acidifying emissions in the Netherlands in a given year. A NUSAP un-certainty analysis using Monte Carlo analysis and Pedigree Analysis was done for this emis-sion monitoring model. The rank correlations squared (vertical axis in Fig A4.2) that resulted from a Monte Carlo assessment of the monitoring calculations express the sensitivity of total emission to inexactness in input data. If all parameters were independent one could interpret this metric as the fraction of the variance in the total acidification equivalents that can be ex-plained by the uncertainty in the parameter (for instance, the variance in parameter 1 in the figure explains almost 18% of the variance in the total acidification equivalents). The hori-zontal axis, parameter strength - measured by averaged pedigree scores, in our case assuming equal weights for each criterion- expresses the methodological and epistemological limita-tions of the underlying knowledge base. One can of course adopt other weighting schemes to reflect relative relevance of the pedigree criteria used. Labels of source activity combinations plotted: 1. NH3 dairy cows, application of manure 2. NOx mobile sources agriculture 3. NOx agricultural soils 4. NH3 meat pigs, application of manure 5. NOx highway: gasoline personal cars 6. NH3 dairy cows, animal housings and storage 7. NOx highway: truck trailers 8. NH3 breeding stock pigs, application of manure 9. NH3 calves, yearlings, application of manure 10. NH3 application of synthetic fertilizer Figure A4.2: Example diagnostic diagram for the 10 most sensitive monitoring input data
(source-activity combinations in this case) for total emission of acidification equivalents.