Embed Size (px)
Citation preview

Seediscussions,stats,andauthorprofilesforthispublicationat:https://www.researchgate.net/publication/258177280
ExperimentsandzeroDmodelingstudiesusingspecificWiebecoefficientsforproducergasasfuelinspark-ignitedengines
ArticleinARCHIVEProceedingsoftheInstitutionofMechanicalEngineersPartCJournalofMechanicalEngineeringScience1989-1996(vols203-210)·March2013
ImpactFactor:0.56·DOI:10.1177/0954406212463846
CITATIONS
6
READS
31
2authors:
AnandShivapuji
IndianInstituteofScience
13PUBLICATIONS20CITATIONS
SEEPROFILE
DasappaS.
IndianInstituteofScience
114PUBLICATIONS920CITATIONS
SEEPROFILE
Allin-textreferencesunderlinedinbluearelinkedtopublicationsonResearchGate,
lettingyouaccessandreadthemimmediately.
Availablefrom:AnandShivapuji
Retrievedon:27June2016

Original Article
Experiments and zero D modeling studiesusing specific Wiebe coefficients forproducer gas as fuel in spark-ignitedengines
Anand M Shivapuji and S Dasappa
Abstract
The paper addresses experiments and modeling studies on the use of producer gas, a bio-derived low energy content
fuel in a spark-ignited engine. Producer gas, generated in situ, has thermo-physical properties different from those of
fossil fuel(s). Experiments on naturally aspirated and turbo-charged engine operation and subsequent analysis of the
cylinder pressure traces reveal significant differences in the heat release pattern within the cylinder compared with a
typical fossil fuel. The heat release patterns for gasoline and producer gas compare well in the initial 50% but beyond this,
producer gas combustion tends to be sluggish leading to an overall increase in the combustion duration. This is rather
unexpected considering that producer gas with nearly 20% hydrogen has higher flame speeds than gasoline. The influence
of hydrogen on the initial flame kernel development period and the combustion duration and hence on the overall heat
release pattern is addressed. The significant deviations in the heat release profiles between conventional fuels and
producer gas necessitates the estimation of producer gas-specific Wiebe coefficients. The experimental heat release
profiles are used for estimating the Wiebe coefficients. Experimental evidence of lower fuel conversion efficiency based
on the chemical and thermal analysis of the engine exhaust gas is used to arrive at the Wiebe coefficients. The efficiency
factor a is found to be 2.4 while the shape factor m is estimated at 0.7 for 2% to 90% burn duration. The standard Wiebe
coefficients for conventional fuels and fuel-specific coefficients for producer gas are used in a zero D model to predict the
performance of a 6-cylinder gas engine under naturally aspirated and turbo-charged conditions. While simulation results
with standard Wiebe coefficients result in excessive deviations from the experimental results, excellent match is
observed when producer gas-specific coefficients are used. Predictions using the same coefficients on a 3-cylinder gas
engine having different geometry and compression ratio(s) indicate close match with the experimental traces highlighting
the versatility of the coefficients.
Keywords
Alternative fuel, producer gas, zero D modeling, Wiebe coefficients, combustion phasing
Date received: 3 August 2012; accepted: 17 September 2012
Introduction
Mathematical modeling of the internal combustion(IC) engine process is the most effective tool fordesign, performance evaluation and analysis.Modeling and simulation studies become criticalwhile adopting new fuels with existing engine designsdue to different thermo-physical properties1 of thenew fuel. Modeling and simulation studies also pro-vide information about various interacting phenom-ena difficult to obtain from experimentalinvestigations.2,3
Mathematical models range from simple zero-dimensional (0D) or thermodynamic models toexhaustive multi-dimensional (MD)3 models. While0D models require a predefined mass burn rate
defined empirically,3 MD models evolve heat releaseprofiles based on a phenomenological approach andempirical correlations apart from fundamental prin-ciples.4,5 Zero D models offer the distinct advantageof superior and unmatched accuracy for performanceevaluation and analysis6 since predictions are basedon empirical results obtained from basic experimental
Center for Sustainable Technologies, Indian Institute of Science,
Bangalore, India
Corresponding author:
Anand M Shivapuji, Center for Sustainable Technologies, Indian Institute
of Science, Bangalore 560012, India.
Email: [email protected]
Proc IMechE Part C:
J Mechanical Engineering Science
227(3) 504–519
! IMechE 2012
Reprints and permissions:
sagepub.co.uk/journalsPermissions.nav
DOI: 10.1177/0954406212463846
pic.sagepub.com
at INDIAN INST SCI on March 22, 2016pic.sagepub.comDownloaded from

results. Zero D models permit parametric investiga-tion with a fair degree of accuracy over a range ofoperating conditions where the empirical coefficientsare determined.7
On the utility of the 0Dmodels, the literature revealssuccessful use of 0D models for such wide applicationsas residual gas mass fraction measurement,8 knockprediction9 and full cycle simulations.10 The recent lit-erature also suggests significant emphasis at bothindustrial and academic levels on improving the pre-diction capabilities of zero Dmodels.11 The 0Dmodelsare emerging as viable alternatives and a critical toolfor investigating and validating various strategies foroptimizing the in-cylinder combustion process12,13
with significant efforts being directed at full computa-tional fluid dynamics derived 0D models consideringthe rapid simulation capabilities of such models.14
Bio-derived fuels are being explored towards meet-ing the energy needs for both heat and power, par-ticularly as a mitigation option in the present scenarioto address climate change issues. Research towardsestablishing the necessary tools for performance pre-diction and evaluation is important in the renewableenergy sector. The focus of the current work is toanalyse the combustion phasing of a spark ignited(SI) gas engine fuelled with producer gas (PG), gen-erated from the thermo-chemical conversion of bio-mass. Producer gas has a typical composition (byvolume) of 18�20% each of H2 and CO, 2% CH4,12% CO2 and balance N2.
15 Thermo-physical proper-ties like the laminar flame speed SL (velocity of theunburned gases through and normal to the flame sur-face),16,17 the adiabatic flame temperature (AFT)(peak attained by the products of combustion withoutheat loss from the system),17,18 the lower calorificvalue (LCV) (heat of combustion with un-condensedmoisture)18,19 and product to reactant mole ratio forPG are different from conventional hydrocarbon fuelsrequiring a detailed analysis of the combustion phas-ing. Table 1 compares the properties of PG with someconventional fuels. It can be observed that though theLCV of the fuel is about a tenth of that of naturalgas (NG), the LCV of the stoichiometric PG–airmixture is lower only by about 25% as compared toNG–air stoichiometric mixture. This is attributed to
the vastly different air-fuel (A/F) ratio for PGcompared to NG. Another important propertyhaving significant difference is the stoichiometriclaminar flame speed. PG flame speed at 0.50m/s isover 40% faster than NG stoichiometric flame speedat 0.35m/s.
Analysis of combustion of mixture containing H2 isimportant considering that H2 is seen to influence theflame propagation beyond the chemical kineticsrealm. While H2 enhances the flame speed due to aglobal increase in the reactivity,20–22 it is also seen topromote structural instability and hence cellular-ity.23,24 Higher cellularity promotes flame breakupinto smaller cells causing an increase in the effectiveflame front area25,26 and hence turbulent flame pro-pagation speed. The presence of CO in nearly thesame proportion as H2 by volume makes the analysisthat much more important since CO is seen todecrease thermal and diffusive instabilities as againstH2 which promotes the same. Since the thermo-phy-sical properties of PG are different from conventionalfuels and with H2 and CO have counteracting influ-ences on the flame stability and propagation, the heatrelease pattern and hence the combustion phasing inan engine is expected to be different. This makes theanalysis of combustion phasing and hence the fixingof specific Wiebe coefficients critical.
Analysis of combustion phasing is possible byusing the engine heat release profile.3 The analysisprovides information regarding the extent of similar-ity or difference between PG and conventional fuel(s)for which the engine is designed. Combustion phasingis represented in terms of an exponential curve fit bydetermining the shape and efficiency; Wiebe param-eters for a heat release profile.3,27 The Wiebe para-meters are used in a Wiebe function, which describesthe mass burn and hence heat release fraction in theengine. While Wiebe parameters for conventionalfuels are established and optimized, estimation ofWiebe parameters for PG is justified consideringthat the heat release pattern for PG is expected todiffer from that for conventional fuels. Using thevalues defined for other fuels could lead to significantdeviation in the simulation.3,7
Literature survey indicates very limited fundamen-tal work on producer gas engines in general. A signifi-cant portion of the available literature focusesexclusively on the performance analysis of producergas based engines28–31 and very limited work isreported on the in-cylinder investigations and model-ing.2,32,33 No work pertaining to the impact of fuelproperties on the heat release pattern has beenreported.
The current work also assumes significancebecause, though exhaustive literature is available onthe use of the Wiebe function for internal combustionengine simulation,2,6,33–37 hence highlighting its sig-nificance, critical review of the results indicate thateven with the usage of different fuels with vastly
Table 1. Thermo-physical properties of various fuels.
Fuel
Fuel LCV A/F Mixture LCV SL AFT
MJ/kg MJ/kg MJ/Nm3 m/s K
�¼ 1
PG 05.00 1.35 2.12 2.53 0.50 1800
Gasoline 44.00 14.6 2.83 3.82 0.42 2100
NG (CH4) 50.20 17.2 2.76 3.40 0.35 2210
Butane (C4H10) 45.50 15.39 2.77 3.67 0.44 2250
LCV: lower calorific value; AFT: adiabatic flame temparature; A/F: air-
to-fuel ratio; PG: producer gas; NG: Natural gas.
Shivapuji and Dasappa 505
at INDIAN INST SCI on March 22, 2016pic.sagepub.comDownloaded from

different thermo-physical properties, Wiebe param-eters for conventional fuels are adopted for simula-tion.38,39 Instances of the use of conventional Wiebeparameters for fuels with MBT ignition timing vary-ing between 30� before top dead center (BTDC) and4� BTDC (highlighting the drastic variations in thethermo-physical properties) are also found.40
The present research highlights the criticality offuel-specific Wiebe coefficients by establishing thecombustion phasing and Wiebe parameters for PGas a fuel. The established Wiebe parameters are sub-sequently used in a 0D simulation to predict perform-ance parameters like the position and magnitude ofthe peak pressure and to evolve the pressure-crankangle profile. Simulation results from the model arecompared with experimental results for different oper-ating conditions. To generalize the modeling effort,the comparison is extended to different engine geom-etry and compression ratios (CR).
Methodology
Experimental investigations involved acquiring in-cylinder pressure traces along with other engine par-ameters on a PG-fuelled 6-cylinder engine ofCummins India Limited (CIL) make (6B5.9) in bothnaturally aspirated (NA) and turbo-charged after-cooled (TA) mode for a fixed CR of 10.5.Experiments under both NA and TA modes of oper-ation were carried out at maximum brake torque(MBT) conditions at stoichiometry. Pressure tracesfrom a 3-cylinder engine of Kirloskar Oil Engines(KOE) make (RB33) at different CR’s fuelled withPG at stoichiometry and MBT conditions availablefrom a previous work41 are also used in the analysis.Comparisons are made with fossil fuels like gasolineand NG. Using the first law, the pressure trace is con-verted to net heat release trace. The Wiebe parametersare obtained by means of least square curve fit andsubsequently used in 0D simulation.
Experimental setup
Experimental data from two engines with differentspecifications are used for the analysis. The enginedesignated E1 (6B5.9) is a 50 kWe (rated capacitywith NG as the fuel) 6-cylinder inline engine whilethe engine designated E2 (RB33) is a 28 kWe (ratedcapacity with diesel as the fuel) 3-cylinder dieselengine converted to SI configuration to operate onPG. The engine specifications are as presented inTable 2. The conversion of the diesel engine into aSI engine was done by insertion of spark plugs inplace of fuel injectors and adoption of a 3-cylinderdistributor type battery-based ignition system.41
Engine E1 is operated in both NA and TA modeswhile E2 operates only in NA mode.
The engine E1 designed to operate on NG wasmodified to operate on producer gas using a specially
designed carburettor31 operating in conjunction witha zero pressure regulator to accommodate the highmixture flow rate. The experimental pressure tracesfrom engine E1 are used for establishing the Wiebecoefficients and the simulation results using thesecoefficients are subsequently used to compare withthe experimental results of both engines E1 and E2.
The in-cylinder pressure is measured using an AVLmake spark plug adapted uncooled piezo-electric (gal-lium orthophosphate) pressure sensor (GH13Z) at anacquisition frequency of 9 kHz. Differential pressuredata to absolute pressure conversion is by using themanifold pressure sensor with a reference pressuresupplement. The absolute pressure measurementacross the compressor and turbine of the turbo-char-ger is done by using a line pressure sensor with anabsolute pressure supplement. Measured data fromthe connected instruments is acquired by usingan 8-channel data acquisition module (AVLIndiModul) and real time processing and display bymeans of a graphical user interface (AVL IndiCom).Detailed specifications of the instrumentation are pre-sented in Table 3. Air and gas flow rates are measuredusing venturimeters and temperature is measuredusing K-type thermocouples. Gas composition is mea-sured using SICK MAIHAK make online gas ana-lyzer while the exhaust gas analysis was done usinga QUINTOX make flue gas analyzer.
Model formulation
First law analysis
A 0D model based on the first law3,42 is developed topredict the evolution of cylinder pressure during thecycle. The gas exchange process is modelled along thefilling and emptying technique (FET)43 and mass flowthrough the various volumes is modelled using the 1Disentropic flow equation for compressible flow.
Table 2. Specifications of the engines used for the
experiments.
Parameter Engine E1 Engine E2
Make and model Cummins, 6B5.9 Kirloskar, RB33
Engine type In-line, 6 cylinder,
4-stroke
In-line, 3 cylinder,
4-stroke
Aspiration Natural/
Turbocharged
Natural
Rated output 50 kWe on NG 28 kWe on diesel
Speed 1500 r/min
Cooling type Water cooled
with radiator
Bore� Stroke 102� 120 mm 110� 116 mm
Compression ratio 10.5 : 1 17 : 1 (base)
Piston type Cylindrical bowl Hemispherical bowl
Firing order 1-5-3-6-2-4 1-2-3
506 Proc IMechE Part C: J Mechanical Engineering Science 227(3)
at INDIAN INST SCI on March 22, 2016pic.sagepub.comDownloaded from

The literature reports the filling and emptying processto be between isothermal and adiabatic44,45 and thepressure fluctuations in the elements are modelledusing the first law for an open system as in equation(1) where P, V and Q represent the pressure, volumeand heat transferred with � representing the crankangle. The symbols �, m and c represent the polytro-pic index, mass and sound velocity respectively. Thesubscripts ‘i’ and ‘e’ represent the inlet and exit con-ditions respectively.
dP
d�¼ð� � 1Þ
V
dQ
d�� �
P
V
dV
d�
þð� � 1Þ
V
c2ið�i � 1Þ
dmi
d��
c2eð�e � 1Þ
dme
d�
� �ð1Þ
Coefficient of discharge for flow through valves
The discharge coefficient, Cd for the intake andexhaust valves is evaluated as a function of the
valve lift lv to valve diameter dv ratio as discussed inHeywood3 and Ferguson and Kirkpatrick42 anddescribed in equation (2). The discharge coefficientresults as indicated in Figure 1 are consistent withvalues reported by Annand and Roe46 for valve geom-etry similar to that in the current investigation.
Cd ¼ 107:78lvdv
� �4�77:204
lvdv
� �3þ14:1
lvdv
� �2
� 1:01lvdv
� �þ 0:6687 ð2Þ
Cylinder pressure is evaluated from equation (1)during the gas exchange processes by retaining themass flow terms, while for the compression-expansionprocess with intake and exhaust valves closed, themass flow terms from the equation are eliminated byneglecting leakage.
Wiebe function and coefficients
The energy released in the engine cylinder due to com-bustion is modelled using the Wiebe function devel-oped by I. I. Viebe47 based on the law of normaldistribution of a continuous random variable.48 TheWiebe function, used to predict the mass burn frac-tion in an engine is of the form as in equation (3).
Qchemð�Þ
Qchem�total¼ 1� exp �1
� � �soc��
� �mþ1" #
ð3Þ
The constant m is the shape factor, while a is theefficiency factor indicative of the fuel conversion effi-ciency �c as in equation (4). The subscripts ‘soc’ and‘doc’ indicate the start and duration of combustion,respectively.
Figure 1. Variation of the discharge coefficient as a function of valve lift-to-diameter ratio.
Table 3. Specifications of the engine instrumentation.
Description Model Specifications
Cylinder pressure GH13Z-24 Measuring range 0–250 bar
Load cycles 108
Line pressure QC34C Measuring range 0–250 bar
Load cycles 108
Angle encoder 365C Speed range 20,000 r/min
Resolution 0.1� CA
Indicating system IndiModul Channels 8
Resolution 14 bit
Sampling rate 800 kHz/ch
Internal memory 64 MB
Shivapuji and Dasappa 507
at INDIAN INST SCI on March 22, 2016pic.sagepub.comDownloaded from

�c ¼Qchemð�Þ
Qchem�total¼ 1� e�a ð4Þ
An efficiency factor of 5 and a shape factor of 2have been arrived at for typical hydrocarbonfuels.3,47,49 On the versatility of the Wiebe functionin capturing heat release profiles, Figure 2 shows theimpact of combustion duration and shape factor onthe heat release profile as evaluated from equation (3).
The heat release profiles, designated as fraction ofheat release (FoHR) are plotted for three differentshape factors of 1, 2 and 3 for two combustion dur-ations of 40� and 80�, respectively. The choice ofshape factor(s) has been made to assess the Wiebefunction response on either side of the conventionalchoice of 2. The peak (fractional) heat release rate(PHRF) is plotted at 10� intervals from 40� to 80�
duration for the three shape factors. As evidentfrom Figure 2, the shape factor governs the peakheat release rate and its position. An increase in theshape factor displaces the position of peak heatrelease rate towards the end of combustion while theshape of the profile changes from being predomin-antly convex to concave as observed from theorigin. This behavior is independent of the combus-tion duration and is hence used as a critical parameterto match the desired profile.
The literature50 indicates choice of efficiency fac-tors as high as 6.9 and 10 in an effort to match theWiebe heat release profile with the experimentallyobserved profiles.51 Choice of efficiency factor ashigh as 10 is rather surprising considering that thefuel conversion efficiency attains a value of 99.32%at a¼ 5 and changes to 99.99% for a¼ 10. The fuelconversion efficiency in a typical SI engine seldomcrosses 98% even under lean conditions.3 Tuning ofa to match the heat release profile thereby seemsunrealistic and is thermodynamically untenable.
In the present work, the efficiency factor a is esti-mated on the basis of exhaust emissions measurementreflecting the combustion efficiency, giving a fairdegree of legitimacy for the choice, while the shapefactor is tuned to reproduce the experimental heatrelease profile. The choice of m and the combustionduration are governed by the requirement of the heatrelease profile to reproduce the primary combustiondescriptors available from the experimental resultswithin acceptable limits of deviation. The importanceof combustion phasing and its impact on the max-imum power output as well as cycle to cycle variationshave been brought out by Pipitone52 for gasoline andextended to PG by the current authors.
Heat transfer at the engine wall
The engine wall heat transfer is calculated using equa-tion (5), which represents the heat flux on the gas side.The radiation component of the heat transfer is neg-lected since it constitutes less than 5% for a typical SIengine.3,42,53
_q ¼ hc,g �Tg � Tw,g
� �ð5Þ
The heat transfer process is considered as quasi-steady3,54 and is justified, as the variation in actualheat transfer is a very small fraction of the totalheat flux when the heat transfer coefficient fluctuates.Various models have been proposed by Annand,54
Woschni,55 Hohenberg56 and other researchers forquantifying the gas side convective heat transfer coef-ficient hc,g (for mean gas temperature �Tg and walltemperature Tw,g). All the correlations have a generalform with the Nusselt number (Nu) being expressed asa function of Reynolds number (Re) and Prandtlnumber (Pr). The correlation proposed by Annandas in equation (6) is used in the present analysis.
Figure 2. Effect of combustion duration on the heat release profile and the peak heat release rate.
FoHR: fraction of heat release; PHRF: peak (fractional) heat release rate.
508 Proc IMechE Part C: J Mechanical Engineering Science 227(3)
at INDIAN INST SCI on March 22, 2016pic.sagepub.comDownloaded from

In equation (6) the values of d and b depend on flowproperties within the engine cylinder while k and B arethe thermal conductivity of the gases and lineardimension. �Sp, � and � indicate the mean pistonspeed, dynamic viscosity and density, respectively.
hc,gð�Þ ¼ dk
B
� �SpB
�
� �b
ð6Þ
Experimental results
This section presents the results from the experimentsconducted on engine E1. The pressure trace(s) for E1under NA and TA modes and E2 under NA mode areensemble averages of 250 and 30 consecutive cycles,respectively. The spark sweep test was used to deter-mine the MBT timing and further examined using thecombustion descriptor(s) at MBT conditions for E1under NA operation. For TA operation, the positionof peak pressure was adopted for establishing theMBT timing. Figure 3 presents the results from thespark sweep test under NA conditions for the engineE1. The MBT timing is found to be 24� BTDC.
From the pressure trace the position of peak pres-sure is found to be in the range of 14�–16� after topdead center (ATDC) at 24� BTDC ignition confirmingthe outcome of the spark sweep test. For the TA modeof operation, the spark was timed to allow the pos-ition of peak pressure to be in the range of 14�–16�
ATDC for positioning the engine at MBT timing. Theposition of peak pressure was observed to be in thedesired range for 22� BTDC ignition setting indicatingthe same as MBT timing. A full range load test wascarried out for both NA and TA mode under respect-ive MBT ignition timings. Figure 4 presents the pres-sure crank angle trace for NA and TA modes ofoperation where, for brevity only two loads represent-ing 100% and around 70% at MBT conditions for
both NA and TA operations are reported. Theengine delivered a peak load of 55.85 kWe under tur-bocharged conditions amounting to an increase of104% over NA peak load of 27.3 kWe.
Figure 5 compares the peak load normalized pres-sure trace at MBT for PG operation under NA andTA modes of operation with the pressure trace usingNG as the fuel on the same engine and a general stoi-chiometric gasoline profile. The pressure crank angletrace for PG when compared with NG and gasolinetraces indicates difference in pressure profile develop-ment especially in the 15� BTDC to 5� ATDC range.This region is magnified and presented separately asan inset in Figure 5. Approximate slope lines indica-tive of the kinematic (compression only) and thermo-kinematic (compression and heat release)contributions to the pressure rise are indicated forPG and NG/Gasoline operation separately. Changein the slope during the transition from kinematic tothermokinematic pressure rise indicates a very smallvalue (equivalent of 12�) for PG as compared to (43�)NG/Gasoline operation. In order to understandthe differences in pressure profile development,further investigation into the variation of the rate ofpressure rise with crank angle was carried out assubtle differences, if any, would be evident in the pres-sure rise rate (PRR) against crank angle profile. Therate of pressure rise is another combustion descriptorused for the analysis of combustion phasing.52 ThePRR profile for the considered cases is plotted inFigure 6.
The PRR profile(s) clearly identifies the subtle dif-ferences between PG and NG/gasoline operationwhich is not evident in the pressure crank angletrace. For a typical engine, under motoring conditionsthe peak pressure is positioned in the immediate vicin-ity of the TDC while the PRR peaks around 18�
BTDC. The PRR starts to decrease beyond 18�
BTDC due to the decelerating piston reaching zero
Figure 3. Pressure-crank angle trace for NA operation of E1 at various ignition angles.
BTC: before top center; NA: naturally aspirated.
Shivapuji and Dasappa 509
at INDIAN INST SCI on March 22, 2016pic.sagepub.comDownloaded from

velocity at the TDC; where the piston reverses thedirection of movement. For a firing cycle using fuelslike NG and gasoline, under MBT operation the in-cylinder heat release rate would attain a sufficientthermodynamic condition around 18� BTDC so asto offset the kinematics-driven reduction in the PRRsuch that both the pressure and the PRR continue toincrease. The PRR profile in the closed part of thecycle in-cylinder process would be unimodal as evi-dent from Figure 6. The difference between PG andNG/gasoline pressure profile arises from the fact that
the PRR profile for PG operation suggests bimodalbehavior as against the unimodal response for NGand gasoline.
The bimodal pattern of the PRR profile for PG-fuelled operation with local maxima before the TDCsuggests a possible delay in the initial flame kerneldevelopment. This deferment of the heat release inthe initial stages causes the PRR to drop from thelocal maximum with the crank angle. However, asthe piston approaches TDC, the PRR increases dueto the corresponding increase in the heat release. The
Figure 5. Variation of normalized cylinder pressure for gasoline, NG and PG (on engine E1) under MBT conditions.
NG: natural gas; PG: producer gas; MBT: maximum brake torque; NA: naturally aspirated; TA: turbocharged after-cooled; BTC: before
top center.
Figure 4. Variation of cylinder pressure with crank angle for E1 testing in NA and TA modes.
NA: naturally aspirated; TA: turbocharged after-cooled.
510 Proc IMechE Part C: J Mechanical Engineering Science 227(3)
at INDIAN INST SCI on March 22, 2016pic.sagepub.comDownloaded from
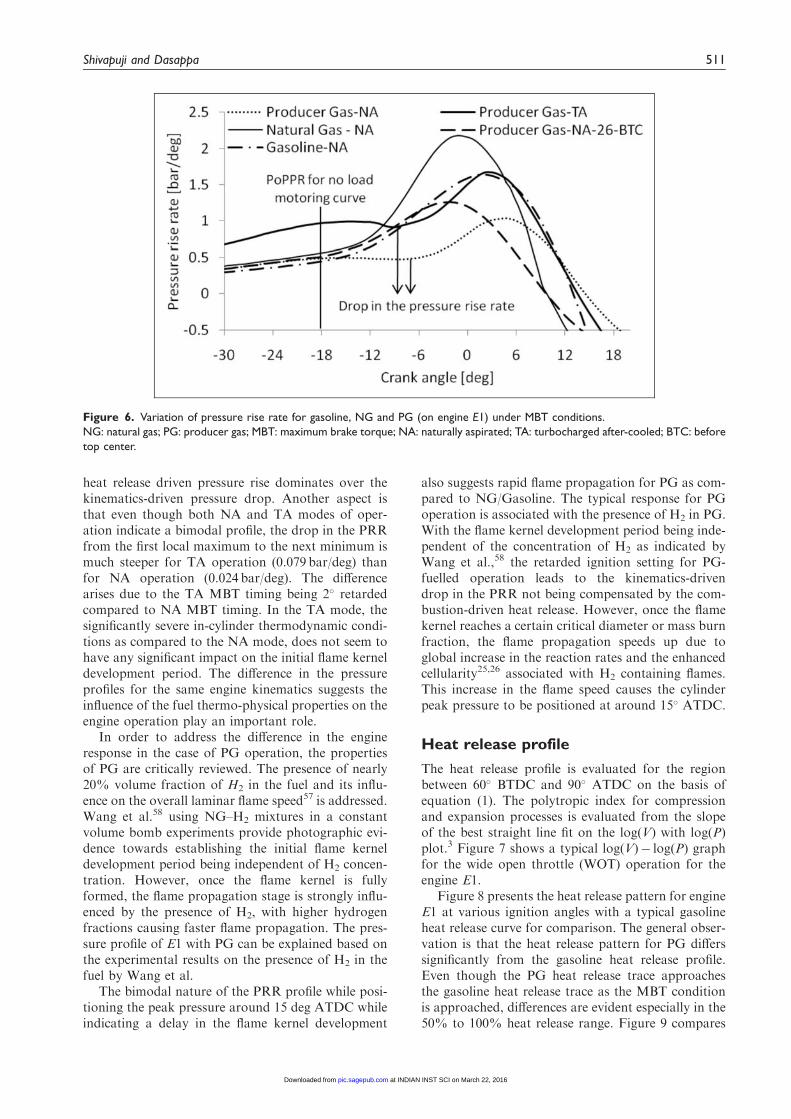
heat release driven pressure rise dominates over thekinematics-driven pressure drop. Another aspect isthat even though both NA and TA modes of oper-ation indicate a bimodal profile, the drop in the PRRfrom the first local maximum to the next minimum ismuch steeper for TA operation (0.079 bar/deg) thanfor NA operation (0.024 bar/deg). The differencearises due to the TA MBT timing being 2� retardedcompared to NA MBT timing. In the TA mode, thesignificantly severe in-cylinder thermodynamic condi-tions as compared to the NA mode, does not seem tohave any significant impact on the initial flame kerneldevelopment period. The difference in the pressureprofiles for the same engine kinematics suggests theinfluence of the fuel thermo-physical properties on theengine operation play an important role.
In order to address the difference in the engineresponse in the case of PG operation, the propertiesof PG are critically reviewed. The presence of nearly20% volume fraction of H2 in the fuel and its influ-ence on the overall laminar flame speed57 is addressed.Wang et al.58 using NG–H2 mixtures in a constantvolume bomb experiments provide photographic evi-dence towards establishing the initial flame kerneldevelopment period being independent of H2 concen-tration. However, once the flame kernel is fullyformed, the flame propagation stage is strongly influ-enced by the presence of H2, with higher hydrogenfractions causing faster flame propagation. The pres-sure profile of E1 with PG can be explained based onthe experimental results on the presence of H2 in thefuel by Wang et al.
The bimodal nature of the PRR profile while posi-tioning the peak pressure around 15 deg ATDC whileindicating a delay in the flame kernel development
also suggests rapid flame propagation for PG as com-pared to NG/Gasoline. The typical response for PGoperation is associated with the presence of H2 in PG.With the flame kernel development period being inde-pendent of the concentration of H2 as indicated byWang et al.,58 the retarded ignition setting for PG-fuelled operation leads to the kinematics-drivendrop in the PRR not being compensated by the com-bustion-driven heat release. However, once the flamekernel reaches a certain critical diameter or mass burnfraction, the flame propagation speeds up due toglobal increase in the reaction rates and the enhancedcellularity25,26 associated with H2 containing flames.This increase in the flame speed causes the cylinderpeak pressure to be positioned at around 15� ATDC.
Heat release profile
The heat release profile is evaluated for the regionbetween 60� BTDC and 90� ATDC on the basis ofequation (1). The polytropic index for compressionand expansion processes is evaluated from the slopeof the best straight line fit on the log(V) with log(P)plot.3 Figure 7 shows a typical log(V)� log(P) graphfor the wide open throttle (WOT) operation for theengine E1.
Figure 8 presents the heat release pattern for engineE1 at various ignition angles with a typical gasolineheat release curve for comparison. The general obser-vation is that the heat release pattern for PG differssignificantly from the gasoline heat release profile.Even though the PG heat release trace approachesthe gasoline heat release trace as the MBT conditionis approached, differences are evident especially in the50% to 100% heat release range. Figure 9 compares
Figure 6. Variation of pressure rise rate for gasoline, NG and PG (on engine E1) under MBT conditions.
NG: natural gas; PG: producer gas; MBT: maximum brake torque; NA: naturally aspirated; TA: turbocharged after-cooled; BTC: before
top center.
Shivapuji and Dasappa 511
at INDIAN INST SCI on March 22, 2016pic.sagepub.comDownloaded from

the PG heat release trace for 100%, 70% and 50% ofpeak load for NA and TA modes with the gasoline-fuelled engine heat release trace. The peak load com-bustion durations in terms of degrees of crank anglefor gasoline and NA/TA mode of operation areincluded as an inset for the first and second half ofthe combustion. The difference in combustion dur-ation in the first and second half is evident from thedata present in the inset. PG combustion tends to besluggish in the second half, leading to an overallincrease in the combustion duration. Among the PGprofiles, the heat release profile for the advanced igni-tion settings differs significantly compared to MBT
and retarded settings. At advanced ignition settings,the heat release profile deviates from the typical Sprofile, characteristic of SI operation. The ratherslow heat release and corresponding extended combus-tion duration are manifested in the form of drasticreduction in the supported load. This is evident fromthe data presented in the inset in Figure 3, which indi-cates a load drop of 16% and 44% for 2� and 4�
advanced ignition from MBT compared to 2% and13% drop for corresponding retarded ignition settings.
Further comparison between gasoline and PG sug-gest that, the first half combustion duration being thesame for gasoline and PG operation (both NA and
Figure 7. log(V) vs log(P) plot for E1 at MBT ignition and WOT condition.
MBT: maximum brake torque; WOT: wide open throttle.
Figure 8. Heat release profiles for E1 at various ignition angles compared with gasoline profile.
BTC: before top center.
512 Proc IMechE Part C: J Mechanical Engineering Science 227(3)
at INDIAN INST SCI on March 22, 2016pic.sagepub.comDownloaded from

TA modes) confirms the earlier discussion on thebimodal nature of the PRR trend where it was men-tioned that H2 has insignificant influence on the initialflame kernel development period. The 50�90% regionresponse is argued to be influenced by the thermo-physical properties of PG. Before reasoning thecauses for such a behavior, it is critical to highlightthe fact that under MBT settings, at about 15�
ATDC, the flame would approach the farthest wallof the cylinder and the cylinder pressure wouldpeak.3 However, at this stage, the entire mixturewould not have been consumed and the mass burnfraction would still be around 70%.3 Essentially, thelast 30% of the mixture would be concentrated nearthe cylinder walls and within the unburned pockets ofthe turbulent flame bush.
The presence of nearly 20% H2 in the gas enhancesthe overall flame speed and subsequently the positionof peak pressure is recorded in the vicinity of 15�
ATDC for MBT conditions. However, when itcomes to the combustion of the remaining nearly30% of the mixture, two critical adverse impactsdue to the presence of H2 need attention. H2 enhancesthe thermal diffusivity of PG (0.61 cm/s for H2 against0.05 cm/s and 0.16 cm/s for gasoline and CH4 respect-ively)59 while reducing the flame quenching distance(0.2 cm for gasoline and CH4 against 0.06 cm for H2).High flame speed and high thermal diffusivity leads toincreased heat transfer to the cylinder wall due toenhanced convection from the burning gases whilelower quenching distance reduces the thermal bound-ary layer thickness, again enhancing the heat transferto the cylinder wall. Enhanced heat loss to the coolantis manifested in the engine cooling load. Heywood3
reports the cooling load to be around 25% of theinput energy for SI engines while cooling loads in
the present PG operation have been in excess of30% for both NA and TA modes of operation asindicated in Figure 10. Increased cooling losses forPG operation have also been reported by Rao.41
The complete parametric investigation of the enginein NA mode of operation on the basis of which theheat balance sheet is drawn up is presented in a dif-ferent work60 by the present authors.
The influence of H2 on enhanced thermal diffusiv-ity and quenching distance causing increased heat lossto the coolant has been explicitly confirmed by Maet al.61 in a work on varying H2–CNG blends. Maet al. have shown that the cooling loss for 100%CNG operation to be less than 15% of the inputenergy and increased to around 20% for 50%CNG–H2 blend. Similar observations have beenmade by Shudo et al.62 Thus, the enhancement ofthe combustion duration in the second half is attrib-uted to the cooling of the mixture near the wall lead-ing to flame de-speeding and increased combustionduration. The near wall mixture cooling assumes sig-nificance considering the fact that the thermal bound-ary near the wall has 30% to 40% of the total cylindermass,63 contributing significantly to the total combus-tion duration. Further, the absence of knock atadvanced ignition conditions as evident from bothpressure crank angle and heat release trace(s) canalso be attributed to enhanced cooling of the mixturenear the cylinder boundary. Considering the signifi-cant influence of the presence of H2 in PG, it isimportant that further additional investigations onthe combustion within the engine cylinder should beaddressed.
The qualitative explanation of the identified behav-ior of enhanced combustion duration in the secondhalf of the heat release cycle and absence of any
Figure 9. Comparison of normalized heat release profiles and combustion duration (inset) for PG on engine E1 with gasoline.
NA: naturally aspirated; TA: turbocharged after-cooled; PG: producer gas.
Shivapuji and Dasappa 513
at INDIAN INST SCI on March 22, 2016pic.sagepub.comDownloaded from

abnormal combustion requires further investigationsto quantify these parameters, not in the scope of thepresent article.
The foregoing discussions pertaining to both pres-sure and heat release pattern highlight the criticalityof the current work aimed at identifying fuel-specificWiebe parameters for producer gas.
Estimation of Wiebe curve fit coefficients
On the basis of the results presented in the previoussections, it is evident that significant differences existbetween PG and gasoline with regard to combustionphasing. Figure 11 presents the comparison of experi-mental and modeling results from the 0D model using
conventional Wiebe parameters of m¼ 2 and a¼ 5.3,42
It is obvious that significant deviations exist betweenthe experimental and modeling results. The data pre-sented in the inset quantifies the differences for thepeak cylinder pressure and its position. In the caseof TA operation, the peak cylinder pressure isunder-predicted by about 20% while the NA modeindicates retarded ignition. These results coupledwith the previous discussions on the heat release pat-tern sufficiently justify the need for fuel-specific Wiebecoefficients for PG.
For estimating the Wiebe efficiency factor a,detailed measurements on the engine exhaust compos-ition and temperature are used. Analysis of dryexhaust composition at higher loads has shown the
Figure 11. Comparing 0D simulation with experimental pressure trace using standard Wiebe coefficients.
NA: naturally aspirated; TA: turbocharged after-cooled.
Figure 10. Energy balance for NA and TA mode of peak load operation on engine E1.
NA: naturally aspirated; TA: turbocharged after-cooled.
514 Proc IMechE Part C: J Mechanical Engineering Science 227(3)
at INDIAN INST SCI on March 22, 2016pic.sagepub.comDownloaded from

presence of CO in the range of 0.75% to 1.3% onmass basis and the exhaust gas temperature in therange of 830� 10K. This data is used in equation (7)3
for estimating the combustion inefficiencies.
1� �c ¼
Pi XiQHVi
FAQHVf
ð7Þ
Measurements on PG composition and subsequentanalysis indicate the stoichiometric fuel air ratio (F/A)to be 0.75� 0.02 and the LCV QHVf
to be4.1� 0.05MJ/kg. Considering LCV QHVi
and massfraction Xi for CO as 10.01MJ/kg and 0.013, respect-ively, the conversion inefficiency amounts to about5%. The high exhaust gas temperatures for PG oper-ation (by 70–80K) could be related to the in-cylindercombustion process and indicate late burning withreduced contribution to the work transfer. The sens-ible heat corresponding to 75K evaluates to another5% of the input energy. The above two factorsamount to about 10% compared to a typical fossilfuel combustion where the inefficiencies are in therange of 1–2% of the input fuel energy.3 On thebasis of 90% fuel conversion efficiency, the value ofefficiency factor is found to be 2.4 from equation (4).The shape factor for various conditions for PG oper-ation was determined from the least square methodand is estimated at 0.7 for PG for both NA and TAmodes of operation. The 2% to 90% range is con-sidered for the curve fit which is reasonable sincethe start and end of combustion cannot be exactlyquantified.3,51,64 Figure 12 presents the comparisonbetween experimental and Wiebe simulation heatrelease profiles and as is evident, PG-specific coeffi-cients based simulation provides close match toexperimental results.
Results and discussions
The PG-specific Wiebe coefficients are used in the 0Dmodel and the pressure-crank angle traces comparedwith the experimental results. The CA is representedfrom �180� BTDC to 180� ATDC in comparing theexperimental and simulation results. This range isused to compare the gas exchange, compression,heat release and expansion processes in the enginecycle.
Figures 13 and 14 present the comparison betweenthe experimental and the model predictions for thePG-fuelled engine at three different loads (represent-ing �20%, �50% and 100% loading) under NA andTA modes of operation for the engine E1. A nearcomplete match of the experimental and the modelpredictions for both NA and TA modes of operationsis observed. No quantifiable differences are observedin the magnitude of peak pressure.
Having established the versatility of PG-specificWiebe parameters for engine E1, the analysis isextended to a different engine configuration and dif-ferent compression ratios. Model predictions are car-ried out for engine E2 at two different compressionratios of 11.5 and 13.5. Figure 15 presents the com-parison between the experimental and modeling pres-sure traces for the engine E2. A very close match isobtained for CR 11.5 with the peak pressure matchingto the first decimal while the position of peak pressurediffers only by a degree. However, in the case of CR13.5, the magnitude of peak pressure is slightly lowand the position gets slightly advanced from the TDC.It is assessed that high CR would entail higher in-cylinder temperatures (about 50K higher for CR13.5 than for CR 11.5 for motoring conditionsbased on polytropic assessment) and correspondingly
Figure 12. Comparison of experimental and Wiebe simulation results under NA and TA conditions for the engine E1.
NA: naturally aspirated; TA: turbocharged after-cooled.
Shivapuji and Dasappa 515
at INDIAN INST SCI on March 22, 2016pic.sagepub.comDownloaded from

influence the flame speed, resulting in reduced com-bustion duration and altered combustion phasing.From the figure it can be concluded that advancingthe end of combustion angle would shift the pressureprofile to match the experimental trace and accord-ingly, the end of combustion angle is reduced byabout 6�. Using the advanced condition of combus-tion angle results in near complete reproduction of theexperimental pressure trace implying higher burnrates at higher CR. The above result further strength-ens the generality of the fuel-specific Wiebe coeffi-cients wherein the same coefficients could be used
for a different geometry and CR while requiring thetuning of combustion duration. Tuning of the com-bustion duration is not only desirable and is consist-ent with the in-cylinder thermodynamics, but also amandatory requirement even for physical operation ofthe engine to retain the original operating point with achange in the CR, which is managed by changing theignition timing. The ignition timing is retarded withincreasing CR (shorter combustion duration) andadvanced with reducing CR (longer combustion dur-ation) to phase the combustion to deliver maximumtorque.
Figure 14. Comparison of experimental and simulated pressure traces at various loads for TA operation.
TA: turbocharged after-cooled.
Figure 13. Comparison of experimental and simulated pressure traces at various loads for NA operation.
NA: naturally aspirated.
516 Proc IMechE Part C: J Mechanical Engineering Science 227(3)
at INDIAN INST SCI on March 22, 2016pic.sagepub.comDownloaded from

Conclusions
The research work has shown evidence towards theneed for change in the Wiebe coefficients using produ-cer gas as a fuel whose thermo-physical properties aredifferent from those of a fossil fuel. Experiments on a 6-cylinder engine fitted with a turbo-charger generatedpower of 55.9 kWe, an increase of around 104% overNA peak load of 27.3 kWe. MBT timing along withposition of peak pressure has been used as the criterionfor peak load condition for the experimental analysis.The presence of H2 has been found to influence variousphases of in-cylinder combustion. Presence of H2 isseen to increase the overall burning rate but theimpact on the initial flame kernel development periodis negligible while owing to the high thermal diffusivityand lower quenching distance, heat loss from the gasesto the cylinder walls is seen to increase.
The 0D model adopts the Wiebe function for theheat release and Annand’s heat transfer correlation topredict the engine pressure traces. It has been shownthat the use of producer gas needs change in the effi-ciency factor and the shape factor to match the experi-mental heat release profile. With a¼ 2.4 and m¼ 0.7,the pressure traces for various operating conditions innaturally aspirated and turbo-charged conditionshave been compared with the experimental results.Further, the model has been used to predict the pres-sure profile for a 3-cylinder engine configuration andthe simulation results compare well with the experi-mental results.
Funding
This work was supported by Ministry of New andRenewable Energy, Government of India, New Delhi.
Acknowledgement
The authors thank Cummins India Limited for the supportprovided.
References
1. Astbury GR. A review of the properties and hazards ofsome alternative fuels. Process Safety Environ Protect
2008; 86(6): 397–414.2. Rakopoulos CD and Michos CN. Development and
validation of a multi-zone combustion model for per-
formance and nitric oxide formation in syngas fueledspark ignition engine. Energy Convers Manage 2008;49(10): 2924–2938.
3. Heywood JB. Internal combustion engine fundamentals.
Singapore: McGraw-Hill, 1988, 2002.4. Yang S and Reitz RD. Improved combustion submodels
for modeling gasoline engines with the level set g equation
and detailed chemical kinetics. Proc IMechE, Part D: JAutomobile Engineering 2009; 223(5): 703–726.
5. Chiodi M. An innovative 3D-CFD-approach towards
virtual development of internal combustion engines.New York: Springer, 2011.
6. Verhelst S and Sheppard CGW. Multi-zone thermo-
dynamic modeling of spark-ignition engine combus-tion-an overview. Energy Conver Manage 2009; 50(5):1326–1335.
7. Heywood JB, Higgins JM, Watts PA, et al. Development
and use of a cycle simulation to predict SI engine efficiencyand NOx emissions. vol. 790291, Warrendale, PA:Society of Automotive Engineers, 1979.
8. Giansetti P, Colin G, Higelin P, et al. Residual gasfraction measurement and computation. Int J EngineRes 2007; 8(4): 347–364.
9. Soylu S. Prediction of knock limited operating condi-tions of a natural gas engine. Energy Convers Manage2005; 46(1): 121–138.
10. Lounici MS, Loubar K, Balistrou M, et al.Investigation on heat transfer evaluation for a more
Figure 15. Comparison of experimental and simulated traces for E2 under WOT–MBT operation.
WOT: wide open throttle; MBT: maximum brake torque; BTDC: before top center.
Shivapuji and Dasappa 517
at INDIAN INST SCI on March 22, 2016pic.sagepub.comDownloaded from

efficient two-zone combustion model in the case of nat-ural gas SI engines. Appl Therm Eng 2011; 31(2-3):319–328.
11. Rivas-Renault M, Higelin-Prisme P, Caillol-Prisme C,et al. Validation and application of a new 0d flame/wallinteraction sub model for SI engines. SAE Int J Engines
2012; 5(3): 718–733.12. Malbec LM, Le Berr F, Richard S, et al. Modeling
turbocharged spark-ignition engines: towards predict-
ive real time simulators. SAE Technical Paper 2009,p. 01 0675.
13. Le Solliec G, Le Berr F, Colin G, et al. Engine controlof a downsized spark ignited engine: from simulation to
vehicle. Oil Gas Sci Technol 2007; 62(4): 555–572.14. Richard S, Bougrine S, Font G, et al. On the reduction
of a 3d CFD combustion model to build a physical 0d
model for simulating heat release, knock and pollutantsin si engines. Oil Gas Sci Technol 2009; 64(3): 223–242.
15. Dasappa S, Sridhar G, Sridhar HV, et al. Producer gas
engines–proponent of clean energy technology.In: Proceedings of 15th european biomass conferenceand exhibition–from research to market deployment–bio-
mass for energy, industry and climate protection, Berlin,Germany. 2007, pp. 976–981.
16. Glassman I. Combustion. Academic Press, 1996.17. Kuo KK. Principles of combustion. New Jersey: John
Wiley & Sons, 2005.18. Sonntag RE, Borgnakke C, Van Wylen GJ, et al.
Fundamen-tals of thermodynamics. New York: Wiley,
1998.19. Turns SR. An introduction to combustion: concepts and
applications. vol. 10. New York: McGraw-hill, 1996.
20. Karim GA, Wierzba I and Al-Alousi Y. Methane-hydrogen mixtures as fuels. Int J Hydrogen Energy1996; 21(7): 625–631.
21. Bell SR and Gupta M. Extension of the lean operating
limit for natural gas fueling of a spark ignited engineusing hydrogen blending. Combust Sci Technol 1997;123(1–6): 23–48.
22. Roger IR. Natural gas/hydrogen mixtures for low nox-ious emissions. J Scient Ind Res 2003; 62(1–2): 64–70.
23. Serrano C, Hernandez JJ, Mandilas C, et al. Laminar
burning behaviour of biomass gasification-derived pro-ducer gas. Int J Hydrogen Energy 2008; 33(2): 851–862.
24. Hernandez JJ, Lapuerta M, Serrano C, et al. Estimation
of the laminar flame speed of producer gas from bio-mass gasification. Energy Fuels 2005; 19(5): 2172–2178.
25. Bechtold JK and Matalon M. Hydrodynamic and diffu-sion effects on the stability of spherically expanding
flames. Combust Flame 1987; 67(1): 77–90.26. Gillespie L, Lawes M, Sheppard CGW, et al. Aspects of
laminar and turbulent burning velocity relevant to SI
engines. SAE Trans 2000; 109(3): 13–33.27. Galindo J, Climent H, Pla B, et al. Correlations for
Wiebe function parameters for combustion simulation
in two-stroke small engines. Appl Therm Eng 2011;31(6–7): 1190–1199.
28. Sridhar G, Paul PJ and Mukunda HS. Biomass derivedproducer gas as a reciprocating engine fuel-an experi-
mental analysis. Biomass Bioenergy 2001; 21(1): 61–72.29. Sridhar G, Sridhar HV, Dasappa S, et al. Development
of producer gas engines. Proc IMechE, Part D:
J Automobile Engineering 2005; 219(3): 423–438.
30. Dasappa S, Sridhar HV and Indrajit M. Experimentson and thermodynamic analysis of a turbochargedengine with producer gas as fuel. Proc IMechE, Part
C: J Mechanical Engineering Science 2011.31. Dasappa S, Sridhar G and Paul PJ. Adaptation of small
capacity natural gas engine for producer gas operation.
Proc IMechE, Part C: J Mechanical Engineering Science2011.
32. Sridhar G, Paul PJ and Mukunda HS. Zero-dimen-
sional modeling of a producer gas-based reciprocatingengine. Proc IMechE, Part A: J Power and Energy 2006;220(8): 923–931.
33. Rakopoulos CD, Michos CN and Giakoumis EG.
Availability analysis of a syngas fueled spark ignitionengine using a multi-zone combustion model. Energy2008; 33(9): 1378–1398.
34. Stone CR and Green-Armytage DI. Comparison ofmethods for the calculation of mass fraction burntfrom engine pressure time diagrams. Proc IMechE,
Part D: J Transport Engineering 1987; 201(14): 61–67.35. Caton JA. Operating characteristics of a spark-ignition
engines using the second law of thermodynamics: effects
of speed and load. SAE Technical Paper 2000-01-0952,2000.
36. Gallo WLR and Milanez LF. Society of AutomotiveEngineers. Exergetic analysis of ethanol and gasoline
fueled engines. Technical Report. Society ofAutomotive Engineers, Warrendale, PA, 1992.
37. Ramos JI. Comparisons between thermodynamic and
one-dimensional combustion models of spark-ignitionengines. Appl Math Model 1986; 10(6): 409–422.
38. Ibrahim A and Bari S. Optimization of a natural gas si
engine employing egr strategy using a two-zone com-bustion model. Fuel 2008; 87(10–11): 1824–1834.
39. Kakaee AH, Shojaeefard MH and Zareei J. Sensitivityand effect of ignition timing on the performance of a
spark ignition engine: an experimental and modelingstudy. J Combust 2011; 2011: 678719.
40. Mustafi NN and Raine RR. Application of a spark
ignition engine simulation tool for alternative fuels.J Eng Gas Turb Power 2008; 130: 012804.
41. Rao SG. Experiments and modelling studies of produ-
cer gas based spark-ignited reciprocating engines. PhDthesis. Indian Institute of Science, 2003.
42. Ferguson CR and Kirkpatrick AT. Internal combustion
engines: applied thermosciences. 2nd edn. New York:Wiley, 2000.
43. Watson N and Janota MS. Turbocharging the internalcombustion engine. London: MacMillan, 1982.
44. Chevalier A, Muller M and Hendricks E. On the valid-ity of mean value engine models during transient oper-ation. SAE Trans 2000; 109(3): 1571–1592.
45. Stotsky AA. Automotive engines: control, estimation,statistical detection. New York: Springer Verlag, 2009.
46. Annand WJD and Roe GE. Gas flow in the internal
combustion engine: power, performance, emission con-trol, and silencing. Sparkford, Somerset, UK: GTFoulis, 1974.
47. Oppenheim AK. Combustion in piston engines: technol-
ogy, evolution, diagnosis, and control. New York:Springer Verlag, 2004.
48. Devore JL. Probability and statistics for engineering and
the sciences. Boston: Duxbury Press, 2011.
518 Proc IMechE Part C: J Mechanical Engineering Science 227(3)
at INDIAN INST SCI on March 22, 2016pic.sagepub.comDownloaded from
49. Ghojel J. Review of the development and applicationsof the wiebe function: A tribute to the contribution ofivan wiebe to engine research. Int J Engine Res 2010;
11(4): 297–312.50. Borg JM and Alkidas AC. On the application of wiebe
functions to simulate normal and knocking spark-igni-
tion combustion. Int J Vehicle Design 2009; 49(1):52–69.
51. Shiao Y and Moskwa JJ. Cylinder pressure and com-
bustion heat release estimation for si engine diagnosticsusing nonlinear sliding observers. IEEE Trans ContrSys Technol 1995; 3(1): 70–78.
52. Pipitone E. A comparison between combustion phase
indicators for optimal spark timing. J Eng Gas TurbPower 2008; 130: 052808.
53. Abraham J and Magi V. Modeling radiant heat loss
characteristics in a diesel engine. SAE Technical Paper970888, 1997.
54. Annand WJD. Heat transfer in the cylinders of recipro-
cating internal combustion engines. Proc Inst Mech Eng1963; 177(1): 973–996.
55. Woschni G. A universally applicable equation for the
instantaneous heat transfer coefficient in the internalcombustion engine. SAE Paper, 670931, 1967.
56. Hohenberg GF. Advanced approaches for heat transfercalculations. Technical report, Society of Automotive
Engineers. Warrendale, PA, 1979.57. Tahtouh T, Halter F, Mounaım-Rousselle C, et al.
Experimental investigation of the initial stages of
flame propagation in a spark-ignition engine: effectsof fuel, hydrogen addition and nitrogen dilution. SAEInt J Eng 2010; 3(2): 1–19.
58. Wang J, Huang Z, Miao H, et al. Characteristics ofdirect injection combustion fuelled by naturalgasohydrogen mixtures using a constant volumevessel. Int J Hydrogen Energy 2008; 33(7): 1947–1956.
59. D’Andrea T, Henshaw PF and Ting DSK. The additionof hydrogen to a gasoline-fuelled si engine. Int JHydrogen Energy 2004; 29(14): 1541–1552.
60. Shivapuji AM and Dasappa S. Experimental studies onmulti-cylinder natural gas engine fueled with producergas. In: Proceedings of 19th European biomass confer-
ence and exhibitionfrom research to industry and mar-kets, Berlin, Germany. 2011, pp.974–980.
61. Ma F, Wang Y, Wang J, et al. Effects of combustion
phasing, combustion duration, and their cyclic
variations on sparkignition (si) engine efficiency.Energy Fuels 2008; 22(5): 3022–3028.
62. Shudo T. Improving thermal efficiency by reducing
cooling losses in hydrogen combustion engines. Int JHydrogen Energy 2007; 32(17): 4285–4293.
63. Lyford-Pike EJ and Heywood JB. Thermal boundary
layer thickness in the cylinder of a spark-ignitionengine. Int J Heat Mass Transfer 1984; 27(10):1873–1878.
64. Tazerout M, Le Corre O and Ramesh A. A new methodto determine the start and end of combustion in aninternal combustion engine using entropy changes. IntJ Thermodyn 2010; 3(2): 49–55.
Appendix
Notation
a efficiency factorB linear dimension (bore diameter)c speed of sounde exit conditionshc,g convective heat transfer coefficienti inlet conditionsk thermal conductivitym shape factor_m mass flow rate_q convective heat fluxP cylinder pressureQ heat transferQHVf
fuel lower heating valueQHVi
specie lower heating value�Sp mean piston speed�Tg mean gas temperatureTw,g wall temperatureV cylinder volumeXi specie mass fraction
� crank angle� polytropic index�c combustion efficiency� dynamic viscosity� density
Shivapuji and Dasappa 519
at INDIAN INST SCI on March 22, 2016pic.sagepub.comDownloaded from