Embed Size (px)
Citation preview

6. September. 2017
2017 KEPIC-Week
Experimental study on design code revision of headed bar
Choi, Chang-Sik Hanyang University
Chun, Sung-Chul Inchun National University
Lee, Byung-Soo KHNP-CRI

2/31
• Dense and Excessive reinforcement
Extension of the construction period /
Difficulty of reinforcement placing
• Using the Large diameter rebar (#14, #18)
Need the excessive hooked length /
Difficulty to secure the development length
#8 (db = 25mm)
#11 (db = 35mm)
#18 (db = 57mm)
Characteristic of Nuclear Power Plant
Headed Bars
High Strength
Large Diameter
Need the Headed Bars
Lungmen nuclear power plant (Taiwan, 2003)
• To shorten the development length
• To solve the dense reinforcement
• To be easy with reinforcement placing
3/31
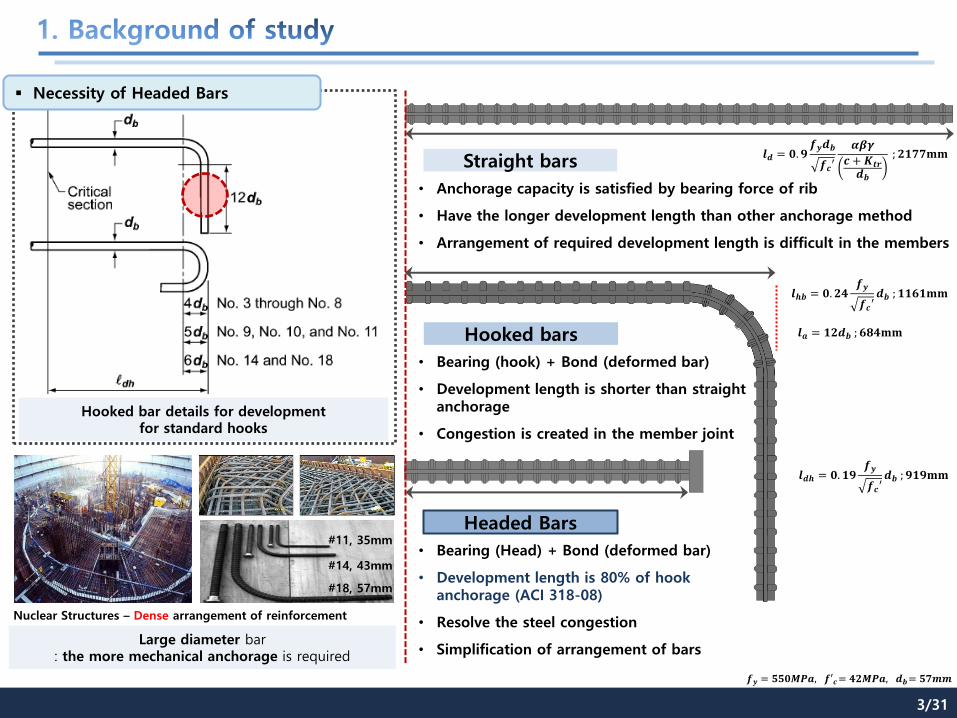
Straight bars
Hooked bars
• Bearing (hook) + Bond (deformed bar)
• Development length is shorter than straight anchorage
• Congestion is created in the member joint
Headed Bars
𝒍𝒅𝒉 = 𝟎. 𝟏𝟗𝒇𝒚
𝒇𝒄′𝒅𝒃 ; 𝟗𝟏𝟗𝐦𝐦
𝒍𝒉𝒃 = 𝟎. 𝟐𝟒𝒇𝒚
𝒇𝒄′𝒅𝒃 ; 𝟏𝟏𝟔𝟏𝐦𝐦
• Anchorage capacity is satisfied by bearing force of rib
• Have the longer development length than other anchorage method
• Arrangement of required development length is difficult in the members
• Bearing (Head) + Bond (deformed bar)
• Development length is 80% of hook anchorage (ACI 318-08)
• Resolve the steel congestion
• Simplification of arrangement of bars
#11, 35mm
#14, 43mm
#18, 57mm
Nuclear Structures – Dense arrangement of reinforcement
Large diameter bar : the more mechanical anchorage is required
Hooked bar details for development for standard hooks
Necessity of Headed Bars
𝒍𝒅 = 𝟎. 𝟗𝒇𝒚𝒅𝒃
𝒇𝒄′
𝜶𝜷𝜸
𝒄 + 𝑲𝒕𝒓𝒅𝒃
; 𝟐𝟏𝟕𝟕𝐦𝐦
𝒇𝒚 = 𝟓𝟓𝟎𝑴𝑷𝒂, 𝒇′𝒄 = 𝟒𝟐𝑴𝑷𝒂, 𝒅𝒃 = 𝟓𝟕𝒎𝒎
𝒍𝒂 = 𝟏𝟐𝒅𝒃 ; 𝟔𝟖𝟒𝐦𝐦
4/31
Design codes of Mechanical anchorage
Need to verify for test or to use with design of anchor
- AASHTO LRFD Bridge Design Specifications - Australian Standard - New Zealand Standard - Canadian Standard - Eurocode 2 - fib Model Code 2010 Draft
Other design codes
Current design codes associated with Nuclear power plants
ASME III 2-10 ACI 349-06 ACI 318-08
Status
Problem
Absence of specific design equation
Difficult to determine the development
length
Need the design method of anchor
80% of hooked bar
Conservative design/ Excessive development
length
Limitation of diameter Not applicable design of nuclear
power plant
ACI 318-08
12.6 – Development of headed and mechanically anchored deformed bars in tension 12.6.1 - Development length for headed deformed bars in tension, ldt, shall be determined from 12.6.2. Use of heads to develop deformed bars in tension shall be limited to conditions satisfying (a) through (f):
(a) Bar fy shall not exceed 420 MPa; (b) Bar size shall not exceed 35 mm (f) Clear spacing between bars shall not be less than 4db. fc’ used to calculate ldt shall not exceed 42 MPa
0.19'
ydh b
c
fl d
f
Application with
Mechanical anchorage in nuclear
power plants
Problem 1. Absence of specific design codes and
Limitation of design code
420MPa, 42MPay cf f
35mm, 4b c bd s d
Problem 2. Increase of the development length of mechanical anchorage for large diameter and high strength steel
0.19'
ydh b
c
fl d
f
550MPayf 43mmbd
Need the study • The evaluation of
mechanical anchorage with large diameter
• The development of specific design code of mechanical anchorage

5/31
Research Objective of Headed Bars
· Bar Yield Strength
Gr. 60 (420MPa)
→ Gr. 80 (550MPa)
· Bar diameter
#11 (36mm) → #18 (57mm)
· Effects of transverse reinforcement
No consideration → O
(a) fy ≤ 60,000 psi (420 MPa)
(b) db ≤ #11 (36mm)
(c) fc ’≤ 6000 psi (42 MPa)
(d) Normal-weight concrete
(e) Net bearing area of head Abrg ≥ 4Ab
(f) Clear cover ≥ 2db
(g) Clear spacing ≥ 4db
(h) No consideration on transverse
reinforcement
Objective
Some Limitations of current provisions

6/31
Test Program
• Three tests were planned: Joint test, splice test, and TTC node test
• Joint test: Simulating joints where headed bars are expected to be frequently applied.
• Splice test: Most commonly used test. Expecting very conservative results.
• TTC node test: Simulating a development. (cut-off bars)
P1 P2
• Joint test • TTC node test
• Exterior beam-column Joint test
under cyclic load
• Splice test

7/31
Test setup
Reaction frame
Hydraulic rams
Imaginary
beam
Front view Side view
Joint
8/31
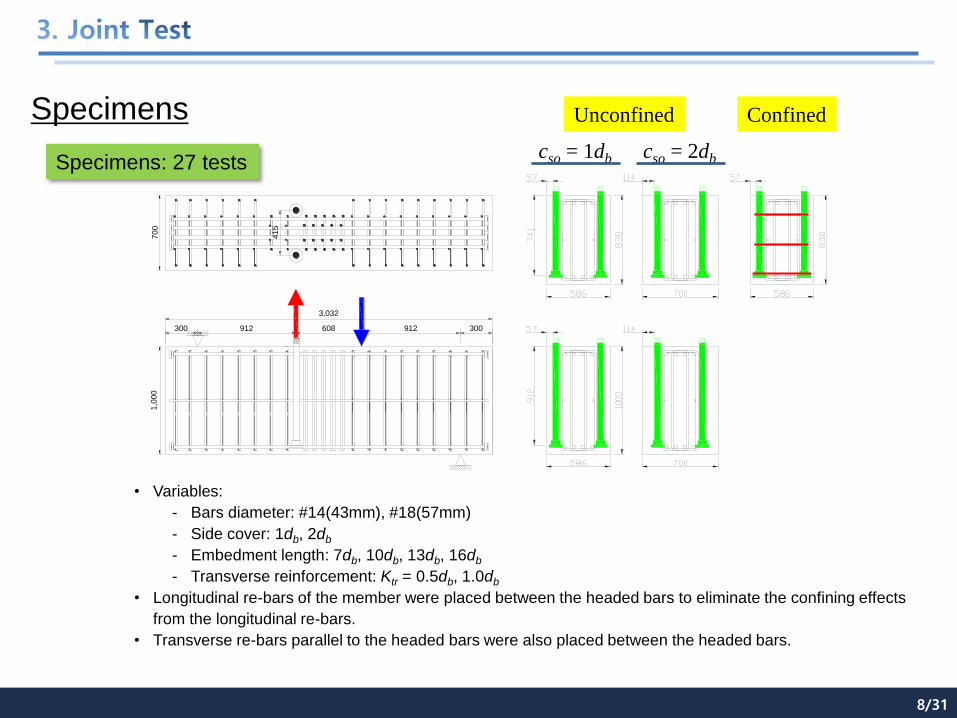
Specimens
• Variables:
- Bars diameter: #14(43mm), #18(57mm)
- Side cover: 1db, 2db
- Embedment length: 7db, 10db, 13db, 16db
- Transverse reinforcement: Ktr = 0.5db, 1.0db
• Longitudinal re-bars of the member were placed between the headed bars to eliminate the confining effects
from the longitudinal re-bars.
• Transverse re-bars parallel to the headed bars were also placed between the headed bars.
Specimens: 27 tests
300
3,032
912
1,0
00
300 912608
41
5
70
0cso = 1db cso = 2db
Unconfined Confined

9/31
• All headed bars anchored in 23 specimens showed side-face blowout failure.
• The first crack initiated at the face of the member due to bond loss. The cracks then propagated toward
the head.
• When the load reached a maximum value, the cover concrete suddenly spalled.
Failure mode
• Even though some diagonal cracks seemed to form a conical-shaped failure, the main failure mode was a
side-face blowout.

10/31
0
100
200
300
400
500
600
0 100 200 300 400 500 600
• The early rise in the bond component shows that the bar force was initially transferred to the concrete
primarily by the bond.
• The bond reached its peak capacity and began to decline and the head bearing component rose rapidly.
• The maximum capacity of the headed bar was provided by peak head bearing plus reduced bond.
Bond and head bearing contributions
Bar
str
ess
from
hea
d b
eari
ng o
r bond (
MP
a)
Total bar stress (MPa)
bond
#18-L16-C1
head bearing
Max. anchorage strength
A
B
C
bond
loss A
B
C
11/31
0
30
60
90
120
0 10 20 30
#14
#18
Bashandy(#8,#11)
ACI318 headed bars
ACI318 hooked bars0
30
60
90
120
0 10 20 30
#18
#14
Bashandy(#8,#11)
ACI318 headed bars
ACI318 hooked bars
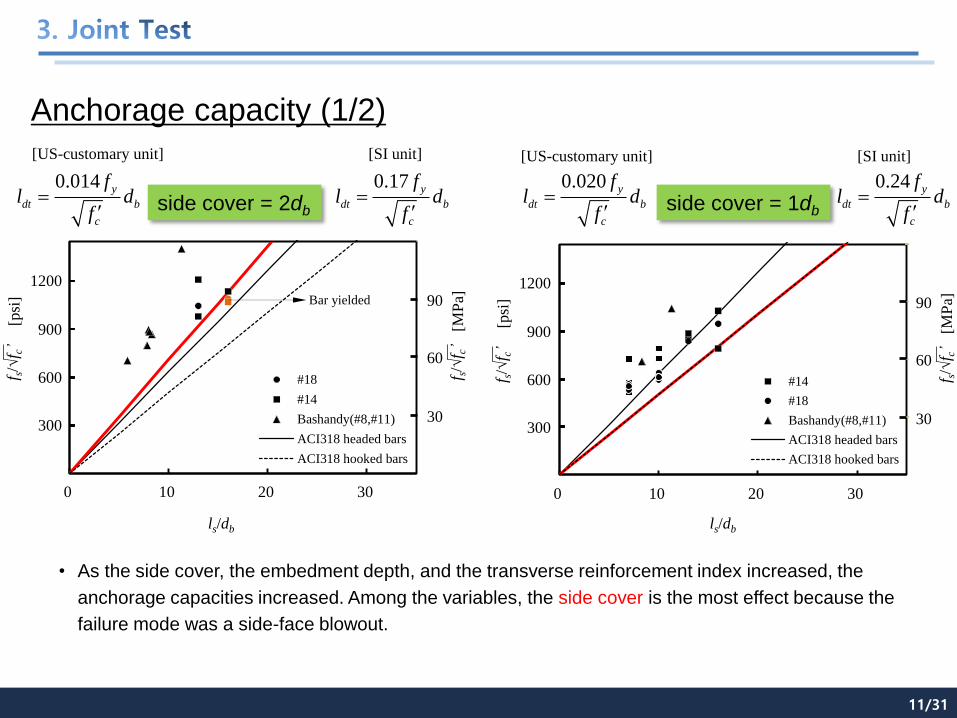
• As the side cover, the embedment depth, and the transverse reinforcement index increased, the
anchorage capacities increased. Among the variables, the side cover is the most effect because the
failure mode was a side-face blowout.
ls/db
f s/√
f c’
Anchorage capacity (1/2)
side cover = 2db
0.014 y
dt b
c
fl d
f
Bar yielded
300
600
900
1200
30
60
90
0.17 y
dt b
c
fl d
f
[psi
]
f s/√
f c’
[MP
a]
[US-customary unit] [SI unit]
ls/db
side cover = 1db
0.24 y
dt b
c
fl d
f
f s/√
f c’
300
600
900
1200
30
60
90
[psi
]
f s/√
f c’
[MP
a]
[US-customary unit] [SI unit]
0.020 y
dt b
c
fl d
f

12/31
0
30
60
90
120
0 10 20 30
#18(confined)
#18(unconfined)
#14(confined)
#14(unconfined)
ACI318 headed bars
ACI318 hooked bars
ls/db
Confined headed bars
0.15 y
dt b
c
fl d
f
#18 Headed bar
Transverse
reinforcing
bars
Anchorage capacity (2/2)
33%
f s/√
f c’
0.012 y
dt b
c
fl d
f
300
600
900
1200
30
60
90
[psi
]
f s/√
f c’
[MP
a]
[US-customary unit] [SI unit]
13%
• Transverse reinforcement of a hair-pin type could increase the anchorage strength by 27% on average.

13/31
Test setup

14/31
Specimens
Specimens: 37 tests
• Variables:
- Bars diameter: #8(25mm), #9(29mm), #14(43mm), #18(57mm)
- Clear spacing: 2db, 3db , 4db
- Side cover: 1db, 2db, 3db , 4db
- Splice length: 12db, ~ 30db
- Transverse reinforcement: Ktr = 0.5db ~ 2.5db
200 1,600 2001,600
630 630
2,400
1,140
6,000
6,000
200 1,600 2001,600
630 630
2,400
1,140
D13 stirrup @ 200
D13 stirrup @ 200 D13 confinement @ 140

15/31
Specimens
Specimens: 37 tests
• Variables:
- Bars diameter: #8(25mm), #9(29mm), #14(43mm), #18(57mm)
- Clear spacing: 2db, 3db , 4db
- Side cover: 1db, 2db, 3db , 4db
- Splice length: 12db, ~ 30db
- Transverse reinforcement: Ktr = 0.5db ~ 2.5db
200 1,600 2001,600
630 630
2,400
1,140
6,000
6,000
200 1,600 2001,600
630 630
2,400
1,140
D13 stirrup @ 200
D13 stirrup @ 200 D13 confinement @ 140

16/31
Failure mode
Unconfined Confined
Splitting failures by
• Prying action due to flexural deformation
• Circumferential tensile stresses due to head bearing force
• Circumferential tensile stresses due to bond along lap length

17/31
Bond and head bearing contributions
0
100
200
300
400
500
600
0 100 200 300 400 500 600
• As the transverse reinforcement index increased, the bond and head bearing capacities increased.
• When the bond reached the peak capacity, the bottom cover immediately spalled and the head bearing
lost its capacity, too.
Bar
str
ess
from
hea
d b
eari
ng o
r bond (
MP
a)
Total bar stress (MPa)
bond
#18-L20
#18-L20-Con.
#18-L20-Con.2
head bearing
18/31
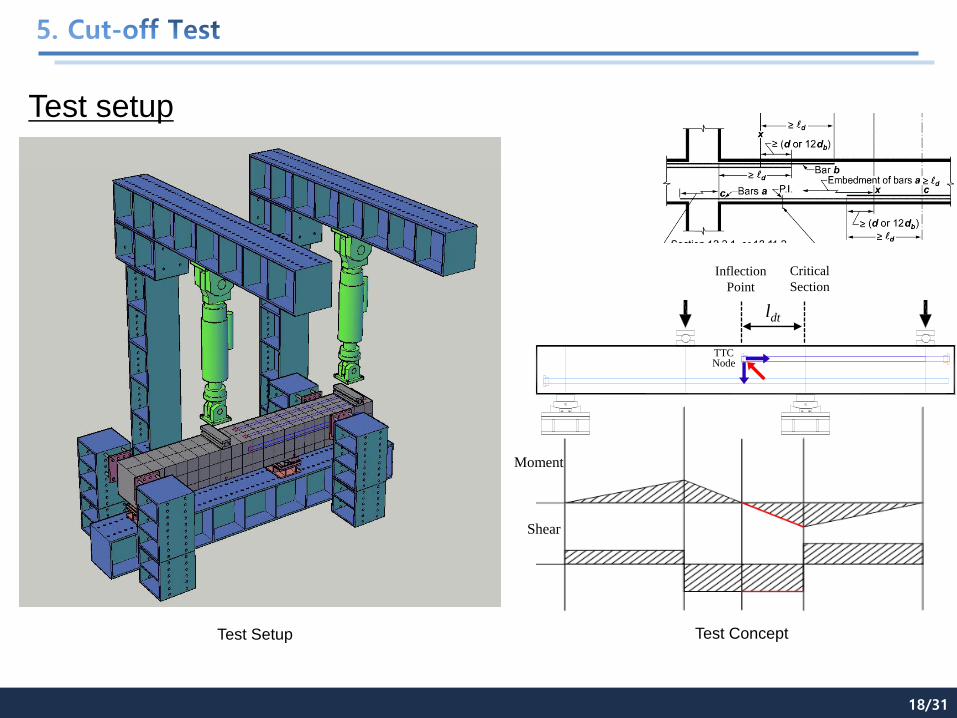
Test setup
P1 P2ldt
Inflection
Point
Critical
Section
TTC Node
Moment
Shear
Test Setup Test Concept

19/31
Specimens
Specimens: 16 tests
• Variables:
- Bars diameter: #14(43mm), #18(57mm)
- Clear spacing: 2db, 3db , 4db
- Side cover: 2db, 4db
- Splice length: 12db, ~ 28db
- Transverse reinforcement: Ktr = 1.0db ~ 2.0db
1300280 280
108
270
143
520
143171143
456
855
4460
1300 1300

20/31
Specimens
Specimens: 16 tests
• Variables:
- Bars diameter: #14(43mm), #18(57mm)
- Clear spacing: 2db, 3db , 4db
- Side cover: 2db, 4db
- Splice length: 12db, ~ 28db
- Transverse reinforcement: Ktr = 1.0db ~ 2.0db
143171143
456
855
4460
1300 13001300280 280
108
270
143
520

21/31
Failure mode
Unconfined Confined
• All specimens failed by splitting.
• In unconfined specimen, inclined cracks occurred around the head and splitting failure occurred
immediately.
• In confined specimen, after inclined cracks occurred around the head, splitting failure gradually
occurred with maintaining the load.
①
②
① ②
③

22/31
Splice & TTC node test: Anchorage capcity
ls/db
Unconfined, cmin ≥ 2db
0.4 y
dt b
c
fl d
f
• Clear spacing and transverse reinforcement are effective variables.
• Unconfined headed bars had very low strengths.
• Confined headed bars with Ktr of 1.2db had almost same strength as the hooked bars have.
0
30
60
90
120
0 10 20 30
#8,#9
#14,#18
ACI318 headed bars
ACI318 hooked bars
f s/√
f c’
0.033 y
dt b
c
fl d
f
300
600
900
1200
30
60
90
[psi
]
f s/√
f c’
[MP
a]
[US-customary unit] [SI unit]
ls/db
Confined, Ktr ≥ 1.2db
0
30
60
90
120
0 10 20 30
#8,#9
#14,#18
ACI318 headed bars
ACI318 hooked bars
f s/√
f c’
0.019 y
dt b
c
fl d
f
300
600
900
1200
30
60
90
[psi
]
f s/√
f c’
[MP
a]
[US-customary unit] [SI unit]
0.23 y
dt b
c
fl d
f

23/31
Test setup

24/31
Specimens

25/31
Detail of Specimens
Relation between beam moment versus drift
850
970
Cs=57
685
970
ldt=855
ldt = 15db
Cs = 1db
Failure Mode
Side-face blowout
Plan
Section
Cs=57
685
970
ldt=855
Beam yield
U type transverse re-bars
Failure modes Anchorage capacity
-8 -6 -4 -2 0 2 4 6 8
-2500
-2000
-1500
-1000
-500
0
500
1000
1500
2000
2500
Be
am
Mo
me
nt
[kN
-m]
Drift Ratio [%]
Mn = 1438 kN.m
Displacement [mm]
Mn = -1438 kN.m
M /
Mn
-320 -240 -160 -80 0 80 160 240 320
-1.5
-1.0
-0.5
0.0
0.5
1.0
1.5
First yield of rebar (1,[email protected]%)
Peak moment (1,[email protected]%)
Brittle failure
Nominal moment (1,438kN.m)
Nominal moment (-1,438kN.m)
Max drift (2.0%)
-8 -6 -4 -2 0 2 4 6 8
-2500
-2000
-1500
-1000
-500
0
500
1000
1500
2000
2500
Be
am
Mo
me
nt
[kN
-m]
Drift Ratio [%]
Mn = 1438 kN.m
Mn = -1438 kN.m
-320 -240 -160 -80 0 80 160 240 320
-1.5
-1.0
-0.5
0.0
0.5
1.0
1.5
M /
Mn
Displacement [mm]
Ductile failure
First yield of rebar (1,[email protected]%)
Peak moment (1,[email protected]%)
Nominal moment (-1,438kN.m)
Max drift (4.0%)
Nominal moment (1,438kN.m)
0
100
200
300
400
500
600
700
0 1 2 3 4
Bar
te
nsi
le s
tre
ss [
MP
a]
Drift [%]
Bearing
Anchrage
EJ-T1-L15-S1
0
100
200
300
400
500
600
700
0 1 2 3 4
Bar
te
nsi
le s
tre
ss [
MP
a]
Drift [%]
Bearing
Anchrage
EJ-T1-L15-S1-T

26/31
-8 -6 -4 -2 0 2 4 6 8
-2500
-2000
-1500
-1000
-500
0
500
1000
1500
2000
2500
Be
am
Mo
me
nt
[kN
-m]
Drift Ratio [%]
-320 -240 -160 -80 0 80 160 240 320
-1.0
-0.5
0.0
0.5
1.0
Displacement [mm]
M /
Mn
Mn = 2033 kN.m
Mn = -2033 kN.m
-8 -6 -4 -2 0 2 4 6 8
-2500
-2000
-1500
-1000
-500
0
500
1000
1500
2000
2500
Be
am
Mo
me
nt
[kN
-m]
Drift Ratio [%]
Mn = 1438 kN.m
Displacement [mm]
Mn = -1438 kN.m
M /
Mn
-320 -240 -160 -80 0 80 160 240 320
-1.5
-1.0
-0.5
0.0
0.5
1.0
1.5
Detail of Specimens
Relation between beam moment versus drift
850
970
ldt = 15db
Cs = 2db
Failure Mode
Beam yield
Plan
Section Joint shear
First yield of rebar (1,[email protected]%)
Peak moment (1,[email protected]%)
Nominal moment (1,438kN.m)
First yield of rebar (2,[email protected]%)
Peak moment (2,391kN.m @2.0%)
Nominal moment (2,033kN.m)
Nominal moment (-2,033kN.m)
Nominal moment (-1,438kN.m)
Anchorage capacity
Cs=114
ldt=855
800
970
Cs=114
ldt=855
800
970
Max drift (4.0%)
Max drift (3.0%)
0
100
200
300
400
500
600
700
0 1 2 3 4
Bar
te
nsi
le s
tre
ss [
MP
a]
Drift [%]
Bearing
Anchrage
EJ-T1-L15-S2
0
100
200
300
400
500
600
700
0 1 2 3 4
Bar
te
nsi
le s
tre
ss [
MP
a]
Drift [%]
Bearing
Anchrage
EJ-T1-L15-S2-J
Failure modes

27/31
Detail of Specimens
Relation between beam moment versus drift
Anchorage capacity
-8 -6 -4 -2 0 2 4 6 8
-2500
-2000
-1500
-1000
-500
0
500
1000
1500
2000
2500
Be
am
Mo
me
nt
[kN
-m]
Drift Ratio [%]
Mn = 1438 kN.m
Displacement [mm]
Mn = -1438 kN.m
M /
Mn
-280 -210 -140 -70 0 70 140 210 280
-1.5
-1.0
-0.5
0.0
0.5
1.0
1.5
First yield of rebar (1,[email protected]%)
Peak moment (1,[email protected]%) Nominal moment
(1,438kN.m)
Nominal moment (-1,438kN.m)
Max drift (7.0%)
-8 -6 -4 -2 0 2 4 6 8
-2500
-2000
-1500
-1000
-500
0
500
1000
1500
2000
2500
Be
am
Mo
me
nt
[kN
-m]
Drift Ratio [%]
Mn = 1438 kN.m
Displacement [mm]
Mn = -1438 kN.m
M /
Mn
-280 -210 -140 -70 0 70 140 210 280
-1.5
-1.0
-0.5
0.0
0.5
1.0
1.5
First yield of rebar (1,[email protected]%)
Peak moment (1,[email protected]%)
Nominal moment (1,438kN.m)
Nominal moment (-1,438kN.m)
Max drift (6.0%)
ldt = 15db
Details
Headed bar Hooked bar
ldh = 20db
1140(ldh=20db)
1255
850850
970
855(ldt=15db)
Plan
0
100
200
300
400
500
600
700
0 1 2 3 4
Bar
te
nsi
le s
tre
ss [
MP
a]
Drift [%]
Bearing
Anchrage
EJ-T2-L15-S2
0
100
200
300
400
500
600
700
0 1 2 3 4
Bar
te
nsi
le s
tre
ss [
MP
a]
Drift [%]
Bearing
Anchrage
EJ-T2-L20-S2-H
Failure modes
28/31
-8 -6 -4 -2 0 2 4 6 8
-2500
-2000
-1500
-1000
-500
0
500
1000
1500
2000
2500
Be
am
Mo
me
nt
[kN
-m]
Drift Ratio [%]
Mn = 1438 kN.m
Displacement [mm]
Mn = -1438 kN.m
M /
Mn
-280 -210 -140 -70 0 70 140 210 280
-1.5
-1.0
-0.5
0.0
0.5
1.0
1.5
-8 -6 -4 -2 0 2 4 6 8
-2500
-2000
-1500
-1000
-500
0
500
1000
1500
2000
2500
Be
am
Mo
me
nt
[kN
-m]
Drift Ratio [%]
Mn = 1438 kN.m
Displacement [mm]
Mn = -1438 kN.m
M /
Mn
-280 -210 -140 -70 0 70 140 210 280
-1.5
-1.0
-0.5
0.0
0.5
1.0
1.5
Detail of Specimens
Relation between beam moment versus drift
First yield of rebar (1,[email protected]%)
Peak moment (1,[email protected]%)
Nominal moment (1,438kN.m)
First yield of rebar ([email protected]%)
Peak moment (1,[email protected]%)
Nominal moment (1,438kN.m)
Nominal moment (-1,438kN.m)
Nominal moment (-1,438kN.m)
Anchorage capacity
Max drift (7.0%)
Max drift (7.0%)
Details
Headed bar Headed bar
Plan
479
860
850
685(ldt=13db)
ldt = 15db
fck = 42MPa
ldt = 13db
fck = 70MPa
850
970
855(ldt=15db)
0
100
200
300
400
500
600
700
0 1 2 3 4
Bar
te
nsi
le s
tre
ss [
MP
a]
Drift [%]
Bearing
Anchrage
EJ-T2-L15-S2
0
100
200
300
400
500
600
700
0 1 2 3 4
Bar
te
nsi
le s
tre
ss [
MP
a]
Drift [%]
Bearing
Anchrage
EJ-T2-L13-S2-C
Failure modes

29/31
-8 -6 -4 -2 0 2 4 6 8
-2500
-2000
-1500
-1000
-500
0
500
1000
1500
2000
2500
Be
am
Mo
me
nt
[kN
-m]
Drift Ratio [%]
Mn = 1438 kN.m
Mn = -1438 kN.m
-280 -210 -140 -70 0 70 140 210 280
-1.5
-1.0
-0.5
0.0
0.5
1.0
1.5
Displacement [mm]
M /
Mn
-8 -6 -4 -2 0 2 4 6 8
-2500
-2000
-1500
-1000
-500
0
500
1000
1500
2000
2500
Be
am
Mo
me
nt
[kN
-m]
Drift Ratio [%]
Mn = 1438 kN.m
Displacement [mm]
Mn = -1438 kN.m
M /
Mn
-280 -210 -140 -70 0 70 140 210 280
-1.5
-1.0
-0.5
0.0
0.5
1.0
1.5
Detail of Specimens
Relation between beam moment versus drift
First yield of rebar (1,[email protected]%)
Peak moment (1,[email protected]%)
Nominal moment (1,438kN.m)
First yield of rebar (1,[email protected]%)
Peak moment (1,[email protected]%)
Nominal moment (1,438kN.m)
Nominal moment (-1,438kN.m)
Nominal moment (-1,438kN.m)
Failure modes Anchorage capacity
Max drift (7.0%)
Max drift (7.0%)
970
800
855(ldt=15db)
ldt = 15db
Cso1 = 2.0db
Cso2 = 2.0db
Details
Centric Eccentric
Section
ldt = 15db
Cso1 = 2.5db
Cso2 = 1.5db
800
855(ldt=15db)
970
0
100
200
300
400
500
600
700
0 1 2 3 4
Bar
te
nsi
le s
tre
ss [
MP
a]
Drift [%]
Bearing
Anchrage
EJ-T2-L15-S1.5-E
0
100
200
300
400
500
600
700
0 1 2 3 4
Bar
te
nsi
le s
tre
ss [
MP
a]
Drift [%]
Bearing
Anchrage
EJ-T2-L15-S2

30/31
Bond and bearing contributions
0
100
200
300
400
500
600
0 100 200 300 400 500 600
Bar
be
arin
g o
r b
on
d [
MP
a]
Total bar stress [MPa]
Bearing
Bond
EJ-T1-L15-S1
0
100
200
300
400
500
600
0 100 200 300 400 500 600
Bar
be
arin
g o
r b
on
d [
MP
a]
Total bar stress [MPa]
Bearing
Bond
EJ-T1-L15-S1-T
A A’ Section
Plan
850
970
ldt = 15db
Cs = 1db
Failure Mode
Plan
Section
Cs=57
685
970
ldt=855
Beam yield
U type transverse
reinforcement
(B) U type transverse reinforcement of CCT Nodes test. Chun et al (2013).
(A) U type transverse reinforcement of this study
(A) (B)
Peak point of bond
Peak point of bond
(Unconfined)
(Confined) Both of specimens showed that the anchorage
strength approached the yield strength of headed bar.
Confined specimen had higher bond strength than
unconfined specimen.
The reason may be that transverse reinforcement can
suppress the splitting crack generated by the bond
stress and delay the bond stress loss near the yield
strength of headed bar.

31/31
Application TTC nodes – Cut off zone CCT nodes – Ext. B-C Joints
Failure mode
Splitting failure Side-face blowout failure
Main parameter • Development length • Transverse reinforcement
• Side cover thickness • Transverse reinforcement
Resisting components
Bond > Head bearing Bond < Head bearing
Unconfined (Cmin ≥ 2.0db) (Cmin ≥ 1.0db)
Confined (Ktr ≥ 1.2db) (Ktr ≥ 1.0db)
𝑙𝑑𝑡 = 0.40 𝑓𝑦
𝑓𝑐′ 𝑑𝑏
𝑙𝑑𝑡 = 0.23 𝑓𝑦
𝑓𝑐′ 𝑑𝑏
𝑙𝑑𝑡 = 0.20 𝑓𝑦
𝑓𝑐′ 𝑑𝑏
𝑙𝑑𝑡 = 0.17 𝑓𝑦
𝑓𝑐′ 𝑑𝑏

Thank you