Embed Size (px)
Citation preview

ORIGINAL PAPER
Experimental study on cracking damage characteristicsof a soil and rock mixture by UPV testing
Y. Wang • X. Li
Received: 24 January 2014 / Accepted: 4 September 2014 / Published online: 30 September 2014
� Springer-Verlag Berlin Heidelberg 2014
Abstract This paper investigates the ultrasonic pulse
velocity (UPV), mechanical properties and cracking char-
acteristics of a soil and rock mixture (SRM) with varying
rock percentages under uniaxial compression. Cylindrical
SRM specimens (50 mm diameter and 100 mm height)
with rock percentages of 20, 30, 40 and 50 % were pro-
duced to perform a series of uniaxial compressive strength
(UCS) tests. A P-wave transducer (500 kHz) and associ-
ated equipment were employed for all the testing to record
the ultrasonic parameters during the whole deformation
process. Test results indicates the UCS and UPV decreased
with increasing rock percentages for all specimens. The
failure mechanism of all specimens showed a splitting-
sliding mixed pattern; macro-cracks have a direction of 0�–10� parallel or sub-parallel to the normal stress. In addition,
an equation was proposed for the relationship between
UPV and crack width. Crack initiation stress was lower for
specimens with a high rock percentage. The crack initiation
stress level was about 0.2–0.5 times of peak-strength, and
the total width of cracks was about 2–5 mm at peak-
strength. Based on the width of cracks and UPV, the total
stress–strain curve was divided into three stages: the linear-
elastic stage; the damage initiation and stable development
stage; and the damage acceleration stage. Moreover, a
three-stage damage evolution equation and constitutive
model were established and compared with the testing data.
These results confirm that the UPV and mechanical
properties of SRMs are closely related to the rock per-
centage. In this regard, the UPV test can be suitably
exploited for determing the cracking evolution character-
istics for SRM.
Keywords Soil and rock mixture (SRM) � UPV testing �Mechanical properties � Cracking characteristics
Introduction
Soil and rock mixture (SRM) is a unique type of compli-
cated inhomogeneous geomaterial and widely encountered
in geotechnical engineering projects (Medley and Lindquist
1995; Goodman and Ahlgren 2000; Lindquist and Good-
man 1994). Ancient landslides, debris-flow and rock-filling
dams are usually comprised of SRM (Li et al. 2004; Chen
et al. 2003; Zhang et al. 2004). Also, with the development
of many kinds of large-scale engineering projects, the sta-
bility of an engineering geological body (such as a slope, a
foundation and adjoining rock in tunnels, etc.) are con-
trolled mostly by the mechanical properties of the SRM.
SRMs, as a special engineering geological body, consist of
many components such as stiff rock blocks, comparatively
soft soils or particles, mixed blocks ranging in shape and
size. The individual components of SRMs usually have
different mechanical and physical properties and different
responses under internal and external loadings. Further-
more, complicated relationship exists among those indi-
vidual components. Thus, different mechanical behaviors
(such as cracking characteristics, translation of stress, stress
propagation, carrying capacity and fracture mode, etc.) exist
between SRMs and other homogeneous geomaterials. The
physical and mechanical properties of SRMs are more
complicated than those of general soil and rock mechanics
Y. Wang � X. Li (&)
Key Laboratory of Shale Gas and Geoengineering, Institute
of Geology and Geophysics, Chinese Academy of Science,
Beijing 100029, China
e-mail: [email protected]
Y. Wang
e-mail: [email protected]
123
Bull Eng Geol Environ (2015) 74:775–788
DOI 10.1007/s10064-014-0673-x

due to a complicated composition and interior structure. To
study the physical and mechanical properties of SRMs,
many scholars have conducted significant studies from
various points of view. For example, Lindquist (1994),
Lindquist and Goodman (1994) and Medley (2001) studied
the strength and deformation characteristics of SRMs via
multistage triaxial tests and field investigations; results
show that block percentages influence the mechanical
behavior of SRMs to a large extent. Also, block size dis-
tributions based on chords was proposed for studying the
field distribution characteristics of SRMs. You and Tang
(2002) and Xu and Hu (2007) studied the physical and
mechanical properties of SRMs and the influential factors
via in situ tests. Chen et al. (2005) studied spatial factors
such as the configuration, structure, environment and evo-
lution of SRMs in the context of the spatial effect of an
SRM slope on a large scale. Vallejo and Mawby (2000)
studied the influence of porosity on the shear strength of
granular material/clay mixtures. Xu et al. (2008) studied the
mesostructure and meso-mechanical properties of SRMs
using a digital image processing-based finite element
method. Unfortunately, one of the challenges in investi-
gating the mechanical properties and meso-structure is
inspection in real-time, which includes the detection of
damage zones, cracks and defects.
Ultrasonic techniques, known as being non-destructive
and easy to apply for in situ and laboratory conditions, are
commonly used for establishing the strength of concrete or
rock via UPV measurement (Kahraman 2001; Yasar and
Erdogan 2004). These techniques have been used for mea-
suring various concrete properties. The UPV method has also
been suggested as a being useful for estimating elastic and
strength properties of rock; some empirical correlations
between the UPV and compressive strength and modulus of
elasticity have been established (Saka and Uchikawa 1995).
UPV can also be used to evaluate the cracks or defects in a
material (Akkaya et al. 2003) or to analyze the concrete
microstructure development and strength (Ercikdi et al.
2014; Zhang et al. 2010; Su et al. 2012). When associated to
tomography, UPV can give good qualitative information on
the changes in a material properties as well as on its micro-
cracking state (Grinzato et al. 2004; Meglis et al. 2005).
Kahraman (2004) also studied the influence of the fracture
roughness of granites on UPV and provided a correlation
between both parameters. Although acoustic emission seems
to be more appropriate in the evaluation of the crack damage
in concrete, and especially in rocks under uniaxial com-
pression (Farmer 1983; Eberhardt et al. 1999), UPV appears
also to provide some indication about the damage in concrete
(Selleck et al. 1998; Mirmiram and Wei 2001).
The basic objective of the present work is to analyze and
develop the usefulness of UPV testing for exploring the
mechanical properties and crack evolution in an SRM
specimen, and also to establish a damage evolution equa-
tion and constitutive model. To the authors’ knowledge, so
far no experimental results have been published using UPV
testing to research the mechanical and deformation char-
acteristics of SRMs. The SRM specimens are cylinder-
shaped with a 50 mm diameter and a height of 100 mm
with varying rock percentage (20, 30, 40, and 50 %, mass
proportion). All three produced specimens were tested.
Correlation between UPV and UCS and width of cracks are
established. Based on the width of cracks and UPV, the
total stress–strain curve of SRMs was divided into three
stages. Moreover, the three-phase damage evolution
equation and constitutive model were established, and also
compared with the testing data.
Experimental procedure
The testing material
Remolded SRM specimens were used for the experiments.
The soil was obtained from a pit in the Chinese Academy
of Sciences Institute of Atmospheric Physics at a depth of
15 m. According to the geotechnical testing standard for
soil test method (GB/T 50123-1999), some physical and
mechanical parameters are shown in Table 1. The soil
contained a notable amount of strongly hydrophilic clay
minerals. The liquid limit of the hard clay can reach 40 %
and the plastic limit can reach 36 %; the plasticity index
was about 48 and the liquidity index was about 0.05–0.127.
These indices indicated this soil is a typical hard plastic
and high plastic clay. To identify the mineral composition
and mineral contentwe conducted Scanning Electron
Microscope (SEM) and X-Ray diffraction (XRD) tests on
the soil. By XRD analysis, the main clay minerals can be
identified. The clay minerals were identified from their
basal reflections determined from the XRD pattern (Moore
and Reynolds 1997) after: (1) air drying (normal); (2)
glycolation for 48 h; and (3) heating to 550�. The net peak
areas of the basal reflection of the clay minerals were
calculated above the background and considered as a
Table 1 Basic properties of soil material and rock blocks from geo-
technical testing
Property Soil Rock blocks
Natural density (g/cm3) 1.66 2.67
Dry density (g/cm3) 2.03 –
Water content ( %) 9.5 –
Relative density (GS) 2.72 –
Compressive strength wet (MPa) 0.56 2.727
Compressive strength dry (MPa) 50.65 100.74
776 Y. Wang, X. Li
123

proporation of each mineral in the mixture. The total
association was taken to by equal to 100 %. Then the rel-
ative properties were deduced semi-quantitatively. SEM
tests, as shown in Fig. 1, revealed rodlike and irregular
quartz grains with a grain size of about 0.01–0.03 mm and
probably surrounded by clay minerals. The XRD tests
revealed the main clay mineralogical composition, as
shown in Table 2. According to Table 2, it is clear that the
soil has a higher percentage of clay mineral, similar to
kaolinite, montmorillonite, and illite.
As stated above, the mechanics of SRMs are restricted
by the shape, distribution, size and percentage of rock
blocks. The rock percentage is the most important index
influencing the mechanical properties of SRMs (Lindquist
and Goodman 1994; Xu et al. 2008). As such, we ignored
the other factors influencing the mechanical properties. The
rock blocks used corundum balls with 8-mm diameters;
properties of the corundum material are listed in Table 1.
Specimen preparation
A total of 60 SRM specimens were prepared for UPV
testing. A compact test was used to produce the specimen
(Donaghe and Torrey 1994). According to the relationship
between the density and the compaction number, the
optimal hammer count was determined to be 20. During the
preparation of SRM specimens, an extra amount of free
water was added to the mixture; the optimal water content
was determined by compaction test to be 9.5 %. The rock
blocks used for specimen preparation and SRM specimens
with different percentages after air-drying are shown in
Fig. 2.
The required amount of rock blocks and soil material for
each specimen (Table 3) were mixed and homogenized in a
mixer. Then, the mixtures were poured into cast iron cyl-
inders 50 mm in diameter by 100 mm in height. The
compaction apparatus was used to compact the mixture
with 20 counts with three layers. The specimens were then
sealed with plastic warp and allowed to air-dry.
Experimental system
The testing system utilized for the UPV tests includes a
rigid loading device, an ultrasonic detector and an ultra-
sonic transducer (500 kHz) specially designed for this
test. The overall setup of the test system is shown in
Fig. 3.
During the test, axial load is applied by the hydraulic
jack, which can provide a maximum axial force of 100 kN.
The axial force is measured by stress sensors. The load
controller can record the axial force at every stress level.
The precision of the load controller is 0.01 kN. The axial
deformation is measured by a micrometer installed on the
platform; its precision is to 0.001 mm. The ultrasonic
detector is a common detector utilized in concrete detec-
tion (Model ZBL-520) which can provide a 1,000 V spike
for a duration of 20 ls to 20 ms for the transducer and also
can accurately record wave signals with good precision. In
the UPV testing, the sampling interval was 0.1 ls and the
arrival time of each pulse could be read to 0.05 ls; sam-
pling length is 1,024. Before the measurements, the mid-
dle-lateral surfaces of SRM specimens were made smooth
and flat. A thin film of Vaseline was applied to the surface
of the transducers (transmitter and receiver) in order to
Fig. 1 SEM images of: a soil sample #1; b soil sample #2
Table 2 Main mineralogical composition of a soil specimen obtained
from XRD
Mineral Soil specimen #1 (%) Soil specimen #2 (%)
Montmorillonite 61.52 60.28
Kaolinite 26.73 24.86
Illite 6.25 9.58
chlorite 3.5 3.28
Cracking damage characteristics of soil and rock 777
123

ensure ful contact and to eliminate the air pocket between
transducers and the specimen.
The specially designed transducer is the core compo-
nent determining the success of the test. The transducer
(500 kHz) is cylindrical and one end can be connected
with the plane at the middle part of specimens. The pie-
zoelectric ceramic disk is equipped in the cylindrical bore
(as shown in the top left corner of Fig. 3) and one end
connects with a tungsten powder mixture filler and spring,
the other end connects with a boss button. The tungsten
powder mixture filler can make the piezoelectric ceramic
disk move forward and emit signals. A thread cover and a
shim are used to constrain the boss button and the spring
makes the head of the boss button extend 1 mm from the
center bore of the shim once no pressure is applied. When
the transducer is subjected to pressure, the boss button
moves backward by compressing the spring and the
pressure can be afforded by the shim. During the tests, the
transducer was fixed using a rubber strip, enabling the
piezoelectric ceramic disk can to be in close contact with
the specimen during the tests.
Testing procedure
All devices were installed as shown in Fig. 3 and were
checked to ensure that they were working normally. The
UPV testing method employed was the ultrasonic trans-
mission method (through-transmission method). Uniaxial
compressive strength tests for the specimens were carried
out at the speed of 0.1 kN/step. Complete information
regarding the stress value, displacement value and ultra-
sonic parameters were recorded. Every three specimens of
varying rock percentages were tested.
As is known, the first cycle wave is stable and renewable
under the same transducer and same contact between
transducers and specimens. The first cycle wave is scarcely
contaminated by other waves arriving late and is easy to
identify. Therefore, the first cycle wave was selected as the
initial wave. The waveforms collected by the receiving
transducer consist of an initial transmitted pulse, followed
by later reflections at various interfaces, such as the rock–
soil interfaces, and the transducers and the specimen. Due
to absorption attenuation, scattering attenuation and diffu-
sion attenuation into an ultrasonic wave, the received
ultrasonic frequency was reduced to some extent. Figure 4a
shows the received waveform of sample SRM20-1 before
loading by ultrasonic detector. The initial wave was
selected to obtain the travel time t at each loading step
(Fig. 4b). After measuring the path length L the velocities
were calculated as UPV = L/t.
Research idea
SRMs are characterized by complex ingredients and an
anomalistic structure distribution. Failure characteristics of
SRMs are complicated under internal or external loadings.
Different mechanical properties exist among soils and
rocks. Determining the level of failure may be difficult and
unreliable without using complicated methods and proce-
dures, such as in situ experiments, indoor experiments,
numerical simulation and so on (Lindquist and Goodman
1994; Goodman and Ahlgren 2000; You and Tang 2002; Li
et al. 2004; Xu and Hu 2007). Sometimes special proce-
dures and methods have to be designed, tried and then
applied to the element under consideration. Such methods
are usually slow and costly.
However, UPV testing as a useful and reliable non-
destructive tool for assessing the mechanical characteristics
of rock and concrete material demonstrates a strong
advantage (Su et al. 2012; Grinzato et al. 2004). The
Fig. 2 Specimens with UPV testing. a Rock blocks in the specimens; b specimens after air-drying
Table 3 The required amount of blocks and soil for each specimen
Rock
percentage (%)
Dry soil
(g)
Dry soil and
water (g)
Block mass
(g)
Ball
no.
20 337.4751 371.2226 364.4731 110
30 303.5799 333.9379 327.8663 170
40 267.7268 294.4995 289.1449 240
50 229.7410 252.7151 248.1203 300
778 Y. Wang, X. Li
123

method present here is a technique that can be applied to
structurally cracked elements in order to explore the
cracking characteristics of SRMs using UPV testing.
Due to the elastic mismatch between a soil matrix and
rock blocks, soil and blocks are considerd to be in a weak
cementation state. Under loading, differential deformation
occurs at the interface between the rock blocks and soil,
which causes differential sliding, moving and rotation of
the rock blocks. As such, the local concentration of stress
causes tensile damage around the rock/soil interface.
Afterwards, a series of non-linear behavior appears,
including crack initiation, propagation and coalescence and
movement of blocks.
The research idea is to measure the velocity through the
SRM specimens under uniaxial compressive test in real-
time. When cracks appear in the specimen, it is obvious
Fig. 3 Testing system (1. Upper cross beam; 2. Rigid column; 3.
Platform; 4. Guide bar; 5. Pedestal; 6. Transmission line; 7. Force
sensor; 8. Load controller; 9. Hydraulic jack; 10. Micrometer gauge;
11. Rigid cushion; 12. SRM specimen; 13. Rubber strip; 14.
Transmitter; 15. Receiver; 16. Ultrasonic detector)
Fig. 4 Received wave form for sample SRM20-1 in its initial state (a) and the principle to obtain UPV (b)
Cracking damage characteristics of soil and rock 779
123
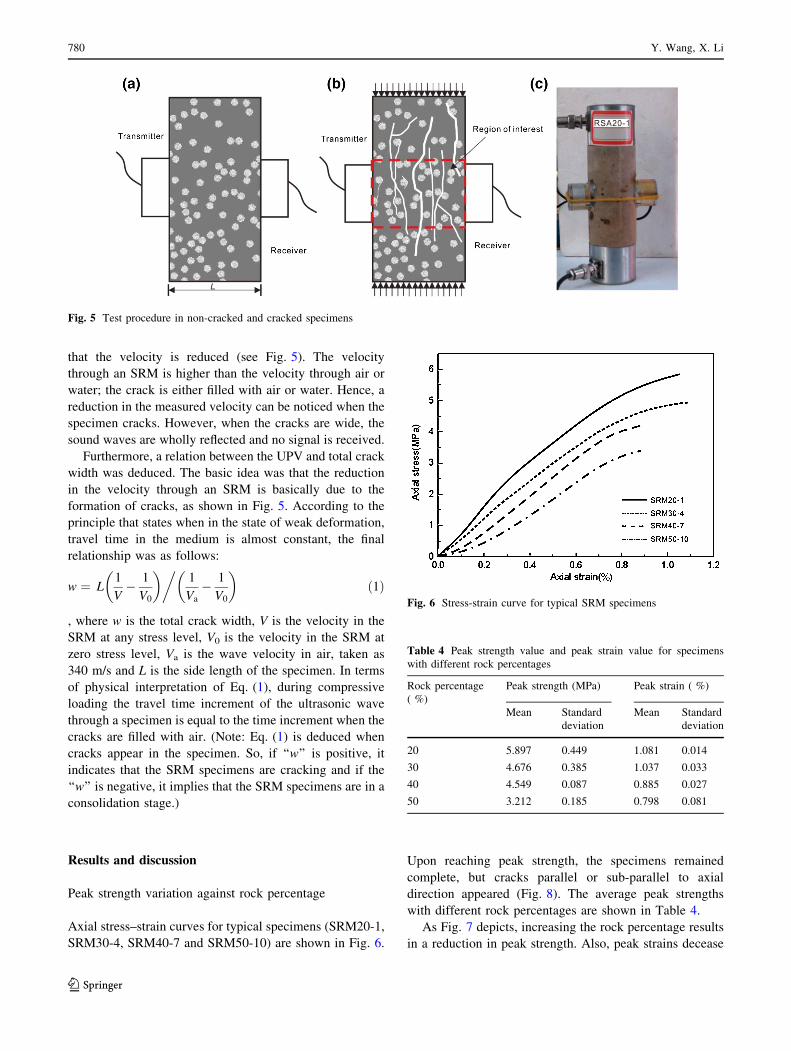
that the velocity is reduced (see Fig. 5). The velocity
through an SRM is higher than the velocity through air or
water; the crack is either filled with air or water. Hence, a
reduction in the measured velocity can be noticed when the
specimen cracks. However, when the cracks are wide, the
sound waves are wholly reflected and no signal is received.
Furthermore, a relation between the UPV and total crack
width was deduced. The basic idea was that the reduction
in the velocity through an SRM is basically due to the
formation of cracks, as shown in Fig. 5. According to the
principle that states when in the state of weak deformation,
travel time in the medium is almost constant, the final
relationship was as follows:
w ¼ L1
V� 1
V0
� ��1
Va
� 1
V0
� �ð1Þ
, where w is the total crack width, V is the velocity in the
SRM at any stress level, V0 is the velocity in the SRM at
zero stress level, Va is the wave velocity in air, taken as
340 m/s and L is the side length of the specimen. In terms
of physical interpretation of Eq. (1), during compressive
loading the travel time increment of the ultrasonic wave
through a specimen is equal to the time increment when the
cracks are filled with air. (Note: Eq. (1) is deduced when
cracks appear in the specimen. So, if ‘‘w’’ is positive, it
indicates that the SRM specimens are cracking and if the
‘‘w’’ is negative, it implies that the SRM specimens are in a
consolidation stage.)
Results and discussion
Peak strength variation against rock percentage
Axial stress–strain curves for typical specimens (SRM20-1,
SRM30-4, SRM40-7 and SRM50-10) are shown in Fig. 6.
Upon reaching peak strength, the specimens remained
complete, but cracks parallel or sub-parallel to axial
direction appeared (Fig. 8). The average peak strengths
with different rock percentages are shown in Table 4.
As Fig. 7 depicts, increasing the rock percentage results
in a reduction in peak strength. Also, peak strains decease
Fig. 5 Test procedure in non-cracked and cracked specimens
Fig. 6 Stress-strain curve for typical SRM specimens
Table 4 Peak strength value and peak strain value for specimens
with different rock percentages
Rock percentage
( %)
Peak strength (MPa) Peak strain ( %)
Mean Standard
deviation
Mean Standard
deviation
20 5.897 0.449 1.081 0.014
30 4.676 0.385 1.037 0.033
40 4.549 0.087 0.885 0.027
50 3.212 0.185 0.798 0.081
780 Y. Wang, X. Li
123
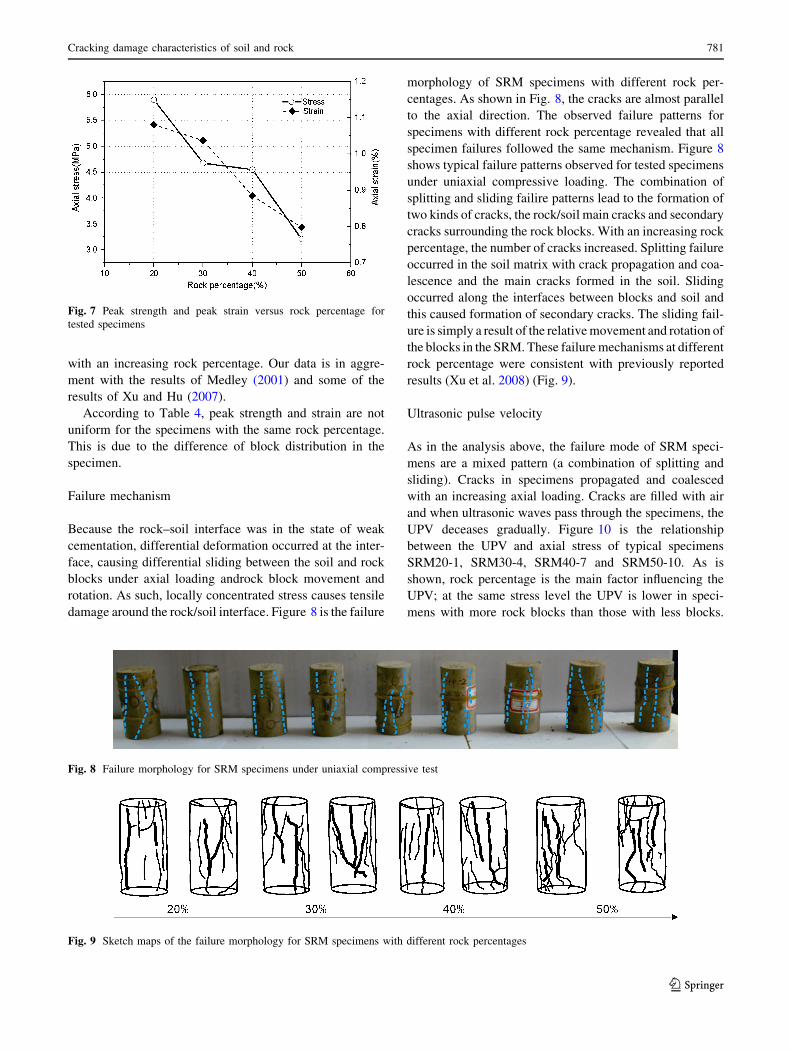
with an increasing rock percentage. Our data is in aggre-
ment with the results of Medley (2001) and some of the
results of Xu and Hu (2007).
According to Table 4, peak strength and strain are not
uniform for the specimens with the same rock percentage.
This is due to the difference of block distribution in the
specimen.
Failure mechanism
Because the rock–soil interface was in the state of weak
cementation, differential deformation occurred at the inter-
face, causing differential sliding between the soil and rock
blocks under axial loading androck block movement and
rotation. As such, locally concentrated stress causes tensile
damage around the rock/soil interface. Figure 8 is the failure
morphology of SRM specimens with different rock per-
centages. As shown in Fig. 8, the cracks are almost parallel
to the axial direction. The observed failure patterns for
specimens with different rock percentage revealed that all
specimen failures followed the same mechanism. Figure 8
shows typical failure patterns observed for tested specimens
under uniaxial compressive loading. The combination of
splitting and sliding failire patterns lead to the formation of
two kinds of cracks, the rock/soil main cracks and secondary
cracks surrounding the rock blocks. With an increasing rock
percentage, the number of cracks increased. Splitting failure
occurred in the soil matrix with crack propagation and coa-
lescence and the main cracks formed in the soil. Sliding
occurred along the interfaces between blocks and soil and
this caused formation of secondary cracks. The sliding fail-
ure is simply a result of the relative movement and rotation of
the blocks in the SRM. These failure mechanisms at different
rock percentage were consistent with previously reported
results (Xu et al. 2008) (Fig. 9).
Ultrasonic pulse velocity
As in the analysis above, the failure mode of SRM speci-
mens are a mixed pattern (a combination of splitting and
sliding). Cracks in specimens propagated and coalesced
with an increasing axial loading. Cracks are filled with air
and when ultrasonic waves pass through the specimens, the
UPV deceases gradually. Figure 10 is the relationship
between the UPV and axial stress of typical specimens
SRM20-1, SRM30-4, SRM40-7 and SRM50-10. As is
shown, rock percentage is the main factor influencing the
UPV; at the same stress level the UPV is lower in speci-
mens with more rock blocks than those with less blocks.
Fig. 7 Peak strength and peak strain versus rock percentage for
tested specimens
Fig. 8 Failure morphology for SRM specimens under uniaxial compressive test
Fig. 9 Sketch maps of the failure morphology for SRM specimens with different rock percentages
Cracking damage characteristics of soil and rock 781
123
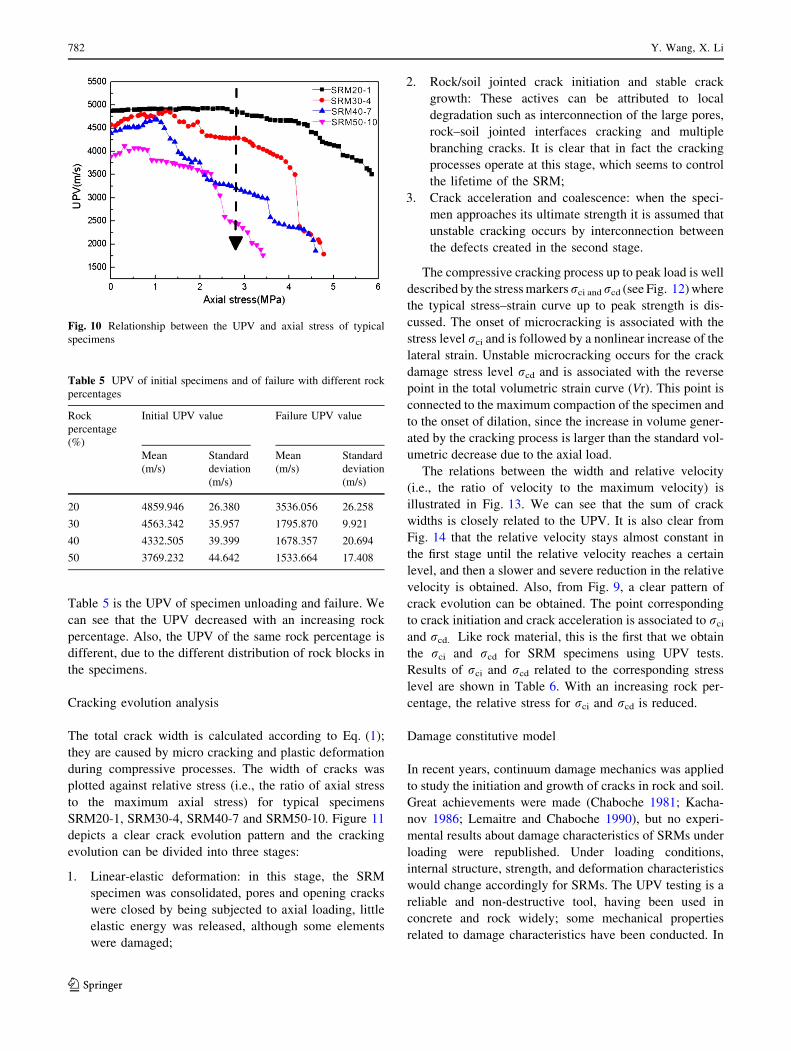
Table 5 is the UPV of specimen unloading and failure. We
can see that the UPV decreased with an increasing rock
percentage. Also, the UPV of the same rock percentage is
different, due to the different distribution of rock blocks in
the specimens.
Cracking evolution analysis
The total crack width is calculated according to Eq. (1);
they are caused by micro cracking and plastic deformation
during compressive processes. The width of cracks was
plotted against relative stress (i.e., the ratio of axial stress
to the maximum axial stress) for typical specimens
SRM20-1, SRM30-4, SRM40-7 and SRM50-10. Figure 11
depicts a clear crack evolution pattern and the cracking
evolution can be divided into three stages:
1. Linear-elastic deformation: in this stage, the SRM
specimen was consolidated, pores and opening cracks
were closed by being subjected to axial loading, little
elastic energy was released, although some elements
were damaged;
2. Rock/soil jointed crack initiation and stable crack
growth: These actives can be attributed to local
degradation such as interconnection of the large pores,
rock–soil jointed interfaces cracking and multiple
branching cracks. It is clear that in fact the cracking
processes operate at this stage, which seems to control
the lifetime of the SRM;
3. Crack acceleration and coalescence: when the speci-
men approaches its ultimate strength it is assumed that
unstable cracking occurs by interconnection between
the defects created in the second stage.
The compressive cracking process up to peak load is well
described by the stress markersrci andrcd (see Fig. 12) where
the typical stress–strain curve up to peak strength is dis-
cussed. The onset of microcracking is associated with the
stress level rci and is followed by a nonlinear increase of the
lateral strain. Unstable microcracking occurs for the crack
damage stress level rcd and is associated with the reverse
point in the total volumetric strain curve (Vr). This point is
connected to the maximum compaction of the specimen and
to the onset of dilation, since the increase in volume gener-
ated by the cracking process is larger than the standard vol-
umetric decrease due to the axial load.
The relations between the width and relative velocity
(i.e., the ratio of velocity to the maximum velocity) is
illustrated in Fig. 13. We can see that the sum of crack
widths is closely related to the UPV. It is also clear from
Fig. 14 that the relative velocity stays almost constant in
the first stage until the relative velocity reaches a certain
level, and then a slower and severe reduction in the relative
velocity is obtained. Also, from Fig. 9, a clear pattern of
crack evolution can be obtained. The point corresponding
to crack initiation and crack acceleration is associated to rci
and rcd. Like rock material, this is the first that we obtain
the rci and rcd for SRM specimens using UPV tests.
Results of rci and rcd related to the corresponding stress
level are shown in Table 6. With an increasing rock per-
centage, the relative stress for rci and rcd is reduced.
Damage constitutive model
In recent years, continuum damage mechanics was applied
to study the initiation and growth of cracks in rock and soil.
Great achievements were made (Chaboche 1981; Kacha-
nov 1986; Lemaitre and Chaboche 1990), but no experi-
mental results about damage characteristics of SRMs under
loading were republished. Under loading conditions,
internal structure, strength, and deformation characteristics
would change accordingly for SRMs. The UPV testing is a
reliable and non-destructive tool, having been used in
concrete and rock widely; some mechanical properties
related to damage characteristics have been conducted. In
Fig. 10 Relationship between the UPV and axial stress of typical
specimens
Table 5 UPV of initial specimens and of failure with different rock
percentages
Rock
percentage
(%)
Initial UPV value Failure UPV value
Mean
(m/s)
Standard
deviation
(m/s)
Mean
(m/s)
Standard
deviation
(m/s)
20 4859.946 26.380 3536.056 26.258
30 4563.342 35.957 1795.870 9.921
40 4332.505 39.399 1678.357 20.694
50 3769.232 44.642 1533.664 17.408
782 Y. Wang, X. Li
123

Fig. 11 Typical plots of total crack width against relative stress for specimens SRM20-1, SRM30-4, SRM40-7 and SRM50-10
Fig. 12 Typical stress–strain curve for rocks under uniaxial com-
pressive loading up to peak stress
Fig. 13 A typical plot showing the relationship between crack width
and relative velocity
Cracking damage characteristics of soil and rock 783
123

this paper we try to establish a damage evolution equation
and a constitutive model for SRM specimens by UPV
testing.
According to classic damage mechanics, the damage
factor can be defined as follows:
D ¼ 1 � ~E=E ð2Þ
where D is the damage factor, ~E and E are the undamaged
and damaged Elastic modulus.
When the longitudinal ultrasonic wave with a certain
frequency goes through the SRM specimens, the velocity v,
bulk density q, modulus of elastic E and Poisson’s ratio mexist in the following relationship:
V2 ¼ E
q1 � m
1 þ mð Þ 1 � 2mð Þ ð3Þ
If the change of the Poisson’s ratio and density are
ignored during loading for damage specimens,
~V2 ¼~E
_
q1 � m
1 þ mð Þ 1 � 2mð Þ ð4Þ
Combining with Eqs. (2) and (3), the damage factor
defined using UPV, is as follows:
D ¼ 1 � ~V2=V2 ð5Þ
where V and ~V are the velocity of undamaged and damaged
material. This definition is based on the assumption that the
initial damage factor of SRM is 0, and the damage factor is
1 when the specimen has failed. Because the changes in
ultrasonic wave velocity can comprehensively reflect
changes in the internal structure of SRM specimens, phe-
nomenon such as crack initiation, propagation and coa-
lescence can be reflected by UPV. So the damage factor
definition based on UPV could completely reflect the
macro mechanics of micro cracks for SRM specimens.
There will be a problem when the damage factor
obtained by Eq. (5); in linear-elastic stage the UPV can
increase due to the compaction effect. In this case, D\ 0;
however, this is impossible, so we specify it as D = 0.
Figure 15 is the relationship between relative stress and
the damage factor for typical specimens SRM20-1, SRM30-
4, SRM40-7 and SRM50-10. As shown in the figure, during
uniaxial compression, the damage factors for the specimens
are not uniform. The damage factor changed suddenly at
some stress level and this phenomenon is consistent with the
relationship of crack width and relative stress.
Fig. 14 Relationship between relative velocity and relative stress
during loading
Table 6 The relative stress for rci, rcd and the total crack widths at
peak strength
Specimen
No.
Crack initiation
stress level (%)
Crack damage
stress level (%)
Crack width at
peak strength
(mm)
SRM20-1 0.463 0.768 3.054
SRM20-3 0.481 0.794 2.756
SRM20-4 0.443 0.773 2.934
SRM30-1 0.427 0.736 3.728
SRM30-2 0.403 0.772 4.651
SRM30-4 0.435 0.865 4.897
SRM40-5 0.337 0.653 4.327
SRM40-6 0.332 0.711 4.003
SRM40-7 0.261 0.763 4.605
SRM50-8 0.231 0.682 4.751
SRM50-9 0.226 0.645 4.855
SRM50-10 0.208 0.717 4.343
Fig. 15 Typical plots of the damage factor against relative stress for
typical specimens SRM20-1, SRM30-4, SRM40-7 and SRM50-10
784 Y. Wang, X. Li
123

Research of the damage mechanics of rock and soil is a
fundamental and frontier issue in geotechnical engineering.
Experimental research of damage evolution characteristics
and constitutive relations are reliable and practical condi-
tions to ensure numerical simulation results in geotechnical
engineering. The pre-existing damage constitutive model
can be divided into two major categories. One is the con-
tinuous function and the other is the piecewise describing
function. Because information regarding crack evolution
can be reflected via UPV, the damage evolution of an SRM
is a nonlinear process; it is difficult to describe the cracking
evolution with a continuous function. So, the piecewise
describing function is a good choice. Based on results of
the stress–strain curve and the crack evolution character-
istics above, the pre-peak stress–strain curve can be divided
into a quasi linear stage, a stable damage evolution stage
and a damage acceleration stage.
Taking SRM30-4 as an example, the three-phase dam-
age constitutive model is shown in Fig. 16. According to
the damage factor defined by the UPV, the damage factors
during the uniaxial compressive test were calculated.
Firstly, the relationship of D and e1 was analyzed using the
method of least squares regression. Linear (y = ax ? b),
logarithmic (y = a ? lnx), exponential (y = aex) and
power (y = axb) curve fitting approximations were exe-
cuted and the approximation equations that have the
highest correlation coefficient were determined for the
damage evolution equations. Then, based on the equivalent
strain principle, the relevant constitutive model is expres-
sed as
r1 ¼ E 1 � Dð Þe1 ð6Þ
1. Quasi linear phase
The constitutive model is linear. The constitutive model
in this stage by linear curve fitting approximation is
expressed as:
r1 ¼ 0:0808 þ 5:59408e1 0\r1\2:44076 MPa ð7Þ
The corresponding damage evolution equation is:
D ¼ 0 ð8Þ
Fig. 16 Three-stage damage evolution equation and constitutive model for SRM30-4
Cracking damage characteristics of soil and rock 785
123
2. Damage initiation and stable development stage:
r1 ¼ E 1 � Dð Þe1 ð9Þ
According to the damage factor defined by UPV, the
damage factor during uniaxial compressive tests is calculated,
and the relationship between D and e1 is analyzed using least
squares regression. Linear (y = ax ? b), logarithmic
(y = a ? lnx), exponential (y = aex) and power (y = axb)
curve fitting approximations were executed and the approxi-
mation equations that have the highest correlation coefficient
were determined for the damage evolution equation:
D ¼ 2:4852expð�1:43659=e1Þ ð10Þ
Combination with equations (9) and (10), the constitu-
tive model of SRM30-4 in this stage is expressed as:
r1 ¼ E 1 � 2:4852 exp �1:43695=e1ð Þð Þe12:44076\r1\4:13248 MPa
ð11Þ
3. Damage acceleration stage:
In this stage, the relationship of D and e1 was analyzed
using least squares regression. The damage evolution
equation was as follows:
D ¼ 0:7895e0:46391 ð12Þ
Combination with Eqs. (5) and (6), the constitutive
model of SRM30-4 in this stage is expressed as:
r1 ¼ E 1 � 0:7895e0:46391
� �e1 4:13248\r1\4:77452MPa
ð13Þ
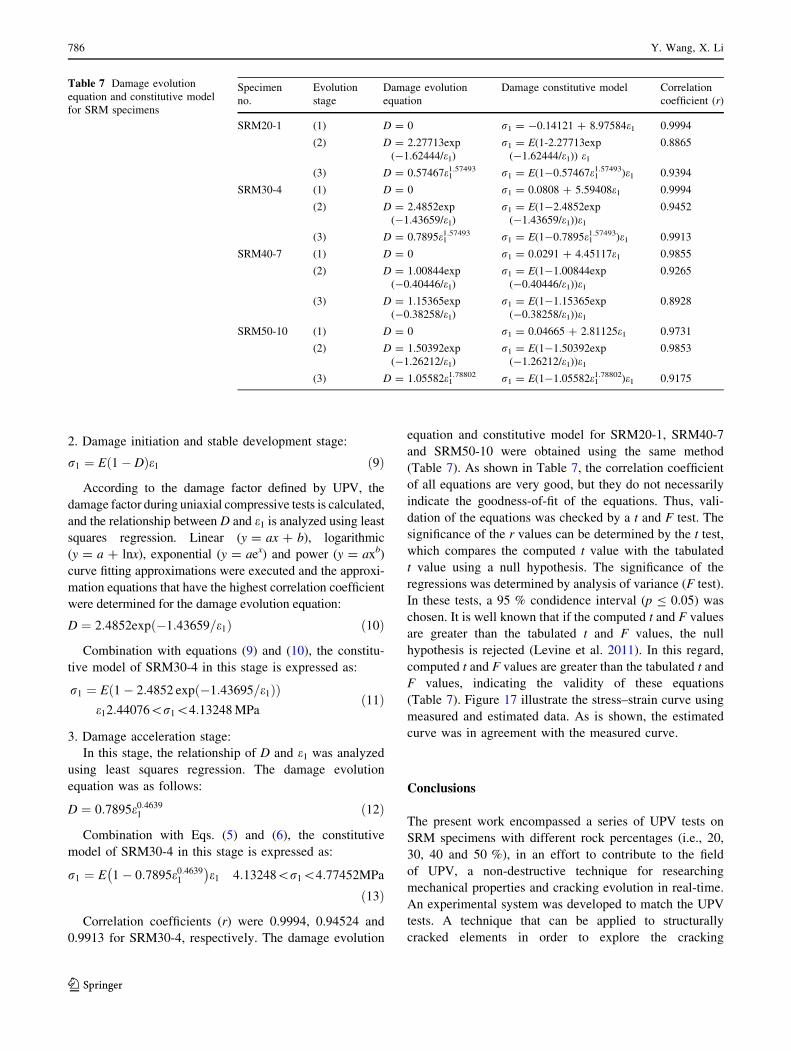
Correlation coefficients (r) were 0.9994, 0.94524 and
0.9913 for SRM30-4, respectively. The damage evolution
equation and constitutive model for SRM20-1, SRM40-7
and SRM50-10 were obtained using the same method
(Table 7). As shown in Table 7, the correlation coefficient
of all equations are very good, but they do not necessarily
indicate the goodness-of-fit of the equations. Thus, vali-
dation of the equations was checked by a t and F test. The
significance of the r values can be determined by the t test,
which compares the computed t value with the tabulated
t value using a null hypothesis. The significance of the
regressions was determined by analysis of variance (F test).
In these tests, a 95 % condidence interval (p B 0.05) was
chosen. It is well known that if the computed t and F values
are greater than the tabulated t and F values, the null
hypothesis is rejected (Levine et al. 2011). In this regard,
computed t and F values are greater than the tabulated t and
F values, indicating the validity of these equations
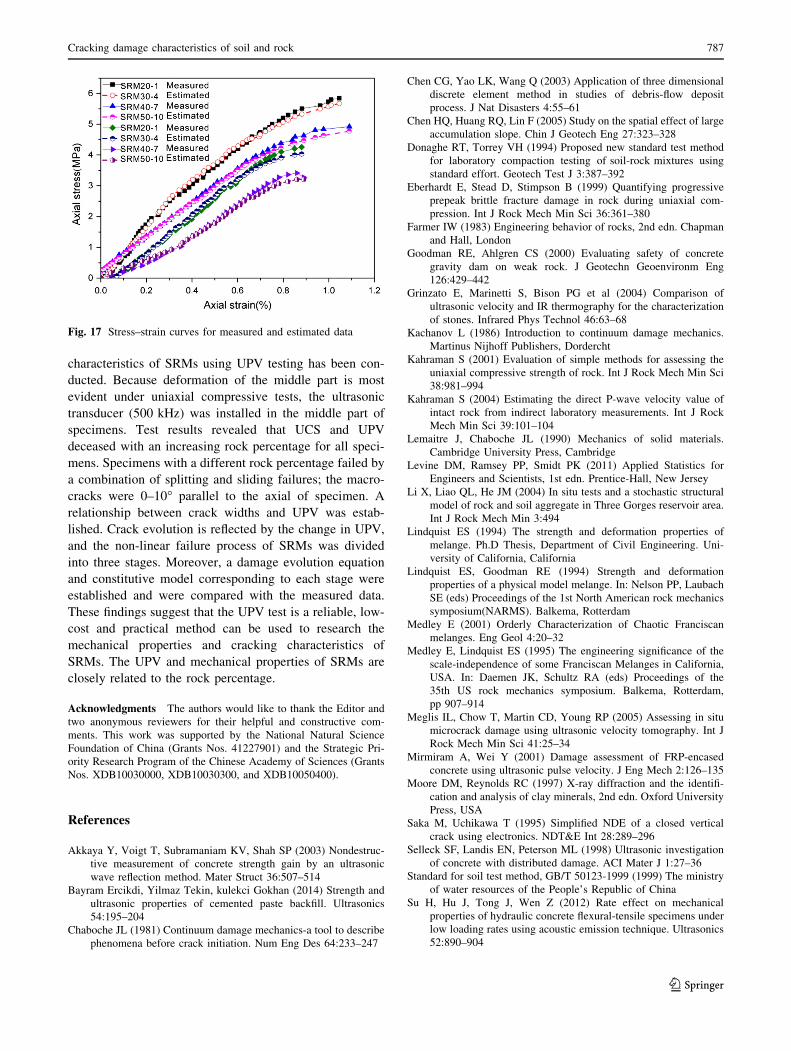
(Table 7). Figure 17 illustrate the stress–strain curve using
measured and estimated data. As is shown, the estimated
curve was in agreement with the measured curve.
Conclusions
The present work encompassed a series of UPV tests on
SRM specimens with different rock percentages (i.e., 20,
30, 40 and 50 %), in an effort to contribute to the field
of UPV, a non-destructive technique for researching
mechanical properties and cracking evolution in real-time.
An experimental system was developed to match the UPV
tests. A technique that can be applied to structurally
cracked elements in order to explore the cracking
Table 7 Damage evolution
equation and constitutive model
for SRM specimens
Specimen
no.
Evolution
stage
Damage evolution
equation
Damage constitutive model Correlation
coefficient (r)
SRM20-1 (1) D = 0 r1 = -0.14121 ? 8.97584e1 0.9994
(2) D = 2.27713exp
(-1.62444/e1)
r1 = E(1-2.27713exp
(-1.62444/e1)) e1
0.8865
(3) D = 0.57467e11.57493 r1 = E(1-0.57467e1
1.57493)e1 0.9394
SRM30-4 (1) D = 0 r1 = 0.0808 ? 5.59408e1 0.9994
(2) D = 2.4852exp
(-1.43659/e1)
r1 = E(1-2.4852exp
(-1.43659/e1))e1
0.9452
(3) D = 0.7895e11.57493 r1 = E(1-0.7895e1
1.57493)e1 0.9913
SRM40-7 (1) D = 0 r1 = 0.0291 ? 4.45117e1 0.9855
(2) D = 1.00844exp
(-0.40446/e1)
r1 = E(1-1.00844exp
(-0.40446/e1))e1
0.9265
(3) D = 1.15365exp
(-0.38258/e1)
r1 = E(1-1.15365exp
(-0.38258/e1))e1
0.8928
SRM50-10 (1) D = 0 r1 = 0.04665 ? 2.81125e1 0.9731
(2) D = 1.50392exp
(-1.26212/e1)
r1 = E(1-1.50392exp
(-1.26212/e1))e1
0.9853
(3) D = 1.05582e11.78802 r1 = E(1-1.05582e1
1.78802)e1 0.9175
786 Y. Wang, X. Li
123
characteristics of SRMs using UPV testing has been con-
ducted. Because deformation of the middle part is most
evident under uniaxial compressive tests, the ultrasonic
transducer (500 kHz) was installed in the middle part of
specimens. Test results revealed that UCS and UPV
deceased with an increasing rock percentage for all speci-
mens. Specimens with a different rock percentage failed by
a combination of splitting and sliding failures; the macro-
cracks were 0–10� parallel to the axial of specimen. A
relationship between crack widths and UPV was estab-
lished. Crack evolution is reflected by the change in UPV,
and the non-linear failure process of SRMs was divided
into three stages. Moreover, a damage evolution equation
and constitutive model corresponding to each stage were
established and were compared with the measured data.
These findings suggest that the UPV test is a reliable, low-
cost and practical method can be used to research the
mechanical properties and cracking characteristics of
SRMs. The UPV and mechanical properties of SRMs are
closely related to the rock percentage.
Acknowledgments The authors would like to thank the Editor and
two anonymous reviewers for their helpful and constructive com-
ments. This work was supported by the National Natural Science
Foundation of China (Grants Nos. 41227901) and the Strategic Pri-
ority Research Program of the Chinese Academy of Sciences (Grants
Nos. XDB10030000, XDB10030300, and XDB10050400).
References
Akkaya Y, Voigt T, Subramaniam KV, Shah SP (2003) Nondestruc-
tive measurement of concrete strength gain by an ultrasonic
wave reflection method. Mater Struct 36:507–514
Bayram Ercikdi, Yilmaz Tekin, kulekci Gokhan (2014) Strength and
ultrasonic properties of cemented paste backfill. Ultrasonics
54:195–204
Chaboche JL (1981) Continuum damage mechanics-a tool to describe
phenomena before crack initiation. Num Eng Des 64:233–247
Chen CG, Yao LK, Wang Q (2003) Application of three dimensional
discrete element method in studies of debris-flow deposit
process. J Nat Disasters 4:55–61
Chen HQ, Huang RQ, Lin F (2005) Study on the spatial effect of large
accumulation slope. Chin J Geotech Eng 27:323–328
Donaghe RT, Torrey VH (1994) Proposed new standard test method
for laboratory compaction testing of soil-rock mixtures using
standard effort. Geotech Test J 3:387–392
Eberhardt E, Stead D, Stimpson B (1999) Quantifying progressive
prepeak brittle fracture damage in rock during uniaxial com-
pression. Int J Rock Mech Min Sci 36:361–380
Farmer IW (1983) Engineering behavior of rocks, 2nd edn. Chapman
and Hall, London
Goodman RE, Ahlgren CS (2000) Evaluating safety of concrete
gravity dam on weak rock. J Geotechn Geoenvironm Eng
126:429–442
Grinzato E, Marinetti S, Bison PG et al (2004) Comparison of
ultrasonic velocity and IR thermography for the characterization
of stones. Infrared Phys Technol 46:63–68
Kachanov L (1986) Introduction to continuum damage mechanics.
Martinus Nijhoff Publishers, Dordercht
Kahraman S (2001) Evaluation of simple methods for assessing the
uniaxial compressive strength of rock. Int J Rock Mech Min Sci
38:981–994
Kahraman S (2004) Estimating the direct P-wave velocity value of
intact rock from indirect laboratory measurements. Int J Rock
Mech Min Sci 39:101–104
Lemaitre J, Chaboche JL (1990) Mechanics of solid materials.
Cambridge University Press, Cambridge
Levine DM, Ramsey PP, Smidt PK (2011) Applied Statistics for
Engineers and Scientists, 1st edn. Prentice-Hall, New Jersey
Li X, Liao QL, He JM (2004) In situ tests and a stochastic structural
model of rock and soil aggregate in Three Gorges reservoir area.
Int J Rock Mech Min 3:494
Lindquist ES (1994) The strength and deformation properties of
melange. Ph.D Thesis, Department of Civil Engineering. Uni-
versity of California, California
Lindquist ES, Goodman RE (1994) Strength and deformation
properties of a physical model melange. In: Nelson PP, Laubach
SE (eds) Proceedings of the 1st North American rock mechanics
symposium(NARMS). Balkema, Rotterdam
Medley E (2001) Orderly Characterization of Chaotic Franciscan
melanges. Eng Geol 4:20–32
Medley E, Lindquist ES (1995) The engineering significance of the
scale-independence of some Franciscan Melanges in California,
USA. In: Daemen JK, Schultz RA (eds) Proceedings of the
35th US rock mechanics symposium. Balkema, Rotterdam,
pp 907–914
Meglis IL, Chow T, Martin CD, Young RP (2005) Assessing in situ
microcrack damage using ultrasonic velocity tomography. Int J
Rock Mech Min Sci 41:25–34
Mirmiram A, Wei Y (2001) Damage assessment of FRP-encased
concrete using ultrasonic pulse velocity. J Eng Mech 2:126–135
Moore DM, Reynolds RC (1997) X-ray diffraction and the identifi-
cation and analysis of clay minerals, 2nd edn. Oxford University
Press, USA
Saka M, Uchikawa T (1995) Simplified NDE of a closed vertical
crack using electronics. NDT&E Int 28:289–296
Selleck SF, Landis EN, Peterson ML (1998) Ultrasonic investigation
of concrete with distributed damage. ACI Mater J 1:27–36
Standard for soil test method, GB/T 50123-1999 (1999) The ministry
of water resources of the People’s Republic of China
Su H, Hu J, Tong J, Wen Z (2012) Rate effect on mechanical
properties of hydraulic concrete flexural-tensile specimens under
low loading rates using acoustic emission technique. Ultrasonics
52:890–904
Fig. 17 Stress–strain curves for measured and estimated data
Cracking damage characteristics of soil and rock 787
123

Vallejo LE, Mawby R (2000) Porosity influence on the shear strength
of granular material-clay mixtures. Eng Geol 58:125–136
Xu WJ, Hu RL (2007) Some geomechanical properties of soil–rock
mixtures in the Hutiao Gorge area, China. Geotech 3:255–264
Xu WJ, Yue ZQ, Hu RL (2008) Study on the mesostructure and
mesomechanical characteristics of the soil–rock mixture using
digital image processing based finite element method. Int J Rock
Mech Min 45:749–762
Yasar E, Erdogan Y (2004) Correlating sound velocity with density,
compressive strength and Young modulus of carbonate rocks. Int
J Rock Mech Min Sci 41:871–875
You XH, Tang JS (2002) Research on horizontal push-shear in situ
test of soil and rock-mixture. Chin J Rock Mech Eng
10:1537–1540
Zhang Y, Wang JG, Shi RF (2004) Time-dependent deformation in
high concrete-faced rockfill dam and separation between
concrete face slab and cushion layer. Comput and Geotech
7:559–573
Zhang X, Yang F, Yang J (2010) Experimental study on anisotropic
strength properties of sandstone. Electron J Geotech Eng
15:1325–1335
788 Y. Wang, X. Li
123

本文献由“学霸图书馆-文献云下载”收集自网络,仅供学习交流使用。
学霸图书馆(www.xuebalib.com)是一个“整合众多图书馆数据库资源,
提供一站式文献检索和下载服务”的24 小时在线不限IP
图书馆。
图书馆致力于便利、促进学习与科研,提供最强文献下载服务。
图书馆导航:
图书馆首页 文献云下载 图书馆入口 外文数据库大全 疑难文献辅助工具