Embed Size (px)
Citation preview

Experimental study of phase-step broadening byfringing fields in a three-electrode liquid-crystal cell
Eldad Bahat-Treidel, Boris Apter, and Uzi Efron
The fringing-field broadening of a phase-step profile and its dependence on the thickness of a liquid-crystal (LC) cell were studied in a simple, three-electrode LC cell structure consisting of two lateralelectrodes biased with a differential voltage and a third, grounded, electrode placed on the oppositesubstrate. The results were compared both with an approximate analytical model developed earlier fora fringe-field-broadening kernel and with computer simulations. Good agreement between the experi-ment and the theoretical as well as the simulation results is shown. © 2005 Optical Society of America
OCIS codes: 230.2090, 230.3720, 160.3710, 160.1190.
1. Introduction
Liquid crystals (LCs) provide efficient electro-opticalmodulator technology for a variety of applicationssuch as displays and beam steering. The low drivingvoltage requirements coupled with a simple, low-costfabrication process have made this technology aprime candidate for large array modulators. The mil-lisecond response time is adequate for a wide varietyof optical modulation applications including displays,beam steering, and, more recently, optical switchingand interconnects. One important drawback that lim-its the performance of patterned LC modulators suchas LC displays and beam steering devices is the effectof the lateral or fringing fields between laterally ad-jacent electrodes, leading in general to the broaden-ing of the intensity or phase profile of the modulatedoptical beams.1–4 This in turn leads to degraded per-formance in either the resolution of the display deviceor the diffraction efficiency of the beam deflector.
The broadening of the phase profile in a LC deviceby the fringing field effect was studied in the late1970s by analysis of a relatively simple steplike pro-file generated by a two-electrode structure.1 More-recent studies have addressed the broadening of
blazed phase profiles including a novel method topermit the imaging of the phase profile,5 the devel-opment of an empirical model to study imperfectionsin the phase profile,6 and the dependence of the de-vice’s performance on the LC alignment,7 which alsoaddressed the dependence of the diffraction efficiencyon the LC’s thickness. Investigations of fringing fieldeffects in LC-based binary grating devices were alsoreported.8,9 Although the effects of fringing fieldbroadening on the resolution of LC display devicesincluding its inverse linear dependence on the LCcell’s thickness have been known to the LC displayscommunity,4,10 no systematic study of the depen-dence of the fringing field broadening effect on theLC’s thickness was undertaken until recently.11,12 Fi-nally, the presence of fringing fields in LC displaydevices was recently employed to improve the angu-lar response of LCD’s.10,13 In a recent computer sim-ulation study of the fringing field’s effect on theperformance of blazed grating devices it was shownthat this effect can be cast in the form of a broadeningconvolution kernel whose width is proportional to theLC cell’s thickness.11 In a subsequent study the struc-ture of this fringing-field-based broadening kernelwas analytically expressed in terms of the dielectricconstants as well as the thickness of the LC cell.12
This new analytical model has been supported bycomputer simulation results based on the rigoroussolution of the LC director distribution and its effecton the incident optical beam. Clearly, however, anexperimental confirmation of this analytical modelmust also be provided as an essential part of such astudy. To this end we studied a simplified, three-electrode LC cell structure consisting of two lateralelectrodes with a differential voltage corresponding
E. Bahat-Treidel is with the Ben Gurion University, Beer-Sheva84105, Israel. B. Apter is with the Holon Institute of Technology,Holon 58102, Israel. U. Efron ([email protected]) is with theDepartment of Electro-Optic Engineering, Ben Gurion University,Beer-Sheva 84105, Israel, and the Holon Institute of Technology,Holon 58102, Israel.
Received 6 August 2004; revised manuscript received 3 Decem-ber 2004; accepted 13 December 2004.
0003-6935/05/152989-07$15.00/0© 2005 Optical Society of America
20 May 2005 � Vol. 44, No. 15 � APPLIED OPTICS 2989
to the required phase-step change of 2� and a third,grounded, electrode placed on the opposite substrate.Although this simple structure is markedly differentfrom a complex, multielectrode blazed grating, theresults of the analytical model indicate that, withinthe limitations of the approximation involved, thebroadening kernel is independent of the specificphase profile (i.e., the blazed grating) and dependsonly on the LC’s dielectric constants as well as itsthickness. Thus it is expected that the fringing fieldbroadening in this simplified three-electrode struc-ture will exhibit the same physical dependence on theLC cell’s parameters as those of the blazed grating.The phase-profile broadening results measured inthis structure can therefore be used in validating theanalytical model.
The experimental setup based on this three-electrode configuration is detailed in Section 2 below.The various cell gap thicknesses used correspond tomaximum phase retardations of 2�–10� (for a com-plete horizontal-to-vertical LC director reorienta-tion). We used this arrangement to study thedependence of the transition region’s width for a 2�phase step on the LC cell’s gap width. The effect ofphase-profile broadening that was due to the fringingfield effect was subsequently analyzed and comparedwith both rigorous simulation results and the approx-imate analytical model,12 which expresses the broad-ening of the phase profile explicitly in terms of the cellgap’s width and the LC’s dielectric constants. Follow-ing a description of the experimental setup and pro-cedure, the experimental results are given in Section3. Sections 4 and 5 briefly summarize the theoreticalmodel and the computer simulation procedures usedfor comparing the theory with the experimental re-sults. A description and analysis of this comparisonare given in Section 6. Finally, the conclusions of thisstudy are presented in Section 7.
2. Experimental Setup and Procedure
A 2.54 cm � 2.54 cm indium tin oxide-coated glasswas laser patterned to form an �4��m-wide gap,splitting the front side ITO electrode into two equal-sized parts, isolated from each other. A second2.54 cm � 2.54 cm ITO-coated glass was used as acommon counterelectrode for the LC cell device. Bothsubstrates were polyimide coated and mechanicallyrubbed to generate initial parallel homogenous align-ment of the LC director, whose orientation was per-pendicular to the patterned slit. We used 12��mMylar stripes as the cell gap spacers. The assembledLC cell was clamped and filled with a Merck MLC6621-100 LC mixture whose physical parameters arelisted in Table 1.
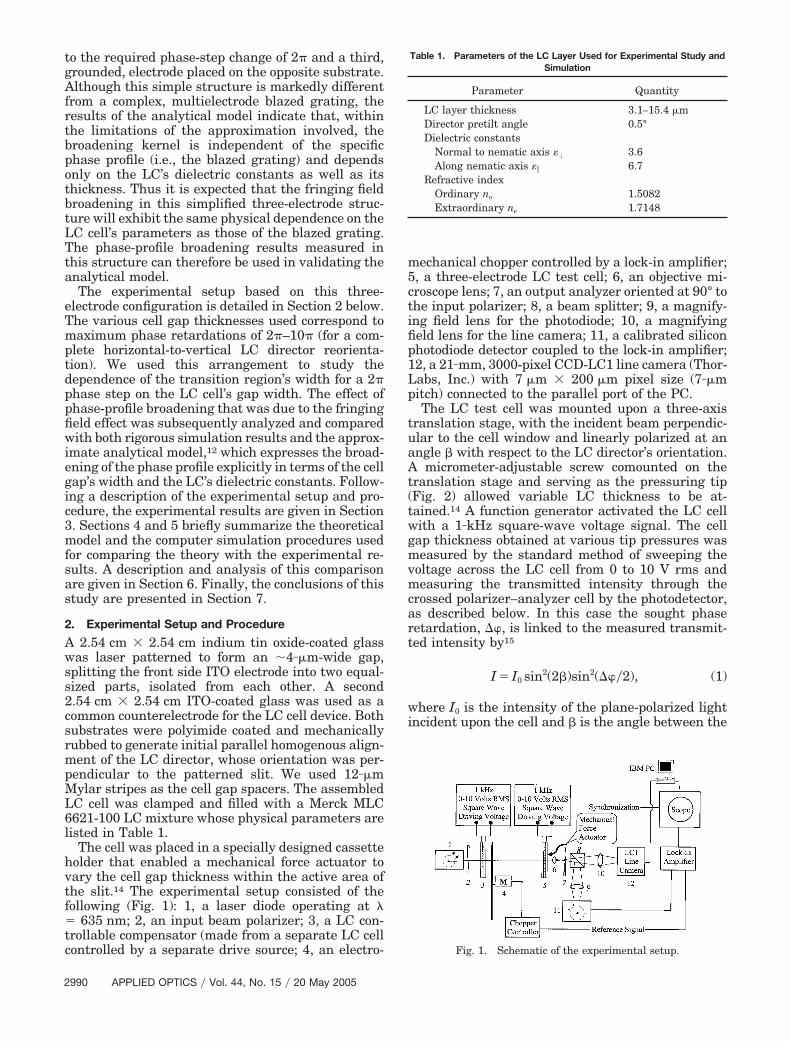
The cell was placed in a specially designed cassetteholder that enabled a mechanical force actuator tovary the cell gap thickness within the active area ofthe slit.14 The experimental setup consisted of thefollowing (Fig. 1): 1, a laser diode operating at �� 635 nm; 2, an input beam polarizer; 3, a LC con-trollable compensator (made from a separate LC cellcontrolled by a separate drive source; 4, an electro-
mechanical chopper controlled by a lock-in amplifier;5, a three-electrode LC test cell; 6, an objective mi-croscope lens; 7, an output analyzer oriented at 90° tothe input polarizer; 8, a beam splitter; 9, a magnify-ing field lens for the photodiode; 10, a magnifyingfield lens for the line camera; 11, a calibrated siliconphotodiode detector coupled to the lock-in amplifier;12, a 21�mm, 3000-pixel CCD-LC1 line camera (Thor-Labs, Inc.) with 7 �m � 200 �m pixel size (7��mpitch) connected to the parallel port of the PC.
The LC test cell was mounted upon a three-axistranslation stage, with the incident beam perpendic-ular to the cell window and linearly polarized at anangle � with respect to the LC director’s orientation.A micrometer-adjustable screw comounted on thetranslation stage and serving as the pressuring tip(Fig. 2) allowed variable LC thickness to be at-tained.14 A function generator activated the LC cellwith a 1�kHz square-wave voltage signal. The cellgap thickness obtained at various tip pressures wasmeasured by the standard method of sweeping thevoltage across the LC cell from 0 to 10 V rms andmeasuring the transmitted intensity through thecrossed polarizer–analyzer cell by the photodetector,as described below. In this case the sought phaseretardation, ��, is linked to the measured transmit-ted intensity by15
I � I0 sin2(2)sin2(���2), (1)
where I0 is the intensity of the plane-polarized lightincident upon the cell and � is the angle between the
Table 1. Parameters of the LC Layer Used for Experimental Study andSimulation
Parameter Quantity
LC layer thickness 3.1–15.4 �mDirector pretilt angle 0.5°Dielectric constants
Normal to nematic axis � 3.6Along nematic axis � 6.7
Refractive indexOrdinary no 1.5082Extraordinary ne 1.7148
Fig. 1. Schematic of the experimental setup.
2990 APPLIED OPTICS � Vol. 44, No. 15 � 20 May 2005

polarization vector of the incident ray and the initialorientation of the LC director. The latter was kept at � 45° in our experiment, for maximum amplitudemodulation. By fully sweeping the LC voltage from 0V to the maximum level of �10 V, one can estimatethe maximum phase retardation ��max attainable bythe cell by using Eq. (1).15 Assuming a negligiblysmall pretilt angle, cell gap d can then be estimatedfrom
��max(d) � 2�d�nmax��, (2)
where �nmax � ne � no; ne and no are the extraordi-nary and ordinary refractive indices of the LC, re-spectively; and � is the wavelength used �� �635 nm�. Figure 3 shows the results of the transmit-ted intensity versus LC rms voltage as the latter isswept from 0 to 10 V rms for a 6.1��m-thick, 4�phase-retardation-equivalent cell gap. A similar ex-perimental method for measuring the phase retarda-tion of a homogeneous LC cell was published earlierby Wu et al.16
Using this procedure, we then adjusted the cell
gap, using the pressure tip, to attain the desiredphase-retardation level in integer multiples of �. Fol-lowing the LC cell gap adjustment to the desiredretardation level of an integer multiple of �, a 1�kHzsquare-wave signal with a rms voltage amplitudeyielding 2� phase-retardation increments for thespecified cell-gap width was applied between the twolateral electrodes. The voltage levels required for gen-erating the 2� phase increments were determined byvisual observation of light transmission (one com-plete cycle) through the driven lateral electrode partof the cell under crossed polarizers. The CCD linecamera imaged the pattern of the light intensitytransmitted through the LC cell and the crossed an-alyzer. The camera data were fed to a personal com-puter for subsequent analysis.
3. Experimental Results
The experimental data set generated by the line cam-era contained 3000 spatially sampled points of thelight-intensity distribution following transmissionthrough the LC device with a lateral magnification of340�. The light-intensity distribution transmittedfrom the cell under crossed polarizers for several cell-gap thicknesses that correspond to maximum phaseretardations ranging from 2� to 10� is shown in Fig.4(a). The distribution is taken along the horizontalaxis perpendicular to the interelectrode slit. The rel-ative phase retardation, ���x, d� � ��max�d� � 2�,
Fig. 2. Schematic of the test cell.
Fig. 3. Experimentally recorded intensities for a 6.1��m-thick(4� phase retardation) LC cell. The LC voltage is proportional tothe time elapsed as indicated on the horizontal axis (5 s�division,representing 1-V increments). The top, wedgelike signal shows theanalog voltage as recorded by the scope.
Fig. 4. (a) Experimental normalized transmission along thethree-electrode test cell with cell-gap thicknesses of 3.1, 7.7, 10.8,and 15.4 �m, corresponding to maximum phase retardations of 2�,5�, 7�, and 10�. (b) Experimental 2� rad retardation profile alongthe three-electrode test cell with cell-gap thicknesses of 3.1, 7.7,10.8, and 15.4 �m, corresponding to maximum phase retardationsof 2�, 5�, 7�, and 10�. (c) Expanded inset of (b).
20 May 2005 � Vol. 44, No. 15 � APPLIED OPTICS 2991
derived from measured light intensity I by use of Eq.(1) above, is presented in Figs. 4(b) and 4(c). Theseresults show the broadening of the ideal phase-stepprofile for the various cell-gap widths caused by thepresence of the fringing field. The effect of increasingthe LC cell gap on the broadening of the phase-stepprofile can be clearly observed. We then used theseexperimental results to compare with those of theanalytical model to validate the model. For complete-ness these experimental results were also comparedwith computer simulations based on a rigorous solu-tion of minimization of the Frank–Oseen LC free-energy expression.17–19 These two models are brieflysummarized in Sections 4 and 5.
4. Analytical Model Calculations
The approximate analytical model used12 is based onthe solution of Laplace equation for the LC device.The model yields the explicit dependence of thephase-profile broadening in a patterned electrode LCcell on the physical parameters of the device, namely,the LC cell gap width and the dielectric constants.The model generates a broadening kernel of thephase profile owing to the fringing field effect, whichis proportional to the LC cell’s thickness. For a phase-step profile the broadening effect can be described asthe result of convolving the ideal step function profilewith a kernel k�x�. The approximate analytical ex-pression for broadening kernel k�x� is
k(x) � �1 exp(�2|x|� ), (3)
where the effective width of the broadening kernel isgiven approximately by
(d) � � �
3�d �
�2 � �
2
4���
dmin, (4)
where � � ne�ne � no���2no2� and dmin is the minimum
thickness of the LC layer required for generation of aphase shift of 2� rad given by
dmin � ���nmax. (5)
Now the three-electrode structure studied here isconsiderably simpler than the multielectrode blazedgrating structure that was the basis for the approx-imate analytical model given above. However, theresults of this analytical model indicate that, withinthe approximation limits, the broadening kernel isindependent of the specific phase profile involved(i.e., blazed grating) and depends only on the LC’sdielectric constants as well as its thickness. Thus it isexpected that the fringing field broadening in thesimplified, three-electrode structure studied here willexhibit the same physical dependence on the LC cell’sparameters as that of the blazed grating.
The results of the numerical convolution of a stepfunction with broadening kernel k�x� by use of thephysical properties of the nematic liquid crystal
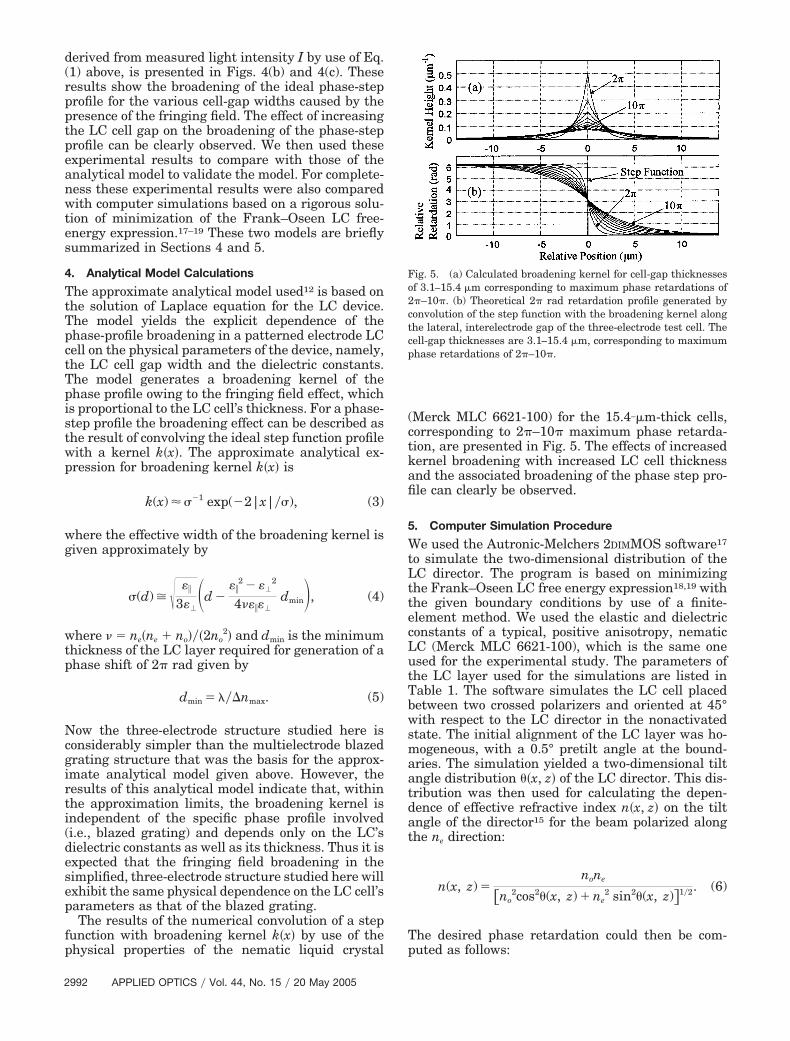
(Merck MLC 6621-100) for the 15.4��m-thick cells,corresponding to 2�–10� maximum phase retarda-tion, are presented in Fig. 5. The effects of increasedkernel broadening with increased LC cell thicknessand the associated broadening of the phase step pro-file can clearly be observed.
5. Computer Simulation Procedure
We used the Autronic-Melchers 2DIMMOS software17
to simulate the two-dimensional distribution of theLC director. The program is based on minimizingthe Frank–Oseen LC free energy expression18,19 withthe given boundary conditions by use of a finite-element method. We used the elastic and dielectricconstants of a typical, positive anisotropy, nematicLC (Merck MLC 6621-100), which is the same oneused for the experimental study. The parameters ofthe LC layer used for the simulations are listed inTable 1. The software simulates the LC cell placedbetween two crossed polarizers and oriented at 45°with respect to the LC director in the nonactivatedstate. The initial alignment of the LC layer was ho-mogeneous, with a 0.5° pretilt angle at the bound-aries. The simulation yielded a two-dimensional tiltangle distribution ��x, z� of the LC director. This dis-tribution was then used for calculating the depen-dence of effective refractive index n�x, z� on the tiltangle of the director15 for the beam polarized alongthe ne direction:
n(x, z) �none
�no2cos2�(x, z) � ne
2 sin2�(x, z)�1�2. (6)
The desired phase retardation could then be com-puted as follows:
Fig. 5. (a) Calculated broadening kernel for cell-gap thicknessesof 3.1–15.4 �m corresponding to maximum phase retardations of2�–10�. (b) Theoretical 2� rad retardation profile generated byconvolution of the step function with the broadening kernel alongthe lateral, interelectrode gap of the three-electrode test cell. Thecell-gap thicknesses are 3.1–15.4 �m, corresponding to maximumphase retardations of 2�–10�.
2992 APPLIED OPTICS � Vol. 44, No. 15 � 20 May 2005
��(x) �2�
� 0
d
�n(x, z) � no�dz. (7)
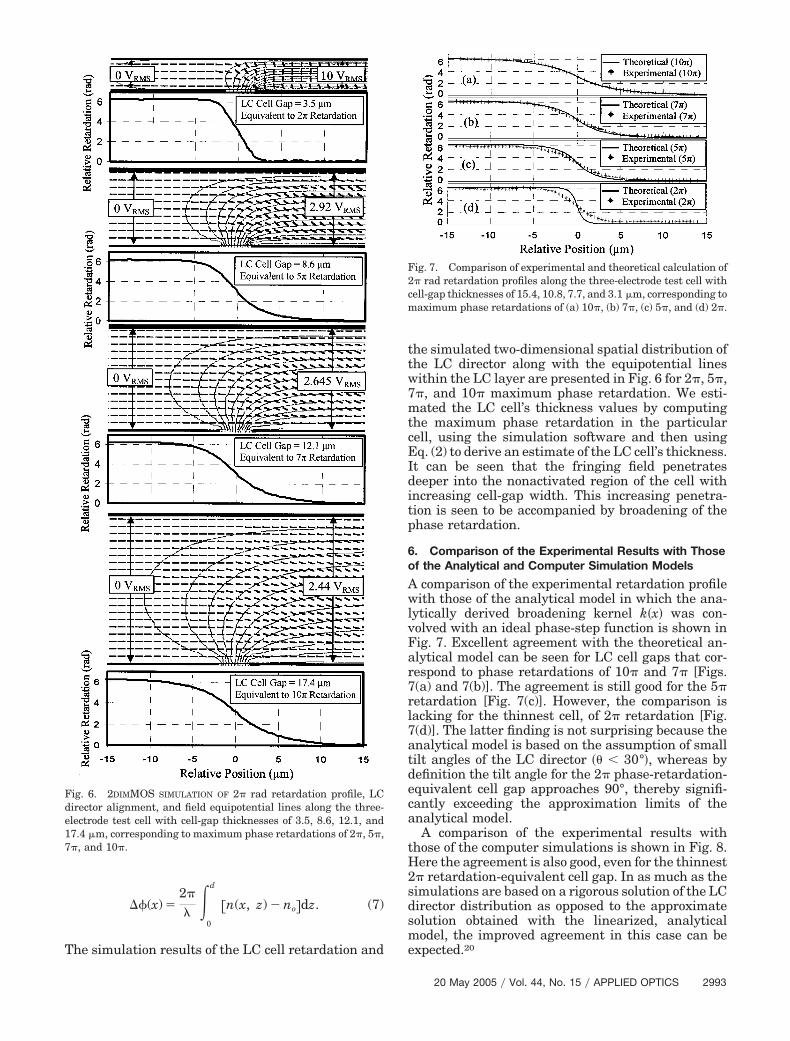
The simulation results of the LC cell retardation and
the simulated two-dimensional spatial distribution ofthe LC director along with the equipotential lineswithin the LC layer are presented in Fig. 6 for 2�, 5�,7�, and 10� maximum phase retardation. We esti-mated the LC cell’s thickness values by computingthe maximum phase retardation in the particularcell, using the simulation software and then usingEq. (2) to derive an estimate of the LC cell’s thickness.It can be seen that the fringing field penetratesdeeper into the nonactivated region of the cell withincreasing cell-gap width. This increasing penetra-tion is seen to be accompanied by broadening of thephase retardation.
6. Comparison of the Experimental Results with Thoseof the Analytical and Computer Simulation Models
A comparison of the experimental retardation profilewith those of the analytical model in which the ana-lytically derived broadening kernel k�x� was con-volved with an ideal phase-step function is shown inFig. 7. Excellent agreement with the theoretical an-alytical model can be seen for LC cell gaps that cor-respond to phase retardations of 10� and 7� [Figs.7(a) and 7(b)]. The agreement is still good for the 5�retardation [Fig. 7(c)]. However, the comparison islacking for the thinnest cell, of 2� retardation [Fig.7(d)]. The latter finding is not surprising because theanalytical model is based on the assumption of smalltilt angles of the LC director �� � 30°�, whereas bydefinition the tilt angle for the 2� phase-retardation-equivalent cell gap approaches 90°, thereby signifi-cantly exceeding the approximation limits of theanalytical model.
A comparison of the experimental results withthose of the computer simulations is shown in Fig. 8.Here the agreement is also good, even for the thinnest2� retardation-equivalent cell gap. In as much as thesimulations are based on a rigorous solution of the LCdirector distribution as opposed to the approximatesolution obtained with the linearized, analyticalmodel, the improved agreement in this case can beexpected.20
Fig. 6. 2DIMMOS SIMULATION OF 2� rad retardation profile, LCdirector alignment, and field equipotential lines along the three-electrode test cell with cell-gap thicknesses of 3.5, 8.6, 12.1, and17.4 �m, corresponding to maximum phase retardations of 2�, 5�,7�, and 10�.
Fig. 7. Comparison of experimental and theoretical calculation of2� rad retardation profiles along the three-electrode test cell withcell-gap thicknesses of 15.4, 10.8, 7.7, and 3.1 �m, corresponding tomaximum phase retardations of (a) 10�, (b) 7�, (c) 5�, and (d) 2�.
20 May 2005 � Vol. 44, No. 15 � APPLIED OPTICS 2993

Finally, to get a better sense of the goodness of thefit of the experimental with the theoretical results,we show in Fig. 9 the computed correlation, RAdj
2
between the experimental results and the analyticalmodel, between the experimental results and thecomputer simulations, and between the analyticalmodel and the computer simulation results. As can beseen, a correlation level higher than 0.97 is reachedfor the entire range of the cell gaps studied. Here,RAdj
2 is defined as21,22
RAdj2 � 1 � � (n � 1)
(n � k) (1 � R2)�, (8)
where n is the number of observations, k is the num-ber of independent variables, and R2 is the coefficientof determination for the two correlated data sets �Xi�and �Yi� commonly used for evaluation of the good-ness of the fit between the two sets.22 The goodness ofthe fit is the square of correlation coefficient r for
these two sets of data, defined by22
r � �R2 �n�
i�1
n
XiYi � �i�1
n
Xi�i�1
n
Yi
�n�i�1
n
Xi2 � �
i�1
n
Xi2�1�2�n�i�1
n
Yi2 � �
i�1
n
Yi2�1�2.
(9)
7. Conclusions
The fringing field broadening of a phase-step profileand its dependence on the thickness of a liquid-crystal cell were studied in a simple, three-electrodeLC cell structure consisting of two lateral electrodesbiased with a differential voltage and a third,grounded, electrode placed on the opposite substrate.The phase-profile broadening that showed an approx-imate linear dependence on the LC cell’s thicknesswas compared with that which resulted from an ap-proximate analytical model12 as well as those derivedfrom computer simulations11,17 based on a rigoroustreatment of the Frank–Oseen expression. Very goodagreement can be seen between the experimental re-sults and those of the approximate, analytical modelas well as with the computer simulation results.
These results thereby validate the main findings ofthe approximate analytical model,12 which explicitlyexpresses the fringing-field-broadening kernel of thephase profile in a patterned electrode LC cell in termsof the cell’s physical parameters. This close agree-ment between the experimental results of the partic-ular three-electrode structure studied and thegeneral kernel based on the approximate analyticalmodel further supports the conclusion that thefringing-field-based broadening kernel derivedwithin the approximate analytical model is indepen-dent of the phase profile employed and can beadopted for a variety of phase-retardation profilesgenerated by different geometries of multielectrodeLC structures. The excellent agreement between theanalytical model results for the three-electrode celland the computer simulation results lends furthersupport to the validity of the above approximate, an-alytical model.
This study was supported in part by the IsraelScience Foundation.
References and Notes1. V. G. Chigrinov, I. N. Kompanets and A. A. Vasiliev, “Behav-
iour of nematic liquid crystals in inhomogeneous electricfields,” Mol. Cryst. Liq. Cryst. 55, 193–207 (1979).
2. J. H. Kulick, J. M. Jarem, R. G. Lindquist, S. T. Kowel, M. W.Friends and T. M. Leslie, “Electrostatic and diffraction analy-sis of a liquid crystal device utilizing fringing fields: applica-tions to three-dimensional displays,” Appl. Opt. 34, 1901–1922(1995).
3. B. Verweire and R. Defever, “Limitation of resolution of LCOS-based projection displays by diffraction effects,” presented at19th International Display Research Conference (EuroDisplay’99), Berlin, Germany, 6–9 September 1999.
4. H. De Smet, J. Van Der Steen and A. Van Calster, “Microdis-plays with high pixel count,” Proc. Soc. Inf. Disp. 32, 968–971(2001).
Fig. 8. Comparison of experimental and simulations of 2� radretardation profiles along the three-electrode test cell with cell-gapthicknesses of 15.4, 10.8, 7.7, and 3.1 �m (experimental) and 17.4,12.1, 8.6, and 3.5 �m (simulation), corresponding to maximumphase retardations of 10�, 7�, 5�, and 2�, respectively.
Fig. 9. Correlation among the experimental and the computersimulation results and the theoretical model for effective phase-step function broadening as a function of the maximum cell-gapretardation d�n��: experiment versus theory (analytical model),experiment versus computer simulation, and computer simulationversus theory.
2994 APPLIED OPTICS � Vol. 44, No. 15 � 20 May 2005

5. L. J. Friedman, D. S. Hobbs, S. Lieberman, D. L. Corkum, H.Q. Nguyen, D. P. Resler, R. C. Sharp, and T. A. Dorschner,“Spatially resolved phase imaging of programmable liquidcrystal grating,” Appl. Opt. 35, 6236–6240 (1996).
6. V. G. Dominique, A. J. Carney, and E. A. Watson, “Measure-ment and modeling of the angular dispersion in liquid crystalbroadband beam steering devices,” Opt. Eng. 35, 3371–3379(1996).
7. T. Scharf, M. Bouvier, and R. Dändliker, “Multilevel nematicliquid crystal phase grating,” in Eighth International Confer-ence on Nonlinear Optics of Liquid and Photorefractive Crys-tals, G. V. Klimusheva and A. G. Iljin, eds., Proc. SPIE 4418,31–37 (2001).
8. M. Bouvier and T. Scharf, “Analysis of nematic liquid crystalbinary gratings with high spatial frequency,” Opt. Eng. 39,2129–2137 (2000).
9. J. H. Kulick, J. M. Jarem, R. G. Lindquist, S. T. Kowel, M. W.Friends, and T. M. Leslie, “Electrostatic and diffraction anal-ysis of a liquid crystal device utilizing fringing fields: applica-tions to three-dimensional displays,” Appl. Opt. 34, 1901–1922(1995).
10. M. Oh-e and K. Kondo, “Electro-optical characteristics andswitching behavior of the in-plane switching mode,” Appl.Phys. Lett. 67, 3895–3897 (1995).
11. B. Apter, U. Efron, and E. Bahat-Treidel, “On the fringing fieldeffect in liquid crystal beam steering devices,” Appl. Opt. 43,11–19 (2004).
12. U. Efron, B. Apter, and E. Bahat-Treidel, “Fringing field effectin liquid crystal beam steering devices: an approximate ana-lytical model,” J. Opt. Soc. Am. A 21, 1996–2008 (2004).
13. M. Oh-e, M. Yoneya, and K. Kondo, “Switching of negative andpositive dielectro-anisotropic liquid crystals by in-plane elec-tric fields,” J. Appl. Phys. 82, 528–535 (1997).
14. E. Bahat-Treidel, B. Apter, and U. Efron, “Simple method forcontrolled variation of liquid crystal cell thickness,” Opt. Eng.43, 3021–3025 (2004).
15. L. M. Blinov, Electro-Optical and Magneto-Optical Propertiesof Liquid Crystals (Wiley, New York, 1983), pp. 120–121.
16. S.-T. Wu, U. Efron, and L. D. Hess, “Birefringence measure-ments of liquid crystals,” Appl. Opt. 23, 3911–3915 (1984).
17. Autronics-Melcher’s 2DIMMOS software. http://www.autronic-melchers.com/index.htm.
18. F. C. Frank, “On the theory of liquid crystals,” Discuss. Fara-day Soc. 25, 19–28 (1958).
19. C. W. Oseen, “The theory of liquid crystals,” Trans. FaradaySoc. 29, 883–889 (1933).
20. Because the method of estimating the cell thickness based onthe computer simulation results differs from that used in spec-ifying cell thickness based on experimental data, the cell thick-nesses that correspond to the same integer multiple, N, of �radians of phase retardation �N � 2, 5, 7, 10� differ by approx-imately 12–13% in the two cases, as observed in the caption ofFig. 8. However, whereas the origin of this difference is unclearat this point, its effect on the results is marginal because of itssmall magnitude.
21. D. C. Montgomery and G. C. Runger, Applied Statistics andProbability for Engineers, 2nd ed. (Wiley, New York, 1999),Chap. 10.
22. E. Mansfield, Basic Statistics with Applications (Norton, NewYork, 1986), Chap. 11.
20 May 2005 � Vol. 44, No. 15 � APPLIED OPTICS 2995