Embed Size (px)
Citation preview
Experimental studies of
radiation-induced
dissolution of UO2
The effect of intrinsic solid phase
properties and external factors
Alexandre Barreiro Fidalgo
KTH Royal Institute of Technology
School of Chemical Science and Engineering
Department of Chemistry
Applied Physical Chemistry
SE-100 44 Stockholm, Sweden

Copyright © Alexandre Barreiro Fidalgo, 2017.
All rights reserved
Paper I © 2012 Elsevier B. V.
Paper II © 2013 Elsevier B. V.
Paper III © 2016 American Chemical Society
Paper IV © 2016 Elsevier B. V.
TRITA-CHE Report 2017:23
ISSN: 1654-1081
ISBN: 978-91-7729-343-9
Akademisk avhandling som med tillstånd av KTH i Stockholm framlägges
till offentlig granskning för avläggande av teknologie doktorsexamen
fredagen den 12 maj 2017 kl. 10.00 i Kollegiesalen, KTH, Brinellvägen 8,
Stockholm, Sverige. Avhandlingen försvaras på engelska. Opponent:
Prof. David W. Shoesmith, Western University, London, Ontario, Canada.

A mis padres, hermana y profesores,
sin los cuales este camino no hubiera sido posible


i
Abstract
Dissolution of the UO2 matrix is one of the potential routes for radionuclide
release in a future deep geological repository for spent nuclear fuel. This
doctoral thesis focuses on experimental studies of interfacial reactions of
relevance in radiation-induced dissolution of UO2 and is divided in two parts:
In the first part, we sought to explore the effects of solid phase composition:
The impact of surface stoichiometry on the reactivity of UO2 towards aqueous
radiolytic oxidants was studied. It was found that H2O2 reacts substantially
faster with stoichiometric UO2 than with hyperstoichiometric UO2. In
addition, the release of uranium from stoichiometric UO2 is lower than from
hyperstoichiometric UO2 in both H2O2 and radiation-induced dissolution
experiments. The behavior of stoichiometric powder changes with exposure
to H2O2, approaching the behavior of hyperstoichiometric UO2 with the
number of consecutive H2O2 additions.
The impact of Integral Burnable Absorbers doping (Gd, 3-8%wt.) on the
oxidative dissolution of UO2 in an aqueous system was investigated. A
significant decrease in uranium dissolution and higher stability towards H2O2
for (U,Gd)O2 pellets compared to standard UO2 was found.
In the second part, we sought to look at the effect of external factors:
The surface reactivity of H2 and O2 was studied to understand the overall
oxide surface reactivity of aqueous molecular radiolysis products. The results
showed that hydrogen-abstracting radicals and H2O2 are formed in these
systems. Identical experiments performed in aqueous systems containing
UO2 powder showed that the simultaneous presence of H2 and O2 enhances
the oxidative dissolution of UO2 compared to a system not containing H2.
The effect of groundwater components such as bentonite and sulfide on the
oxidative dissolution of UO2 was also explored. The presence of bentonite and
sulfide in water could either delay or prevent in part the release of uranium to
the environment. It is clearly shown that the Pd catalyzed H2 effect is more
powerful than the sulfide effect. The poisoning of Pd catalyst is not observed
under the conditions studied.
ii
Sammanfattning
Upplösning av UO2-matrisen är en av de potentiella vägarna för spridning av
radionuklider från ett framtida geologiskt djupförvar för använt kärnbränsle.
Denna doktorsavhandling fokuserar huvudsakligen på experimentella studier
av ytreaktioner av betydelse vid strålningsinducerad upplösning av UO2 och
är uppdelad i två delar:
I den första delen utforskade vi effekterna av den fasta fasens
sammansättning:
Inverkan av ytans stökiometri på reaktiviteten för UO2 mot oxidanter bildade
via vattenradiolys har undersökts. H2O2 reagerar betydligt snabbare med
stökiometrisk UO2 än med hyperstökiometrisk UO2. Dessutom löses mindre
uran upp från stökiometrisk UO2 än från hyperstökiometrisk UO2. Detta är
fallet både vid H2O2-inducerad upplösning och vid strålningsinducerad
upplösning. Beteendet för stökiometrisk UO2 förändras under oxidation och
efter flera H2O2-tillsatser ändras materialets reaktivitet till att bli identisk
med hyperstökiometrisk UO2.
Effekten av integrala brännbara neutron absorbatorer i bränslet (Gd, 3-8 %)
på oxidativ upplösning av UO2 i vatten har också studerats. Jämfört med ren
UO2 löser betydligt mindre uran upp sig från kutsar som innehåller Gd.
Reaktiviteten mot H2O2 är också betydligt lägre för Gd-dopad UO2.
I den andra delen utforskade vi effekten av externa faktorer:
Ytreaktiviteten för H2 och O2 har studerats med syfte att förstå hur
molekylära radiolysprodukter reagerar med oxidytor. Resultaten visar att H-
abstraherande radikaler och H2O2 bildas i sådana system. Samma typ av
försök utfördes med UO2-pulver. Dessa försök visade att oxidativ upplösning
av UO2 ökade i ett system som innehöll H2 och O2 jämfört med ett system
som enbart innehöll O2.
Effekterna av bentonit och sulfid på oxidativ upplösning av UO2 har också
undersökts. Både bentonit och sulfid inhiberar processen. Effekten av sulfid
är dock obetydlig jämfört med Pd-katalyserad reduktion med H2. Försöken
visar att sulfid inte förgiftar katalysatorn under de rådande experimentella
betingelserna.

iii
List of abbreviations
B.E.T. – Brunauer-Emmert-Teller
CANDU – CANada Deuterium Uranium
CLAB – Centralt mellanlager för använt kärnbränsle – Central Interim
Storage Facility
FIMA – Fissions per Initial Metal Atom
Gy - Gray
IBA – Integral Burnable Absorber
ICP-OES – Inductively Coupled Plasma – Optical Emission Spectroscopy
IRF – Instant Release Fraction
KBS – Kärnbränslesäkerhet (Nuclear Fuel Safety)
KSU – Kärnkraftsäkerhet och Utbildning (Nuclear Safety and Training)
SEM – Scanning Electron Microscopy
SIMFUEL – SIMulated spent nuclear FUEL
SNF – Spent Nuclear Fuel
tHM – ton of Heavy Metal
UV-Vis – Ultraviolet-Visible
XPS – X-ray Photoelectron Spectroscopy
XRD – X-Ray Diffraction

iv
List of appended papers
I. M. Yang, A. Barreiro Fidalgo, S. Nilsson, M. Jonsson.
Inhibition of radiation induced dissolution of UO2 by Sulfide-
A comparison with the Hydrogen effect. Journal of Nuclear
Materials, 434 (2013) 38-42.
II. A. Barreiro Fidalgo, S. Sundin, M. Jonsson. Effect of
bentonite on radiation induced dissolution of UO2 in an
aqueous system. Journal of Nuclear Materials, 447 (2014)
73-76.
III. A. Barreiro Fidalgo, B. Dahlgren, T. Brinck, M. Jonsson.
Surface Reactions of H2O2, H2 and O2 in Aqueous Systems
Containing ZrO2. The Journal of Physical Chemistry C, 120
(2016) 1609-1614.
IV. A. Barreiro Fidalgo, M. Jonsson. Can H2 enhance the
oxidative dissolution of UO2? Journal of Nuclear Materials,
477 (2016) 85-87
V. A. Barreiro Fidalgo, M. Jonsson. Radiation induced
dissolution of (U, Gd)O2 pellets in aqueous solution – A
comparison to standard UO2 pellets. Manuscript, to be
submitted
VI. A. Barreiro Fidalgo, Y. Kumagai, M. Jonsson. Impact of
stoichiometry on the reactivity of UO2 towards radiolytic
oxidants. Manuscript, to be submitted.
v
My contribution to the papers
I. Performed part of the experiments and contributed in the
data evaluation.
II. Planned and performed the major part of the experimental
work. Major part in writing.
III. Planned and performed the experimental work in the lab. I
wrote part of the manuscript.
IV. Planned and performed the experimental work. Major part in
writing.
V. Planned and performed the experimental work. Major part in
writing.
VI. Planned and performed the experimental work, except the
radiation-induced dissolution experiments. Major part in
writing.
vi
Table of Contents
Abstract ....................................................................................................... i
Sammanfattning ......................................................................................... ii
List of abbreviations .................................................................................. iii
List of appended papers ........................................................................... iv
My contribution to the papers .................................................................... v
1. Introduction ............................................................................................ 1
1.1 The Swedish solution: a brief history ............................................... 2
1.2 Deep geological repository in Sweden, the KBS-3 concept ............ 2
1.3 Safety assessment: Worst case scenario........................................ 4
1.4 Radiation chemistry ......................................................................... 4
1.5 Radiolysis of water ........................................................................... 6
1.6 Spent nuclear fuel ............................................................................ 9
1.7 Dissolution of UO2 ......................................................................... 11
1.7.1 Doping of UO2 with fission product analogous ....................... 14
1.7.2 Effect of solutes ...................................................................... 15
1.7.3 The H2 effect ........................................................................... 16
1.8 Scope of the thesis ........................................................................ 18
2. Experimental details ............................................................................ 19
2.1 Materials ........................................................................................ 19
2.2 Instrumentation .............................................................................. 20
2.2.1 Surface analysis ..................................................................... 20
2.2.2 Dissolution experiments.......................................................... 21
2.2.3 Additional equipment .............................................................. 22
2.3 Methodology .................................................................................. 22
2.3.1 H2O2-induced dissolution experiments ................................... 22
2.3.2 Radiation-induced dissolution experiments ............................ 23
vii
2.3.3 Autoclave experiments ........................................................... 24
2.3.4 Detection of hydroxyl radicals ................................................ 25
2.2.5 Reduction of hyperstoichiometric UO2 ................................... 26
3. Results and discussion ....................................................................... 27
3.1 The effect of intrinsic solid phase properties on the oxidative
dissolution of UO2 ................................................................................ 27
3.1.1 Surface stoichiometry ............................................................. 27
3.1.2 Integral Burnable Absorbers (IBA): (U, Gd)O2 fuel ................ 38
3.2 The effect of external factors on the oxidative dissolution of UO2 47
3.2.1 H2 / O2 .................................................................................... 47
3.2.2 Sulfide .................................................................................... 57
3.2.3 Bentonite ................................................................................ 62
4. Conclusions ......................................................................................... 68
5. Future work ......................................................................................... 69
6. Acknowledgments ............................................................................... 70
7. References .......................................................................................... 72

1. Introduction
1
1. Introduction
Nuclear power is widely depended upon around the world to produce a
significant amount of electricity. By the beginning of 2017, 31 countries
had in operation 440 commercial nuclear power reactors with over 390
GWe of capacity, which accounted for 11% of the world’s total electricity
production [1]. Particularly in Sweden, 3 nuclear power plants with a total
of 9 operating nuclear power reactors currently provide Swedish people
with about 35-40% of their total electricity [2]. Nuclear power serves a
continuous and reliable supply of energy, and it can be considered a clean
source, emitting low amounts of greenhouse gasses and thereby
contributing very little to the global warming of the planet. The fission of
one single fissile 235U atom releases about 200 MeV of energy, about a
million times more energy than if we compare it with chemical
combustion of fossil fuels. However, after two serious nuclear accidents
in the last decades - Chernobyl and Fukushima -, several countries have
restricted the construction of new power plants or even initiated
programs to shut down their nuclear reactors in the coming years.
Regardless of the future of nuclear energy, highly radioactive Spent
Nuclear Fuel (SNF) has already been produced and is the most
concerning and important drawback of this energy source. For this
reason, it must be managed in a safe and environmentally friendly way.
After its lifetime in a reactor, the SNF can either follow a “closed” or
“open” fuel cycle. In the first case, the spent fuel is reprocessed in order to
make new oxide fuel or mixed oxide fuel for recycling back into a reactor.
However, with the current generation of nuclear reactors, the fuel can
only be reprocessed once during its lifetime. In the open or once-through
fuel cycle, the spent fuel discharged is directly disposed with no further
use. Both cycles have their pros and cons, but eventually all forms of fuel
must be managed in a safe way.
For the time being, the most internationally accepted solution that is
considered as the safest and most viable option for the management of
high level waste is the deep geological repository. This solution is based
on the multiple barrier capacity of isolation and confinement of the
geological formations together with a disposal canister, provided that
they fulfill certain characteristics of stability and capacity of retention.

1. Introduction
2
Other considered solutions such as storage in icecaps, marine trenches,
seabed or even disposal into space, do not fulfill the requirements of
protection and safety, in addition to their questioned viability for
execution.
1.1 The Swedish solution: a brief history
After almost 40 years of assembling knowledge of the Swedish bedrock
and several years of more of specific geological, hydrological, ecological
and social studies, the Swedish Nuclear Fuel and Waste Management Co.
(SKB) selected Forsmark as a suitable site for the future spent fuel
repository in June 2009.
Two years later SKB applied for the permits to build a spent fuel
repository at Forsmark and an encapsulation facility for the copper
canisters at Oskarshamn. These applications are currently being reviewed
by the Swedish Radiation Safety Authority (SSM) and the Land and
Environment Court (Mark- och miljösdomstolen) in Stockholm and are
based on a scientifically supported safety assessment that includes more
than 30 years of research.
If the permit is issued, the construction of the site is planned to start in
the early 2020s and will take approximately ten years to be completed.
1.2 Deep geological repository in Sweden, the KBS-3
concept
After about five years of operation in a nuclear power plant, fuel is
considered SNF. Prior to deposition in a geological deep repository, the
SNF is stored at the nuclear power plant for one year, reducing its
radioactivity by 90%. It is subsequently transported to the Central
Interim Storage Facility (CLAB), where it is kept in pools which protects
against radiation and cools down the hot fuel. Today, over 6,500 tons of
SNF are stored in Sweden in CLAB [3]. In the interim storage, the
radioactivity of the spent nuclear fuel decreases by another 90%. By the

1. Introduction
3
time the SNF is supposed to be placed in the deep geological repository,
only 1% of the original radioactivity will remain.
In Sweden, nuclear fuel will be stored without being reprocessed
according to the KBS-3 model developed by SKB. This concept is based
on a multibarrier system (artificial and natural) between the SNF and the
biosphere; the fuel will be encapsulated in copper canisters that will be
sealed and placed about 500 m deep in a stable bedrock as shown in
Figure 1.1.
Figure 1.1: The KBS-3 method. Published with the permission of SKB AB.
i. Canister: A container 1 m in diameter and 5 m in length with a
thickness of 5 cm of copper with cast iron insert where the fuel
assemblies of SNF are placed for deposition. Each canister will weigh
about 25 tons once they are filled. The canisters are embedded in
compacted bentonite in vertical holes. The canister will provide corrosion
resistance and mechanical strength from movements in the surrounding
rock.
ii. Bentonite: A type of clay that will act as a buffer protecting the
canister from corrosion and minor movements in the bedrock.
1. Introduction
4
Furthermore, it will slow down any radioactive substances that might
escape to the biosphere in case of canister failure.
iii. Bedrock: A natural barrier which will provide isolation of the waste
from humans and the environment.
The objective of the barriers is to prevent the release of radioactive
materials to the environment and from human intrusion for
approximately 100,000 years, the time needed to reach natural levels of
radioactivity.
1.3 Safety assessment: Worst case scenario
Given the exceptionally long operational time span of a geological deep
repository - at least 100,000 years - the safety assessment requires very
precise knowledge of the behavior of all components under a variety of
deep geological conditions.
In the event of barrier failure, groundwater from the surroundings will
enter the canister, corroding the iron and producing iron oxides and H2,
and eventually also come in contact with the spent nuclear fuel. This is
considered as the most probable worst case scenario. Understanding the
mechanism and kinetics of spent nuclear fuel dissolution in water is
therefore of key importance for the safety assessment of deep geological
repositories for spent nuclear fuel.
1.4 Radiation chemistry
After being irradiated in a nuclear reactor, the spent nuclear fuel will emit
α-, β-, and γ-radiation due to decay of radioactive nuclei:
(1) α-radiation: Emission of He2+ nucleus. Alpha emitters are in
general long lived.
U92238
→ Th90
234 + He24 (1.1)
1. Introduction
5
(2) β-radiation: Emission of electrons (β-) or positrons (β+)
Pu94241
→ Am95
241 + e−−10 (1.2)
(3) γ-radiation: Electromagnetic radiation produced when the decay
of an atomic nucleus from a high-energy state to a low-energy
state takes place. It usually follows the two previously described
decays, since the emission of a particle usually leaves the nucleus
in an excited state.
Pu∗94240
→ Pu94
240 + γ00 (1.3)
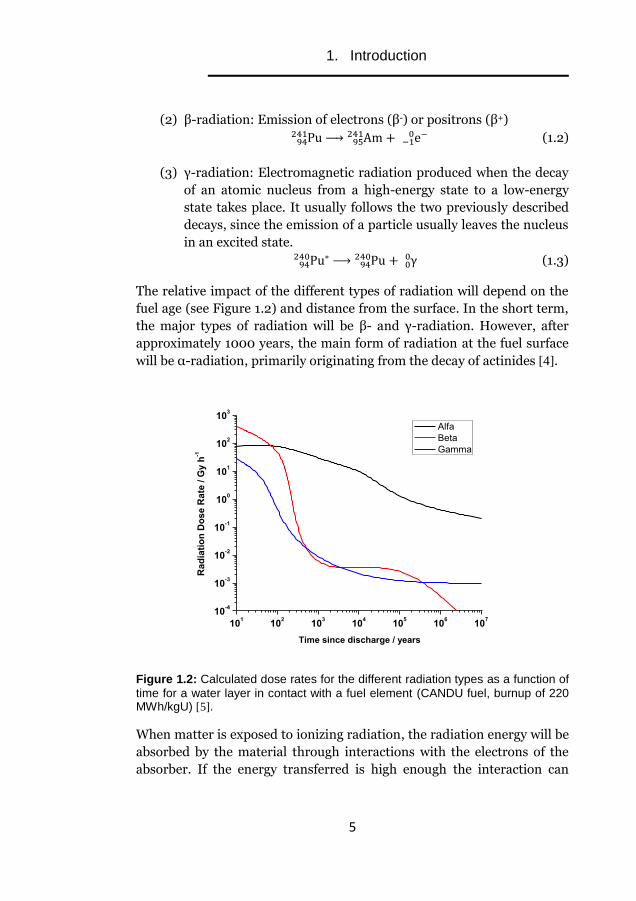
The relative impact of the different types of radiation will depend on the
fuel age (see Figure 1.2) and distance from the surface. In the short term,
the major types of radiation will be β- and γ-radiation. However, after
approximately 1000 years, the main form of radiation at the fuel surface
will be α-radiation, primarily originating from the decay of actinides [4].
101
102
103
104
105
106
107
10-4
10-3
10-2
10-1
100
101
102
103
Ra
dia
tio
n D
os
e R
ate
/ G
y h
-1
Time since discharge / years
Alfa
Beta
Gamma
Figure 1.2: Calculated dose rates for the different radiation types as a function of
time for a water layer in contact with a fuel element (CANDU fuel, burnup of 220 MWh/kgU) [5].
When matter is exposed to ionizing radiation, the radiation energy will be
absorbed by the material through interactions with the electrons of the
absorber. If the energy transferred is high enough the interaction can
1. Introduction
6
Paper Glass Lead
cause ionization of the atom or molecule. In some cases, the energy of the
electron ejected upon ionization can cause further ionizations i.e.
secondary ionizations. Interaction between ionizing radiation and matter
can also result in electronic excitation of the material. The amount of
radiation energy absorbed by a material per unit weight is known as the
absorbed dose and is measured in Grays (1 Gy = 1 J/kg). The dose
absorbed per time unit is called dose rate and is measured in Gy/s.
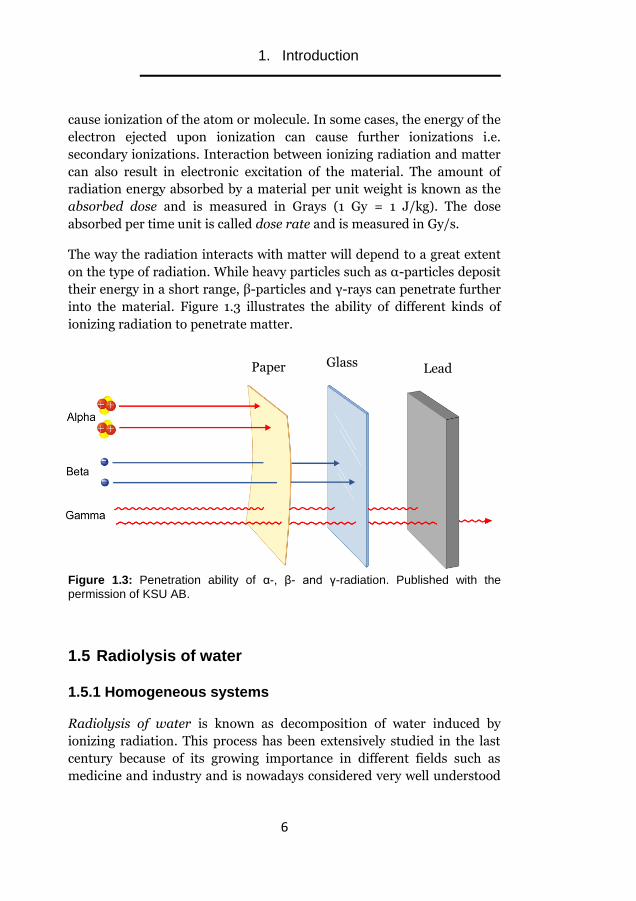
The way the radiation interacts with matter will depend to a great extent
on the type of radiation. While heavy particles such as α-particles deposit
their energy in a short range, β-particles and γ-rays can penetrate further
into the material. Figure 1.3 illustrates the ability of different kinds of
ionizing radiation to penetrate matter.
Figure 1.3: Penetration ability of α-, β- and γ-radiation. Published with the
permission of KSU AB.
1.5 Radiolysis of water
1.5.1 Homogeneous systems
Radiolysis of water is known as decomposition of water induced by
ionizing radiation. This process has been extensively studied in the last
century because of its growing importance in different fields such as
medicine and industry and is nowadays considered very well understood

1. Introduction
7
for homogeneous systems. The processes eventually leading to water
radiolysis can be described as follows:
(1) Physical stage: After just 10-15 s, when the energy from the ionizing
radiation is deposited in a water molecule, it can either lead to the
formation of ionized water molecules if the energy is high enough (H2O+)
or excited water molecules (H2O*).
(2) Physico-chemical stage: Numerous processes occur concentrated in a
spur along the trajectory of the high-energy particle causing the
ionization: ion-molecule reaction, dissociative relaxation, autoionization
of excited states, solvation of electrons, etc. (10-15 - 10-12 s)
(3) Chemical stage: The species react in the tracks and then diffuse in
solution. After this stage (10-6 s) the system is considered homogeneous.
Figure 1.4: Radiation products and time line for radiolysis of water [6].
The number of moles of species created/destroyed per unit of absorbed
energy is known as the G-value. The G-value of the different species
depends on several parameters such as time, system, type of radiation,

1. Introduction
8
temperature and pH [7]. The yields of radiolysis products in water for two
different radiation types are presented in Table 1.1.
Table 1.1: G-values in irradiated water as a function of the type of radiation
(µmol/J) [8].
Radiation G(H2O) G(H2) G(H2O2) G(𝒆𝒂𝒒− ) G(H
·) G(HO
·) G(HO2
·)
γ, e- -0.43 0.047 0.073 0.28 0.062 0.28 0.0027
α (12MeV)
-0.294 0.115 0.112 0.0044 0.028 0.056 0.007
As can be seen in the table, the highest G-values for alpha radiolysis are
molecular products (H2 and H2O2) while the highest G-values for β- and
γ-radiolysis are radical species. The explanation for this tendency is a
more efficient radical-radical recombination to form molecular species
for alpha radiolysis since the density of ionization events is greater for
this type of radiation with low penetration power. β- and γ-radiation will,
on the other hand, penetrate further into the material, leaving behind
itself a track of lower radical density with fewer chances of recombining
[9-11].
1.5.2 Heterogeneous systems
As previously mentioned, radiolysis of water is a very well-known process
in homogeneous media, but very little is known about heterogeneous
systems at solid/liquid interface, although this information is crucial for
the understanding of most processes of practical relevance.
Some examples which illustrate the importance of radiolysis in
heterogeneous systems in nuclear technology are:
- ZrO2 (cladding)/water interface in water-cooled nuclear
reactors
- Cu/water interface in copper canisters for spent nuclear fuel
- UO2/water interface in the event of canister failure in a deep
repository
- Reprocessing of spent nuclear fuel
- Bentonite/water in a geological repository
1. Introduction
9
Despite its importance, the knowledge of the behavior of interfacial
radiation chemistry is still poorly understood. G-values from the bulk
(e.g. from radiolysis of pure water) are often used as simplifications for
calculations for even heterogeneous systems. However, the presence of an
interface can strongly alter the process of water decomposition. Several
authors suggested that a significant amount of the energy absorbed by the
solid will induce chemical changes in the water adjacent to the solid [12,
13]. These events can either be attributed to a change in the dose received
by the liquid or to a change in the initial chemical radiolytic yields.
Several studies have determined the G-values of aqueous radiolysis
products in heterogeneous systems of high solid surface area to solution
volume ratios [14-16]. For most oxides, especially UO2, the G-value of H2
by γ-rays was found to be one to two orders of magnitude higher in the
vicinity of the surface compared to the bulk water. The impact on the G-
value of H2O2 appears to be less pronounced [17].
Neither the rationale for the observed increase of G values for H2 and
H2O2 next to the surface nor its impact on radiation-induced dissolution
of UO2 are yet clear. Excitonic chemistry, ionic chemistry and electron
transfer from the oxide have been suggested as possible mechanisms [18,
19].
1.6 Spent nuclear fuel
Before being irradiated in a nuclear power reactor, nuclear fuel usually
consists of uranium dioxide (UO2) in the form of pellets. Natural uranium
consists primarily of the isotopes 238U (non-fissile) and 0.7% of 235U
(fissile). The production of energy inside a nuclear reactor is attributed to
the fission or splitting of 235U atoms into two highly energetic smaller
nuclei, energy and a number of neutrons that, with the sufficient and
adequate energy (thermal neutrons), can induce fission of further nuclei,
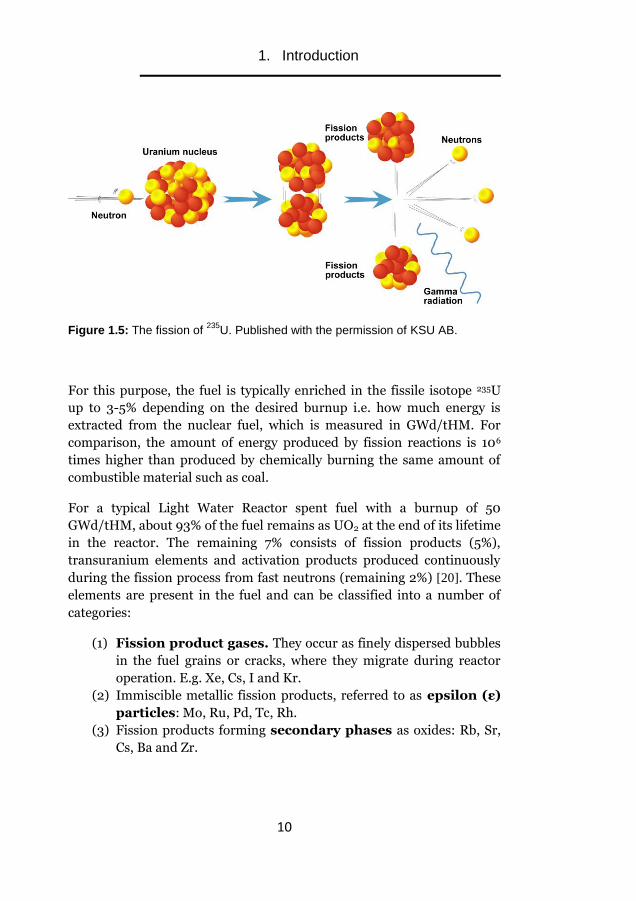
creating a self-propagating chain reaction (Eq 1.4 and Figure 1.5).
U92235 + n
→ 2 Fission Products + 2.5 n0
101 + 200 MeV (1.4)
1. Introduction
10
Figure 1.5: The fission of 235
U. Published with the permission of KSU AB.
For this purpose, the fuel is typically enriched in the fissile isotope 235U
up to 3-5% depending on the desired burnup i.e. how much energy is
extracted from the nuclear fuel, which is measured in GWd/tHM. For
comparison, the amount of energy produced by fission reactions is 106
times higher than produced by chemically burning the same amount of
combustible material such as coal.
For a typical Light Water Reactor spent fuel with a burnup of 50
GWd/tHM, about 93% of the fuel remains as UO2 at the end of its lifetime
in the reactor. The remaining 7% consists of fission products (5%),
transuranium elements and activation products produced continuously
during the fission process from fast neutrons (remaining 2%) [20]. These
elements are present in the fuel and can be classified into a number of
categories:
(1) Fission product gases. They occur as finely dispersed bubbles
in the fuel grains or cracks, where they migrate during reactor
operation. E.g. Xe, Cs, I and Kr.
(2) Immiscible metallic fission products, referred to as epsilon (ε)
particles: Mo, Ru, Pd, Tc, Rh.
(3) Fission products forming secondary phases as oxides: Rb, Sr,
Cs, Ba and Zr.
1. Introduction
11
(4) Fission product elements forming solid solutions with UO2 and
therefore retained in the fuel matrix: Lanthanides (La, Ce,
Pr, Nd, Pm, Sm, Eu), actinides, alkaline elements and other
soluble oxides. (Sr, Zr, Nb, Cs, Ba) (Cs, Nb, Zr, Y).
Not all these elements are homogeneously distributed within a single
pellet, which makes SNF a complex system with a complex chemistry and
phase distribution that will depend on its thermal history, neutron
spectra, burn-up and initial composition.
1.7 Dissolution of UO2
The release of radionuclides from the SNF to the environment in the
event of a canister failure has been demonstrated to proceed as two
consecutive events:
First event: Instant release
This is often referred to as the Instant Release Fraction (IRF). After the
cladding of the fuel is breached and groundwater contacts the fuel, a
fraction of the inventory will be rapidly released, mainly fission gases (Xe
and Kr) and volatile elements situated on the grain boundaries and on the
gap between pellet and cladding (I, Cs, Cl). Some of these radionuclides,
such as 129I (t1/2 17.7 M years) and 135Cs (t1/2 2.3 M years), are long-lived
and geochemically mobile and therefore considered relevant instant
release radionuclides from a long-term-management perspective.
Long term event: Oxidative dissolution of the UO2 fuel
matrix
After the initial fraction of radionuclides has been released, the oxidative
dissolution of the fuel matrix will govern the release of radionuclides
from the SNF. Most radionuclides present in the fuel (>90 %) belong to
this category.
Under the reducing conditions expected in the groundwater of a deep
repository, the solubility of UO2 is very low [4, 21]. However, the
radioactivity from the SNF will induce radiolysis of the water and alter
1. Introduction
12
the initial reducing conditions by producing equal amounts of both
oxidants (H2O2, HO, O2 and HO2 ) and reductants (H2, H and eaq
− ) [22].
As the UO2 matrix is in its reduced form (U(IV)), the chemistry of the
system will be dominated by the radiolytic oxidants at least during the
early stages [23]. This can lead to oxidation of U(IV) to U(VI), increasing
the solubility of uranium by several orders of magnitude. The mechanism
of oxidative dissolution of UO2 has been extensively studied for several
decades and can now be considered fairly well understood [4, 24, 25]. A
simplified mechanism is presented in reactions 1.5 and 1.6.
UO2(s) + Ox ⟶ U(VI)(s) + Red (oxidation) (1.5)
U(VI)(s)⟶ U(VI)(aq) (dissolution) (1.6)
Furthermore, the presence of complexing agents in groundwater such as
HCO3− will prevent the formation of secondary phases and further enhance
the solubility of U(VI). A study by Hossain et al. has shown that at
HCO3− concentrations above 1 mM, the rate-limiting step is given by the
oxidation step (Eq. 1.6) and the consumption of oxidant becomes
independent of the HCO3− concentration [25].
In the absence of HCO3−, the formation of secondary phases such as
UO3·xH2O or UO4·xH2O is favored and the rate of oxidation will decrease
since a smaller fraction of the oxidants will be accessible to the UO2
surface [4].
As described before, both oxidative molecular and radical species will be
formed upon radiolysis of water in the vicinity of the UO2 surface. Since
the radicals react at least one order of magnitude faster than the
molecular oxidants, they could be expected to have the major impact on
the oxidation of UO2. Nevertheless, to study the impact of the different
oxidants, not only kinetic constants must be considered but also the
concentration of the oxidants. The total rate of oxidation is given by Eq.
1.7:
dnU(VI)
dt= AUO2 ∑ kox[Ox]
n
ox=1
ne−
2 (1.7)

1. Introduction
13
Where AUO2 is the surface area, kox is the kinetic constant for a given
oxidant, [Ox] is the concentration of the oxidant at a given time and ne− is
the number of electrons involved in the redox process.
Calculations performed by Ekeroth et al. [26] showed that most radicals
reached a steady-state concentration within a short time in an aqueous
system containing a UO2 surface while the concentration of the molecular
species increased linearly. For this reason, it was found that H2O2 is the
only oxidant of significance under relevant conditions in a deep
geological repository with a relative impact of 99.9%. In addition, the
relative impact of H2O2 will also dominate the α-radiation-induced
oxidation of UO2, which will be the major radiolysis source after 1,000
years. Under this premise, studying the oxidative dissolution of UO2 can
be greatly simplified by studying the reactivity of H2O2 towards UO2 and
neglecting other oxidants.
H2O2 can react with UO2 either by oxidizing U(IV) to U(VI) in two
electron-transfer steps:
UO2 + H2O2⟶ UO2+ + HO• + HO− (1.8)
UO2+ + HO•⟶ UO2
2+ + HO− (1.9)
or undergo catalytic decomposition on the UO2 surface without oxidation
of the matrix
H2O2(ads)UO2→ 2HO•(ads) (1.10)
H2O2(ads) + OH•UO2→ H2O(ads) + HO2
• (ads) (1.11)
2HO2• (ads)
UO2→ H2O2 + O2 (1.12)
The catalytic decomposition of H2O2 has been known for several decades
[27-31], but the surface-catalyzed decomposition involving OH radicals
has been recently proved for UO2 [32, 33] and on a number of other oxide
surfaces [33, 34] . For one of the most studied oxides, ZrO2, the metal
cation is already in its maximum oxidation state and therefore H2O2 can
only react via catalytic composition. ZrO2 is therefore an excellent model
for studies of reaction mechanisms of surface reactions on oxides.

1. Introduction
14
To account for the two competing reactions – oxidation and catalytic
decomposition – the term dissolution yield has been introduced [35]. The
dissolution yield has been defined as the amount of dissolved uranium
per total consumed amount of hydrogen peroxide.
Dissolution yield (%) =U(VI)dissolved
tot H2O2consumedx 10 (1.13)
The final dissolution yield for unirradiated UO2 pellets has been reported
to be ~15 %. In other words, 15 % of H2O2 reacted by oxidation with U(IV)
while 85 % underwent catalytic decomposition. This term will be a useful
tool when comparing the reactivity of different UO2 based materials
towards H2O2.
1.7.1 Doping of UO2 with fission product analogous
Working with spent nuclear fuel is technically and economically
challenging due to the high levels of radioactivity. For this reason, the
processes involved in the radiation-induced dissolution of UO2 have been
extensively studied using unirradiated analogues. As mentioned before,
SNF is a very complex system that differs greatly in composition,
microstructure and radioactivity from unirradiated UO2. One way of
circumventing this problem is to start by understanding the simplest
system (unirradiated UO2), and stepwise modifying it by doping the
matrix with non-radiotoxic chemical analogues of different fission
products as is shown:
UO2 → single-doped UO2
→ co-doped UO2
→ SIMFUEL
→ SNF
In this way, the effect of soluble trivalent elements in the UO2 matrix (Y3+,
La3+, Gd3+ [36-38]) and noble metal particles (Pd [39-42]) have been
individually studied. To investigate a more complex system from a
chemical state and microstructure point of view, SIMFUEL pellets
(Simulated Spent Nuclear Fuel) have been used in leaching experiments.
SIMFUEL consists of eleven fission product analogues (Rh, Pd, Ru, Mo,
Nd, Zr, Sr, La, Ce, Ba, Y) and simulates the compositions of an irradiated
fuel with a 3-6 % Fissions per Initial Metal Atom (FIMA) [43].

1. Introduction
15
To simulate the formation of oxidants by radiolysis of water, various
methods have been used. One possibility is to use external γ-radiation to
induce radiolysis. Another possibility is to dope the pellets with short-
lived α-emitters (e.g. 233U or 238Pu) that can reproduce the activity levels
of spent fuel at different ages [44-46].
1.7.2 Effect of solutes
A number of organic and inorganic solutes will be present in the
groundwater of a deep geological repository. Some of these species could
affect the kinetics and mechanism of radiation-induced dissolution of
UO2 by reacting with oxidants and reductants from the system. Below is
presented some of the solutes of interest under deep repository
conditions:
Bicarbonate (𝐇𝐂𝐎𝟑−)
Bicarbonate is by far one of the most important groundwater components
studied in the oxidative dissolution of UO2 and leaching experiments with
irradiated fuel. The concentration of these species in Swedish
groundwater is expected to be on the order of 2-10 mM [47]. As
mentioned before, HCO3− is a strong complexing agent for U(VI) and
enhances the dissolution of UO22+ by forming complexes[48].
Furthermore, HCO3− will also scavenge the OH radical producing CO3
·−.
The reactivity of both radicals towards UO2 has been estimated to be
practically the same since both reactions are diffusion controlled. [49, 50].
Sulfide (H2S/HS-)
Sulfide is mainly produced by reducing sulfate to sulfide, both by
thermochemical sulfate reduction and bacterial sulfate reduction. The
estimated concentration of sulfide in a future geological repository is
between 1-2 µM. Previous studies have suggested that sulfide can poison
palladium catalysts in aqueous solutions, which could affect the
inhibition by noble metal catalyzed H2 reduction of U(VI) [51, 52]
(Section 1.7.3).

1. Introduction
16
Iron (Fe (II))
Fe from anaerobic corrosion of the iron cast of the canister is a potential
reducing agent in the intruding groundwater. The effect of the presence
of iron on the oxidative dissolution of UO2 has been discussed in several
publications [53, 54]. It has been shown that the presence of dissolved
Fe(II) reduces the dissolution rate of UO2. The explanation for this could
be the reaction of dissolved iron with H2O2 and HO·/CO3·− resulting in a
reduction of the concentration of both oxidants. In addition, U(VI) can be
reduced by dissolved Fe (II) [55] or by structural Fe (II) in green rust [56]
and magnetite [57].
1.7.3 The H2 effect
The importance of the so-called Hydrogen effect lies in the observed
ability of hydrogen in reducing and, in some cases, completely inhibiting
the oxidative dissolution process of SNF [58-63]. During the last decade,
considerable efforts to clarify the role of hydrogen on the dissolution of
SNF have been made [58, 59, 64, 65].
A significant amount of H2 is expected to be produced in a deep
repository for SNF. A hydrogen concentration of 38 mM corresponding to
a partial pressure of approximately 50 bar is expected [58]. Furthermore,
hydrogen will be produced in low amounts by water radiolysis; however,
the dominant source is expected to be the anaerobic corrosion of the iron
from the steel insert or the copper from the canister according to reaction
1.14.
3Fe + 4H2O → Fe3O4 + 8H2 (1.14)
It has been suggested that there are at least two main routes for H2 to
decrease the oxidative dissolution rate:
(a) Noble metal (-particles) catalyzed reduction of radiolytic oxidants.
This process would prevent oxidation of the matrix, however this
reaction alone would not be able to compete efficiently with the
reaction between H2O2 and UO2 since the ratio between UO2 and
noble metal particles is about 100 [66].
1. Introduction
17
(b) Noble metal (-particles) catalyzed reduction of U(VI) on the fuel
surface back to U(IV). Experiments presented in Nilsson and
Jonsson [42] showed that Pd powder (as a model of ε-particles)
catalyzes the reduction of U(VI) to U(IV) by H2 (Eq. 1.15). It must be
pointed out that this process will decrease the U(VI) concentration in
solution and is not expected to affect the dissolution of spent nuclear
fuel, since further oxidation and dissolution of the fuel matrix can
still occur. However, the galvanic coupling between the ε-particles
and the fuel matrix would catalyze the reduction of undissolved U(VI)
back to U(IV) by H2, inhibiting the dissolution of UO2. This process
has been shown to be very efficient accounting for the low
concentrations of uranium observed in solution [39].
H2 + UO22+(aq)
→ UO2+ 2H+ (1.15)
Although the already-mentioned processes appear to be the responsible
for the inhibition, other mechanisms have also been discussed [58, 63, 67,
68].
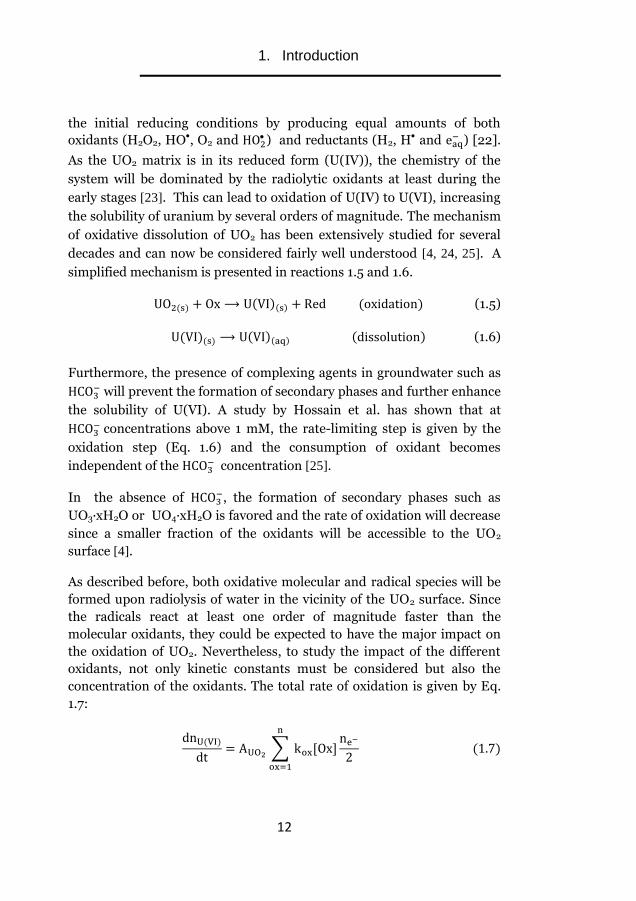
In Figure 1.6 some of the most important processes involved in the
radiation-induced dissolution of spent nuclear fuel are shown: oxidation
of U(IV) to U(VI) by H2O2, HCO3− enhanced dissolution of U(VI) and
noble metal (ε-particle) catalyzed reduction in the solid phase of U(VI) to
U(IV) by H2.
Figure 1.6: Schematic picture of relevant processes involved in radiation-induced
dissolution of spent nuclear fuel.

1. Introduction
18
1.8 Scope of the thesis
This doctoral thesis is focused on experimental studies of interfacial
reactions of relevance in radiation-induced dissolution of spent nuclear
fuel. To investigate the importance of different parameters affecting the
mechanism and kinetics on the oxidative dissolution of UO2, this work
has been divided in two parts:
1. The effect of intrinsic solid phase properties on the oxidative
dissolution of UO2:
a. Solid surface stoichiometry
b. Integral Burnable Absorbers: (U,Gd)O2 fuel
2. The effect of external factors on the oxidative dissolution of UO2:
a. H2/O2
b. Sulfide
c. Bentonite
2. Experimental details
19
2. Experimental details
2.1 Materials
All solutions were prepared using ultrapure water from a Millipore Milli-
Q system (18.2 M·cm) to assure reproducibility and maximum accuracy
in the experimental results.
The UO2 pellets (both standard UO2 and (U,Gd)O2) and UO2 powder
were provided by Westinghouse Electric Sweden AB. The amount of
gadolinium in the doped fuel varies from 3 to 8% wt.
The bentonite used in Paper II was Wyoming Volclay bentonite MX-80, a
Na-bentonite investigated as a backfill material by SKB and Posiva
(produced by American Colloid Company). It consists of ~82%
montmorillonite and it is mainly composed of SiO2, Al2O3 and other
minor oxides.
H2S(aq) was prepared in the laboratory by purging H2S(g) into water in an
anoxic container until saturation.
Other chemicals and reagents used in the experiments are listed in Table
2.1.
Table 2.1: Other chemicals and reagents used in the experiments.
Chemical Information
ZrO2 (powder) Pd (powder)
CAS [1314-23-4], Sigma-Aldrich ≥99% CAS [7440-05-3], Sigma-Aldrich ≥99.9%
KI CAS [7681-11-0], Merck ≥99% HAc CAS [64-19-7], J.T. Baker ≥99.7% NaAc CAS [127-09-3], Sigma-Aldrich, ≥99% Arsenazo III CAS [1668-00-4], Sigma-Aldrich NaHCO3 CAS [144-55-8], Sigma-Aldrich Tris(hydroxymethyl)aminomethane
CAS [77-86-1], Sigma-Aldrich, ≥99.9%
Ammonium Acetate CAS [631-61-8], Sigma-Aldrich ≥98% Acetoacetalinide CAS [102-01-2], Sigma-Aldrich ≥98% H2O2 30% CAS [7722-84-1], J.T. Baker HCl 37 % CAS [7647-01-0], Merck
2. Experimental details
20
Where atmosphere other than air was required, the gases used in the
experiments were N2 (99.999% Strandmøllen AB) and H2 (AGA Gas AB).
2.2 Instrumentation
2.2.1 Surface analysis
X-Ray diffraction (XRD)
X-ray diffraction was used to characterize different materials and
measure sample purity. The measurements were run in both powder and
pellet samples in Papers V and VI. The instrument was a PANanalytical
X’Pert Pro (Bragg-Brentano geometry) equipped with monochromatic
CuKα1 (1.54059 Å) as irradiation source.
Scanning Electron Microscopy (SEM)
This technique was used to analyze the surface morphology of the
(U,Gd)O2 samples in Paper V. The instrument was a FEI-XL 30 series
equipped with an Energy Dispersive X-ray Spectroscopy (EDS) detector.
An acceleration voltage of 20 kV was used.
Brunauer-Emmett-Teller (BET) method
The specific surface areas of different powders in papers III and VI were
determined by using the BET method of isothermal adsorption and
desorption of a gaseous mixture consisting of 30% N2 and 70% He. The
instrument used was a Micrometrics Flowsorb II 2300.
2. Experimental details
21
2.2.2 Dissolution experiments
UV/Vis spectroscopy
The concentration of H2O2, hydroxyl radicals and dissolved uranium were
quantified by UV/Vis spectroscopy with a Thermo Scientific Genesys 20
UV/Vis spectrophotometer. This technique was used in all systems.
Inductively Coupled Plasma – Optic Emission
Spectroscopy (ICP-OES)
The analysis of dissolved gadolinium (Paper V) and uranium, when the
sample was too complex to use UV/VIS spectroscopy (Paper II), was
performed using an ICP-OES Thermo Scientific iCAP 6000 series. The
analysis was performed at wavelengths of 310.0 and 335.0 nm for
gadolinium and 263.5 and 393.2 nm for uranium. The calibration was
performed using ICP single- and multi-element standards from Merck
and Sigma Aldrich within the interval of concentrations expected.
Gamma source
Irradiation experiments to induce oxidative dissolution of UO2 were
conducted in a MDS Nordion 1000 Elite 137Cs γ-source. 137Cs has a half-
life (t1/2) of 30.17 years and decays emitting beta particles to metastable 137mBa, with a half-life of 153 s, being the responsible of the γ-ray
emissions in samples of 137Cs.
Cs-137 𝛽− (𝑡1/2=30.17 𝑦)→ Ba-137m
𝛾 (𝑡1/2=153 𝑠)→ Ba-137 (13)
The dose rate was determined using Fricke dosimetry [8] obtaining values
in the range of 0.058 - 0.15 Gy/s depending on sample position.

2. Experimental details
22
2.2.3 Additional equipment
Centrifuge
Samples containing bentonite were centrifuged using a Heraeus
Megafuce 16 Thermo Fisher centrifuge.
Scale
Samples were weighed using a Metter Toledo AT261 Delta Range
microbalance.
2.3 Methodology
2.3.1 H2O2-induced dissolution experiments
Prior to experiments, the UO2 powder and pellets were washed 3 times 30
minutes each with 10 mM NaHCO3 to reduce dissolution of uranium
without oxidation. Thereafter, the solids were introduced in 50 mL 10
mM NaHCO3 aqueous solutions that were previously purged for 30
minutes with a continuous flow of N2 gas. Finally, the required amount of
H2O2 was added to the solutions to obtain the desired initial
concentration.
For bentonite experiments, the clay was previously washed with water to
eliminate soluble compounds and humus that could affect the
measurements.
The concentration of H2O2 and dissolved uranium were monitored as a
function of time by UV/vis spectroscopy and/or ICP-OES.
H2O2 measurements
H2O2 was indirectly measured spectrophotometrically at 350 nm using
the Ghormley triiodide method [69, 70]). In this method, ammonium
molybdate is used to catalyze the oxidation of I− to I2 by H2O2.
Subsequently I2 reacts with another iodide to form I3− as shown in
reactions 2.1 and 2.2. The formed I3− appears yellow in low concentrations
2. Experimental details
23
and can be easily detected. For powder experiments, 360 nm was used to
avoid overlap produced by the high uranyl carbonate complex
concentrations.
2I− + H2O2 → I2 + 2OH− (2.1)
I2 + I− → I3
− (2.2)
A suitable amount of sample was extracted from the solution and filtered
through a 0.2 µm membrane before analysis. Thereafter, 1.8 mL of
diluted sample was mixed with 0.1 mL 1 mM KI and 0.1 mL from a
solution of 1 M HOOCCH3/1 M NaOOCCH3 with a few drops of 3%
(NH4)2Mo2O7.
Dissolved uranium measurements
The concentration of U(VI) in solution was measured either by UV/vis
spectroscopy using the Arsenazo III method [71, 72] (λ=653 nm) or by
ICP-OES. For the spectroscopic method, 1.5 mL of diluted sample was
mixed with 40 µL of 0.03 % Arsenazo III reagent and 65 µL 1 M HCl. ICP-
OES measurements were preferred for bentonite experiments analysis,
where the presence of other elements could interfere in the spectroscopic
measurements.
In addition to general preparations, samples from bentonite experiments
were centrifuged for 6 minutes at 18,600 g (units of gravity) to eliminate
colloids from the supernatant and facilitate filtration prior analysis.
2.3.2 Radiation-induced dissolution experiments
Irradiation experiments were performed using a γ-source described
under section 2.2.2 (see Figure 2.1). The same preparation procedure and
analysis of the samples were followed, excluding the step of adding H2O2
to the system. The main purpose of this type of experiments was to study
a more complex system in which more than one oxidant (H2O2) is
present. Furthermore, this system would be closer to relevant conditions
for a deep repository in the context of an incidental scenario with an
anticipated intrusion of water. Nevertheless, this scenario is not expected

2. Experimental details
24
to occur during the first 100 years of life of the repository when γ-
radiation is predominant.
Figure 2.1: Picture of the γ-cell and schematic representation of the dose rates
for the different sample positions.
2.3.3 Autoclave experiments
Several experiments from Papers I, III and IV were performed in a glass
vessel inside an autoclave made of stainless steel (Figure 2.2). The
autoclave was equipped with a stirrer, inlet and outlet tubes for
pressurizing and sampling from the reaction vessel. The sampling tube is
made of polyether ether ketone (PEEK) to minimize any possible effects
on the chemistry while the solution is in contact with the sampling tube.
When avoiding the presence of oxygen in the system, the solutions were
previously purged with N2 gas for at least 1.5 h. After being introduced
into the autoclave, the system was purged for an extra 1.5 h to remove all
remaining oxygen. Finally, the autoclave was pressurized with the gas of
interest up to either 5 or 40 bar. To obtain a gas mixture of O2 and H2 for
experiments in Paper III (0.21 bar O2/40 bar H2), the solution was
saturated in air without performing a purge of the autoclave with N2. An
important reason for using 40 bar of H2 was to make sure that the
1
2
3
4
1: 0.150 Gy·s -1 2: 0.076 Gy·s -1 3: 0.058 Gy·s -1 4: 0.085 Gy·s -1
137
Cs
Dose Rates
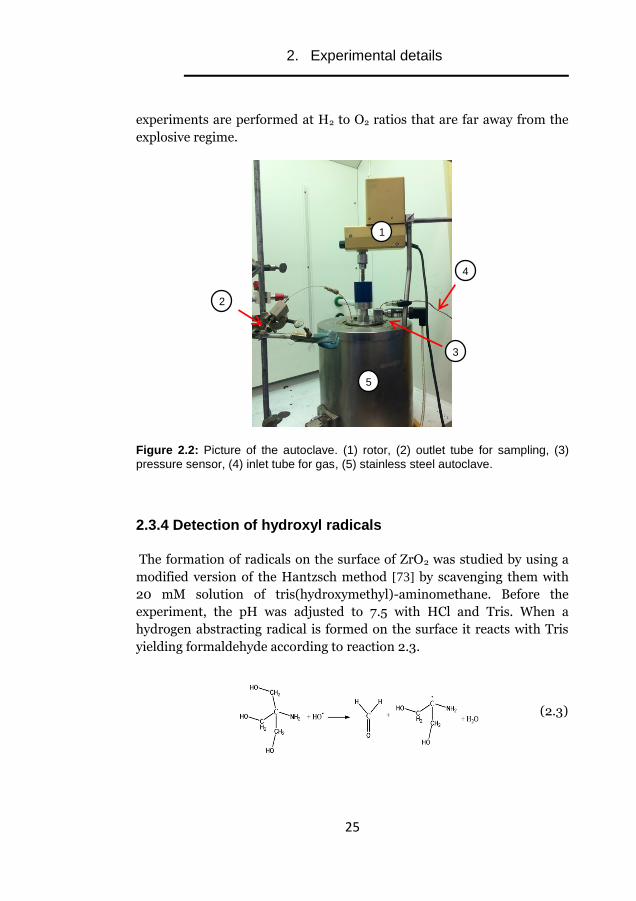
2. Experimental details
25
experiments are performed at H2 to O2 ratios that are far away from the
explosive regime.
Figure 2.2: Picture of the autoclave. (1) rotor, (2) outlet tube for sampling, (3)
pressure sensor, (4) inlet tube for gas, (5) stainless steel autoclave.
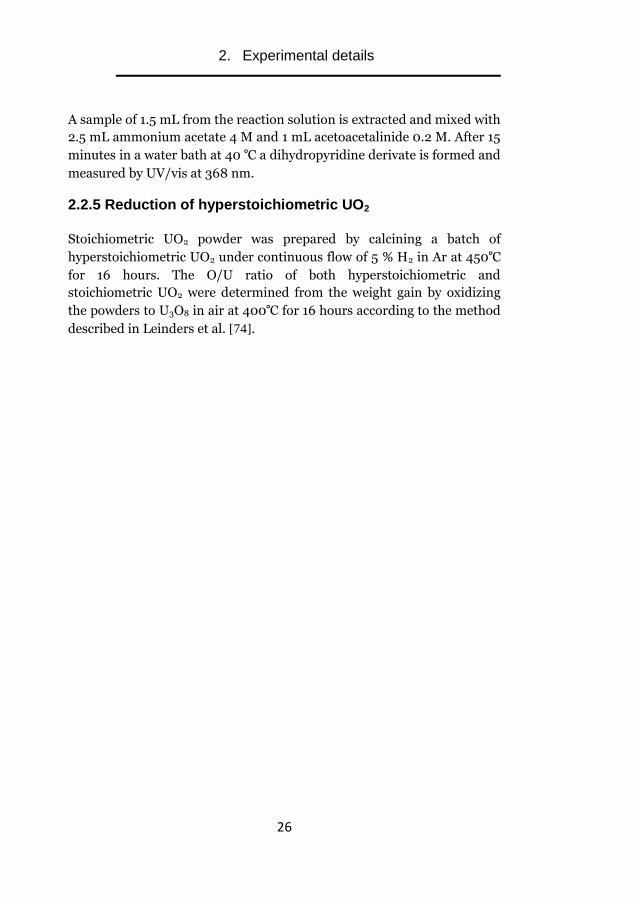
2.3.4 Detection of hydroxyl radicals
The formation of radicals on the surface of ZrO2 was studied by using a
modified version of the Hantzsch method [73] by scavenging them with
20 mM solution of tris(hydroxymethyl)-aminomethane. Before the
experiment, the pH was adjusted to 7.5 with HCl and Tris. When a
hydrogen abstracting radical is formed on the surface it reacts with Tris
yielding formaldehyde according to reaction 2.3.
(2.3)
1
2
3
4
5
2. Experimental details
26
A sample of 1.5 mL from the reaction solution is extracted and mixed with
2.5 mL ammonium acetate 4 M and 1 mL acetoacetalinide 0.2 M. After 15
minutes in a water bath at 40 °C a dihydropyridine derivate is formed and
measured by UV/vis at 368 nm.
2.2.5 Reduction of hyperstoichiometric UO2
Stoichiometric UO2 powder was prepared by calcining a batch of
hyperstoichiometric UO2 under continuous flow of 5 % H2 in Ar at 450°C
for 16 hours. The O/U ratio of both hyperstoichiometric and
stoichiometric UO2 were determined from the weight gain by oxidizing
the powders to U3O8 in air at 400°C for 16 hours according to the method
described in Leinders et al. [74].
3. Results and discussion
27
3. Results and discussion
The experimental results and discussion is divided into two sections:
In section 3.1, the results connected to changes in the properties of the
solid phase of UO2 are presented. In particular, it will be discussed how
the stoichiometry of the UO2 surface affects the reactivity towards
radiolytic oxidants and how the addition of Integral Burnable Absorbers
affect the stability of the fuel in an aqueous system.
In section 3.2, the impact of several groundwater components on the
oxidative dissolution of UO2 is discussed. These will be referred to as
“external effects”.
3.1 The effect of intrinsic solid phase properties on the
oxidative dissolution of UO2
3.1.1 Surface stoichiometry
As described in the Introduction, under deep repository conditions, the
spent nuclear fuel matrix is in its reduced form (UO2.0). After canister
failure and water intrusion, the water molecules adjacent to the fuel
surface will undergo radiolysis and oxidation of the fuel matrix will occur.
The initial UO2.0 surface will then be oxidized to UO22+ via UO2+x
according to Eq. 3.1:
UO2.0
→ UO2+x
→ UO2
2+ (3.1)
Theoretically, if a sufficient amount of HCO3-/CO3
2- is present in
groundwater, deposition of secondary phases would be avoided, uranium
dissolution would be enhanced and a clean UO2.0 surface would then be
available for further oxidative attack. An X-ray Photoelectron
Spectroscopy (XPS) study by de Pablo et al. (1999) showed that a UO2.0
surface is only be observed at bicarbonate concentrations of ≥50 mM
[75]. This observation indicates that, in a realistic scenario, the oxidative
dissolution process will occur on an intermediate UO2+x layer and not on
UO2.0.

3. Results and discussion
28
In this section, the impact of surface stoichiometry on the reactivity of
UO2 towards radiolytic oxidants is studied. The O/U ratios of the powders
used in these experiments were determined to be 2.0 and 2.34 (see
Section 2.3.5). The typical error associated with the results, if not stated
differently, is 5%.
3.1.1.1 H2O2-induced dissolution
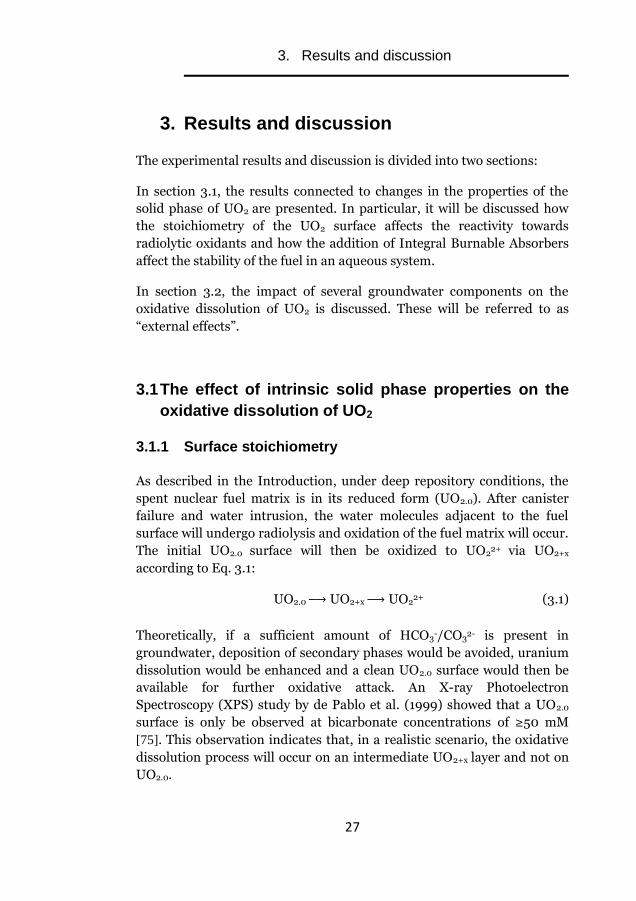
3.1.1.1.1 Reaction kinetics for hyperstoichiometric UO2 (UO2.34)
Four different concentrations of H2O2 (0.2, 0.5, 1 and 2 mM) were added
to 100 mg powder suspensions containing 10 mM NaHCO3. The reaction
dynamics of the four batches were studied by measuring the
concentrations of H2O2 and U as a function of reaction time. The results
are shown in Figure 3.1:
Figure 3.1: H2O2 and uranium concentration as a function of time for four
different initial concentrations of H2O2. (a) 0.2 mM, (b) 0.5 mM, (c) 1 mM, (d) 2
mM. The surface/volume used was 5400 m-1
(100 mg UO2.34 / 100 mL).
0 20 40 60 80 1000.00
0.05
0.10
0.15
0.20
Time / min
[H2O
2]
/ m
M
0.00
0.05
0.10
0.15
0.20[U
(VI)] / m
M
0 20 40 60 80 100 12000.0
0.1
0.2
0.3
0.4
0.5
Time / min
[H2O
2]
/ m
M
0.0
0.1
0.2
0.3
0.4
0.5
[U(V
I)] / mM
0 50 100 150 200 15000.0
0.2
0.4
0.6
0.8
1.0
(d) 2 mM(c) 1 mM
Time / min
[H2O
2]
/ m
M
0.0
0.2
0.4
0.6
0.8
1.0
[U(V
I)] / mM
0 20 40 60 80 100 12000.0
0.4
0.8
1.2
1.6
2.0
Time / min
[H2O
2]
/ m
M
0.0
0.2
0.4
0.6
0.8
1.0
(a) 0.2 mM (b) 0.5 mM
[U(V
I)] / mM

3. Results and discussion
29
From the results in Figure 3.1, it can be observed that the systems follow
the general trends expected for this type of experiment [24, 76]. The
uranium concentration increases with time and the increase slows down
when the concentration of H2O2 approaches zero.
The final dissolution yield of uranium powders has been reported to be
~80% [35]. In Table 3.1, the final dissolution yields for the systems
presented in Figure 3.1 are summarized. It can be observed that the final
dissolution yield is not constant and decreases with higher initial H2O2
concentration. This observation will be further discussed under the next
section (3.1.1.1.2).
Table 3.1: Final dissolution yields (%) for 100 mg of hyperstoichiometric UO2 in
100 mL (S/V= 5400 m-1
) as a function of initial H2O2 concentrations.
0.2 mM 0.5 mM 1 mM 2 mM
UO2.34 100 72 61 46
The cumulative dissolution yields of uranium as a function of reaction
time for the previous systems are presented in Figure 3.2:
0 30 60 90 1200 15000
20
40
60
80
100
0.2 mM H2O
2
0.5 mM H2O
2
1 mM H2O
2
2 mM H2O
2
Dis
so
luti
on
yie
ld / %
Time / min
Figure 3.2: Cumulative dissolution yields of uranium as a function of
reaction time. The surface/volume used was 5400 m-1
.
3. Results and discussion
30
As can be seen, the cumulative dissolution yield increases with reaction
time in all systems. These results are not surprising and are well in line
with the mechanism of the reaction between H2O2 and UO2. As previously
discussed, H2O2 can either oxidize UO2 or undergo catalytic
decomposition on the UO2 surface. The latter reaction generates surface-
bound OH radicals that can react further with H2O2 [31, 77]. With
increasing H2O2 concentration, the fraction of H2O2 that reacts with the
adsorbed OH radicals increases resulting in a reduced dissolution yield.
At low H2O2 concentrations, the competition between the two reactions is
mainly governed by the distribution of oxidation sites relative to catalytic
sites.
3. Results and discussion
31
3.1.1.1.2 Reaction kinetics for stoichiometric UO2 (UO2.0)
A series of identical experiments was performed with stoichiometric
powder to compare the kinetics of both powders by using five initial H2O2
concentrations (0.2, 0.5, 1, 2 and 5 mM). The results are presented in
Figure 3.3.
Figure 3.3: H2O2 and uranium dissolution as a function of time for four different
initial concentrations of H2O2. (a) 0.2 mM, (b) 0.5 mM, (c) 1 mM, (d) 2 mM, (e) 5
mM. The surface/volume used was 5800 m-1
(100 mg UO2.0 / 100 mL).
By comparing Figures 3.1 and 3.3, a number of differences in the reaction
kinetics can be found between the two stoichiometries. First, H2O2 reacts
substantially faster with stoichiometric than hyperstoichiometric UO2 in
all cases. Second, the release of uranium from stoichiometric UO2 is lower
than for hyperstoichiometric UO2. These results point out that the
stoichiometry of the solid surface is crucial when elucidating the reaction
kinetics of oxidative dissolution of UO2. The final dissolution yields for
stoichiometric UO2 are presented in Table 3.2:
0 20 40 600.00
0.05
0.10
0.15
0.20
(a) 0.2 mM
Time / min
[H2O
2]
/ m
M
0.000
0.025
0.050
0.075
0.100
(c) 1 mM
(b) 0.5 mM[U
(VI)] / m
M
0 20 40 600.0
0.1
0.2
0.3
0.4
0.5
Time / min[H
2O
2]
/ m
M
0.00
0.05
0.10
0.15
0.20
[U(V
I)] / mM
0 50 100 150 12000.0
0.2
0.4
0.6
0.8
1.0
[H2O
2]
/ m
M
Time / min
0.0
0.1
0.2
0.3
0.4
0.5
[U(V
I)] / mM
0 30 60 90 120 14000.0
0.4
0.8
1.2
1.6
2.0
(e) 5 mM
(d) 2 mM
Time / min
[H2O
2]
/ m
M
0.00
0.25
0.50
0.75
1.00
[U(V
I)] / mM
0 50 100 150 14000
1
2
3
4
5
Time / min
[H2O
2]
/ m
M
0.00
0.25
0.50
0.75
1.00
[U(V
I)] / mM

3. Results and discussion
32
Table 3.2: Final dissolution yields (%) for 100 mg of stoichiometricUO2 in 100 mL.
(S/V= 5800 m-1
) as a function of initial H2O2 concentrations.
0.2 mM 0.5 mM 1 mM 2 mM 5mM
UO2.0 22 36 45 32 17
As can be seen, all dissolution yields for stoichiometric UO2 are lower
than for hyperstoichiometric UO2. Interestingly, the final dissolution
yield dependence on initial H2O2 concentration does not follow the same
trend as hyperstoichiometric UO2. The significantly low dissolution yields
for the initial H2O2 concentrations of 0.2 and 0.5 mM in combination
with the higher reactivity of H2O2 towards stoichiometric UO2 imply that
the initial oxidation of stoichiometric UO2 follows a different path
compared to the oxidation of the hyperstoichiometric counterpart.
A possible hypothesis is that the initial oxidation of stoichiometric UO2
leads to a change in the surface oxidation state but not to dissolution of
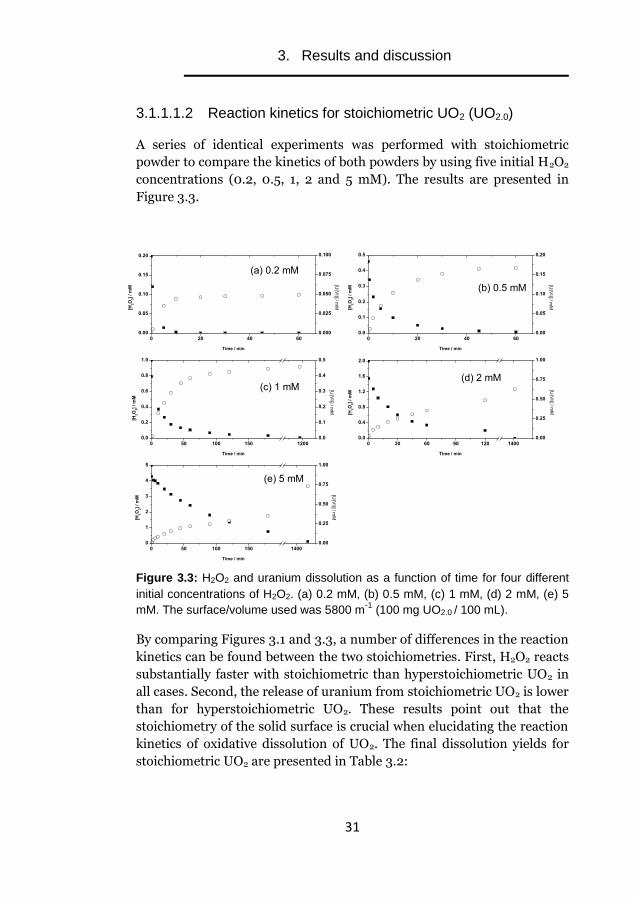
oxidized UO2. To elucidate the nature of this process, three consecutive
experiments on the same aqueous solution containing stoichiometric UO2
were performed. After complete consumption of the initial 0.2 mM H2O2,
the solution was exposed to a new addition of 0.2 mM and the evolution
of dissolved uranium and H2O2 concentration were monitored. The
results are presented in Figure 3.4.
3. Results and discussion
33
0 20 40 60 80 1000.00
0.05
0.10
0.15
0.20
0 20 40 60 80 1000
50
100
150
(a)
(b)
1st addition
2nd addition
3rd addition
[H2O
2]
/ m
M
Time / min
[U(V
I)]
/ µ
M
Time / min
Figure 3.4: Dynamics of the system when three consecutive experiments have
been performed. (a) H2O2 consumption and (b) U(VI) concentration, corrected to
[U(VI)]=0 and t=0 for each new addition. [H2O2]0 = 0.2 mM, S/V = 5800 m-1
.
As can be seen, the reaction dynamics of the second and third H2O2
exposures were clearly different. The consumption of H2O2 became
slower with successive additions, accompanied by an increase in uranium
dissolution. In other words, the dissolution yield increased with the
number of H2O2 additions, as can be seen in Table 3.3. This observation
has also been made for consecutive additions of 0.5 mM H2O2. This
finding can only be explained if the UO2 surface was modified throughout
the experiment due to the consecutive exposures to H2O2. These
modifications would continue until the surface stoichiometry is the same
as for the hyperstoichiometric surface. At this point, the systems should
display identical behavior.
3. Results and discussion
34
Table 3.3: Summary of final dissolution yields for [H2O2]0 = 0.2 mM and 0.5 mM.
S/V = 5800 m-1
.
0.2 mM 0.5 mM
1st
addition 22% 36%
2nd
addition 51% 62%
3rd
addition 66% -
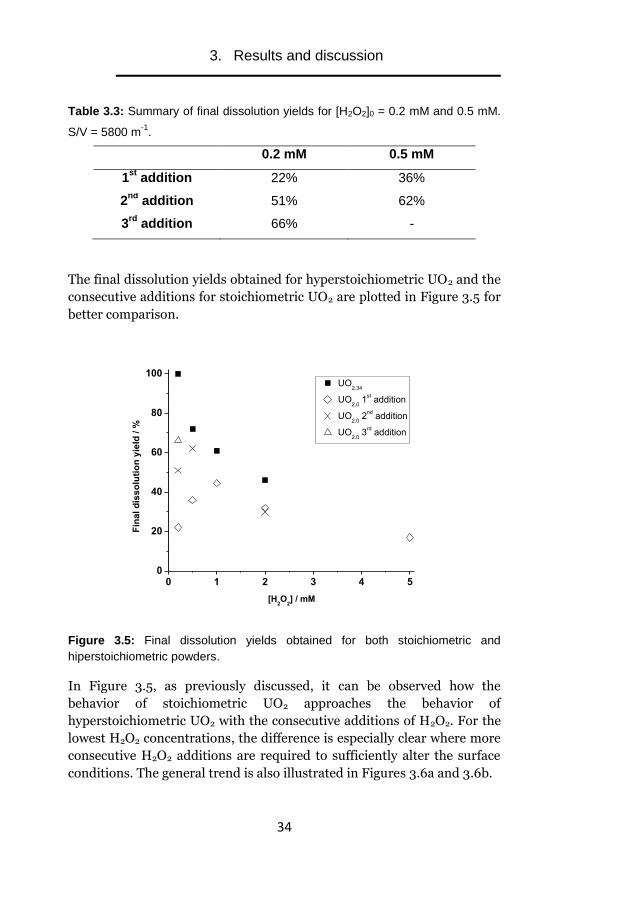
The final dissolution yields obtained for hyperstoichiometric UO2 and the
consecutive additions for stoichiometric UO2 are plotted in Figure 3.5 for
better comparison.
0 1 2 3 4 50
20
40
60
80
100UO
2.34
UO2.0
1st addition
UO2.0
2nd
addition
UO2.0
3rd addition
Fin
al d
iss
olu
tio
n y
ield
/ %
[H2O
2] / mM
Figure 3.5: Final dissolution yields obtained for both stoichiometric and
hiperstoichiometric powders.
In Figure 3.5, as previously discussed, it can be observed how the
behavior of stoichiometric UO2 approaches the behavior of
hyperstoichiometric UO2 with the consecutive additions of H2O2. For the
lowest H2O2 concentrations, the difference is especially clear where more
consecutive H2O2 additions are required to sufficiently alter the surface
conditions. The general trend is also illustrated in Figures 3.6a and 3.6b.
3. Results and discussion
35
0.0 0.2 0.4 0.60
20
40
60
80
0.0 0.3 0.6 0.90
20
40
60
80
1st addition
2nd
addition
3rd addition
Dis
so
luti
on
yie
ld / %
H2O
2 consumed/ mM
(b) 0.5 mM(a) 0.2 mM
1st addition
2nd
addition
Dis
so
luti
on
yie
ld / %
H2O
2 consumed/ mM
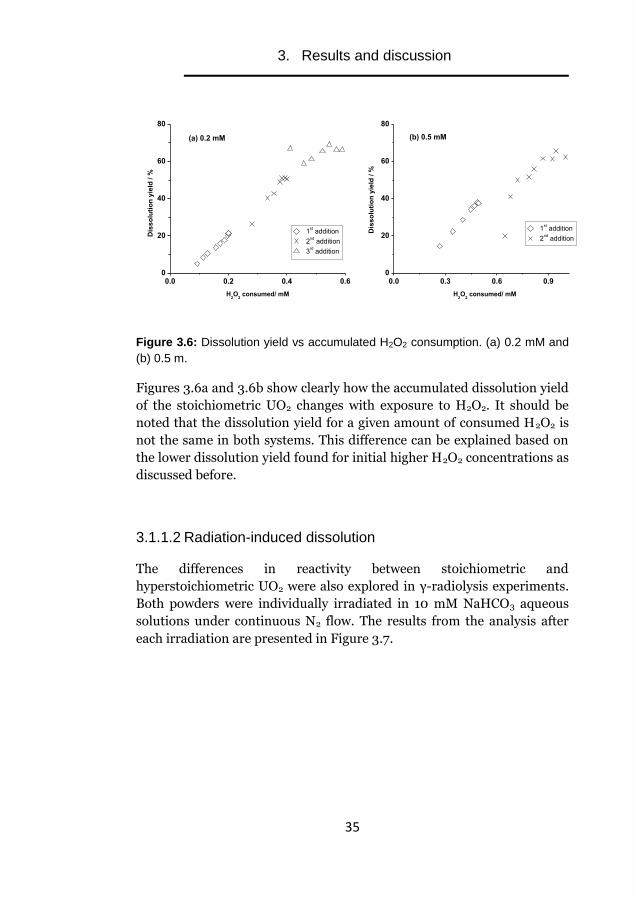
Figure 3.6: Dissolution yield vs accumulated H2O2 consumption. (a) 0.2 mM and
(b) 0.5 m.
Figures 3.6a and 3.6b show clearly how the accumulated dissolution yield
of the stoichiometric UO2 changes with exposure to H2O2. It should be
noted that the dissolution yield for a given amount of consumed H2O2 is
not the same in both systems. This difference can be explained based on
the lower dissolution yield found for initial higher H2O2 concentrations as
discussed before.
3.1.1.2 Radiation-induced dissolution
The differences in reactivity between stoichiometric and
hyperstoichiometric UO2 were also explored in γ-radiolysis experiments.
Both powders were individually irradiated in 10 mM NaHCO3 aqueous
solutions under continuous N2 flow. The results from the analysis after
each irradiation are presented in Figure 3.7.

3. Results and discussion
36
0.0
0.1
0.2
0.3
0.4
0 5 10 15 20 25 30 35
0
5
10
15
UO2.34
UO2.0
U(V
I) / m
M
(a)
(b)
UO2.34
UO2.0
H2O
2 / µ
M
Absorbed Dose / kGy
Figure 3.7: Concentrations of dissolved uranium and accumulated H2O2 as a
function of absorbed dose. The solid to liquid ratio was 10 mg of Uranium oxide
powder to 5 mL of aqueous solution.
As can be seen, the surface stoichiometry of UO2 also has a significant
impact on the radiation-induced dissolution of UO2.
The concentration of uranium in solution from stoichiometric UO2 was
lower than from the hyperstoichiometric counterpart. Furthermore, the
accumulated concentration of H2O2 in the systems containing
hyperstoichiometric UO2 was higher than in the samples containing
stoichiometric UO2. These observations are in perfect agreement with the
results observed in the H2O2 induced dissolution experiments.
3. Results and discussion
37
3.1.1.3 Pellet experiments
Similar experiments were performed on a UO2 pellet by exposing it to
different initial H2O2 concentrations (0.2, 0.5, 1 and 2 mM) in 10 mM
NaHCO3. The results are summarized in Table 3.4.
Table 3.4: Summary of the final dissolution yields for UO2 pellet. S/V= 20 m-1
.
[H2O2] / mM Final dissolution yield
2 14 ± 4%
1 10 ± 2 %
0.5 12 ± 6 %
0.2 16 ± 5 %
The final dissolution yields presented in Table 3.4 are well in line with
previously reported dissolution yields for commercial UO2 pellets [78]. In
contrast to powder experiments, the final dissolution yield for pellets is
significantly lower and no dependence on the initial concentration of
H2O2 was observed.
When comparing the yields obtained for pellets and for powders, it must
be pointed out that the reaction conditions are quite different in the two
cases. The drastic difference in surface area in the two types of
experiments (2 orders of magnitude) is the most noticeable factor. One
implication of this difference is the significant disparity in the time for
completion of the reaction. For pellet experiments, the homogeneous
reactions of H2O2 in solution will have a larger impact than for powder
experiments, considering the longer reaction time needed for completion.
For these systems, the homogeneous decomposition of H2O2 accounts for
approximately 30% of the H2O2 consumption while for the powder
experiments this is reduced to 0.3-3%. Thus, this translates into a greater
reduction in the maximum final dissolution yield for pellets, where the
real value, e.g. accounting for the impact of the homogeneous
consumption of H2O2, is 43% higher than the measured value. Taking this
into consideration, the average measured final dissolution yield for
pellets increases from 11% to 15%. This implies that the homogeneous
reaction is not the sole explanation for the large differences observed
between powders and pellets.
3. Results and discussion
38
As an interesting observation, it must be noted that the final dissolution
yield for pellets and for initial high H2O2 concentrations for powders tend
to converge to similar values (15 % for pellets and 17% for powders with
an initial H2O2 concentration of 5 mM). This could suggest that the
differences observed in dissolution yields between the two materials can
be connected to the great disparity in consumed moles of H2O2/surface
area between pellets and powders. It must be noted that for pellet
experiments, the amount of H2O2 consumed per m2 of UO2 surface is
orders of magnitude higher than for powder experiments.
3.1.2 Integral Burnable Absorbers (IBA): (U, Gd)O2 fuel
The impact of integral burnable absorbers on the oxidative dissolution of
UO2 was studied in an aqueous system. UO2 pellets doped with different
amounts of Gd (3, 4.5 and 8 %wt.) were exposed to H2O2 and radiation-
induced dissolution experiments and their behavior was compared to the
standard UO2 pellet performance.
3.1.2.1 Pellet characterization
The XRD analysis performed on the (U, Gd)O2 pellets indicated the
presence of only one crystalline phase in all samples. These results are
not surprising considering that it has been previously reported that Gd3+
can form a solid solution with UO2 in all composition ranges [79]. The
obtained diffractograms are presented in Figure 3.8:
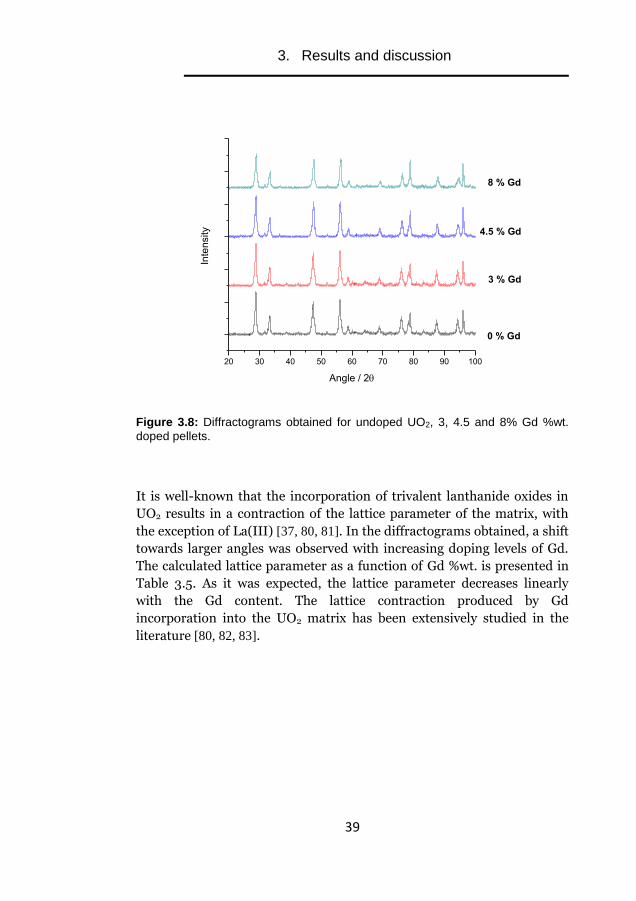
3. Results and discussion
39
20 30 40 50 60 70 80 90 100
8 % Gd
3 % Gd
0 % Gd
4.5 % Gd
Inte
nsity
Angle / 2
Figure 3.8: Diffractograms obtained for undoped UO2, 3, 4.5 and 8% Gd %wt.
doped pellets.
It is well-known that the incorporation of trivalent lanthanide oxides in
UO2 results in a contraction of the lattice parameter of the matrix, with
the exception of La(III) [37, 80, 81]. In the diffractograms obtained, a shift
towards larger angles was observed with increasing doping levels of Gd.
The calculated lattice parameter as a function of Gd %wt. is presented in
Table 3.5. As it was expected, the lattice parameter decreases linearly
with the Gd content. The lattice contraction produced by Gd
incorporation into the UO2 matrix has been extensively studied in the
literature [80, 82, 83].
3. Results and discussion
40
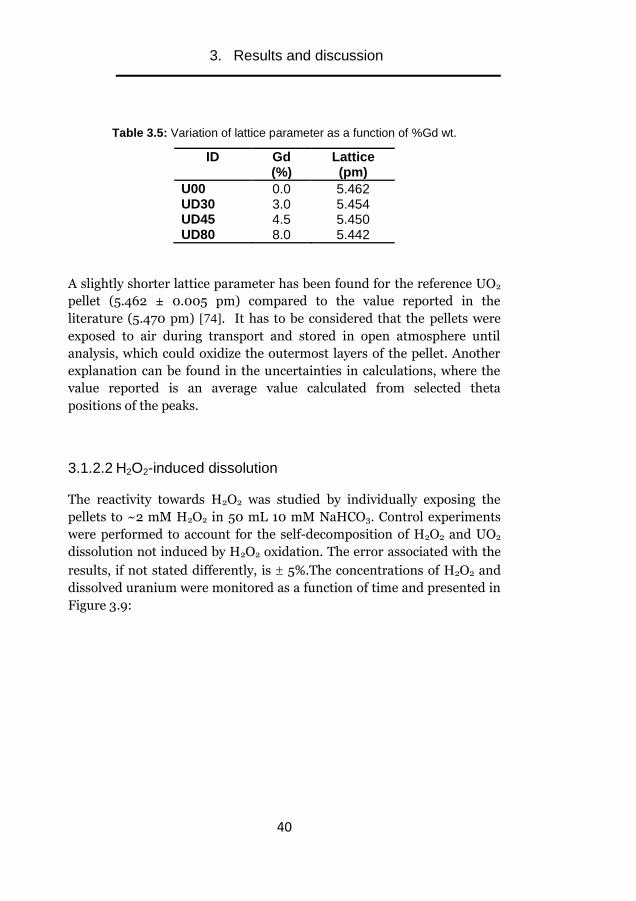
Table 3.5: Variation of lattice parameter as a function of %Gd wt.
ID Gd (%)
Lattice (pm)
U00 0.0 5.462 UD30 3.0 5.454 UD45 4.5 5.450 UD80 8.0 5.442
A slightly shorter lattice parameter has been found for the reference UO2
pellet (5.462 ± 0.005 pm) compared to the value reported in the
literature (5.470 pm) [74]. It has to be considered that the pellets were
exposed to air during transport and stored in open atmosphere until
analysis, which could oxidize the outermost layers of the pellet. Another
explanation can be found in the uncertainties in calculations, where the
value reported is an average value calculated from selected theta
positions of the peaks.
3.1.2.2 H2O2-induced dissolution
The reactivity towards H2O2 was studied by individually exposing the
pellets to ~2 mM H2O2 in 50 mL 10 mM NaHCO3. Control experiments
were performed to account for the self-decomposition of H2O2 and UO2
dissolution not induced by H2O2 oxidation. The error associated with the
results, if not stated differently, is 5%.The concentrations of H2O2 and
dissolved uranium were monitored as a function of time and presented in
Figure 3.9:

3. Results and discussion
41
0 1 2 3 5 6 7
0.0
0.3
0.6
0.9
1.2
1.5
1.8
Gd00
Gd30
Gd45
Gd80
Control
[H2O
2]
/ m
M
Time / days
(a)
0 1 2 3 5 6 7
0
30
60
90
120
150
180
(b)
Gd00
Gd30
Gd45
Gd80
[U(V
I)]
/ µ
M
Time / days
Figure 3.9: (a) H2O2 and (b) dissolved U concentration as a function of reaction
time for the different (U,Gd)O2 pellets. S/V=20m-1
.
As can be seen in Figure 3.9a, two distinguishable trends can be observed.
The standard UO2 is twice as reactive as towards H2O2 compared to (U,
Gd)O2 pellets. Furthermore, the doped pellets display a tendency towards
higher stability against H2O2 with increasing gadolinium content. The
H2O2 consumption rate for the different systems is presented in Table 3.6
for a better comparison:
Table 3.6: Rate of H2O2 consumption for the different systems.
ID
Rate of H2O2 consumption
(mol /m2·s)
U00 1.83×10⁻⁷
UD30 1.03×10
-7
UD45 1.02×10⁻⁷
UD80 8.85×10
-8
Furthermore, in Figure 3.9b it can be observed that the presence of Gd in
the UO2 matrix also dramatically decreases the dissolution of uranium by
3. Results and discussion
42
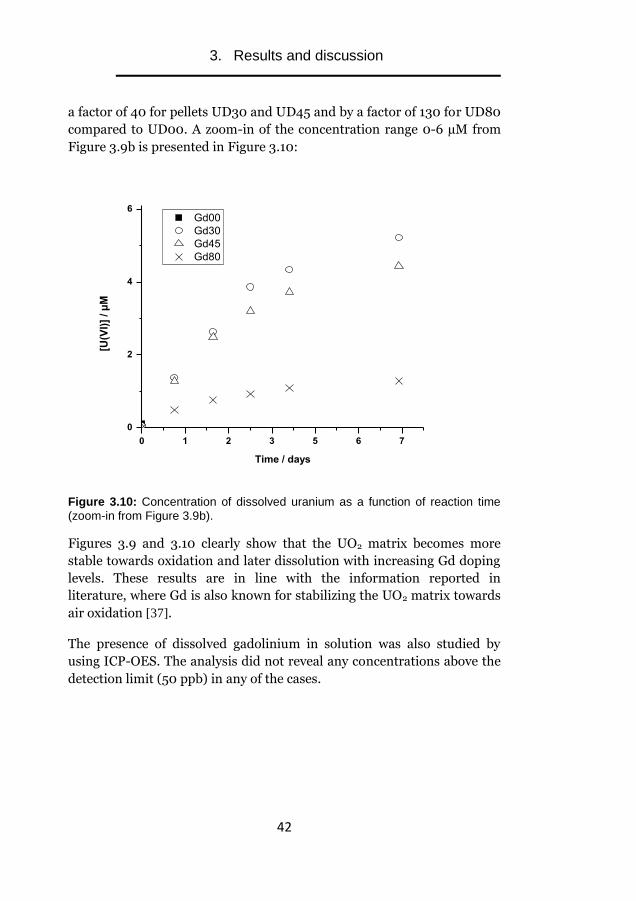
a factor of 40 for pellets UD30 and UD45 and by a factor of 130 for UD80
compared to UD00. A zoom-in of the concentration range 0-6 µM from
Figure 3.9b is presented in Figure 3.10:
0 1 2 3 5 6 7
0
2
4
6 Gd00
Gd30
Gd45
Gd80
[U(V
I)]
/ µ
M
Time / days
Figure 3.10: Concentration of dissolved uranium as a function of reaction time
(zoom-in from Figure 3.9b).
Figures 3.9 and 3.10 clearly show that the UO2 matrix becomes more
stable towards oxidation and later dissolution with increasing Gd doping
levels. These results are in line with the information reported in
literature, where Gd is also known for stabilizing the UO2 matrix towards
air oxidation [37].
The presence of dissolved gadolinium in solution was also studied by
using ICP-OES. The analysis did not reveal any concentrations above the
detection limit (50 ppb) in any of the cases.

3. Results and discussion
43
3.1.2.3 Radiation-induced dissolution
The reactivity of (U,Gd)O2 pellets towards radiolysis products was also
studied by exposing the solutions to γ-radiation. The results are
presented in Figure 3.11:
0 20 40 60
0
20
40
60
80
0 20 40 60
0
2
4
6
[U(V
I)]
/ µ
M
Absorbed dose / kGy
Gd00
Gd30
Gd45
Gd80
[U(V
I)]
/ µ
M
Absorbed dose / kGy
Figure 3.11: Dissolved uranium concentration as a function of absorbed dose.
As can be seen, the dissolution of uranium from the standard UO2 pellet
increases with irradiation dose and it is significantly higher than for
(U,Gd)O2 pellets, which remain at very low concentrations even for
substantial high doses. The accumulated H2O2 concentration in solution
for a given dose was also measured and the results are shown in Figure
3.12:

3. Results and discussion
44
0 20 40 60
0
40
80
120
160
Gd00
Gd30
Gd45
Gd80
[H2O
2]
/ µ
M
Absorbed dose / kGy
Figure 3.12: H2O2 concentration in solution as a function of absorbed dose.
It can be seen that the H2O2 concentration for the standard UO2 system is
one order of magnitude lower than for the (U,Gd)O2 fuel. This behavior is
well in line with the observed higher stability of the doped fuel towards
H2O2 in Figure 3.9, facilitating a higher accumulation of the oxidant in
the solution due to a slower H2O2 consumption rate.
Interestingly, the difference in uranium release between the standard and
(U,Gd)O2 pellets is more pronounced in the radiation-induced dissolution
experiments than in the H2O2 induced dissolution experiments. This
contrast the observations made for SIMFUEL, where the opposite
behavior was found. This implies that a change in redox reactivity upon
doping is not enough to completely explain the reactivity of (U,Gd)O2
pellets. It should be noted that it has previously been reported that UO2
pellets doped with Gd could result in a material capable of catalyzing the
surface reduction of U(VI) to U(VI) by H2 [84].
SEM images of the standard UO2 pellet and the (U, Gd)O2 pellets can be
found in the supplementary information for Paper V. No visible
differences between the pellets were observed before oxidative
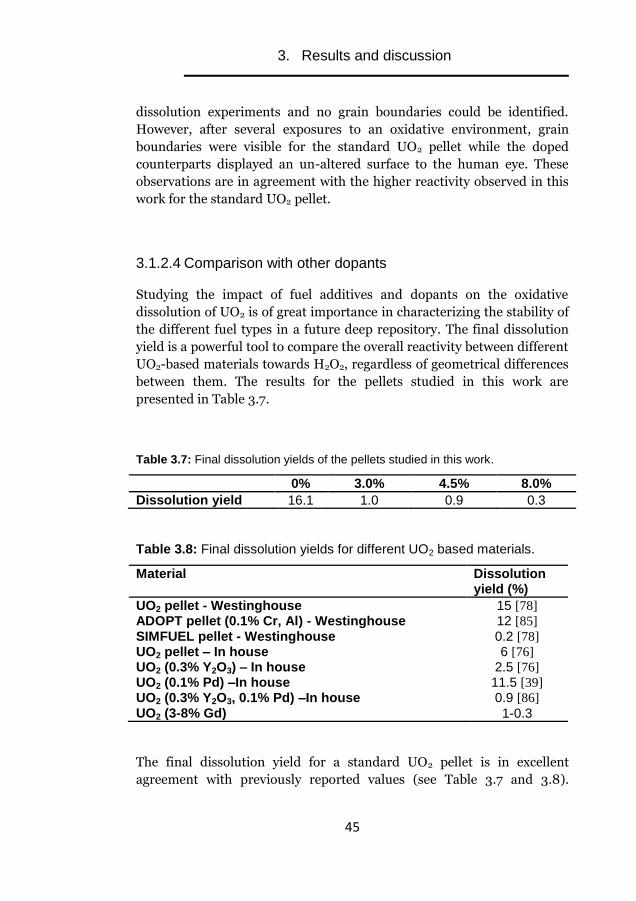
3. Results and discussion
45
dissolution experiments and no grain boundaries could be identified.
However, after several exposures to an oxidative environment, grain
boundaries were visible for the standard UO2 pellet while the doped
counterparts displayed an un-altered surface to the human eye. These
observations are in agreement with the higher reactivity observed in this
work for the standard UO2 pellet.
3.1.2.4 Comparison with other dopants
Studying the impact of fuel additives and dopants on the oxidative
dissolution of UO2 is of great importance in characterizing the stability of
the different fuel types in a future deep repository. The final dissolution
yield is a powerful tool to compare the overall reactivity between different
UO2-based materials towards H2O2, regardless of geometrical differences
between them. The results for the pellets studied in this work are
presented in Table 3.7.
Table 3.7: Final dissolution yields of the pellets studied in this work.
0% 3.0% 4.5% 8.0%
Dissolution yield 16.1 1.0 0.9 0.3
Table 3.8: Final dissolution yields for different UO2 based materials.
Material Dissolution yield (%)
UO2 pellet - Westinghouse 15 [78] ADOPT pellet (0.1% Cr, Al) - Westinghouse 12 [85] SIMFUEL pellet - Westinghouse 0.2 [78] UO2 pellet – In house 6 [76] UO2 (0.3% Y2O3) – In house 2.5 [76] UO2 (0.1% Pd) –In house 11.5 [39] UO2 (0.3% Y2O3, 0.1% Pd) –In house 0.9 [86] UO2 (3-8% Gd) 1-0.3
The final dissolution yield for a standard UO2 pellet is in excellent
agreement with previously reported values (see Table 3.7 and 3.8).

3. Results and discussion
46
Furthermore, the addition of Gd in the fuel matrix caused a dramatic
decrease on the H2O2 fraction that reacted via oxidation with UO2.
In general, based on the data from Table 3.8, it can be concluded that
small additions of specific dopants in the UO2 matrix result in a
significant change in stability towards oxidation. The extent of the
stabilization of the matrix will depend on the doping level and type of
dopant among other parameters. Nevertheless, comparisons between in-
house and professionally-made UO2 pellets (e.g. Westinghouse pellets)
must be carefully addressed. The differences in sintering conditions,
method and sample preparation could lead to disparities in reactivity that
cannot solely be attributed to differences in composition.
Finally, from a repository point of view, the results obtained in this thesis
for (U, Gd)O2 fuel would suggest a reduced dissolution rate of uranium
dissolution in case of canister failure compared to standard UO2. In a
recent work, the leaching behavior in simplified groundwater under
aerated conditions of three different irradiated fuels (UO2, ADOPT and
(U,Gd)O2) with similar burnup was studied [87]. It is interesting to note
that the small difference in dissolution behavior between unirradiated
standard UO2 and ADOPT fuel is also reflected in the experiments with
spent nuclear fuel. However, the dramatic differences observed in the
present work between standard UO2 and (U,Gd)O2 is clearly reduced for
the irradiated fuels. Thus it seems reasonable to suggest that the effect of
fission products in spent nuclear is sufficient to stabilize the UO2 matrix
to levels where a higher few percent of initial doping level would have a
minimum effect on the leaching behavior.

3. Results and discussion
47
3.2 The effect of external factors on the oxidative
dissolution of UO2
3.2.1 H2 / O2
As previously described in the Introduction, several mechanisms have
been proposed to explain the so-called “hydrogen effect”. The hypothesis
of reactive hydrogen atoms adsorbed on the UO2 surface has been
suggested by several authors as one of such mechanisms. These surface-
bound H atoms could be reactive towards other species and therefore
influence the chemistry at the UO2 surface by scavenging oxidants or
reducing oxidized uranium. It must be noted that as of today, the
existence of this reaction has not been proven. It has been reported that
H2 can undergo homolytic dissociation on dry surfaces [88-90] but this
process has yet to be observed in aqueous chemistry.
The reactivity of adsorbed hydrogen atoms on an oxide surface was
studied by using Tris as a probe for surface-bound radicals. Experiments
with aqueous metal-oxide suspensions in the presence of H2 were
performed. If H2 undergoes cleavage on the oxide surface and the
resulting adsorbed H atoms are reactive, formation of formaldehyde in
the system should be observed.
The experiments were initially performed on ZrO2. Given that the
zirconium in ZrO2 is in its highest oxidation state, no redox reactions will
be involved. ZrO2 has been successfully used in previous works to study
reactions of relevance on UO2, i.e. the catalytic decomposition of H2O2
[34]. A follow-up study on UO2 was then performed.
In view of the results obtained, the reaction of H2 and O2 dissolved in
water was also studied for both oxides. The possible formation of H2O2 in
this system was monitored.
3.2.1.1 ZrO2
As described in section 2.3.4, hydrogen-abstracting radicals formed on
the surface should yield formaldehyde in the presence of Tris. The
formaldehyde production in aqueous solution containing ZrO2 powder,
Tris and H2 (40 bar) was monitored. The aim of this experiment was to
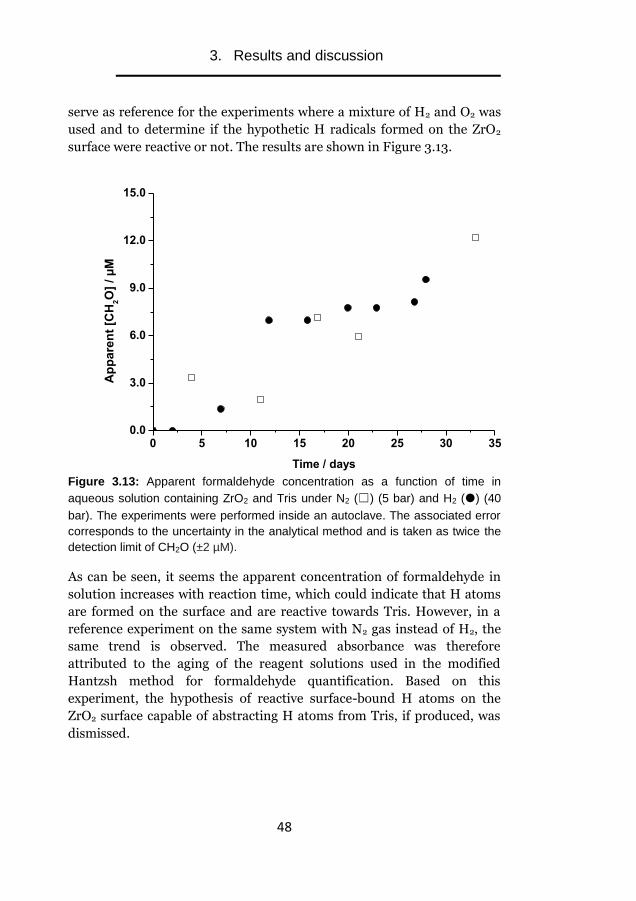
3. Results and discussion
48
serve as reference for the experiments where a mixture of H2 and O2 was
used and to determine if the hypothetic H radicals formed on the ZrO2
surface were reactive or not. The results are shown in Figure 3.13.
0 5 10 15 20 25 30 350.0
3.0
6.0
9.0
12.0
15.0
Ap
pare
nt
[CH
2O
] /
µM
Time / days
Figure 3.13: Apparent formaldehyde concentration as a function of time in
aqueous solution containing ZrO2 and Tris under N2 (☐) (5 bar) and H2 () (40
bar). The experiments were performed inside an autoclave. The associated error
corresponds to the uncertainty in the analytical method and is taken as twice the
detection limit of CH2O (±2 µM).
As can be seen, it seems the apparent concentration of formaldehyde in
solution increases with reaction time, which could indicate that H atoms
are formed on the surface and are reactive towards Tris. However, in a
reference experiment on the same system with N2 gas instead of H2, the
same trend is observed. The measured absorbance was therefore
attributed to the aging of the reagent solutions used in the modified
Hantzsh method for formaldehyde quantification. Based on this
experiment, the hypothesis of reactive surface-bound H atoms on the
ZrO2 surface capable of abstracting H atoms from Tris, if produced, was
dismissed.
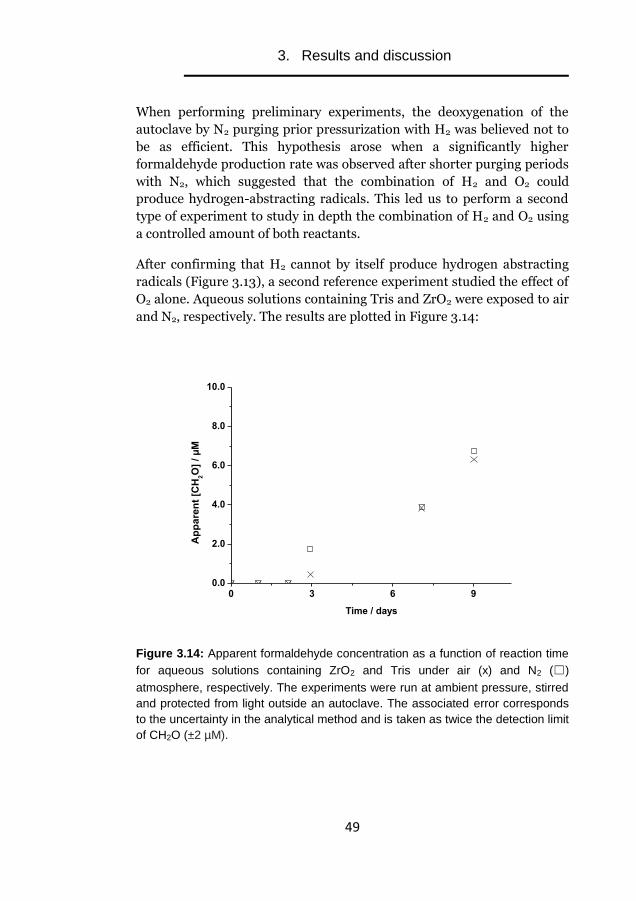
3. Results and discussion
49
When performing preliminary experiments, the deoxygenation of the
autoclave by N2 purging prior pressurization with H2 was believed not to
be as efficient. This hypothesis arose when a significantly higher
formaldehyde production rate was observed after shorter purging periods
with N2, which suggested that the combination of H2 and O2 could
produce hydrogen-abstracting radicals. This led us to perform a second
type of experiment to study in depth the combination of H2 and O2 using
a controlled amount of both reactants.
After confirming that H2 cannot by itself produce hydrogen abstracting
radicals (Figure 3.13), a second reference experiment studied the effect of
O2 alone. Aqueous solutions containing Tris and ZrO2 were exposed to air
and N2, respectively. The results are plotted in Figure 3.14:
0 3 6 90.0
2.0
4.0
6.0
8.0
10.0
Ap
pare
nt
[CH
2O
] /
µM
Time / days
Figure 3.14: Apparent formaldehyde concentration as a function of reaction time
for aqueous solutions containing ZrO2 and Tris under air (x) and N2 (☐)
atmosphere, respectively. The experiments were run at ambient pressure, stirred
and protected from light outside an autoclave. The associated error corresponds
to the uncertainty in the analytical method and is taken as twice the detection limit
of CH2O (±2 µM).
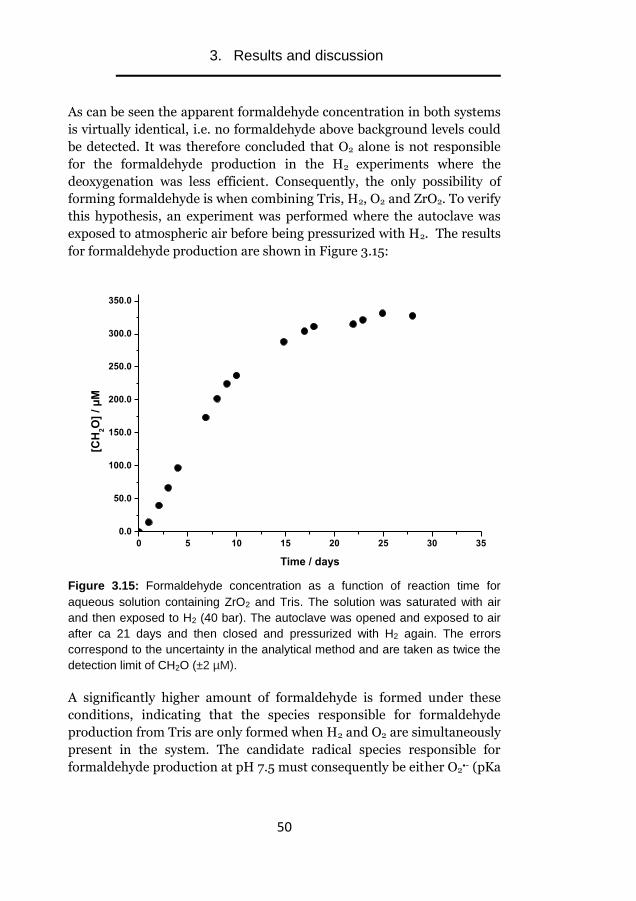
3. Results and discussion
50
As can be seen the apparent formaldehyde concentration in both systems
is virtually identical, i.e. no formaldehyde above background levels could
be detected. It was therefore concluded that O2 alone is not responsible
for the formaldehyde production in the H2 experiments where the
deoxygenation was less efficient. Consequently, the only possibility of
forming formaldehyde is when combining Tris, H2, O2 and ZrO2. To verify
this hypothesis, an experiment was performed where the autoclave was
exposed to atmospheric air before being pressurized with H2. The results
for formaldehyde production are shown in Figure 3.15:
0 5 10 15 20 25 30 35
0.0
50.0
100.0
150.0
200.0
250.0
300.0
350.0
[CH
2O
] /
µM
Time / days
Figure 3.15: Formaldehyde concentration as a function of reaction time for
aqueous solution containing ZrO2 and Tris. The solution was saturated with air
and then exposed to H2 (40 bar). The autoclave was opened and exposed to air
after ca 21 days and then closed and pressurized with H2 again. The errors
correspond to the uncertainty in the analytical method and are taken as twice the
detection limit of CH2O (±2 µM).
A significantly higher amount of formaldehyde is formed under these
conditions, indicating that the species responsible for formaldehyde
production from Tris are only formed when H2 and O2 are simultaneously
present in the system. The candidate radical species responsible for
formaldehyde production at pH 7.5 must consequently be either O2•- (pKa

3. Results and discussion
51
4.8) or HO• (adsorbed H• is ruled out on the basis of the results obtained
in Figure 3.13). To investigate the nature of the species responsible for
formaldehyde production, the concentration of H2O2 in the system was
measured since one of the candidate radicals, HO•, is formed upon
catalytic decomposition of H2O2. The results are presented in Figure 3.16:
0
25
50
75
100
125
0 5 10 15 20 25 300
10
20
30
[H2O
2]
/ µ
M
(a)
(b)
r /
µm
ol
day
-1
Time / days
Figure 3.16: (a) H2O2 concentration as a function of time for an air saturated
aqueous solution containing ZrO2 and Tris pressurized with H2 (40 bar). The
autoclave was opened and exposed to air after ca 21 days and then closed and
pressurized with H2 again. (b) Rate of formaldehyde production plotted as a
function of reaction time (based on data in Figure 3.15). The error associated with
the results is 10%.
As can be seen, H2O2 is clearly produced in the H2/O2/ZrO2 system.
Furthermore, when comparing Figures 3.15 and 3.16a the dynamics of
H2O2 and formaldehyde concentration seem to follow each other. The
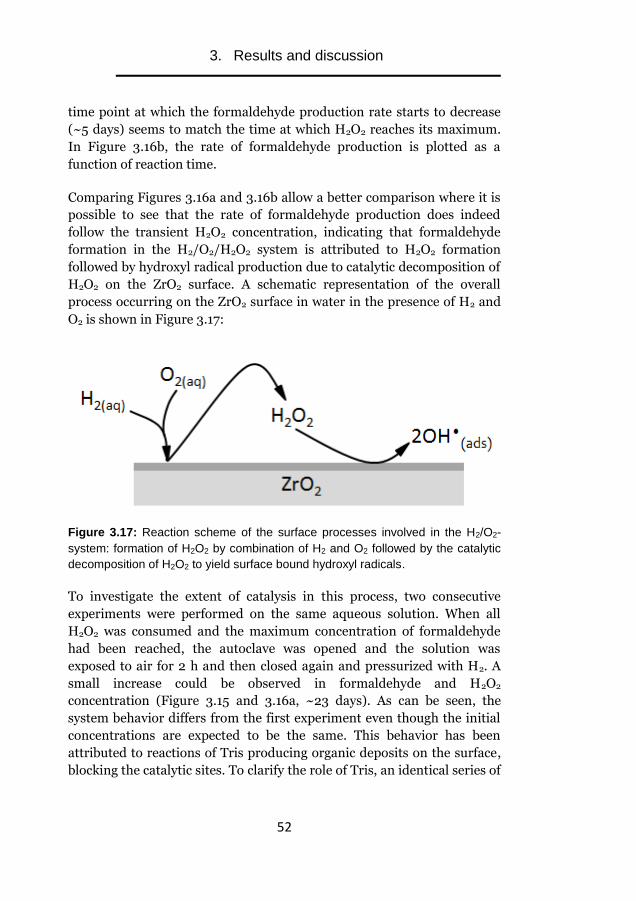
3. Results and discussion
52
time point at which the formaldehyde production rate starts to decrease
(~5 days) seems to match the time at which H2O2 reaches its maximum.
In Figure 3.16b, the rate of formaldehyde production is plotted as a
function of reaction time.
Comparing Figures 3.16a and 3.16b allow a better comparison where it is
possible to see that the rate of formaldehyde production does indeed
follow the transient H2O2 concentration, indicating that formaldehyde
formation in the H2/O2/H2O2 system is attributed to H2O2 formation
followed by hydroxyl radical production due to catalytic decomposition of
H2O2 on the ZrO2 surface. A schematic representation of the overall
process occurring on the ZrO2 surface in water in the presence of H2 and
O2 is shown in Figure 3.17:
Figure 3.17: Reaction scheme of the surface processes involved in the H2/O2-
system: formation of H2O2 by combination of H2 and O2 followed by the catalytic
decomposition of H2O2 to yield surface bound hydroxyl radicals.
To investigate the extent of catalysis in this process, two consecutive
experiments were performed on the same aqueous solution. When all
H2O2 was consumed and the maximum concentration of formaldehyde
had been reached, the autoclave was opened and the solution was
exposed to air for 2 h and then closed again and pressurized with H2. A
small increase could be observed in formaldehyde and H2O2
concentration (Figure 3.15 and 3.16a, ~23 days). As can be seen, the
system behavior differs from the first experiment even though the initial
concentrations are expected to be the same. This behavior has been
attributed to reactions of Tris producing organic deposits on the surface,
blocking the catalytic sites. To clarify the role of Tris, an identical series of

3. Results and discussion
53
consecutive experiments was performed in the absence of Tris. In this
system, only the time-dependent H2O2 concentration is obtained and
presented in Figure 3.18:
0 10 20 30 40 500
20
40
60
80
[H2O
2]
/ µ
M
Time / days
Figure 3.18: H2O2 concentration as a function of time for an air-saturated
aqueous solution containing ZrO2 pressurized with H2 (40 bar). The autoclave
was opened and exposed to air after ca 35 days and then closed and pressurized
with H2 again. The error associated with the results is 10 %.
When no Tris is present, the maximum H2O2 concentration in the second
experiment (after exposing the system to air again after oxygen depletion)
is very close to the maximum H2O2 concentration in the first experiment.
Furthermore, the dynamics of the two transients are very similar. This
observation strengthens the assumption that the non-reproducibility
observed in the system containing Tris is attributed to organic deposits
from Tris blocking the catalytic sites. The reason for the transient
behavior of H2O2 and deceleration of Tris production rate is the limited
amount of O2 present in the system.
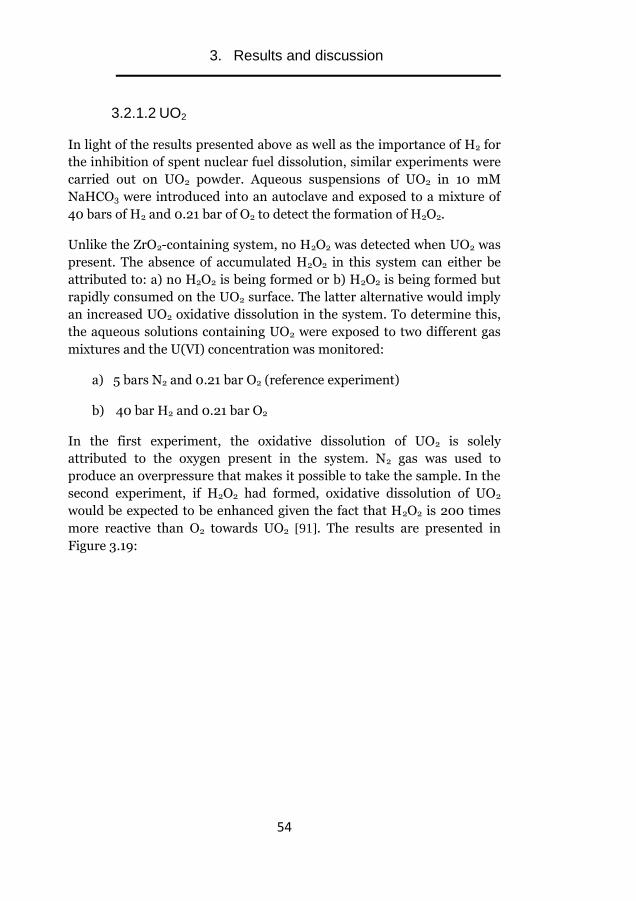
3. Results and discussion
54
3.2.1.2 UO2
In light of the results presented above as well as the importance of H2 for
the inhibition of spent nuclear fuel dissolution, similar experiments were
carried out on UO2 powder. Aqueous suspensions of UO2 in 10 mM
NaHCO3 were introduced into an autoclave and exposed to a mixture of
40 bars of H2 and 0.21 bar of O2 to detect the formation of H2O2.
Unlike the ZrO2-containing system, no H2O2 was detected when UO2 was
present. The absence of accumulated H2O2 in this system can either be
attributed to: a) no H2O2 is being formed or b) H2O2 is being formed but
rapidly consumed on the UO2 surface. The latter alternative would imply
an increased UO2 oxidative dissolution in the system. To determine this,
the aqueous solutions containing UO2 were exposed to two different gas
mixtures and the U(VI) concentration was monitored:
a) 5 bars N2 and 0.21 bar O2 (reference experiment)
b) 40 bar H2 and 0.21 bar O2
In the first experiment, the oxidative dissolution of UO2 is solely
attributed to the oxygen present in the system. N2 gas was used to
produce an overpressure that makes it possible to take the sample. In the
second experiment, if H2O2 had formed, oxidative dissolution of UO2
would be expected to be enhanced given the fact that H2O2 is 200 times
more reactive than O2 towards UO2 [91]. The results are presented in
Figure 3.19:
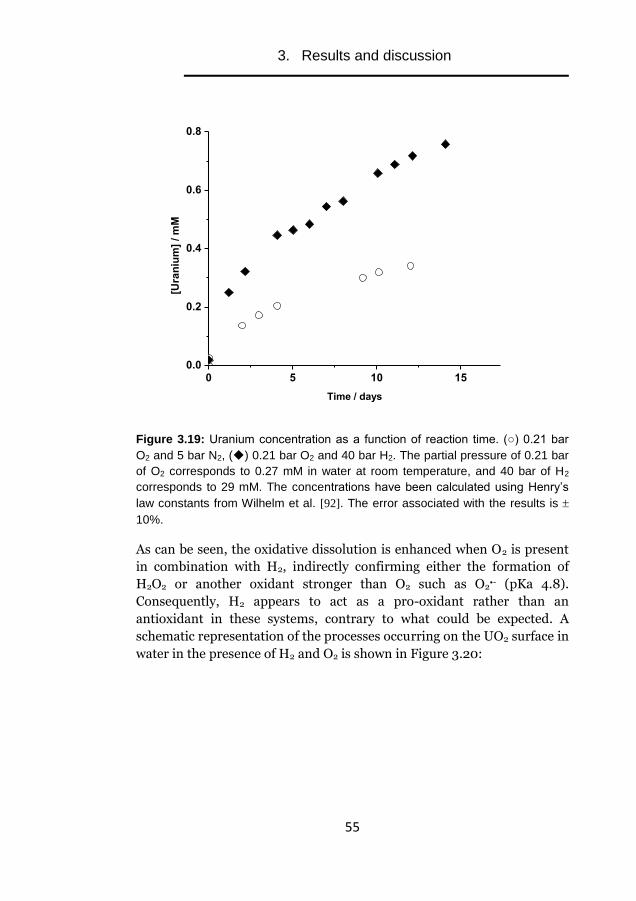
3. Results and discussion
55
0 5 10 150.0
0.2
0.4
0.6
0.8
[Ura
niu
m]
/ m
M
Time / days
Figure 3.19: Uranium concentration as a function of reaction time. (○) 0.21 bar
O2 and 5 bar N2, () 0.21 bar O2 and 40 bar H2. The partial pressure of 0.21 bar
of O2 corresponds to 0.27 mM in water at room temperature, and 40 bar of H2
corresponds to 29 mM. The concentrations have been calculated using Henry’s
law constants from Wilhelm et al. [92]. The error associated with the results is
10%.
As can be seen, the oxidative dissolution is enhanced when O2 is present
in combination with H2, indirectly confirming either the formation of
H2O2 or another oxidant stronger than O2 such as O2•- (pKa 4.8).
Consequently, H2 appears to act as a pro-oxidant rather than an
antioxidant in these systems, contrary to what could be expected. A
schematic representation of the processes occurring on the UO2 surface in
water in the presence of H2 and O2 is shown in Figure 3.20:
3. Results and discussion
56
Figure 3.20: Reaction scheme of the surface processes involved in the H2/O2-
system: (a) formation of H2O2 by combination of H2 and O2; (b) catalytic
decomposition of H2O2 and (c) oxidation of U(IV) to U(VI).
Interestingly, Haschke et al. [93] made similar observations in a system
where the interaction of PuO2 with a H2/O2 mixture at room temperature
was studied. In the referred study, PuO2 also showed the ability to
catalyze the combination of O2 and H2 on the metal-oxide surface yielding
H2O as a product and consequently observing a continuous pressure
decrease in the gas mixture (initially 2:1 H2:O2). However, the observed
oxidation of PuO2 to PuO2+x was in that case interpreted as a consequence
of the water-catalyzed PuO2 + O2 reaction. It must be noted that there are
some important differences between the system studied by Haschke and
the system in this thesis. In Haschke’s case, the reaction was not studied
in an aqueous phase but rather in a gas phase; furthermore, PuO2 is more
radioactive than UO2, which would imply the contribution of some
radiation chemistry in the mechanism.
Although the present results seem to shake the foundation of the
inhibition effect of hydrogen, the practical implications of this finding are
relatively minor. In a future deep repository under reducing conditions,
O2 will be produced both as a secondary aqueous radiolysis product and
by catalytic decomposition of H2O2. Furthermore, this process will
increase the overall efficiency of radiation-induced oxidative dissolution
of UO2 since O2 formed in the catalytic decomposition of H2O2 could be
converted back to H2O2. However, this effect is expected to be largely
overshadowed by the noble metal particle catalyzed reduction of U(VI) by
H2.
(c) (b)
2OH- H2O2
O2(aq) H2(aq)
UO2
U(IV) U(VI)
2OH• (ads)
(a)

3. Results and discussion
57
3.2.2 Sulfide
The impact of groundwater composition was studied by analyzing the
impact of H2S/HS- on the oxidative dissolution of UO2 in both H2O2 and
radiation-induced dissolution experiments. The typical error associated
with the results, if not stated differently, is 10%.
3.2.2.1 H2O2-induced dissolution
It has previously been reported in the literature that H2S reacts with H2O2
(reactions 3.2 and 3.3) as well as other radiolytic oxidants.
H+ + HS− + H2O2 →
1
8S80 + 2H2O (3.2)
HS− + 4H2O2 → SO4
2− + 4H2O+ H+ (3.3)
A series of experiments have been performed where H2O2 concentration
was monitored as a function of reaction time for different sulfide
concentrations. The results are shown in Figure 3.21:
Figure 3.21: H2O2 concentration plotted against reaction time for different H2S/HS
- concentrations (0.1, 0.5 and 1 mM).
0 5 10 15 20 25 30
0.0
0.5
1.0
1.5
2.0
2.5
3.0
0.1 mM H2S
0.5 mM H2S
1 mM H2S
H2O
2 / m
M
Time / min

3. Results and discussion
58
As can be seen, H2O2 reacted rapidly with sulfide, which is in line with the
reported rate constant 0.5 M-1 s-1 [94-96]. The stoichiometry for the
reaction between H2O2 and sulfide was found to be 3:1, which is in
agreement with the reported ratio [96]. Therefore, sulfide seems an
efficient oxidant scavenger and the rate of oxidative dissolution of UO2 is
expected to be reduced in the presence of sulfide. For comparison, Fe2+ in
groundwater will also react with H2O2 via Fenton reaction, with a rate
constant of 76 M-1 s-1 [97]. Taking into consideration a difference of two
orders of magnitude between the two rate constants, the impact of sulfide
on the steady state concentration of H2O2 in a deep repository is expected
to be much less pronounced than the impact of iron, which in addition
will be present in higher concentrations due to the cast iron insert of the
canister.
Sulfide can also reduce aqueous U(VI) to U(IV) [98] according to reaction
3.4:
UO22+ + HS−
→ UO2 + S
0 + H+ (3.4)
3.2.2.2 Radiation-induced dissolution
The effect of sulfide on radiation-induced dissolution of UO2 was studied
by performing three series of experiments: a reference experiment where
a UO2 pellet was immersed in 10 mM NaHCO3 without added sulfide and
two series using an initial concentration of 1 and 2 mM H2S. It must be
noted that every irradiation point corresponds to a unique experiment to
avoid disturbances of the system by sampling. The results are shown in
Figure 3.22:
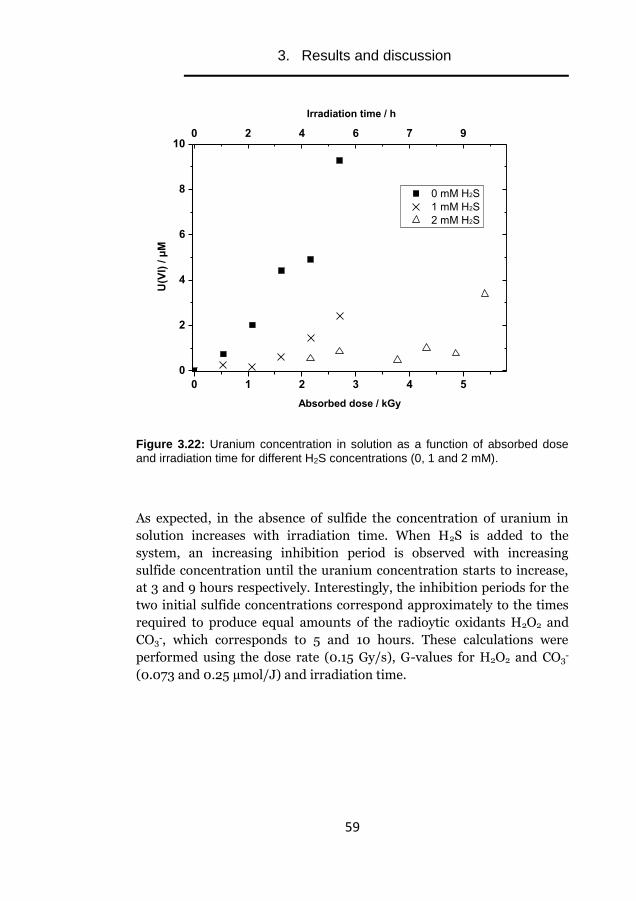
3. Results and discussion
59
0 1 2 3 4 5
0
2
4
6
8
100 2 4 6 7 9
Irradiation time / h
0 mM H2S
1 mM H2S
2 mM H2S
U(V
I) / µ
M
Absorbed dose / kGy
Figure 3.22: Uranium concentration in solution as a function of absorbed dose
and irradiation time for different H2S concentrations (0, 1 and 2 mM).
As expected, in the absence of sulfide the concentration of uranium in
solution increases with irradiation time. When H2S is added to the
system, an increasing inhibition period is observed with increasing
sulfide concentration until the uranium concentration starts to increase,
at 3 and 9 hours respectively. Interestingly, the inhibition periods for the
two initial sulfide concentrations correspond approximately to the times
required to produce equal amounts of the radioytic oxidants H2O2 and
CO3-, which corresponds to 5 and 10 hours. These calculations were
performed using the dose rate (0.15 Gy/s), G-values for H2O2 and CO3-
(0.073 and 0.25 µmol/J) and irradiation time.

3. Results and discussion
60
3.2.2.3 Elucidating the possible poisoning effect of H2S on Pd
As previously discussed, H2 is known to have an important impact on the
oxidative dissolution of UO2. The dominating effect is solid phase
reduction of U(VI) catalyzed by galvanically coupled ε-particles which can
completely inhibit radiation-induced dissolution of spent nuclear fuel.
The possible poisoning effect of catalytic noble metal inclusions by sulfide
in the presence of H2 was studied by using Pd-powder as model. A series
of autoclave experiments were performed on a glass vessel containing 150
µM U(VI) and 4 mM NaHCO3 solution to study the individual and
combined effects. The series of experiments performed are summarized
in Table 3.9:
Table 3.9: Summary of the different experiments performed inside an autoclave.
Exp. Gas H2S Pd
1) 20 bar H2 - -
2) 1.5 bar N2 2 mM -
3) 20 bar H2 2 mM -
4) 20 bar H2 1 mM -
5) 20 bar H2 - 10 mg
6) 20 bar H2 1 mM 10 mg
The results of the experimental series are shown in Figure 3.23:

3. Results and discussion
61
0 2 4 6 80
30
60
90
120
150
20 bar H2 (1)
20 bar H2 / 1 mM H2S (4)
20 bar H2 / 2 mM H2S (3)
1.5 bar N2 / 2 mM H2S (2)
20 bar H2 / Pd(5)
20 bar H2 / 1 mM H2S / Pd (6)
U(V
I) / µ
M
Time / h
Figure 3.23: U(VI) concentration in solution versus reaction time for the different
conditions specified in Table 3.9.
From the results obtained, several insights can be extracted:
i. When the solution is exposed to H2 in absence of Pd and sulfide, the
concentration of U(VI) in solution remained fairly constant. This is in
agreement with previous studies where it was reported that the
presence of a catalyst is necessary to reduce U(VI) by H2 [42, 84].
ii. Similar reduction rates were observed for experiments 2, 3 and 4,
indicating that the reducing ability of H2S/HS- is not influenced by the
presence of H2.
iii. When Pd is added to the system in the presence of H2 the concentration
of U(VI) is drastically reduced, as expected from previous experiments
under similar conditions [42]. It is interesting to note that the reduction
rates for the experiments with Pd in presence and absence of sulfide are
very similar (experiments 5 and 6).
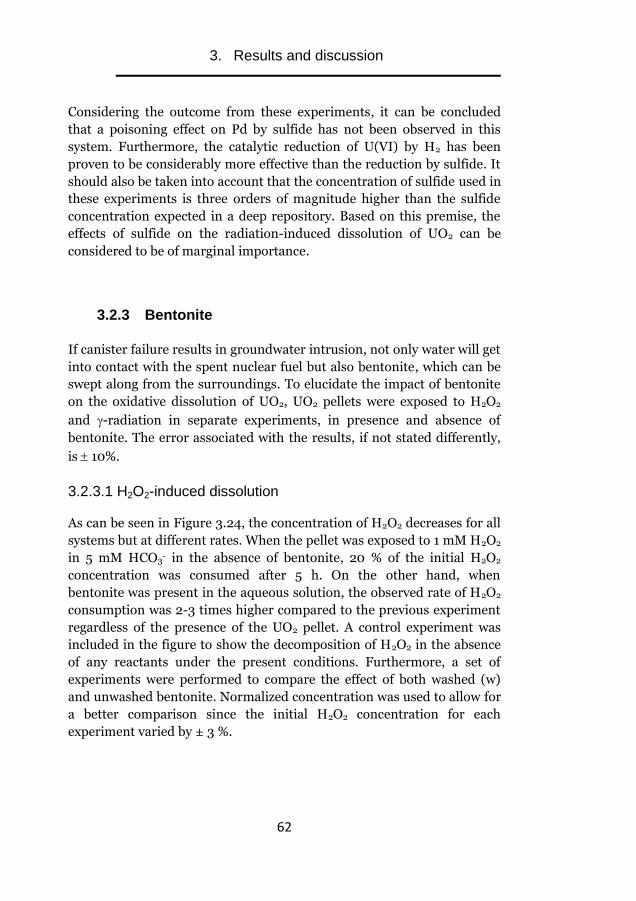
3. Results and discussion
62
Considering the outcome from these experiments, it can be concluded
that a poisoning effect on Pd by sulfide has not been observed in this
system. Furthermore, the catalytic reduction of U(VI) by H2 has been
proven to be considerably more effective than the reduction by sulfide. It
should also be taken into account that the concentration of sulfide used in
these experiments is three orders of magnitude higher than the sulfide
concentration expected in a deep repository. Based on this premise, the
effects of sulfide on the radiation-induced dissolution of UO2 can be
considered to be of marginal importance.
3.2.3 Bentonite
If canister failure results in groundwater intrusion, not only water will get
into contact with the spent nuclear fuel but also bentonite, which can be
swept along from the surroundings. To elucidate the impact of bentonite
on the oxidative dissolution of UO2, UO2 pellets were exposed to H2O2
and -radiation in separate experiments, in presence and absence of
bentonite. The error associated with the results, if not stated differently,
is 10%.
3.2.3.1 H2O2-induced dissolution
As can be seen in Figure 3.24, the concentration of H2O2 decreases for all
systems but at different rates. When the pellet was exposed to 1 mM H2O2
in 5 mM HCO3- in the absence of bentonite, 20 % of the initial H2O2
concentration was consumed after 5 h. On the other hand, when
bentonite was present in the aqueous solution, the observed rate of H2O2
consumption was 2-3 times higher compared to the previous experiment
regardless of the presence of the UO2 pellet. A control experiment was
included in the figure to show the decomposition of H2O2 in the absence
of any reactants under the present conditions. Furthermore, a set of
experiments were performed to compare the effect of both washed (w)
and unwashed bentonite. Normalized concentration was used to allow for
a better comparison since the initial H2O2 concentration for each
experiment varied by ± 3 %.

3. Results and discussion
63
0 1 2 3 4 50.0
0.2
0.4
0.6
0.8
1.0 Reference
UO2 pellet
Bentonite
Bentonite (w)
Bentonite + UO2 Pellet
Bentonite (w) + UO2 Pellet
[H2O
2]/
[H2O
2] 0
Time / h
Figure 3.24: Normalized concentration of H2O2 plotted against reaction time.
The higher consumption rate of H2O2 in the systems containing bentonite
can be explained by the reaction with Fe coming from the clay, either as
surface-bound or dissolved Fe(II) [99]. The Fenton reaction has been
proposed as the major decomposition path for H2O2 in these systems
(Reaction 3.5) [100].
Fe2+ + H2O2 → Fe3+ + HO• + HO− (3.5)
In treated bentonite, where the organic matter has been previously
oxidized or removed, the decomposition of H2O2 is expected to be slower
[100]. This can be attributed to the absence of organic matter that can
uphold the catalytic cycle of Fe(II)/Fe(III), where a reducing organic
radical would reduce Fe(III) back to Fe(II). However, a difference
between washed and unwashed bentonite was not observed in this work.
It should be noted that the difference observed in the previous study
involved a much more thoroughly washed bentonite.
Another possible consumption pathway of H2O2 in presence of bentonite
can be via catalytic decomposition on oxide surfaces [31, 33, 99]. The
radicals formed would also participate in the catalytic cycle contributing
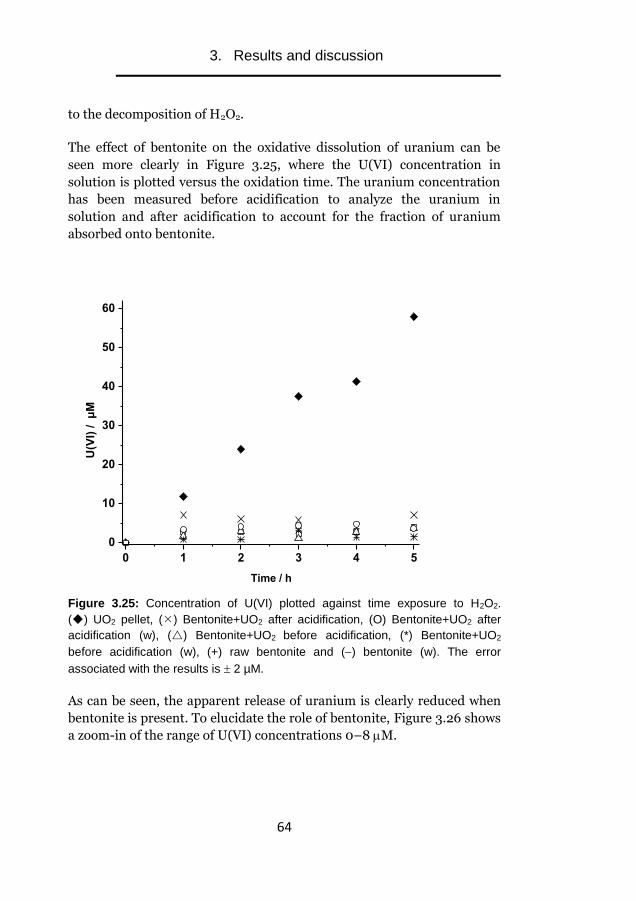
3. Results and discussion
64
to the decomposition of H2O2.
The effect of bentonite on the oxidative dissolution of uranium can be
seen more clearly in Figure 3.25, where the U(VI) concentration in
solution is plotted versus the oxidation time. The uranium concentration
has been measured before acidification to analyze the uranium in
solution and after acidification to account for the fraction of uranium
absorbed onto bentonite.
0 1 2 3 4 5
0
10
20
30
40
50
60
U(V
I) / µ
M
Time / h
Figure 3.25: Concentration of U(VI) plotted against time exposure to H2O2.
() UO2 pellet, () Bentonite+UO2 after acidification, (O) Bentonite+UO2 after
acidification (w), () Bentonite+UO2 before acidification, (*) Bentonite+UO2
before acidification (w), (+) raw bentonite and () bentonite (w). The error
associated with the results is 2 µM.
As can be seen, the apparent release of uranium is clearly reduced when
bentonite is present. To elucidate the role of bentonite, Figure 3.26 shows
a zoom-in of the range of U(VI) concentrations 0–8 M.

3. Results and discussion
65
0 1 2 3 4 5
0
2
4
6
8
U(V
I) / µ
M
Time / h
Figure 3.26: Concentration of U(VI) plotted against time exposure to H2O2
(zoom-in from Figure 3.25). The error associated with the results is 2 µM.
Acidification of the reference sample containing only bentonite revealed a
low amount of uranium present in the clay. When the aqueous solution
containing UO2 was irradiated in the presence of bentonite, the measured
uranium concentration in solution was remarkably low. After
acidification of the sample, it was found that some uranium released from
the pellet was absorbed onto bentonite. The amount of uranyl ions
absorbed onto bentonite depends on many different parameters such as
pH, the initial uranium concentration, and presence of ligands [101, 102].
The same trend was observed for both unwashed and washed bentonite,
and therefore the effect cannot be attributed to any soluble impurities
present in bentonite.
When comparing Figures 3.24, 3.25 and 3.26, the rate of H2O2 consumption is 2–3 times higher in the presence of bentonite while the
rate of uranium dissolution is about 6 times lower in the presence of
bentonite compared to the pure UO2 system. Furthermore, the amount of
adsorbed uranium on bentonite is considerably low and cannot account
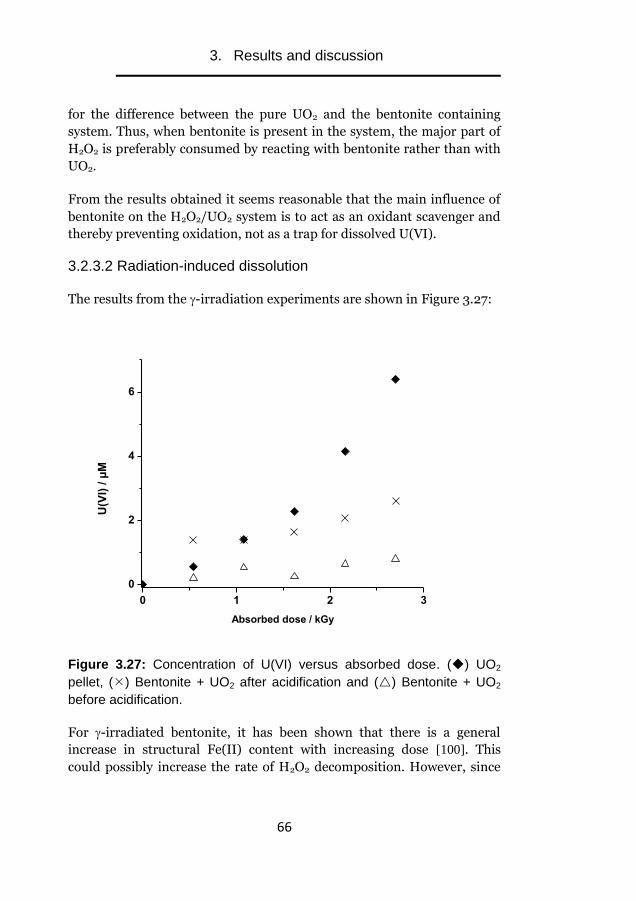
3. Results and discussion
66
for the difference between the pure UO2 and the bentonite containing
system. Thus, when bentonite is present in the system, the major part of
H2O2 is preferably consumed by reacting with bentonite rather than with
UO2.
From the results obtained it seems reasonable that the main influence of
bentonite on the H2O2/UO2 system is to act as an oxidant scavenger and
thereby preventing oxidation, not as a trap for dissolved U(VI).
3.2.3.2 Radiation-induced dissolution
The results from the -irradiation experiments are shown in Figure 3.27:
0 1 2 3
0
2
4
6
U(V
I) /
µM
Absorbed dose / kGy
Figure 3.27: Concentration of U(VI) versus absorbed dose. () UO2
pellet, () Bentonite + UO2 after acidification and () Bentonite + UO2
before acidification.
For -irradiated bentonite, it has been shown that there is a general
increase in structural Fe(II) content with increasing dose [100]. This
could possibly increase the rate of H2O2 decomposition. However, since

3. Results and discussion
67
the clay was not pre-irradiated, this effect is expected to be of minor
importance.
The general trend in the irradiation experiments is similar to that
observed in the H2O2 experiments. However, the difference in uranium
released between the system containing bentonite and the pure UO2 system is smaller in the irradiation experiment than in the corresponding
H2O2 experiment. This could partly be attributed to the fact that other
oxidants than H2O2 are present in the irradiated system and bentonite is
less efficient in scavenging these oxidants.
4. Conclusions
68
4. Conclusions
Based on the results from this study on the radiation-induced dissolution
of UO2, the following conclusions can be drawn:
On the effect of the intrinsic solid phase properties:
The stoichiometry of the UO2 surface and the initial H2O2
concentration have a significant impact on the radiation-induced
dissolution of uranium. H2O2 reacts substantially faster with
stoichiometric UO2 than with hyperstoichiometric UO2. The release
of uranium from stoichiometric UO2 is significantly lower than from
hyperstoichiometric UO2 in both H2O2 and radiation-induced
dissolution experiments. It has been shown that the behavior of
stoichiometric powder changes with exposure to H2O2, approaching
the behavior of hyperstoichiometric UO2 after several consecutive
H2O2 additions.
The addition of burnable integral absorbers into UO2 increases
the stability of the matrix towards oxidation. A tendency towards
higher stability was found with increasing gadolinium content. This
effect is mainly attributed to changes in redox reactivity upon doping.
On the effect of external factors:
ZrO2 catalyzes the reaction between H2 and O2 in aqueous systems.
H2O2 has been detected as reaction product and is subsequently
decomposed to hydroxyl radicals on the ZrO2 surface.
No reactivity of surface-bound H atoms, if formed on the ZrO2
surface, was observed.
An aqueous system containing UO2 in the presence of H2 and O2
enhances the oxidative dissolution of UO2 compared to a system not
containing H2. This effect is attributed to the formation of a stronger
oxidant than O2 as consequence of the surface-catalyzed reaction of
H2 and O2.
The presence of sulfide and bentonite in groundwater can partially
inhibit or delay the radiation-induced dissolution of UO2. Its effect
was mainly attributed to the scavenging of radiolytic oxidants. In
addition, sulfide will be able to reduce U(VI) back to U(IV).

5. Future work
69
5. Future work
The results presented in this thesis contribute to a better understanding
of the processes involved under deep repository conditions. To
corroborate some of the hypotheses that have arisen from the observed
results, several follow-up studies are proposed. In addition, the variations
of some parameters in future experiments are suggested:
The final dissolution yield for UO2 pellets was found to be
significantly lower than for UO2 powders for low initial H2O2
concentrations. These two systems represent two extremes in terms
of S/V ratio (5400 m-1 for powders and 20 m-1 for pellets). It would be
of interest to study the final dissolution yield for “transition” systems
with S/V ratios ranging between these two values.
It was observed how stoichiometric UO2 approached the behavior of
hyperstoichiometric UO2 with consecutive additions of H2O2. The use
of X-ray Photoelectron Spectroscopy or Raman spectroscopy in
combination with oxidative dissolution experiments would make it
possible to corroborate the proposed mechanism by analyzing the
surface oxidation state at a given reaction time.
The difference in uranium release between the standard UO2 and
(U,Gd)O2 pellets was even more pronounced in the radiation-induced
dissolution experiments, where small amounts of H2 are also
produced. A study on the catalytic properties of this fuel on the
reaction between H2O2 and H2 by performing autoclave experiments
is proposed.
Several studies have shown the ability of trivalent dopants, such as
Gd(III) and Y(III), in reducing the redox reactivity of the UO2 matrix.
It would be of great interest to perform similar experiments with
different doping levels of tetra- and penta-valent elements such as
Th(IV) and Nb(V). The pellets must be previously characterized to
verify that the elements are dissolved to form a solid solution.

6. Acknowledgments
70
6. Acknowledgments
I started my PhD journey in October 2012, and four and a half years later
it finally comes to an end. But this is a journey I haven’t travelled alone,
and that’s why I would like to thank those who did it with me:
To my supervisor, Mats Jonsson. Thank you for giving me the
opportunity to start my doctoral studies and to open a new world to me
from the moment you accepted me as master student in 2011. Thanks for
sharing your knowledge, for all the scientific discussions, for having
taught me so many things.
To all my colleagues at Applied Physical Chemistry, especially the Nuclear
Chemistry group: Sara, Kristina, Inna, Veronica, Cláudio, Annika, Björn,
Yang, Åsa, Karin and Elin. It has been such a pleasure to share so many
moments with you, inside and outside KTH. Thanks for so many laughs
and conversations at the office, for teaching me how to ski, for the nice
AWs, for encouraging me to start a new sport (diving), for all the help I
got from each one of you… The list is endless. Ni är så underbara, stor
tack!
I would also like to thank Anders, for your comments on this thesis and
for all your help during the last months. Thank you also for having given
me the opportunity to start working even before I got my doctoral degree,
which allowed me to gain time to run one more project for this thesis.
To all my friends, but especially the ones I made in Sweden. Thanks for
everything, for being the perfect complement in my life and for cheering
me up when I needed it. Thomas: thanks a lot for your help and patience,
for checking that this thesis does not contain any unforgivable
spelling/grammar mistakes. Jonas, thanks for another pair of eyes!
The Swedish Nuclear Fuel and Waste Management Company (SKB) is
gratefully acknowledged for financial support.
A todos y cada uno de mis profesores. Por haber puesto un poquito de
ellos en mí. Si he llegado hasta aquí es en parte gracias a ellos.

6. Acknowledgments
71
Y finalmente, para los que me lo han dado todo: papá, mamá y
hermanita. Gracias por apoyarme desde el principio en esta aventura y
por todo lo que hacéis por mí, porque a pesar de la distancia siempre
habéis estado, estáis y estaréis conmigo.
Stockholm, 5th April 2017

7. References
72
7. References
1. www.world-nuclear.org, World Nuclear Association, (accessed
31st of March, 2017).
2. www.svenskenergi.se (accessed 31st of March, 2017).
3. www.skb.se (accessed 31st of March, 2017).
4. D. W. Shoesmith, J. Nucl. Mater. 282 (2000) 1-31.
5. D. W. Shoesmith, Used Fuel And Uranium Dioxide Dissolution
Studies - A Review Report No.: Nwmo-Tr-2007-03. NACE
International.
6. S. LeCaër, Water 3 (2011) 235-253.
7. C. Ferradini, J. P. Jay-Gerin, Res. Chem. Intermed 26 (2000)
549-565.
8. G. Choppin, J. O. Liljenzin, J. Rydberg; Radiochemistry and
Nuclear Chemistry, second ed., Reed Educational and
Professional Publishing Ltd, Oxford. 1995.
9. J. A. LaVerne, S. M. Pimblott, J. Phys. Chem. 95 (1991) 3196-
3206.
10. J. A. LaVerne, S. M. Pimblott, Radiat. Res. 135 (1993) 16-23.
11. J. A. LaVerne, H. Yoshida, J. Phys. Chem. 97 (1993) 10720-
10724.
12. J. M. Caffrey, A. O. Allen, J. Phys. Chem. 62 (1958) 33-37.
13. J. G. Rabe, B. Rabe, A. O. Allen, J. Phys. Chem. 70 (1966) 1098-
1107.
14. T. Schatz, A. R. Cook, D. Meisel, J. Phys. Chem. C 102 (1998)
7225-7230.
15. N. M. Dimitrijevic, A. Henglein, D. Meisel, J. Phys. Chem. B
103 (1999) 7073-7076.
16. N. G. Petrik, A. B. Alexandrov, A. I. Vall, J. Phys. Chem. B 105
(2001) 5935-5944.
17. J. A. LaVerne, L. Tandon, J. Phys. Chem. B 106 (2002) 380-386.
18. E. Chelnokov, V. Cuba, D. Simeone, S. LeCaer, J. Phys. Chem.
C 118 (2014) 7865.
19. S. L. Caër, Water 3 (2011).
20. F. Berkhout, A. Diakov, R. Ewing, B. Kallenbach-Herbert, J.
Kang, T. Katsuta, G. MacKeron, P. Podvig, M. Schneider, T.
Shea, J. Swahn, M. Takubo; Spent Fuel from Nuclear Power
Reactors-An Overview of a New Study by the International Panel
of Fissile Materials, 2011.
7. References
73
21. I. Grenthe, D. Ferri, F. Salvatore, G. Riccio, J. Chem. Soc.,
Dalton Trans. (1984) 2439-2443.
22. J. W. T. Spinks, R. J. Woods; An introduction to radiation
chemistry. Wiley: 1990.
23. O. Roth, M. Jonsson, Cent. Eur. J. Chem. 6 (2008) 1-14.
24. E. Ekeroth, M. Jonsson, J. Nucl. Mater. 322 (2003) 242-248.
25. M. M. Hossain, E. Ekeroth, M. Jonsson, J. Nucl. Mater. 358
(2006) 202.
26. E. Ekeroth, O. Roth, M. Jonsson, J. Nucl. Mater. 355 (2006) 38.
27. D. E. Hoare, G. Peacock, G. R. D. Ruxton, Trans. Faraday Soc.
63 (1967) 2498-2503.
28. E. Giamello, L. Calosso, B. Fubini, F. Geobaldo, J. Phys. Chem.
97 (1993) 5735-5740.
29. E. Giamello, M. Volante, B. Fubini, F. Geobaldo, C. Morterra,
Mater. Chem. Phys. 29 (1991) 379-386.
30. C. M. Miller, R. L. Valentine, Water Res. 33 (1999) 2805-2816.
31. A. Hiroki, J. A. LaVerne, J. Phys. Chem. B 109 (2005) 3364.
32. C. M. Lousada, M. Trummer, M. Jonsson, J. Nucl. Mater. 434
(2013) 434-439.
33. C. M. Lousada, M. Yang, K. Nilsson, M. Jonsson, J. Mol. Catal.
A:Chem. 379 (2013) 178-184.
34. C. M. Lousada, M. Jonsson, J. Phys. Chem. C 114 (2010) 11202-
11208.
35. M. Jonsson, E. Ekeroth, O. Roth, MRS Proceedings 807 (2003).
36. W. B. Wilson, C. A. Alexander, A. F. Gerds, J. Inorg. Nucl.
Chem. 20 (1961) 242-251.
37. J.-G. Kim, Y.-K. Ha, S.-D. Park, K.-Y. Jee, W.-H. Kim, J. Nucl.
Mater. 297 (2001) 327-331.
38. L. E. Thomas, R. E. Einziger, H. C. Buchanan, J. Nucl. Mater.
201 (1993) 310-319.
39. M. Trummer, S. Nilsson, M. Jonsson, J. Nucl. Mater. 378 (2008)
55-59.
40. M. Trummer, O. Roth, M. Jonsson, J. Nucl. Mater. 383 (2009)
226-230.
41. M. Jonsson, S. Nilsson, J. Nucl. Mater. 372 (2008) 160-163.
42. S. Nilsson, M. Jonsson, J. Nucl. Mater. 374 (2008) 290-292.
43. P. G. Lucuta, R. A. Verrall, H. Matzke, B. J. Palmer, J. Nucl.
Mater. 178 (1991) 48-60.
44. V. V. Rondinella, H. Matzke, J. Cobos, T. Wiss, Mat. Res. Soc.
Symp. Proc. 556 (1999).
7. References
74
45. V. V. Rondinella, H. Matzke, J. Cobos, T. Wiss, Radiochim.
Acta 88 (2000) 527.
46. V. V. Rondinella, J. Cobos, H. Matzke, T. Wiss, P. Carbol, D.
Solatie, Mat. Res. Soc. Symp. Proc. 663 (2001) 392.
47. J. A. T. Smellie, M. Laaksoharju, P. Vikberg, J. Hydrol. 172
(1995) 147.
48. I. Grenthe, F. Diego, F. Salvatore, G. J. Riccio, J. Chem. Soc.,
Dalton Trans. 11 (1984) 2439.
49. P. Wardman, J. Phys. Chem. Ref. Data 18 (1989) 1637.
50. R. E. Huie, C. L. Clifton, Radiat. Phys. Chem. 38 (1991) 477.
51. W. W. McNab, R. Ruiz, M. Reinhard, Environ. Sci. Technol. 34
(2000) 149-153.
52. G. V. Lowry, M. Reinhard, Environ. Sci. Technol. 34 (2000)
3217-3223.
53. J. Giménez, E. Baraj, M. E. Torrero, I. Casas, J. de Pablo, J.
Nucl. Mater. 238 (1996) 64-69.
54. A. Loida, V. Metz, B. Kienzler, H. Geckeis, J. Nucl. Mater. 346
(2005) 24-31.
55. E. Myllykylä, K. Ollila; Interaction between U(VI) and Fe(II) in
aqueous solution under anaerobic conditions Closed system
experiments (POSIVA-WR--11-6). Finland, 2011.
56. E. J. O´Loughlin, S. D. Kelly, R. E. Cook, R. Csencsits, K. M.
Kemmer, Environ. Sci. Technol. 37 (2003) 721-727.
57. T. Missana, C. Maffiotte, M. García-Gutiérrez, J. Colloid
Interface 261 (2003) 154-160.
58. P. Carbol, J. Cobos-Sabathe, J. P. Glatz, C. Ronchi, V.
Rondinella, D. H. Wegen, T. Wiss, A. Loida, V. Metz, B.
Kienzler, K. Spahiu, B. Grambow, J. Quiñones, A. M. E.
Valiente; SKB Technical Report TR-05-09, 2005, p 1.
59. C. Poinssot, C. Ferry, M. Kelm, B. Grambow, A. M.-E. Valiente,
L. Johnson, Z. Andriambololona, J. Bruno, C. Cachoir, J. M.
Cavendon, H. Christensen, C. Corbel, C. Jegou, K. Lemmens, A.
Loida, P. Lovera, F. Miserque, J. de Pablo, A. Poulesquen, J.
Quinones, V. Rondinella, K. Spahiu, D. Wegen; Final Report of
the European Project Spent Fuel Stability under Repository
Conditions. European Comission Report CEA-R-6093, 2005.
60. S. Röllin, K. Spahiu, U. B. Eklund, J. Nucl. Mater. 297 (2001)
231-243.
61. K. Spahiu, D. Cui, M. Lundström, Radiochim. Acta 92 (2004)
625-629.

7. References
75
62. K. Ollila, Y. Albinsson, V. M. Oversby, M. Cowper; SKB
Technical Report TR-03-13, Swedish Nuclear Fuel and Waste
Management Co., Stockholm, 2003.
63. P. Fors, P. Carbol, S. Van Winckel, K. Spahiu, J. Nucl. Mater.
394 (2009) 1-8.
64. M. Jonsson, F. Nielsen, O. Roth, E. Ekeroth, S. Nilsson, M. M.
Hossain, Environ. Sci. Technol. 41 (2007) 7087-7093.
65. T. E. Eriksen, M. Jonsson; SKB Technical Report TR-07-06,
2007, p 1.
66. S. Nilsson, M. Jonsson, J. Nucl. Mater. 372 (2008) 160-163.
67. D. Cui, E. Ekeroth, P. Fors, K. Spahiu, Mat. Res. Soc. Symp.
Proc. 1104 (2008) 87-99.
68. P. Carbol, P. Fors, T. Gouder, K. Spahiu, Geochim. Cosmochim.
Acta 73 (2009) 4366-4375.
69. C. J. Hochanadel, J. Phys. Chem. 56 (1952) 587-594.
70. J. A. Ghormley, A. C. Stewart, J. Am. Chem. Soc. 78 (1956)
2934-2939.
71. I. K. Kressin, Anal. Chem. 56 (1984) 2269.
72. S. B. Savvin, Talanta 8 (1961) 673.
73. Q. Li, P. Sritharathikun, S. Motomizu, Analyt. Sci. 23 (2007)
413-417.
74. G. Leinders, T. Cardinaels, K. Binnemans, M. Verwerft, J. Nucl.
Mater. 459 (2015) 135-142.
75. J. de Pablo, I. Casas, J. Giménez, M. Molera, M. Rovira, L.
Duro, J. Bruno, Geochim. Cosmochim. Acta 63 (1999) 3097-
3103.
76. M. Trummer, B. Dahlgren, M. Jonsson, J. Nucl. Mater. 407
(2010) 195-199.
77. M. Suh, P. S. Bagus, S. Pak, M. P. Rosynek, J. H. Lunsford, J.
Phys. Chem. B 104 (2000) 2736-2742.
78. S. Nilsson, M. Jonsson, J. Nucl. Mater. 410 (2011) 89-93.
79. K. Kapoor, S. V. Ramana Rao, Sheela, T. Sanyal, A. Singh, J.
Nucl. Mater. 321 (2003) 331-334.
80. J. Hertog; Lattice parameter evolution of single doped and co-
doped UO2 systems. External Report SKC-CEN-ER-175, June,
2011.
81. T. Tsuji, M. Iwashita, T. Yamashita, K. Ohuchi, J. Alloys
Compd. 271–273 (1998) 391-394.
82. H. G. Riella, M. Durazzo, M. Hirata, R. A. Nogueira, J. Nucl.
Mater. 178 (1991) 204-211.
7. References
76
83. M. Durazzo, F. B. V. Oliveira, E. F. Urano de Carvalho, H. G.
Riella, J. Nucl. Mater. 400 (2010) 183-188.
84. K. Spahiu, J. Devoy, D. Cui, M. Lundström, Radiochim. Acta 92
(2004) 597-601.
85. K. Nilsson, O. Roth, M. Jonsson, J. Nucl. Mater. 488 (2017) 123-
128.
86. M. Trummer. The effect of solid state inclusions on the reactivity
of UO2 - A kinetic and mechanistic study. Doctoral Thesis in
Chemistry, KTH, Stockholm, 2011.
87. O. Roth, C. Askeljung, A. Puranen, M. Granfors, D. Cui, J. Low;
Leaching of high burn up spent fuel with and without matrix
dopants. Final (3rd) Annual Workshop Proceedings FIRST-
Nuclides project (eds. Kienzler et al.), D-N:5.4, December, 2014.
88. H. Nakatsuji, M. Hada, H. Ogawa, K. Nagata, K. Domen, J.
Phys. Chem. 98 (1994) 11840-11845.
89. K. D. J. Kondo, K. Maruya, T. Onishi, Chem. Phys. Lett. 188
(1992) 443-445.
90. K. W. J. Wong, M. R. Field, J. Z. Ou, K. Latham, M. J. S.
Spencer, I. Yarovsky, K. Kalantar-zadeh, Nanotechnology 23
(2012) 1-7.
91. D. W. Shoesmith, S. Sunder, L. H. Johnson, M. G. Bailey, Mater.
Res. Soc. Symp. Proc. 50 (1987) 309.
92. E. Wilhelm, R. Battino, R. J. Wilcock, Chem. Rev. 77 (1977)
219-262.
93. J. M. Haschke, T. H. Allen, H. L. Stakebake, J. Alloys Compd.
243 (1996) 23.
94. F. J. Miller, A. LeFerriere, M. Fernandez, S. Hubinger, J. P.
Hershey, Environ. Sci. Technol. 23 (1989) 209-213.
95. P. Resch, R. J. Field, F. W. Schneider, M. Burger, J. Phys. Chem.
93 (1989) 8181-8186.
96. M. R. Hoffmann, Environ. Sci. Technol. 11 (1977) 61-66.
97. C. Walling, Accounts Chem. Res. 8 (1975) 125-131.
98. B. Hua, H. F. Xu, J. Terry, B. L. Deng, Environ. Sci. Technol. 40
(2006) 4666-4671.
99. F. Haber, J. Weiss, Naturwissenschaften 20 (1932) 948-950.
100. M. Holmboe, M. Jonsson, S. Wold, Radiat. Phys. Chem. 81
(2012) 190-194.
101. S. Bachmaf, B. Planer-Friedrich, B. J. Merkel, Radiochim. Acta
96 (2008) 359-366.

7. References
77
102. S. P. Hyun, Y. H. Cho, P. S. Hahn, S. Kim, J. Radioanal. Nucl.
Chem. 250 (2001) 55-62.