Embed Size (px)
Citation preview

Experimental Methods of Shale Permeability
by
Feng Guo BEng
This thesis is presented for the degree of Master of Engineering Science
of The University of Western Australia
Petroleum Engineering School of Mechanical and Chemical Engineering
April 2014
School of Mechanical and Chemical Engineering The university of Western Australia
Abstract
This thesis explores the permeability of shale caprock (Green River Shale).
Dynamic coupling between fluid transport and mechanical response have
been observed in this unconstrained sorbing and swelling shale. We report
laboratory experiments that investigate the permeability evolution of shale
sample as a function of applied stress and pore pressure at room
temperature and gas transport between fracture and matrix. Experiments
were conducted on 2.5 cm diameter by 1.2cm long cylindrical samples at
confining and axial stresses of 7 MPa. Permeability and sorption
characteristics were measured using a pulse transient method that was also
used to measure volumetric strains for both helium (He) and carbon dioxide
(CO2). From these experiments it was found that gas adsorption is closely
linked with the apparent permeability of the sample. As pore pressure
increased, the permeability to He increased from 6.01×10⁻¹⁹ m2 to 9.74×10-
19 m2 while the permeability to CO2 which is a larger molecule with higher
absorbability increased from 3.03×10⁻¹⁹ to 4.32×10⁻¹⁹ m2,. Gas transport
between fracture and matrix also played a significant role in permeability
evolution. During gas transport, gas diffused gradually from the fractures to
the matrix and the area affected by gas transport expanded dynamically
from the fractures towards to the matrix. This suggests permeability
I
School of Mechanical and Chemical Engineering The university of Western Australia
evolution is dynamic during gas transport and can be divided into two
stages. In the first stage, the gas-influenced area is limited to fracture
surfaces, which causes the fracture apertures to decrease, thereby reducing
permeability. In the second stage, the gas-influenced area penetrates further
into the matrix which causes the fracture apertures to increase, resulting in
permeability recovery. This hypothesis is supported by our experimental
observations. Between two stages of the gas transport process, where local
swelling dominated, the permeability of both He and CO2 was lower than at
the final equilibrium state. At the final equilibrium state, where uniform
macro swelling occurred, permeability of both He and CO2 increased as
pore pressure increased. Our experiments reveal that not only adsorption-
induced swelling and effective stress but also gas transport has an
important impact on permeability of shale caprock.
II
School of Mechanical and Chemical Engineering The university of Western Australia
Acknowledgements
I owe my deep and sincere gratitude to my supervisor, Professor Jishan Liu,
who provided me with many opportunities and supported me throughout
my studies. Prof. Liu encouraged me to think creatively. I am so lucky to
meet such a wonderful person and his advice will benefit me for the rest of
my life.
Special thanks also to Dr. Derek Elsworth, who offered me a research
position at the G3 Center for Geomechanics, Geofluids & Geohazards
Laboratory at Pennsylvania State University. I was given invaluable
support and help from him to complete the experimental part of my
research. I also want to acknowledge Divya Chandra, Hemant Kumar,
Steve Swavely and Shugang Wang, who helped me in the laboratory.
I am indebted to the research group members form School of Mechanical
and Chemical Engineering for their support and friendship, including Dr.
Jianguo Wang, Dr. Zhongwei Chen, Mr. Qiang Liu, Mr. Yan Peng, Ms
Hongyan Qu.
At last, I want to thank my family sincerely for their support that has
enabled me to take my studies at UWA.
III

School of Mechanical and Chemical Engineering The university of Western Australia
Table Of Contents
ABSTRACT ............................................................................................................. I
ACKNOWLEDGEMENTS .................................................................................. III
TABLE OF CONTENTS ...................................................................................... IV
LIST OF FIGURES ............................................................................................... V
LIST OF TABLES .............................................................................................. VIII
CHAPTER 1 ........................................................................................................... 1
INTRODUCTION ............................................................................................................... 1
CHAPTER 2 ......................................................................................................... 10
EXPERIMENTAL INVESTIGATION ................................................................................... 10 2.1 Apparatus ........................................................................................................... 10 2.2 Sample preparation............................................................................................ 14 2.3 Method and Analysis .......................................................................................... 15
2.3.1 Permeability ................................................................................................ 15 2.3.3 Morphology ................................................................................................. 17
CHAPTER 3 ......................................................................................................... 18
EXPERIMENTAL OBSERVATIONS AND DISCUSSION ....................................................... 18 3.1 Experimental observations ................................................................................ 18
3.1.1 Results of permeability to He ...................................................................... 19 3.2.2 Results of permeability to CO2 .................................................................... 26
3.2 Discussion .......................................................................................................... 35
CHAPTER 4 ......................................................................................................... 39
CONCLUSION ................................................................................................................ 39
REFERENCES ...................................................................................................... 41
APPENDIX A ....................................................................................................... 46
PHOTO DOCUMENTATION OF SAMPLE PREPARATION .................................................... 46
APPENDIX B ....................................................................................................... 58
MICROGRAPHS OF SAMPLE ........................................................................................... 58
IV
School of Mechanical and Chemical Engineering The university of Western Australia
List of Figures
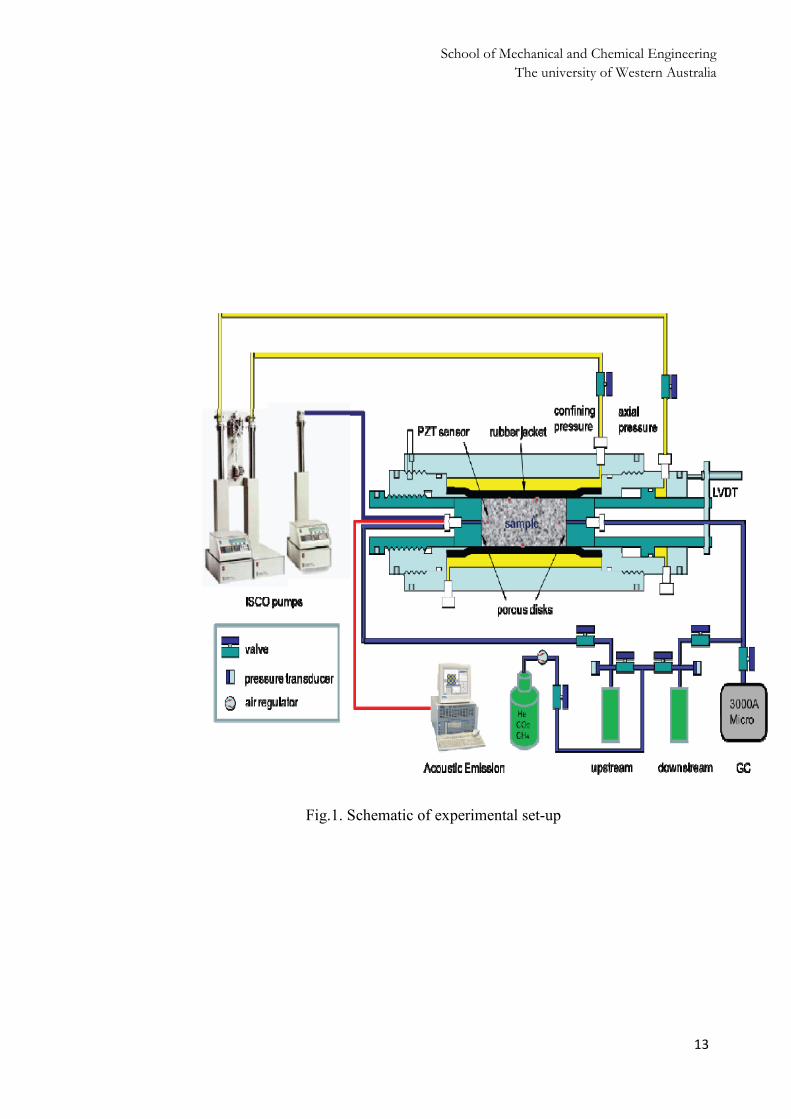
Fig.1. Schematic of experimental set-up……………………………………………… 13
Fig.2. Pressure-pulse decay with non-adsorbing gas (Helium) during a transient pulse
decay permeability test with initial upstream reservoir pressure 1.3MPa under constant
axial and confining pressure 7 MPa……………………………………………. ……..20
Fig.3. Pressure decay Pup (t) - Pdn(t) on semi-log paper against time for Helium with
initial upstream reservoir pressure 1.3MPa…………………………………………… 21
Fig.4. Pressure-pulse decay with non-adsorbing gas (Helium) during a transient pulse
decay permeability test with initial upstream reservoir pressure 2.2MPa under constant
axial and confining pressure 7 MPa …………………………………………………...21
Fig.5. Pressure decay Pup (t) - Pdn(t) on semi-log paper against time for Helium with
initial upstream reservoir pressure 1.3MPa…………………………………………… 22
Fig.6. Pressure-pulse decay with non-adsorbing gas (Helium) during a transient pulse
decay permeability test with initial upstream reservoir pressure 3.3MPa under constant
axial and confining pressure 7 MPa…………………………………………………... 22
Fig.7. Pressure decay Pup (t) - Pdn(t) on semi-log paper against time for Helium with
initial upstream reservoir pressure 3.3MPa…………………………………………… 23
Fig.8. Pressure-pulse decay with non-adsorbing gas (Helium) during a transient pulse
decay permeability test with initial upstream reservoir pressure 4.3MPa under constant
axial and confining pressure 7 MPa…………………………………………………... 23
Fig.9. Pressure decay Pup (t) - Pdn (t) on semi-log paper against time for Helium with
initial upstream reservoir pressure 4.3MPa…………………………………………… 24
Fig.10. Pressure-pulse decay with non-adsorbing gas (Helium) during a transient pulse
decay permeability test with initial upstream reservoir pressure 5.3MPa under constant
axial and confining pressure 7 MPa …………………………………………………...24
V
School of Mechanical and Chemical Engineering The university of Western Australia
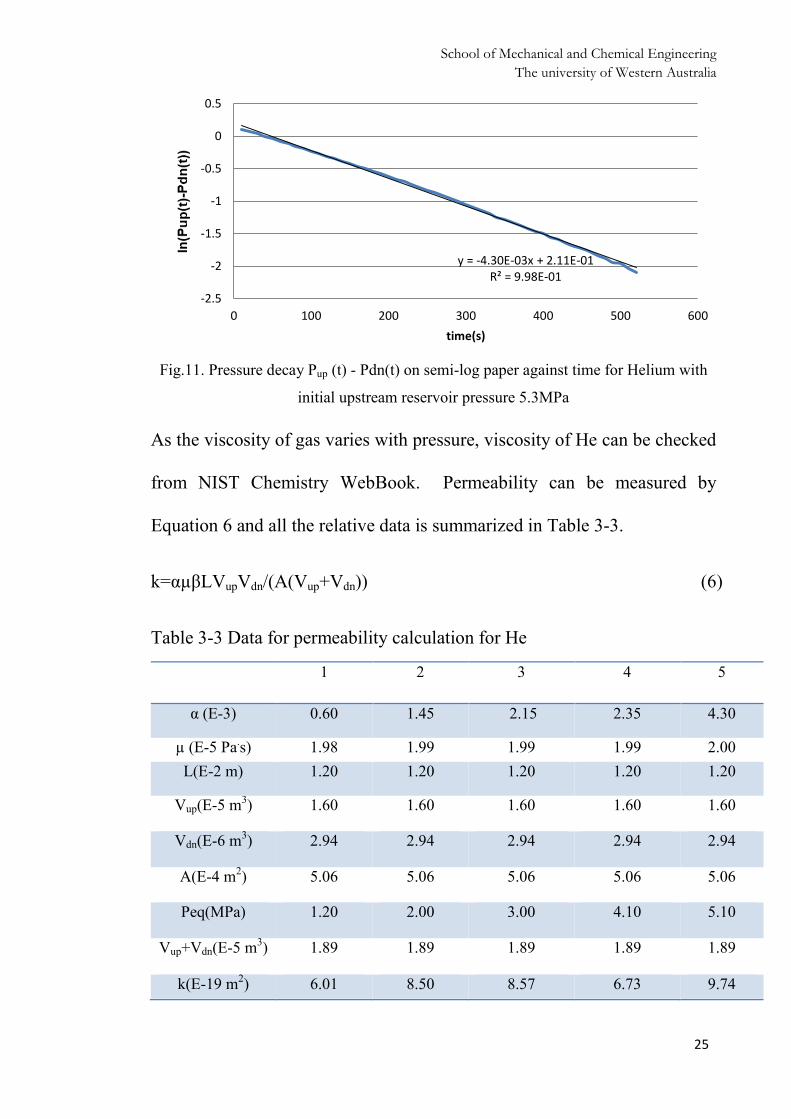
Fig.11. Pressure decay Pup (t) - Pdn(t) on semi-log paper against time for Helium with
initial upstream reservoir pressure 5.3MPa…………………………………………… 25
Fig.12. Permeability evolution to He as a function of applied pore pressure with
constant axial and confining pressure ………………………………………………….26
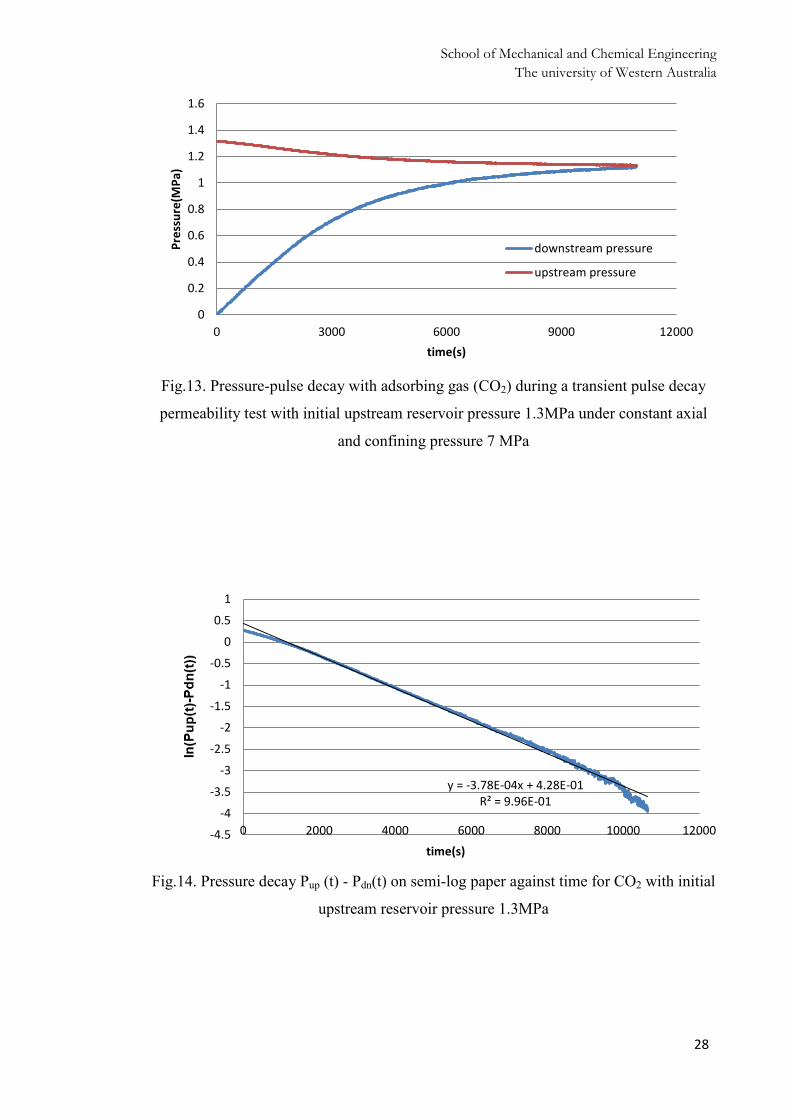
Fig.13. Pressure-pulse decay with adsorbing gas (CO2) during a transient pulse decay
permeability test with initial upstream reservoir pressure 1.3MPa under constant axial
and confining pressure 7 MPa …………………………………………………………28
Fig.14. Pressure decay Pup (t) - Pdn(t) on semi-log paper against time for CO2 with initial
upstream reservoir pressure 1.3MPa………………………………………………….. 28
Fig.15. Pressure-pulse decay with adsorbing gas (CO2) during a transient pulse decay
permeability test with initial upstream reservoir pressure 2.2MPa under constant axial
and confining pressure 7 MPa………………………………………………………… 29
Fig.16. Pressure decay Pup (t) - Pdn(t) on semi-log paper against time for CO2 with initial
upstream reservoir pressure 2.2MPa …………………………………………………..29
Fig.17. Pressure-pulse decay with adsorbing gas (CO2) during a transient pulse decay
permeability test with initial upstream reservoir pressure 3.35Mpa under constant axial
and confining pressure 7 MPa………………………………………………………… 30
Fig.18. Pressure decay Pup (t) - Pdn(t) on semi-log paper against time for CO2 with initial
upstream reservoir pressure 3.35MPa………………………………………………… 30
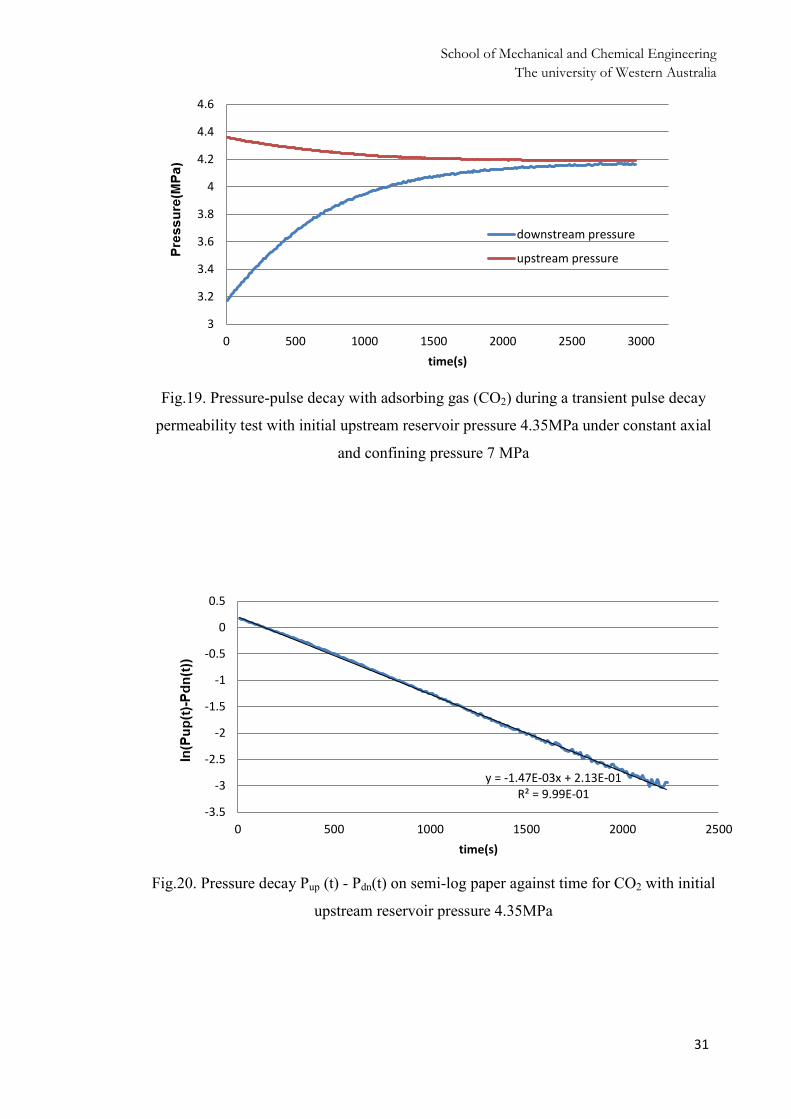
Fig.19. Pressure-pulse decay with adsorbing gas (CO2) during a transient pulse decay
permeability test with initial upstream reservoir pressure 4.35MPa under constant axial
and confining pressure 7 MPa …………………………………………………………31
Fig.20. Pressure decay Pup (t) - Pdn(t) on semi-log paper against time for CO2 with initial
upstream reservoir pressure 4.35MPa………………………………………….. ……..31
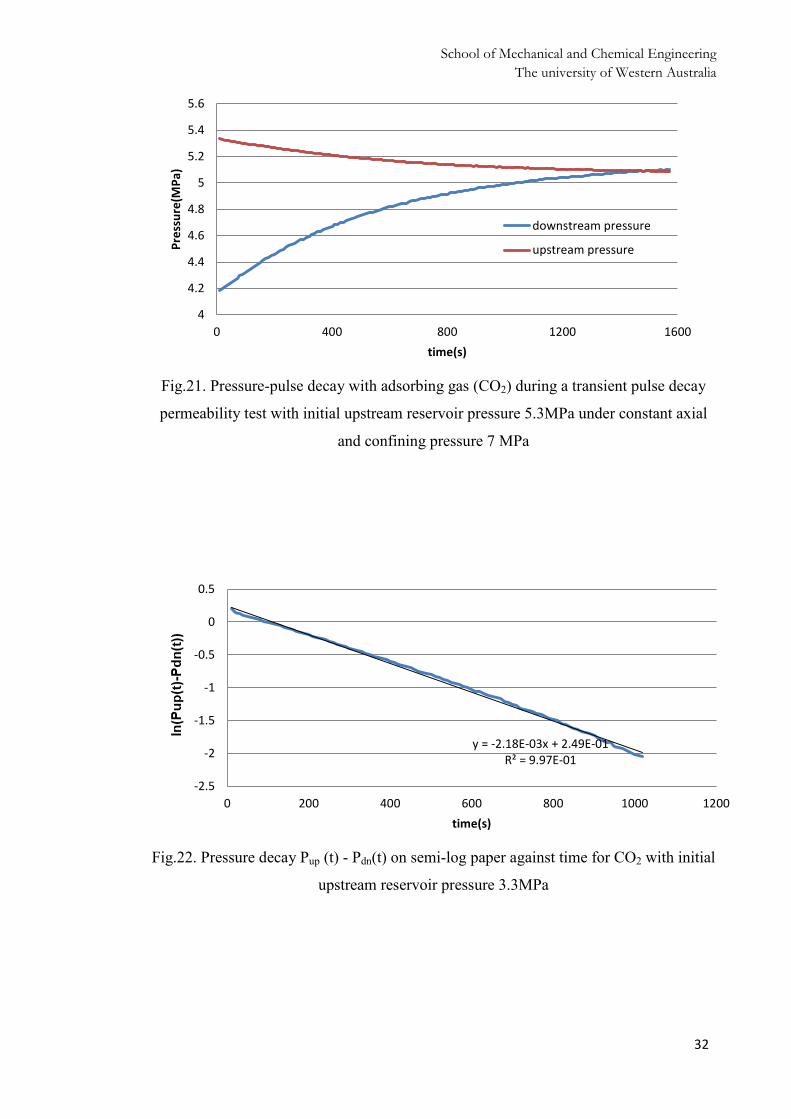
Fig.21. Pressure-pulse decay with adsorbing gas (CO2) during a transient pulse decay
permeability test with initial upstream reservoir pressure 5.3MPa under constant axial
and confining pressure 7 MPa …………………………………………………………32
Fig.22. Pressure decay Pup (t) - Pdn(t) on semi-log paper against time for CO2 with initial
upstream reservoir pressure 3.3MPa ………………………………………………......32
VI
School of Mechanical and Chemical Engineering The university of Western Australia
Fig.23. Permeability evolution to CO2 as a function of applied pore pressure with
constant axial and confining pressure 7 MPa…………………………………………. 34
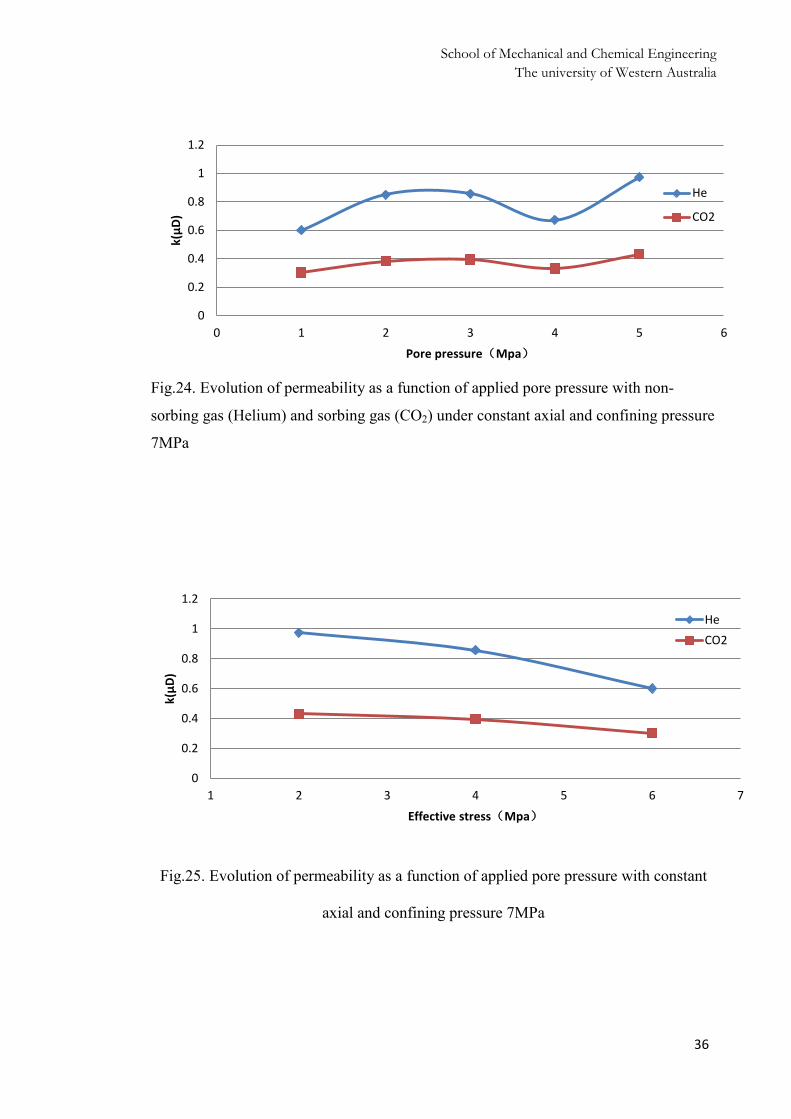
Fig.24. Evolution of permeability as a function of applied pore pressure with non-
sorbing gas (Helium) and sorbing gas (CO2) under constant axial and confining pressure
7MPa……………………………………………………………………………………36
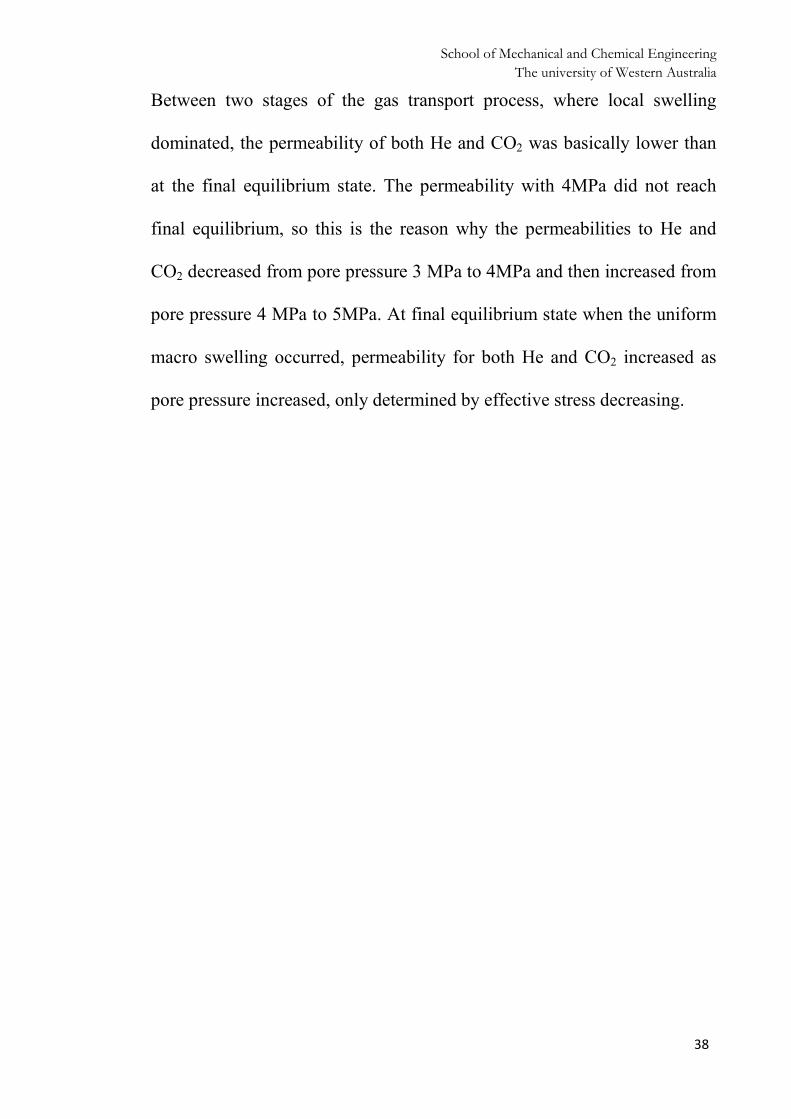
Fig.25. Evolution of permeability as a function of applied pore pressure with constant
axial and confining pressure 7MPa…………………………………………………….36
Fig.26. Illustration of the difference between local swelling and marco swelling….....37
VII
School of Mechanical and Chemical Engineering The university of Western Australia
List of Tables
Table3-1 Experimental constants …………………………………………………….. 18
Table 3-2 Basic data from experimental results of He....................................................20
Table 3-3 Data for permeability calculation for He …………………………………...25
Table 3-4 Basic data from experimental results of CO2……………………………… 27
Table 3-5 Data for permeability calculation …………………………………………..33
VIII

School of Mechanical and Chemical Engineering The university of Western Australia
Chapter 1
Introduction
Global development has led to increased demand for affordable clean
energy. Energy consumption in both the developed and the developing
world is increasing, and is particularly high in developing countries.
Electricity is produced primarily from non-renewable sources such as fossil
fuels and nuclear power but also from renewable sources that include
hydropower, wind, geothermal, solar and biomass. Globally, coal provides
for 29.6% of primary energy needs and generates 42% of the world’s
electricity. The low cost of coal relative to other fuel sources means it is a
critical resource for developing economies. As a result, massive amounts of
carbon dioxide are being discharged into the atmosphere as coal is
consumed in these countries. To reduce emission of carbon dioxide,
technologies need to be developed to efficiently capture and store carbon
dioxide from the atmosphere.
Carbon sequestration is a carbon capture and storage technology that
reduces anthropogenic carbon dioxide emission by storing carbon dioxide
deep under the earth’s surface or deep in the ocean. The main source of
carbon dioxide for sequestration is from power plants. The common places 1
School of Mechanical and Chemical Engineering The university of Western Australia
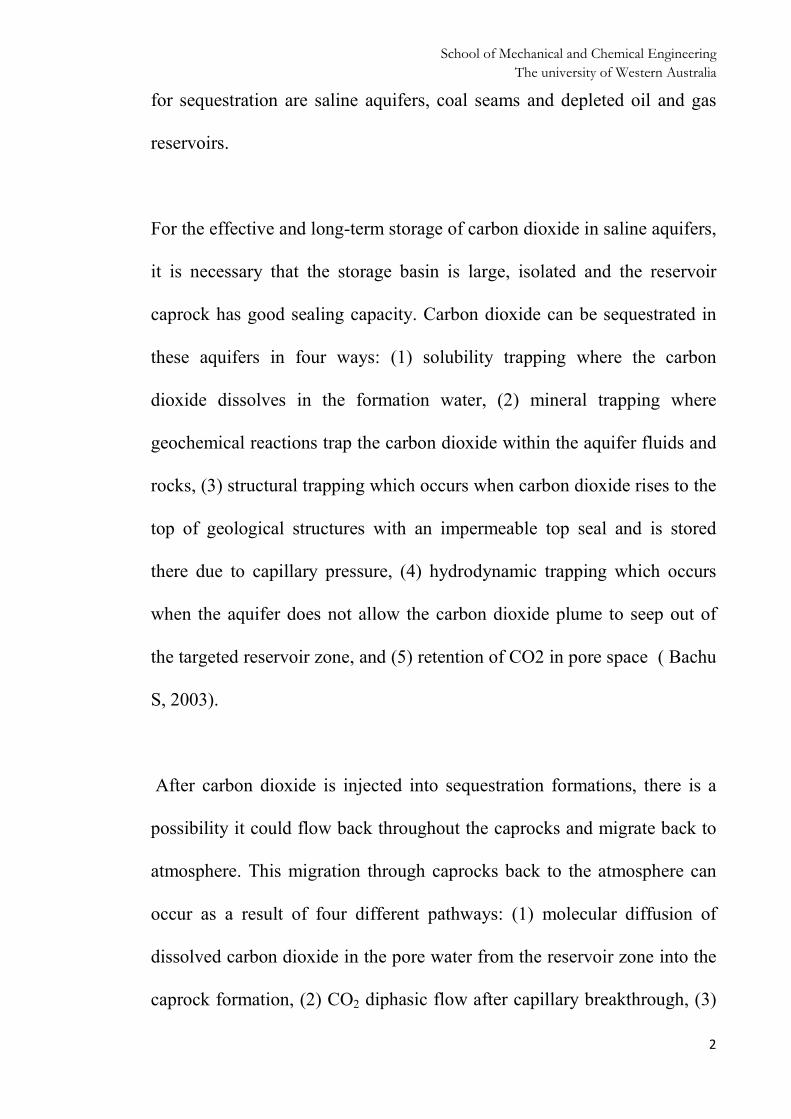
for sequestration are saline aquifers, coal seams and depleted oil and gas
reservoirs.
For the effective and long-term storage of carbon dioxide in saline aquifers,
it is necessary that the storage basin is large, isolated and the reservoir
caprock has good sealing capacity. Carbon dioxide can be sequestrated in
these aquifers in four ways: (1) solubility trapping where the carbon
dioxide dissolves in the formation water, (2) mineral trapping where
geochemical reactions trap the carbon dioxide within the aquifer fluids and
rocks, (3) structural trapping which occurs when carbon dioxide rises to the
top of geological structures with an impermeable top seal and is stored
there due to capillary pressure, (4) hydrodynamic trapping which occurs
when the aquifer does not allow the carbon dioxide plume to seep out of
the targeted reservoir zone, and (5) retention of CO2 in pore space ( Bachu
S, 2003).
After carbon dioxide is injected into sequestration formations, there is a
possibility it could flow back throughout the caprocks and migrate back to
atmosphere. This migration through caprocks back to the atmosphere can
occur as a result of four different pathways: (1) molecular diffusion of
dissolved carbon dioxide in the pore water from the reservoir zone into the
caprock formation, (2) CO2 diphasic flow after capillary breakthrough, (3)
2
School of Mechanical and Chemical Engineering The university of Western Australia
CO2 flow through the caprock after hydraulic fracturing and (4) CO2 flow
through existing open fractures, faults or wells (Chadwick et al., 2008).
Leakage due to CO2 diffusion in saline occurs over geological time scales,
and therefore diffusion-induced leakage through caprock is unlikely to
significantly impact the safety of the CO2 reservoir (Lu et al., 2009). Flow
of CO2 through a newly created pathway or existing open fractures or faults
is most dangerous, but only happens when accumulated pressure beneath
the caprock is high enough to overcome the minimum compressive stress
surrounding the caprock. Usually the caprocks of sequestration sites are
deep enough that this leakage is easy to avoid.
In contrast, leakage due to capillary breakthrough is a major threat to the
efficience of caprock sealing. This leakage occurs when the pressure
difference of CO2 and the water phase in the pores adjacent to the caprock
is higher than the capillary entry pressure of the caprock. This leakage
occurs more frequently than leakage due to a newly created pathway or
existing open fracture because the capillary entry pressure is often much
smaller than the minimum compressive stress. In addition, capillary entry
pressure is controlled by the interfacial tension of the fluids, the wettability
of the solid surface (wetting angle) with respect to the fluid, and the
structure of the pore system. The migration of CO2 may also be accelerated
3
School of Mechanical and Chemical Engineering The university of Western Australia
by other mechanisms such as chemical alteration of the mineral
composition of the caprock formation under the influence of acid water, re-
opening of pre-existing fracture or micro-cracks induced by overpressure of
the reservoir below, or a combination of the two (Fleury et al, 2010).
Once carbon dioxide penetrates into a water-saturated caprock, the CO2-
saline displacement process in the caprock layer can be described by
diphasic flow. Permeability is an important property of caprocks as it
influences the CO2-saline displacement process and has a direct impact on
the sealing capacity of caprock. Although the initial permeability of shale
caprock is usually lower than 1 μD, it changes when CO2 penetrates into
the caprocks (Gherardi et al., 2007; Wang and Peng, 2014). To accurately
predict the permeability evolution of shale caprocks, it is important to
assess the sealing effectiveness of the caprock. As previous studies of shale
caprock permeability have shown that shale and coal have a similar dual
pore (Smith et al., 2013; Deng et al., 2013) and organic matter composition
(Weniger et al., 2010; Kang et al., 2011), the investigation of shale-gas
interactions can be based on extensive coal-gas studies. The permeability of
coal is mainly determined by pore size affected by shrinkage and swelling
of caprock, the effective stress of caprock (which involves pore pressure,
axial pressure and confining pressure) and gas transport.
4
School of Mechanical and Chemical Engineering The university of Western Australia
Experimental and modelling studies have shown that rock shrinkage and
swelling with gas desorption/adsorption has an important influence on the
evolution of permeability (Bustin et al., 2008; Cui et al., 2007; Harpalani
and Chen, 1995; Kelemen et al., 2006; Seidle and Huitt, 1995). Laboratory
measured coal permeabilities to non-adsorbing or lightly adsorbing gases
such as He and N2 have been found to be higher than those permeabilities
to adsorbing gases such as CH4 and CO2 (Chen et at., 2011; Sirwardane et
al., 2009; Somerton et al., 1975). With constant axial and confining
pressure, the permeability of these adsorptive gases drops when pore
pressures increase due to coal swelling (Mazumder and Wolf, 2008; Pan et
al., 2010; Robertson and Christiansen, 2005; Wang et al., 2010), and rise
when pore pressures decrease due to matrix shrinkage (Cui and Bustin,
2005; Harpalani and Chen, 1997; Harpalani and Schraufnagel, 1990; Seidle
and Huitt, 1995). Swelling of the coal matrix has also been found to be
caused by the preferential sorption of CO2 over CH4 by reducing or closing
the aperture of existing cleats to reduce net permeability during CO2
injection in constrained coals (Chikatamarla et al., 2004b; Gu and
Chalaturnyk, 2005; Levine, 1996).
5

School of Mechanical and Chemical Engineering The university of Western Australia
A variety of coal permeability models have also been used to access the
influence of rock shrinkage and swelling on gas desorption/adsorption (Cui
and Bustin, 2005; Pan and Connell, 2007; Robertson and Christiansen,
2006; Seidle and Huitt, 1995). The model P&M model derived by Palmer
and Mansoori (1996) has been widely used to study permeability in coal as
a function of effective stress and matrix shrinkage. This model was
improved by Palmer et al. in 2007. Liu et al. (2011) have also used the
cubic coal model to examine how permeability is affected by
swelling/shrinkage in two extreme cases: (1) where the matrix blocks and
fracture in a coal sample are assumed to be completely separated from each
other, and permeability is not affected by matrix swelling/shrinkage, and (2)
where the coal sample is assumed to be completely constrained and
permeability is not affected by the swelling/shrinkage strain of the sample.
A number of other models have also shown that gas adsorption and related
swelling is largely impacted by coal rank, sorption capacity and the
composition of the permeating gas and water saturation (Chikatamarla et al.,
2004a, b; Han et al., 2010; Levine, 1996; Pone et al., 2010).
Many experiments have also been undertaken to evaluate the influence of
stresses on permeability evolution. These experiments have shown that gas
permeability in coal is sensitive to geo-stress because the fissures and pores
in the coal body tend to close under external compressive forces (Somerton
et al., 1975). As applied stress increases along a gentle gradient, 6
School of Mechanical and Chemical Engineering The university of Western Australia
permeability decreases along a steep gradient (Mckee et al., 1987; Seidle et
al., 1992). In the stress range of 250-2000 psi, permeability decreases by
more than two orders of magnitude in response to hydrostatic or triaxial
stress, although this decrease can be controlled by the mean effective stress
(Somerton et al., 1975; Liu et al, 2011). A number of studies using non-
adsorbing gas have also shown that permeability increases with decreasing
effective stress on the sample (Pini et al., 2009; Pan et al., 2010). Zeng et al.
(2011) reported that the permeability of coal samples under triaxial stress
tend to decrease as effective stress in each loading direction increases and
is controlled by the evolution of cracks in the samples.
Another factor impacting on permeability evolution is gas transport
between the matrix and fractures. Coal is a typical dual porous medium. If
a state of equilibrium does not exist between the fracture and the matrix, a
local mechanical response determines permeability alternation rather than a
macro mechanical response. Liu et al. (2011) believes that these
permeability changes are related to the process of gas transport and
proposed a permeability switching model that describes how permeability
can switch instantaneously from reduction to enhancement. This model
also described how coal matrix swelling can transit from local swelling to
macro-swelling under the influence of unconstrained swelling.
7
School of Mechanical and Chemical Engineering The university of Western Australia
Migration of CO2 in sedimentary formations can be also be affected by
mineral composition (e.g. Kaszuba et al., 2003, 2005; Kharaka et al., 2006;
Hangx and Spiers, 2008; Wollenweber et al., 2010; Alemu et al., 2011).
Aqueous chemistry and dissolution of minerals and mineralogical changes
may occur between shale and CO2-saline, largely as a result of the
formation of bicarbonate and a decrease in pH. Experimental studies have
shown that carbonate-rich shale is more reactive than clay-rich shale at
experimental temperatures of 250。C (Alemu et al., 2011), suggesting that
the reactivity of caprock is highly governed by its mineral composition.
Changes in permeability and porosity are limited as a result of interactions
between CO2, saline and caprock (e.g. Wollenweber et al., 2010; Alemu et
al., 2011).
While shale has a similar microstructure and mineral composition to coal,
this may not result in the same response to stress, adsorption and gas
transport. Therefore, further investigation of the permeability of shale is
required. In this thesis, laboratory measurements were performed on a shale
sample from Green River Formation in USA, using He and CO2 at room
temperature. The effects of gas adsorption, gas permeability under tri-axial
conditions (with respect to the pore and confining pressures) and the
8
School of Mechanical and Chemical Engineering The university of Western Australia
geomechanical properties of the shale were measured. Gas transport at
room temperature was also analysed.
9
School of Mechanical and Chemical Engineering The university of Western Australia
Chapter 2
Experimental Investigation
2.1 Apparatus
Experiments were completed using a simple tri-axial apparatus capable of
applying defined effective stress paths and concurrently measuring
permeability and adsorbing capacity as shown in Figure 1-1. A tri-axial
core holder (Temco) was used to accept membrane-sheathed cylindrical
samples (2.5cm diameter and 5 cm long) and apply independent loading in
the radial and axial directions. This holder can apply a maximum to 35 ±
0.007 MPa of confining and axial stresses by dual cylinder syringe pumps
(ISCO 500D). Constant upstream pressure can be applied by a third syringe
pump (ISCO 500D) with the downstream reservoir open to the atmosphere
to measure both water and gas permeabilities to 10-23 m2. Pressure can be
controlled by the syringe pumps consisting of a piston-cylinder assembly
with a maximum internal volume of 507.38 ml, which can be operated
either in constant pressure mode (up to 35 MPa), constant volume mode
(up to 507.38 ml), or constant flow rate mode (up to 204 ml min-1). The
pump displacement calculated from stepper-motor drive increments
(resolution 31.71 nl) can be used to reflect volume changes in the pore fluid
10

School of Mechanical and Chemical Engineering The university of Western Australia
system. Constant temperature to 0.1 °C can be maintained by a temperature
control jacket.
The Temco core holder was used to sandwich the cylindrical shale sample
within the between two cylindrical stainless steel loading platens with
through-going flow connections and flow distributors. A polyvinyl chloride
(PVC) rubber jacket was used to isolate the sample and axial platens from
the confining fluid. When measuring permeability by the pressure transient
method, the end-platens were connected to two low-volume stainless steel
reservoirs by tubing and isolating valves. The volumes of the upstream and
downstream were 16 cm3 and 2.94 cm3 respectively and the volumes of
reservoirs were significantly higher than the total adsorption capacity of the
sample used in the experiments. Upstream and downstream gas pressures
were recorded by pressure transducers (PDCR 610 and Omega PX302-
5KGV) to a resolution of 0.03 MPa. The gas-pressurized upstream
reservoir was discharged through the sample to the downstream reservoir
with the equilibration time defining the permeability of the sample (Brace
et al., 1968; Hsieh et al., 1980). Volume change effects due to the high
compressibility of gas in the reservoirs were minimized by covering the gas
reservoirs with thermal insulation material to maintain constant
temperature. The mass balance method was used to measure the mass of
gas sorbed into the shale samples.
11

School of Mechanical and Chemical Engineering The university of Western Australia
The flow rate, pressure and fluid volume signals obtained from the ISCO
pumps were recorded by a National Instruments Labview program using a
serial connection (RS-232) between the pumps and the logging computer.
Output signals from the pressure transducers were converted at 16-bit
resolution using a 16-channel data acquisition system (National
Instruments - USB 6211). This Labview software can record signals
digitally at a sampling rate of 1 Hz to 1 kHz.
Before starting the series of experiments, the calibration of the stiffness of
the Temco tri-axial cell was calibrated to allow the true sample deformation
to be measured when samples were loaded. The apparatus was calibrated
with a stainless steel dummy sample with a known Young's modulus,
loaded axially in the core holder at conditions identical to those used in
shale sample experiments. Also, a He leakage check was conducted for
each gas permeability test to make sure there were no leaks in the system
prior to loading.
12
School of Mechanical and Chemical Engineering The university of Western Australia
Fig.1. Schematic of experimental set-up
13
School of Mechanical and Chemical Engineering The university of Western Australia
2.2 Sample preparation
The experiments were performed on shale from the Green River formation
of Pennsylvania recovered as a large block from a depth of 1100m, drilled
perpendicular to the bedding plane. The sample was built by first placing
shrink-wrap tubing over the end of first platen with the empty tubing
pointing upwards. A frit was inserted on the platen face and this open tube
was then filled with sample to a height of two inches. A frit and second
platen were then inserted on top of the sample, and an additional wrap was
placed around the sample to ensure no leakage. Spacers were placed at
either end of the platen assembly to make the desired length for the tri-axial
vessel holder. Everything not covered by the shrink-wrap was then covered
by rubber jackets, and tied with metal wires to prevent the confining fluid
from leaking into the sample or out of the vessel. The sample was then
loaded into the vessel and the open end of the tube was closed. The flow
lines exiting the pressure vessel were then connected to upstream and
downstream reservoirs. Details of the sample preparation procedure are
shown in Appendix A.
14

School of Mechanical and Chemical Engineering The university of Western Australia
2.3 Method and Analysis
2.3.1 Permeability
The pressure transient method was used to conduct the gas flow
experiments in the low permeability samples (Brace et al., 1968; Hsieh et
al., 1980). The governing equation for the pressure pulse through sample
can be written as follows.
Pup(t)-Pdn(t)=(Pup(to)-Pdn(to))e-αt (1)
α=(kA/µβL)(1/Vup+1/Vdn) (2)
Where Pup(t)-Pdn (t) is the pressure difference between the upstream and
downstream reservoirs at time t; (Pup (to)-Pdn (to)) is the initial pressure
difference between the upstream and downstream reservoir at time to; α is
the slope of the line when plotting the pressure decay Pup(t)- Pdn(t) on semi-
log paper against time(Fig.2); A and L are the cross-sectional area and
length of the sample, respectively, which define the dimensions of the
sample; µ, β, Vup, and Vdn are the dynamic viscosity and compressibility of
the gas, and the volume of the upstream reservoir and downstream
reservoir, respectively; and permeability k is calculated from Equation (2)
where it is the only unknown.
2.3.2 Sorption
The pressure transient method was used to measure the void volume of the
15

School of Mechanical and Chemical Engineering The university of Western Australia
sample as a direct consequence of measuring the permeability to He. Firstly,
we evacuated air from the system, injected a known amount of He in the
upstream reservoir and opened the shut-off valve. As He is inert, the void
volume can be calculated from the pressure of the upstream and
downstream reservoirs and cell, and the volumes from upstream and
downstream reservoirs, as shown in Equation (3):
(PupVup/ZRT)pulse,10=(P(Vup+Vdn+Vvd)/ZRT)pulse,1 (3)
Where the pulse, 10 denotes the initial condition for the pressure pulse; pulse, 1
represents the final condition for the pressure pulse 1; Z is the
compressibility factor of the gas at corresponding temperature and pressure;
R is the universal gas constant; T is the absolute temperature; P is the final
pressure of the system; and Vvd is the unknown void volume of the sample
corresponding to pressure pulse 1.
This method was repeated for multiple cycles and to obtain the void
volume of the sample corresponding to different pressures:
(PupVup/ZRT)pulse,no+(P(Vdn+Vvd)/ZRT)pulse,n-1
= (P(Vup+Vdn+Vvd)/ZRT)pulse,n (4)
Where pulse, no denotes the initial condition for the pressure pulse; and n and
pulse, n represents the final condition for the nth pressure pulse.
16
School of Mechanical and Chemical Engineering The university of Western Australia
After the void volume of the sample was obtained at different pressures,
tests were repeated using CO2. Since CO2 is a sorbing gas, the mass
balance equation can be expressed as follows:
(PupVup/ZRT)pulse,no+(P(Vdn+Vvd)/ZRT)pulse,n-1
= (P (Vup+Vdn+Vvd)/ZRT)pulse,n+npulse,n (5)
Where npulse,n is the amount of gas adsorbed in the sample in moles for the
nth pressure pulse.
These steps were repeated until the desired final pressure level was reached.
The cumulative amount of gas adsorbed in the sample was then calculated
by summing up the quantities measured in each pressure pulse step.
2.3.3 Morphology
The morphology of samples and the thickness of coatings were examined
using a scanning electron microscope (Zeiss 1555 VP FE-SEM,
Oberkochen, Germany) equipped with measurement software and an EDS
system.
17

School of Mechanical and Chemical Engineering The university of Western Australia
Chapter 3
Experimental Observations and Discussion
3.1 Experimental observations
A series of experiments were run on one sample to determine permeability
at same total stress and different pore pressure. The experiments are
conducted at room temperature. We define effective stress as the difference
between confining stress and pore pressure inside the sample. For each
sample permeability was measured at confining stress and axial stress 7
MPa, and the pore pressure was increasing from 1MPa to 5MPa. The
influence of effective-stress-driven changes in volumes were examined
with non-sorbing He. The superposed influences of swelling were
examined with sorbing gas CO2. The apparatus had upstream and
downstream reservoir characteristics as identified in Table3-1.
Table3-1 Experimental constants
Experiment constants Value Units
Volume upstream 1.6E-5 m3
Volume downstream 2.94E-6 m3
Area of cross section of sample 5.06E-7 m3
Length of sample 1.2E-2 m3
18

School of Mechanical and Chemical Engineering The university of Western Australia
Permeabilities of the samples to He and CO2 as the permeating fluid were
measured as defined previously by recording the equilibration of pressures
with time. The change in pressure with time was plotted for both upstream
and downstream reservoirs. In ideal conditions the two should meet at
equilibrium pressure. The equilibrium pressure was then subtracted from
the pressure in the upstream and then plotted vs time on a semi-log plot.
The slope of the resulting line gave the value of α, which was used to
calculate permeability using Equation 2.
3.1.1 Results of permeability to He
Five experiments were conducted to measure the permeability to He under
different pore pressure. We increased the initial pore pressure from
1.34MPa to 5.26MPa while the downstream initial pressure increased from
0.03MPa to 4.09MPa. The pressure variations of upstream and downstream
vs time were recorded by Fig 2, Fig 4, Fig6, Fig 8 and Fig 10. Data was
stopped to record when pressures mostly kept constant and the equilibrium
pressure was the average value of upstream and downstream pressure. It is
obvious that the figures have a same trend: at beginning, pressure sharply
decreased and increased for upstream and downstream, respectively; then
the pressure had a trend to flatten and finally to reach constantly or meet
together. Pressure decay Pup (t) - Pdn(t) on semi-log paper against time were
19
School of Mechanical and Chemical Engineering The university of Western Australia
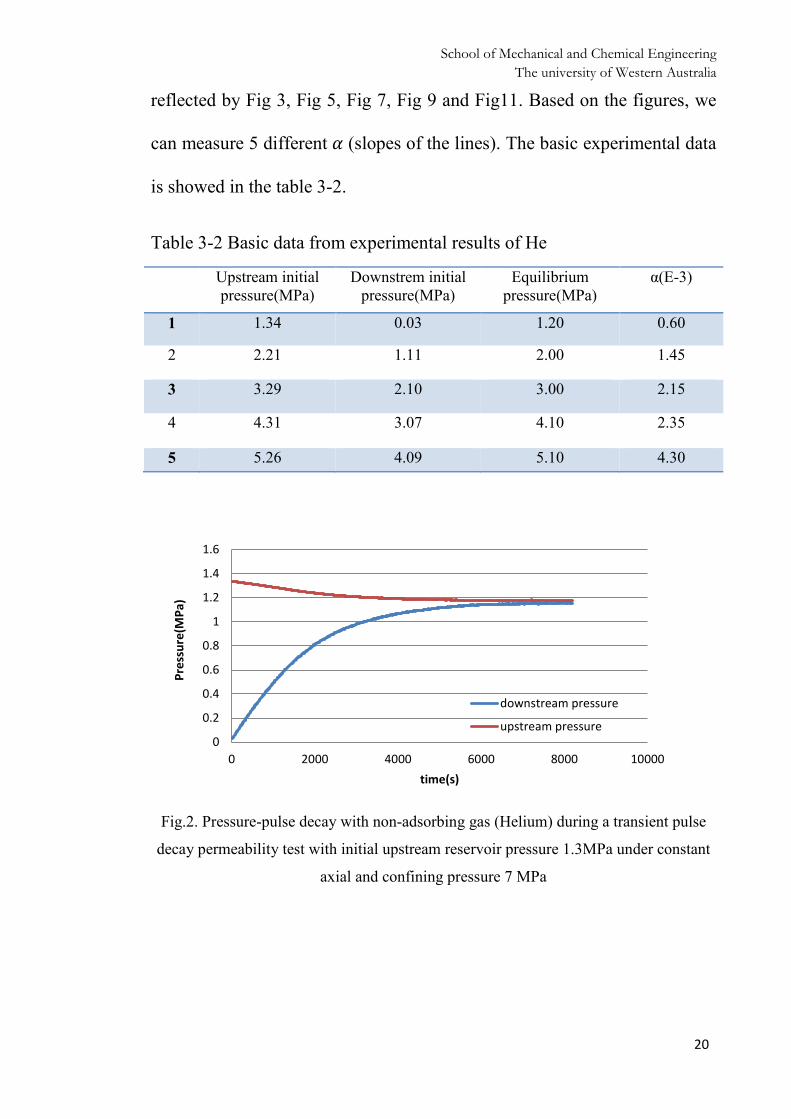
reflected by Fig 3, Fig 5, Fig 7, Fig 9 and Fig11. Based on the figures, we
can measure 5 different 𝛼𝛼 (slopes of the lines). The basic experimental data
is showed in the table 3-2.
Table 3-2 Basic data from experimental results of He
Upstream initial pressure(MPa)
Downstrem initial pressure(MPa)
Equilibrium pressure(MPa)
α(E-3)
1 1.34 0.03 1.20 0.60
2 2.21 1.11 2.00 1.45
3 3.29 2.10 3.00 2.15
4 4.31 3.07 4.10 2.35
5 5.26 4.09 5.10 4.30
Fig.2. Pressure-pulse decay with non-adsorbing gas (Helium) during a transient pulse
decay permeability test with initial upstream reservoir pressure 1.3MPa under constant
axial and confining pressure 7 MPa
0
0.2
0.4
0.6
0.8
1
1.2
1.4
1.6
0 2000 4000 6000 8000 10000
Pres
sure
(MPa
)
time(s)
downstream pressure
upstream pressure
20

School of Mechanical and Chemical Engineering The university of Western Australia
Fig.3. Pressure decay Pup (t) - Pdn(t) on semi-log paper against time for Helium with
initial upstream reservoir pressure 1.3MPa
Fig.4. Pressure-pulse decay with non-adsorbing gas (Helium) during a transient pulse
decay permeability test with initial upstream reservoir pressure 2.2MPa under constant
axial and confining pressure 7 MPa
y = -6.04E-04x + 3.45E-01 R² = 9.99E-01
-4-3.5
-3-2.5
-2-1.5
-1-0.5
00.5
0 1000 2000 3000 4000 5000 6000 7000time(S)
1
1.2
1.4
1.6
1.8
2
2.2
2.4
0 500 1000 1500 2000 2500 3000
Pres
sure
(MPa
)
time(s)
downstream pressure
upstream pressure
21
School of Mechanical and Chemical Engineering The university of Western Australia
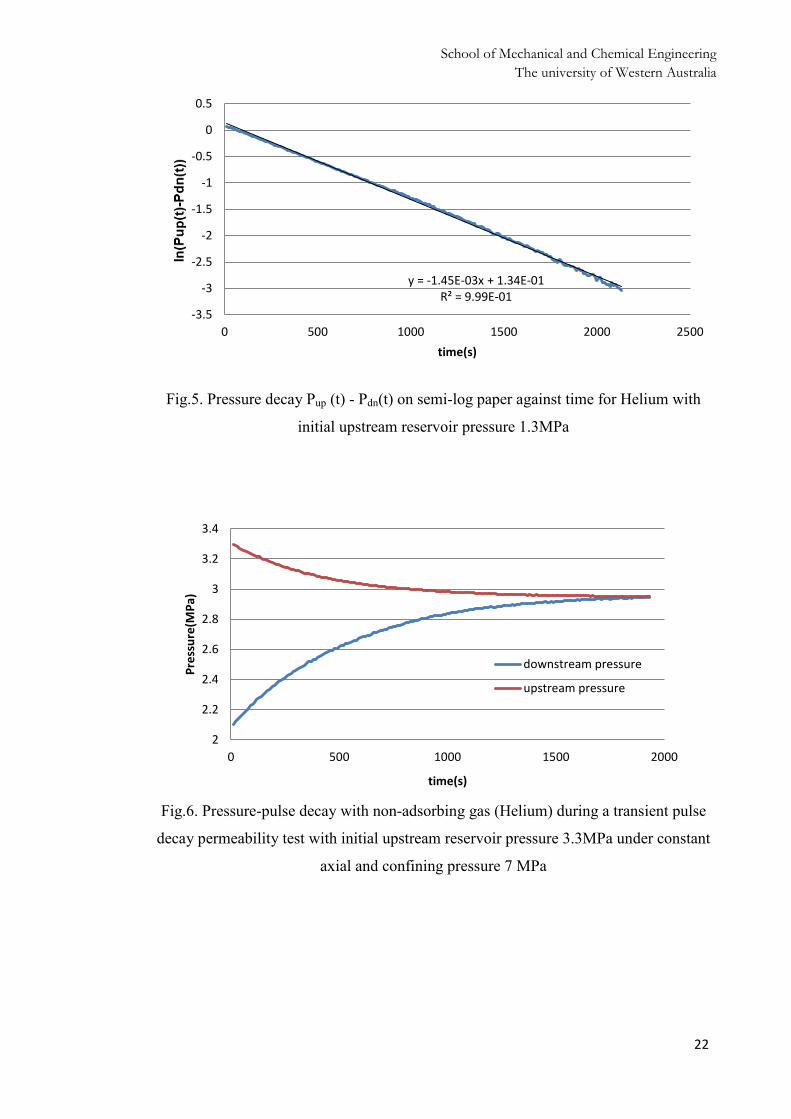
Fig.5. Pressure decay Pup (t) - Pdn(t) on semi-log paper against time for Helium with
initial upstream reservoir pressure 1.3MPa
Fig.6. Pressure-pulse decay with non-adsorbing gas (Helium) during a transient pulse
decay permeability test with initial upstream reservoir pressure 3.3MPa under constant
axial and confining pressure 7 MPa
y = -1.45E-03x + 1.34E-01 R² = 9.99E-01
-3.5
-3
-2.5
-2
-1.5
-1
-0.5
0
0.5
0 500 1000 1500 2000 2500time(s)
2
2.2
2.4
2.6
2.8
3
3.2
3.4
0 500 1000 1500 2000
Pres
sure
(MPa
)
time(s)
downstream pressure
upstream pressure
22

School of Mechanical and Chemical Engineering The university of Western Australia
Fig.7. Pressure decay Pup (t) - Pdn(t) on semi-log paper against time for Helium with
initial upstream reservoir pressure 3.3MPa
Fig.8. Pressure-pulse decay with non-adsorbing gas (Helium) during a transient pulse
decay permeability test with initial upstream reservoir pressure 4.3MPa under constant
axial and confining pressure 7 MPa
y = -2.15E-03x + 2.33E-01 R² = 9.99E-01
-2.5
-2
-1.5
-1
-0.5
0
0.5
0 200 400 600 800 1000 1200time(s)
3
3.2
3.4
3.6
3.8
4
4.2
4.4
0 500 1000 1500 2000
Pres
sure
(MPa
)
time(s)
downstream pressure
upstream pressure
23

School of Mechanical and Chemical Engineering The university of Western Australia
Fig.9. Pressure decay Pup (t) - Pdn(t) on semi-log paper against time for Helium with
initial upstream reservoir pressure 4.3MPa
Fig.10. Pressure-pulse decay with non-adsorbing gas (Helium) during a transient pulse
decay permeability test with initial upstream reservoir pressure 5.3MPa under constant
axial and confining pressure 7 MPa
y = -2.35E-03x + 2.57E-01 R² = 9.99E-01
-2.2
-1.7
-1.2
-0.7
-0.2
0.3
0.8
0 200 400 600 800 1000 1200time(s)
4
4.2
4.4
4.6
4.8
5
5.2
5.4
0 300 600 900 1200
Pres
sure
(MPa
)
time(s)
downstream pressure
upstream pressure
24
School of Mechanical and Chemical Engineering The university of Western Australia
Fig.11. Pressure decay Pup (t) - Pdn(t) on semi-log paper against time for Helium with
initial upstream reservoir pressure 5.3MPa
As the viscosity of gas varies with pressure, viscosity of He can be checked
from NIST Chemistry WebBook. Permeability can be measured by
Equation 6 and all the relative data is summarized in Table 3-3.
k=αµβLVupVdn/(A(Vup+Vdn)) (6)
Table 3-3 Data for permeability calculation for He
1 2 3 4 5
α (E-3) 0.60 1.45 2.15 2.35 4.30
µ (E-5 Pa.s) 1.98 1.99 1.99 1.99 2.00 L(E-2 m) 1.20 1.20 1.20 1.20 1.20
Vup(E-5 m3) 1.60 1.60 1.60 1.60 1.60
Vdn(E-6 m3) 2.94 2.94 2.94 2.94 2.94
A(E-4 m2) 5.06 5.06 5.06 5.06 5.06
Peq(MPa) 1.20 2.00 3.00 4.10 5.10
Vup+Vdn(E-5 m3) 1.89 1.89 1.89 1.89 1.89
k(E-19 m2) 6.01 8.50 8.57 6.73 9.74
y = -4.30E-03x + 2.11E-01 R² = 9.98E-01
-2.5
-2
-1.5
-1
-0.5
0
0.5
0 100 200 300 400 500 600time(s)
25
School of Mechanical and Chemical Engineering The university of Western Australia
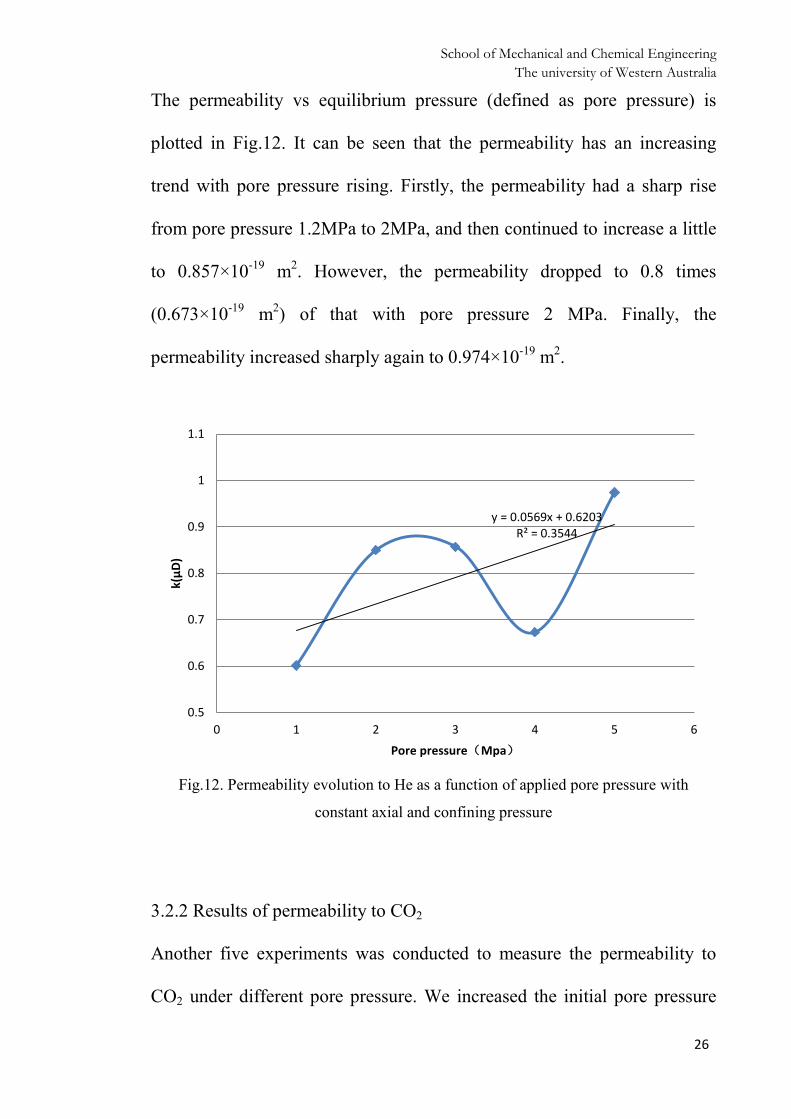
The permeability vs equilibrium pressure (defined as pore pressure) is
plotted in Fig.12. It can be seen that the permeability has an increasing
trend with pore pressure rising. Firstly, the permeability had a sharp rise
from pore pressure 1.2MPa to 2MPa, and then continued to increase a little
to 0.857×10⁻¹⁹ m2. However, the permeability dropped to 0.8 times
(0.673×10-19 m2) of that with pore pressure 2 MPa. Finally, the
permeability increased sharply again to 0.974×10⁻¹⁹ m2.
Fig.12. Permeability evolution to He as a function of applied pore pressure with
constant axial and confining pressure
3.2.2 Results of permeability to CO2
Another five experiments was conducted to measure the permeability to
CO2 under different pore pressure. We increased the initial pore pressure
y = 0.0569x + 0.6203 R² = 0.3544
0.5
0.6
0.7
0.8
0.9
1
1.1
0 1 2 3 4 5 6
k(µD
)
Pore pressure(Mpa)
26
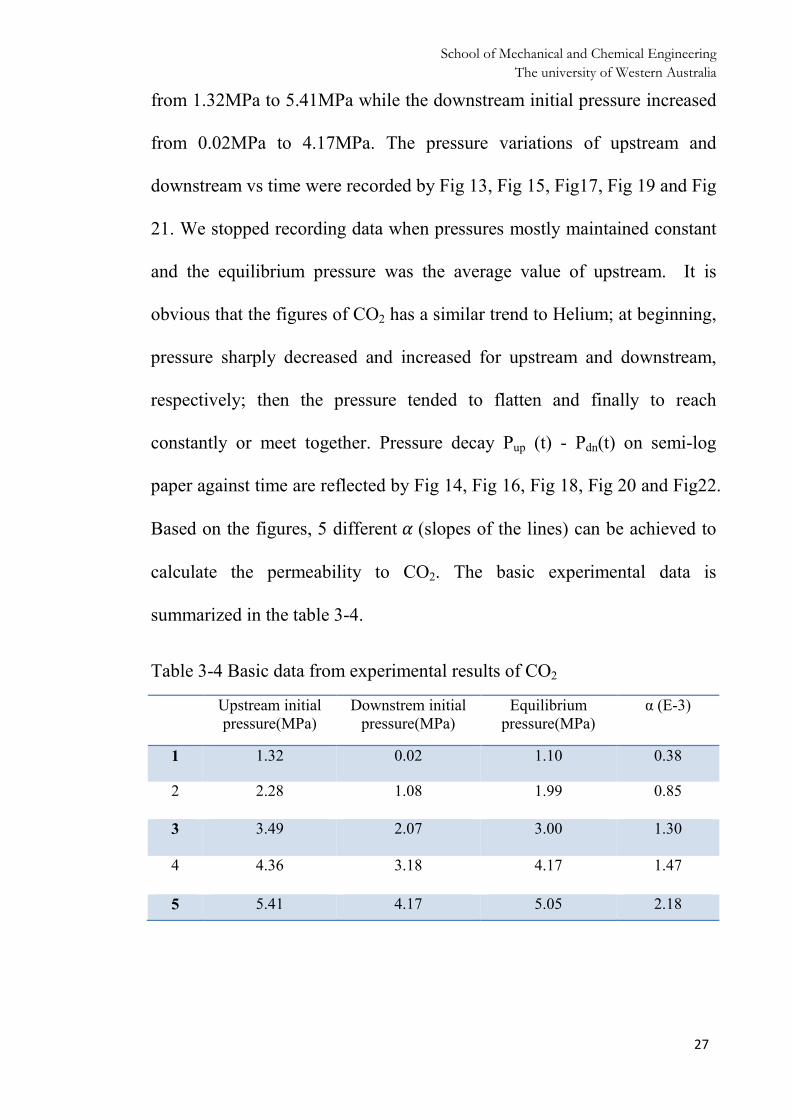
School of Mechanical and Chemical Engineering The university of Western Australia
from 1.32MPa to 5.41MPa while the downstream initial pressure increased
from 0.02MPa to 4.17MPa. The pressure variations of upstream and
downstream vs time were recorded by Fig 13, Fig 15, Fig17, Fig 19 and Fig
21. We stopped recording data when pressures mostly maintained constant
and the equilibrium pressure was the average value of upstream. It is
obvious that the figures of CO2 has a similar trend to Helium; at beginning,
pressure sharply decreased and increased for upstream and downstream,
respectively; then the pressure tended to flatten and finally to reach
constantly or meet together. Pressure decay Pup (t) - Pdn(t) on semi-log
paper against time are reflected by Fig 14, Fig 16, Fig 18, Fig 20 and Fig22.
Based on the figures, 5 different 𝛼𝛼 (slopes of the lines) can be achieved to
calculate the permeability to CO2. The basic experimental data is
summarized in the table 3-4.
Table 3-4 Basic data from experimental results of CO2
Upstream initial pressure(MPa)
Downstrem initial pressure(MPa)
Equilibrium pressure(MPa)
α (E-3)
1 1.32 0.02 1.10 0.38
2 2.28 1.08 1.99 0.85
3 3.49 2.07 3.00 1.30
4 4.36 3.18 4.17 1.47
5 5.41 4.17 5.05 2.18
27
School of Mechanical and Chemical Engineering The university of Western Australia
Fig.13. Pressure-pulse decay with adsorbing gas (CO2) during a transient pulse decay
permeability test with initial upstream reservoir pressure 1.3MPa under constant axial
and confining pressure 7 MPa
Fig.14. Pressure decay Pup (t) - Pdn(t) on semi-log paper against time for CO2 with initial
upstream reservoir pressure 1.3MPa
0
0.2
0.4
0.6
0.8
1
1.2
1.4
1.6
0 3000 6000 9000 12000
Pres
sure
(MPa
)
time(s)
downstream pressure
upstream pressure
y = -3.78E-04x + 4.28E-01 R² = 9.96E-01
-4.5
-4
-3.5
-3
-2.5
-2
-1.5
-1
-0.5
0
0.5
1
0 2000 4000 6000 8000 10000 12000time(s)
28

School of Mechanical and Chemical Engineering The university of Western Australia
Fig.15. Pressure-pulse decay with adsorbing gas (CO2) during a transient pulse decay
permeability test with initial upstream reservoir pressure 2.2MPa under constant axial
and confining pressure 7 MPa
Fig.16. Pressure decay Pup (t) - Pdn(t) on semi-log paper against time for CO2 with initial
upstream reservoir pressure 2.2MPa
1
1.2
1.4
1.6
1.8
2
2.2
2.4
0 500 1000 1500 2000 2500 3000 3500 4000
Pres
sure
(MPa
)
time(s)
downstream pressure
upstream pressure
y = -8.53E-04x + 1.96E-01 R² = 9.96E-01
-3
-2.5
-2
-1.5
-1
-0.5
0
0.5
0 500 1000 1500 2000 2500 3000 3500time(s)
29

School of Mechanical and Chemical Engineering The university of Western Australia
Fig.17. Pressure-pulse decay with adsorbing gas (CO2) during a transient pulse decay
permeability test with initial upstream reservoir pressure 3.35Mpa under constant axial
and confining pressure 7 MPa
Fig.18. Pressure decay Pup (t) - Pdn(t) on semi-log paper against time for CO2 with initial
upstream reservoir pressure 3.35MPa
2
2.2
2.4
2.6
2.8
3
3.2
3.4
3.6
0 500 1000 1500 2000 2500 3000
Pres
sure
(MPa
)
time(s)
downstream pressure
upstream pressure
y = -1.30E-03x + 4.44E-01 R² = 9.95E-01
-3.5
-3
-2.5
-2
-1.5
-1
-0.5
0
0.5
1
0 500 1000 1500 2000 2500time(s)
30
School of Mechanical and Chemical Engineering The university of Western Australia
Fig.19. Pressure-pulse decay with adsorbing gas (CO2) during a transient pulse decay
permeability test with initial upstream reservoir pressure 4.35MPa under constant axial
and confining pressure 7 MPa
Fig.20. Pressure decay Pup (t) - Pdn(t) on semi-log paper against time for CO2 with initial
upstream reservoir pressure 4.35MPa
3
3.2
3.4
3.6
3.8
4
4.2
4.4
4.6
0 500 1000 1500 2000 2500 3000
time(s)
downstream pressure
upstream pressure
y = -1.47E-03x + 2.13E-01 R² = 9.99E-01
-3.5
-3
-2.5
-2
-1.5
-1
-0.5
0
0.5
0 500 1000 1500 2000 2500time(s)
31
School of Mechanical and Chemical Engineering The university of Western Australia
Fig.21. Pressure-pulse decay with adsorbing gas (CO2) during a transient pulse decay
permeability test with initial upstream reservoir pressure 5.3MPa under constant axial
and confining pressure 7 MPa
Fig.22. Pressure decay Pup (t) - Pdn(t) on semi-log paper against time for CO2 with initial
upstream reservoir pressure 3.3MPa
4
4.2
4.4
4.6
4.8
5
5.2
5.4
5.6
0 400 800 1200 1600
Pres
sure
(MPa
)
time(s)
downstream pressure
upstream pressure
y = -2.18E-03x + 2.49E-01 R² = 9.97E-01
-2.5
-2
-1.5
-1
-0.5
0
0.5
0 200 400 600 800 1000 1200time(s)
32
School of Mechanical and Chemical Engineering The university of Western Australia
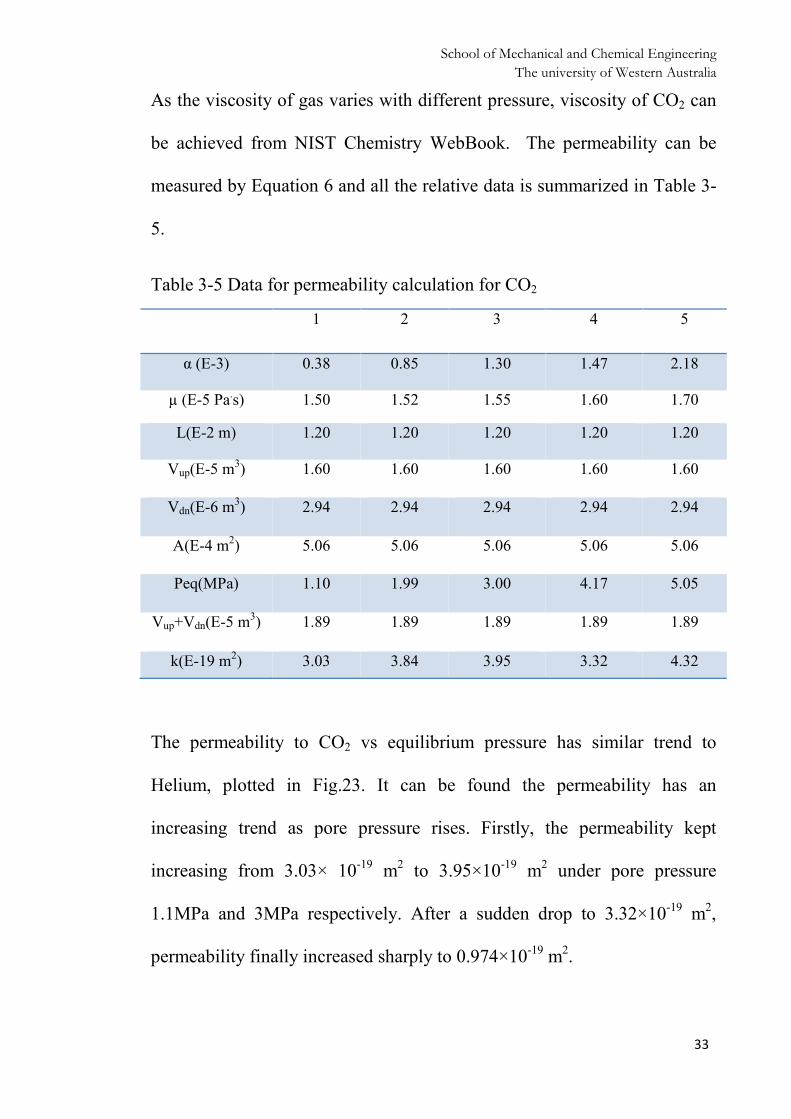
As the viscosity of gas varies with different pressure, viscosity of CO2 can
be achieved from NIST Chemistry WebBook. The permeability can be
measured by Equation 6 and all the relative data is summarized in Table 3-
5.
Table 3-5 Data for permeability calculation for CO2
1 2 3 4 5
α (E-3) 0.38 0.85 1.30 1.47 2.18
µ (E-5 Pa.s) 1.50 1.52 1.55 1.60 1.70
L(E-2 m) 1.20 1.20 1.20 1.20 1.20
Vup(E-5 m3) 1.60 1.60 1.60 1.60 1.60
Vdn(E-6 m3) 2.94 2.94 2.94 2.94 2.94
A(E-4 m2) 5.06 5.06 5.06 5.06 5.06
Peq(MPa) 1.10 1.99 3.00 4.17 5.05
Vup+Vdn(E-5 m3) 1.89 1.89 1.89 1.89 1.89
k(E-19 m2) 3.03 3.84 3.95 3.32 4.32
The permeability to CO2 vs equilibrium pressure has similar trend to
Helium, plotted in Fig.23. It can be found the permeability has an
increasing trend as pore pressure rises. Firstly, the permeability kept
increasing from 3.03× 10⁻¹⁹ m2 to 3.95×10⁻¹⁹ m2 under pore pressure
1.1MPa and 3MPa respectively. After a sudden drop to 3.32×10⁻¹⁹ m2,
permeability finally increased sharply to 0.974×10⁻¹⁹ m2.
33

School of Mechanical and Chemical Engineering The university of Western Australia
Fig.23. Permeability evolution to CO2 as a function of applied pore pressure with
constant axial and confining pressure 7 MPa
0.2
0.25
0.3
0.35
0.4
0.45
0.5
0 1 2 3 4 5 6
k(µD
)
Pore pressure(MPa)
34
School of Mechanical and Chemical Engineering The university of Western Australia
3.2 Discussion
From Fig.24, it can be seen that as pore pressure increased, the
permeability to He ranges from 6.01×10⁻¹⁹ m2 to 9.74×10⁻¹⁹ m2 while the
permeability to CO2 was almost halved in the range 3.03×10⁻¹⁹ m2 to
4.32×10⁻¹⁹ m2. It can be explained by two reasons: (1) the molecule of He is
much smaller than CO2, so the molecule of He can permeate into more
small fractures in the sample; (2) as CO2 can be adsorbed by the organic
matters in the shale sample, more CO2 can be stored in the matrix during
gas transport. It can be also found although the permeabilities to He and
CO2 fluctuate as pore pressure increasing, there is still an increasing trend
due to effective stress decreasing. Fig.25 showed that with effective stress
increasing, permeabilities to both He and CO2 tended to decrease. The
permeabilities to He and CO2 increased by 43% and by 30% respectively,
as effective stress decreased from 6MPa to 4MPa, and finally increased to
1.62 times and 1.43 times of the initial permeability at effective stress
2MPa.
35
School of Mechanical and Chemical Engineering The university of Western Australia
Fig.24. Evolution of permeability as a function of applied pore pressure with non-
sorbing gas (Helium) and sorbing gas (CO2) under constant axial and confining pressure
7MPa
Fig.25. Evolution of permeability as a function of applied pore pressure with constant
axial and confining pressure 7MPa
0
0.2
0.4
0.6
0.8
1
1.2
0 1 2 3 4 5 6
k(µD
)
Pore pressure(Mpa)
He
CO2
0
0.2
0.4
0.6
0.8
1
1.2
1 2 3 4 5 6 7
k(µD
)
Effective stress(Mpa)
HeCO2
36

School of Mechanical and Chemical Engineering The university of Western Australia
Experimental observations illustrate that permeability evolution is closely
linked with gas transport between fracture and matrix. Based on the model
of Liu et al. (2011), during gas transport, gas diffused gradually from the
fractures to the matrix and the area affected by gas transport expanded
dynamically from the fractures towards to the matrix. This suggests
permeability evolution is dynamic during gas transport and can be divided
into two stages (Fig.26). In the first stage, the gas-influenced area is limited
to fracture surfaces, which causes the fracture apertures to decrease,
thereby reducing permeability. In the second stage, the gas-influenced area
penetrates further into the matrix which causes the fracture apertures to
increase, resulting in permeability recovery. This hypothesis is supported
by our experimental observations.
Fig.26. Illustration of the difference between local swelling and marco swelling
37
School of Mechanical and Chemical Engineering The university of Western Australia
Between two stages of the gas transport process, where local swelling
dominated, the permeability of both He and CO2 was basically lower than
at the final equilibrium state. The permeability with 4MPa did not reach
final equilibrium, so this is the reason why the permeabilities to He and
CO2 decreased from pore pressure 3 MPa to 4MPa and then increased from
pore pressure 4 MPa to 5MPa. At final equilibrium state when the uniform
macro swelling occurred, permeability for both He and CO2 increased as
pore pressure increased, only determined by effective stress decreasing.
38
School of Mechanical and Chemical Engineering The university of Western Australia
Chapter 4
Conclusion
A pulse transient method was applied to investigate the evolution of shale
sample permeability, affected by stress, sorption and gas transport between
the fracture and the matrix. Based on the experimental results, it can be
concluded that:
• Green River Shale has a low permeability to CO2 in the order of
magnitude of 10-19 m2, which indicates its good seal efficiency as a
caprock for CO2 sequestration.
• Gas transport in the shale sample matches the gas transport predicted
by Liu et al. (2011):
• At the initial stage of CO2 injection, gradual diffusion of gas
from the fractures to the matrix resulted in matrix swelling
within the vicinity of the fracture compartment. This confirms
that shale permeability is controlled by the internal fracture
boundary condition.
39
School of Mechanical and Chemical Engineering The university of Western Australia
• Furthermore, as the matrix swelling continued and expanded
to macro-swelling, the external boundary condition became
the dominant factor affecting the permeability of the shale.
Further research This thesis has investigated the permeability of shale with He and CO2. The
further research will focus on the effect of water on the evolution of
permeability and breakthrough pressure of this shale. Some modelling
could also be built to combine the experimental data and simulations,
aiming to provide a certain scientific and practical value for CO2
sequestration.
40

School of Mechanical and Chemical Engineering The university of Western Australia
References
Alemu, B.L., Aagaard, P., Munz, I.A., Skurtveit E., 2011. Caprock interaction with CO2: A
laboratory study of reactivity of shale with supercritical CO2 and brine. Journal of Applied
Geochemistry 26 (2011) 1975-1989
Bachu., Adams J J. Sequestration of CO2 in geological media in response to climate change:
capacity of deep saline aquifers to sequester CO2 in solution[J]. Energy Conversion and
management, 2003, 44(20): 2151-3175.
Brace, W.F., J.B. Walsh, and W.T. Frangos, 1968. Permeability of granite under high pressure.
J.Geophys. Res. 73: 2,225-2,236.
Bustin, R.M., Cui, X., Chikatamarla, L., 2008. Impacts of volumetric strain on CO2
sequestration in coals and enhanced CH4 recovery. AAPG Bulletin 92, 15-29.
Chadwick, A., Arts, R., Bernstone, C., May, F., Thibeau, S. & Zweigel, P. 2008. Best Practise
for the Storage of CO2 in Saline Aquifers - Observations and guidelines from the SACS and
CO2STORE projects. North Star.BGS.
Chen, Z., Pan, Z., Liu, J., Connell, L.D., Elsworth, D., 2011. Effect of the effective stress
coefficient and sorption-induced strain on the evolution of coal permeability: Experimental
observations. International Journal of Greenhouse Gas Control 5, 1284-1293.
Chikatamarla, L., Cui, X., Bustin, R.M., 2004a. Implications of volumetric swelling/shrinkage
of coal in sequestration of acid gases. In: International Coalbed Methane Symposium
Proceedings, Tuscaloosa, AL.
Chikatamarla, L., Cui, X., Bustin, R.M., 2004b. Implications of volumetric swelling/shrinkage
of coal in sequestration of acid gases. In: The International Coalbed Methane Symposium,
Tuscaloosa, AL.
41
School of Mechanical and Chemical Engineering The university of Western Australia
Cui, X., Bustin, R.M., 2005. Volumetric strain associated with methane desorption and its
impact on coalbed gas production from deep coal seams. AAPG Bulletin 89 (9), 1181-1202.
Cui, X., Bustin, R.M., Chikatamarla, L., 2007. Adsorption-induced coal swelling and stress:
implications for methane production and acid gas sequestration into coal seams. Journal of
Geophysics Research 112, B10202.
Deng, H., Brian, R., Ellis, B.R., Catherine, A., Peters, C.A., Fitts, J.P., Crandall, D., Bromhal,
G.S., 2013. Modifications of carbonate fracture hydrodynamic properties by CO2 —acidified
brine flow.
Energy Fuel 27, 4221-4231.
Fleury, M., Pironon, J., Le Nindre, Y. M., Bildstein, O., Berne, P., Lagneau, V., Broseta, D.,
Pichery, T., Fillacier, S., Lescame, M., and Vidal, O. (2010). “ Evaluating sealing efficiency of
caprocks for CO2 storage: An overview of the geocarbone-integrity program and results.” Oil &
Gas Science and Technology- Review De L Institut Franncais Du Petrole, Vol. 65, No. 3,
pp.435-444
Gherardi, F., Xu, T., Pruess, K., 2007. Numerical modelling of self-limiting and selfenhancing
caprock alteration induced by CO2 storage in a depleted gas reservoir. Chem. Geol. 244, 103-
129.
Harpalani, S., Chen, G., 1995. Estimation of changes in fracture porosity of coal with gas
emission. Fuel 74, 1491–1498.
Harpalani, S., Chen, G., 1997. Influence of gas production induced volumetric strain on
permeability of coal. Geotechnical and Geological Engineering 15 (4), 303-325.
Harpalani, S., Schraufnagel, R.A., 1990. Shrinkage of coal matrix with release of gas and its
impact on permeability of coal. Fuel 69 (5), 551-556.
Han, F., Busch, A., van Wageningen, N., Yang, J., Liu, Z., Krooss, B.M., 2010. Experimental
study of gas and water transport processes in the inter-cleat (matrix) system of coal: Anthracite
from Qinshui Basin, China. International Journal of Coal Geology 81, 128-138.
Hangx, S.J.T., Spiers, C.J., 2008. Reaction of plagioclase feldspars with CO2 under
hydrothermal conditions. Chem. Geol..
42
School of Mechanical and Chemical Engineering The university of Western Australia
Hsieh P.A., J.V. Tracy, C.E. Neuzil, J.D. Bredehoeft, and S.E. Silliman. 1980. A transient
laboratory method for determining the hydraulic properties of ‘tight’ rocks—I. Theory. Int.
J.Rock Mech. Min. Sci. & Geomech. Abstr. 18: 245–252.
Kaszuba, J.P., Janecky, D.R., Snow,M.G., 2003. Carbon dioxide reaction processes in a model
brine aquifer at 200 8C and 200 bars: implications for geologic sequestration of carbon. Appl.
Geochem. 18, 1065-1080.
Kang, S.M., Fathi, E., Ambrose,R.J., Akkutlu, I.Y., Sigal,R.F., 2011 Carbon dioxide storage
capacity of organic-rich shales, SPE Journal, 16, 842-855.
Kaszuba, J.P., Janecky, D.R., Snow, M.G., 2005. Experimental evaluation of mixed fluid
reactions between supercritical carbon dioxide and NaCl brine: relevance to the integrity of a
geologic carbon repository. Chem. Geol. 217, 277-293.
Kelemen, S.R., Kwiatek, L.M., Lee, A.G.K., 2006. Swelling and sorption response of selected
Argonne Premium bituminous coals to CO2, CH4, and N2. In: International Coalbed Methane
Symposium, Tuscaloosa, AL, USA.
Kharaka, Y.K., Cole, D.R., Thordsen, J.J., Kakouros, E., Nance, H.S., 2006. Gas–water–rock
interactions in sedimentary basins: CO2 sequestration in the Frio formation, Texas, USA. J.
Geochem.
Exploration 89, 183-186.
Levine, J.R., 1996. Model study of the influence of matrix shrinkage on absolute permeability
of coal bed reservoirs, vol. 109. Geological Society, London, pp.197-212 (Special Publications).
Liu J, Wang J, Chen Z, Wang S, Elsworth D, Jiang Y. Impact of transition from local swelling
to macro swelling on the evolution of coal permeability. Int J Coal Geol 2011;88:31-40.
Lu, J., Wilkinson, M., Stuart Haszeldine, R., Fallick, A.E., 2009. Long term performance of a
mudrock seal in natural CO2 storage. Geology 37(1), 35-38.
Mazumder, S., Wolf, K.H., 2008. Differential swelling and permeability change of coal in
response to CO2 injection for ECBM. International Journal of Coal Geology 74, 123-138.
43
School of Mechanical and Chemical Engineering The university of Western Australia
McKee CR, Bumb AC, Koenig RA. Stress-dependent permeability and porosity of coal. In:
International coalbed methane symposium, Tuscaloosa, Alabama:University of Alabama; 1987.
p. 183-93.
Palmer, I., Mansoori, J., 1996. How permeability depends on stress and pore pressure in
coalbeds: a new model. SPE Annual Technical Conference and Exhibition. Society of
Petroleum Engineers, Inc, Denver, Colorado.
Palmer, I.D., Mavor, M., Gunter, B., 2007. Permeability changes in coal seams during
production and injection. International Coalbed Methane Symposium. University of Alabama,
Tuscaloosa, Alabama. Paper 0713.
Pan, Z., Connell, L.D., Camilleri, M., 2010. Laboratory characterisation of coal reservoir
permeability for primary and enhanced coalbed methane recovery. International Journal of Coal
Geology 82 (3-4), 252-261
Pini, R., Ottiger, S., Burlini, L., Storti, G., Mazzotti, M., 2009. Role of adsorption and swelling
on the
dynamics of gas injection in coal. Journal of Geophysical Research 114 (B4), B04203.
Pone, J.D.N., Halleck, P.M., Mathews, J.P., 2010. 3D characterization of coal strains induced by
compression, carbon dioxide sorption, and desorption at in-situ stress conditions. International
Journal of Coal Geology 82, 262-268.
Robertson, E.P., Christiansen, R.L., 2006. A permeability model for coal and other fractured,
sorptive-elastic media. SPE Eastern Regional Meeting. Society of Petroleum Engineers, Canton,
Ohio, USA.
Seidle, J.R., Huitt, L.G.,1995. Experimental measurement of coal matrix shrinkage due to gas
desorption and implications for cleat permeability increases. In: International Meeting on
Petroleum Engineering. Society of Petroleum Engineer.
Seidle JP, Jeansonne DJ, Erickson DJ. Application of matchstick geometry to stress dependent
permeability in coals. Paper SPE 24361. In: SPE rocky mountain regional meeting, Casper,
Wyoming; 1992. p. 433-44.
44
School of Mechanical and Chemical Engineering The university of Western Australia
Siriwardane, H., Haljasmaa, I., McLendon, R., Irdi, G., Soong, Y., Bromhal, G., 2009. Influence
of carbon dioxide on coal permeability determined by pressure transient methods. International
Journal of Coal Geology 77, 109-118.
Smith, M.M., Sholokhova, Y., Hao, Y., Carroll, S.A., 2013. Evaporite caprock integrity: An
experimental study of reactive mineralogy and pore-scale heterogeneity during brine–CO2
exposure. Environ. Sci. Technol. 47, 262-268.
Somerton WH, Soylemezoglu IM, Dudley RC. Effect of stress on permeability of coal. Int J
Rock Mech Min Sci Geomech 1975;12:129-45.
Wang J., Peng,Y., 2013. Numerical modeling for the combined effects of two-phase flow,
deformation, gas diffusion and CO2 sorption on caprock sealing efficiency, Journal of
Geochemical Exploration.
Wang, G.X., Wei, X.R., Wang, K., Massarotto, P., Rudolph, V., 2010. Sorption-induced
swelling/shrinkage and permeability of coal under stressed adsorption/desorption conditions.
International Journal of Coal Geology 83 (1), 46-54.
Wang, S., Elsworth, D., Liu, J., 2011. Permeability evolution in fractured coal: the roles of
fracture geometry and water-content. International Journal of Coal Geology 87, 13-25.
Weniger, P., Kalkreuth,W., Busch, A., Krooss, B.M., 2010. High-pressuremethane and carbon
dioxide sorption on coal and shale samples from the Parana basin, Brazil. Int. J. Coal Geol. 84,
190-205.
Wollenweber, J., Alles, S., Kronimus, A., Busch, A., Stanjek, H., Krooss, B.M., 2009. Caprock
and overburden processes in geological CO2 storage: an experimental study on sealing
efficiency and mineral alterations. Energy Procedia 1, 3469-3476.
Zeng, K.H., Xu, J.X., He, P.F., Wang, C.G., 2011. Experimental study on permeability of coal
sample subjected to triaxial stresses. Procedia Engineering 26, 1051-1057.
45
School of Mechanical and Chemical Engineering The university of Western Australia
Appendix A
Photo documentation of Sample preparation
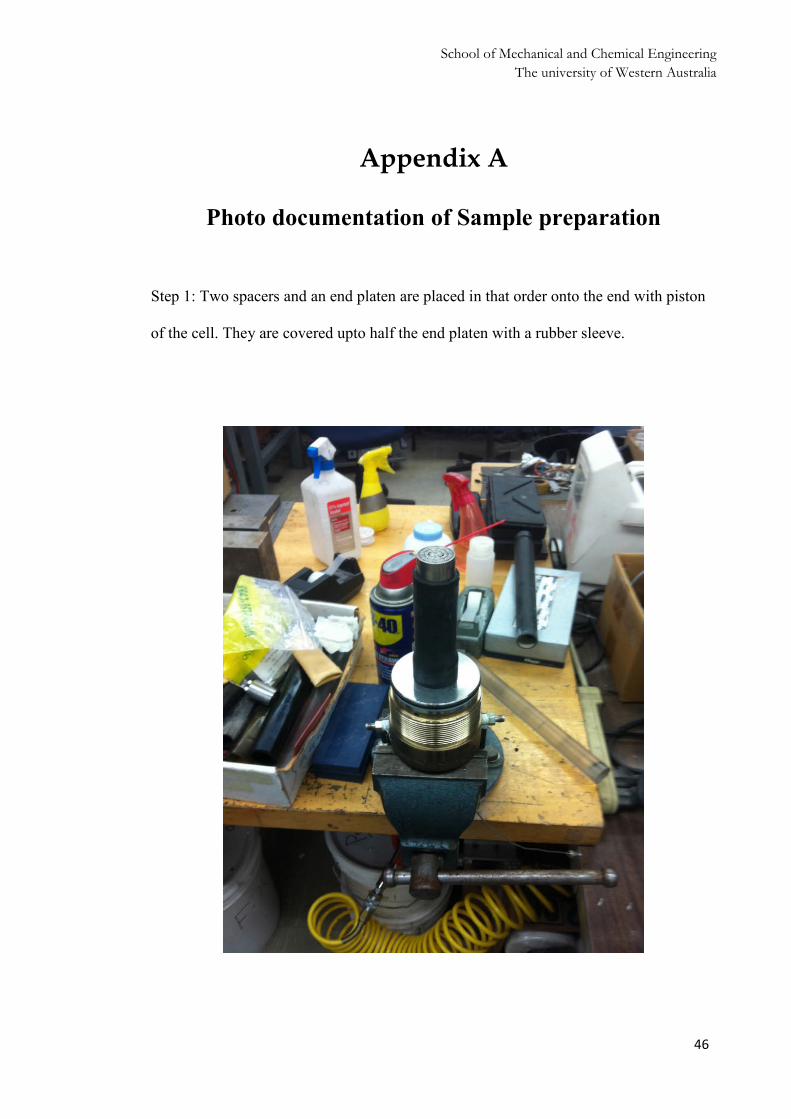
Step 1: Two spacers and an end platen are placed in that order onto the end with piston
of the cell. They are covered upto half the end platen with a rubber sleeve.
46

School of Mechanical and Chemical Engineering The university of Western Australia
Step 2: The sample is covered by foil to prevent the CO2 from leaking and reacting with
rubber.
47
School of Mechanical and Chemical Engineering The university of Western Australia
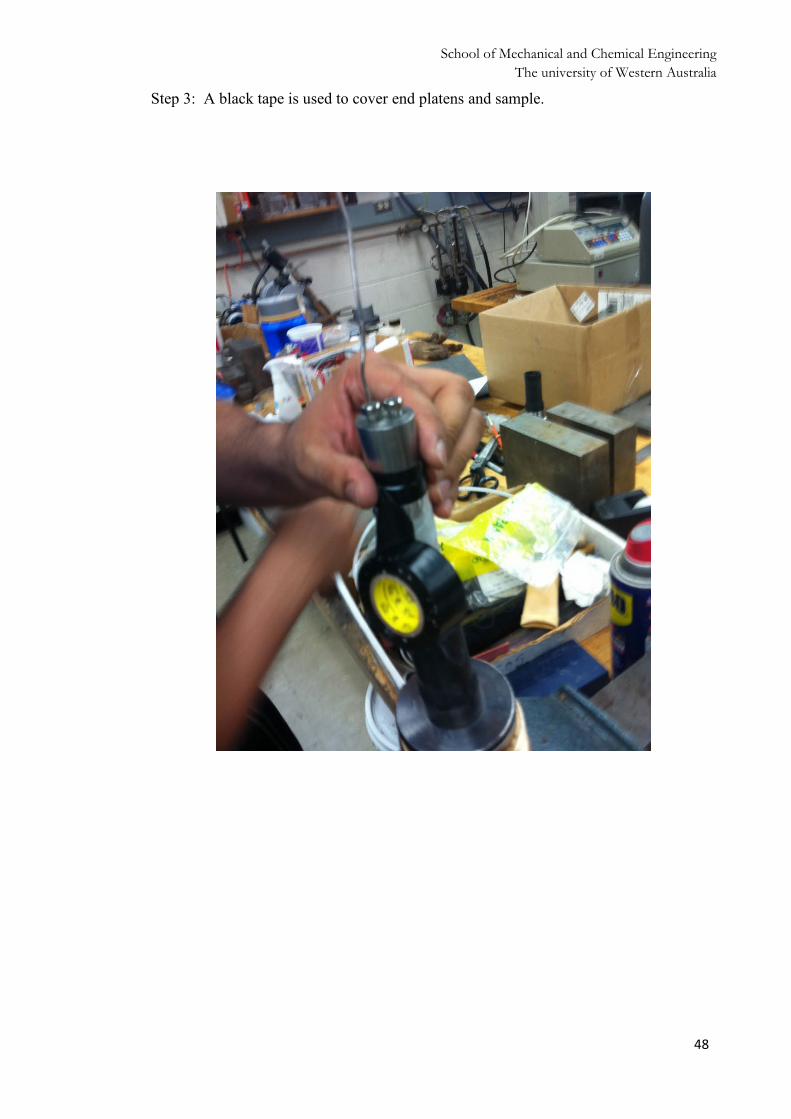
Step 3: A black tape is used to cover end platens and sample.
48

School of Mechanical and Chemical Engineering The university of Western Australia
Step 4: Another heat shrink rubber tube is shrunk around the first one.
49
School of Mechanical and Chemical Engineering The university of Western Australia
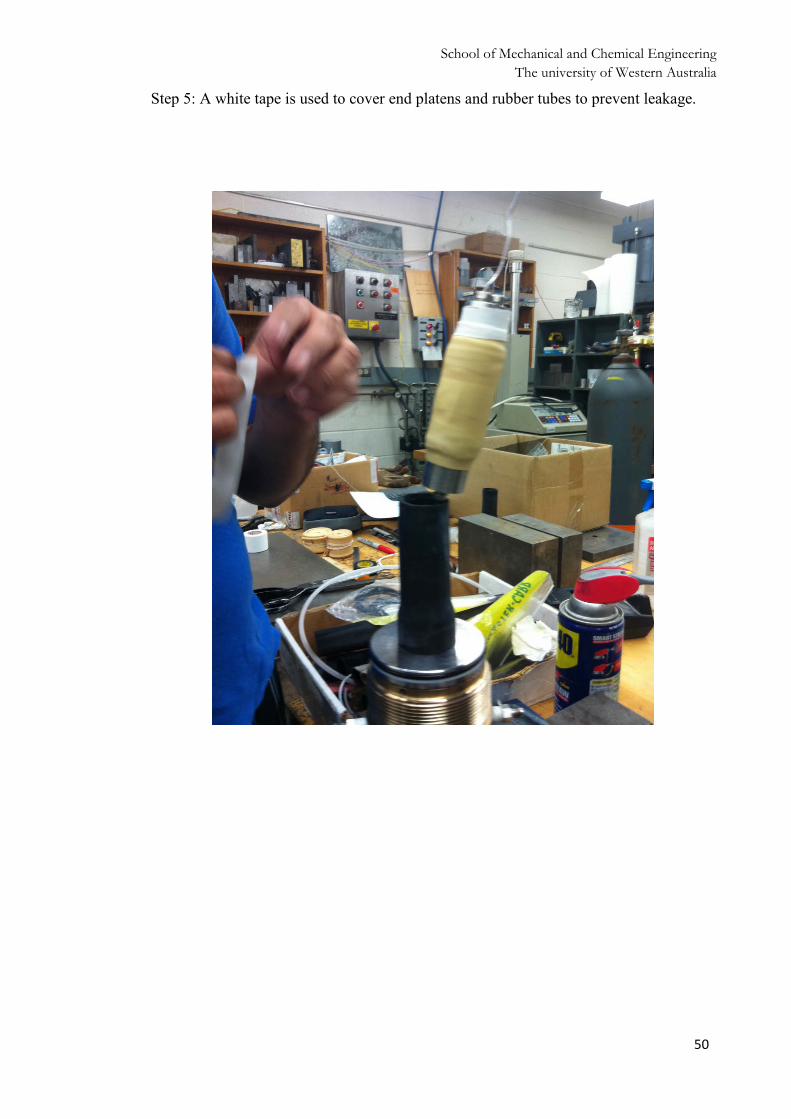
Step 5: A white tape is used to cover end platens and rubber tubes to prevent leakage.
50
School of Mechanical and Chemical Engineering The university of Western Australia
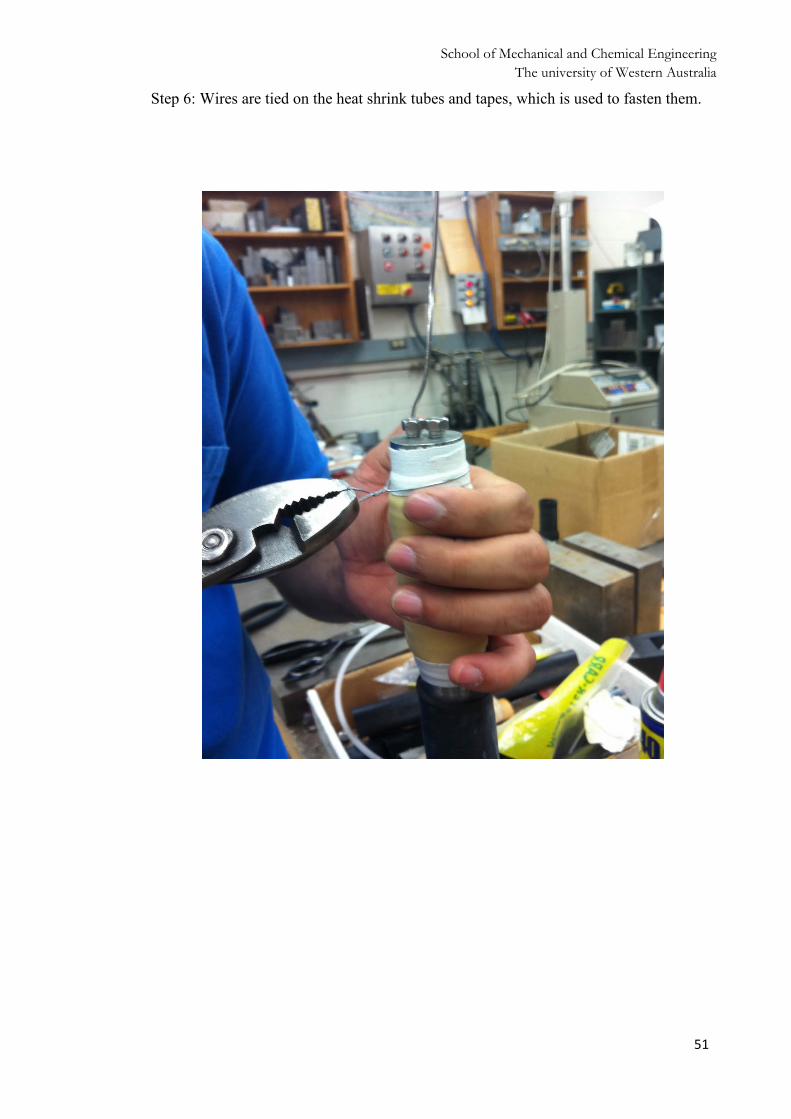
Step 6: Wires are tied on the heat shrink tubes and tapes, which is used to fasten them.
51
School of Mechanical and Chemical Engineering The university of Western Australia
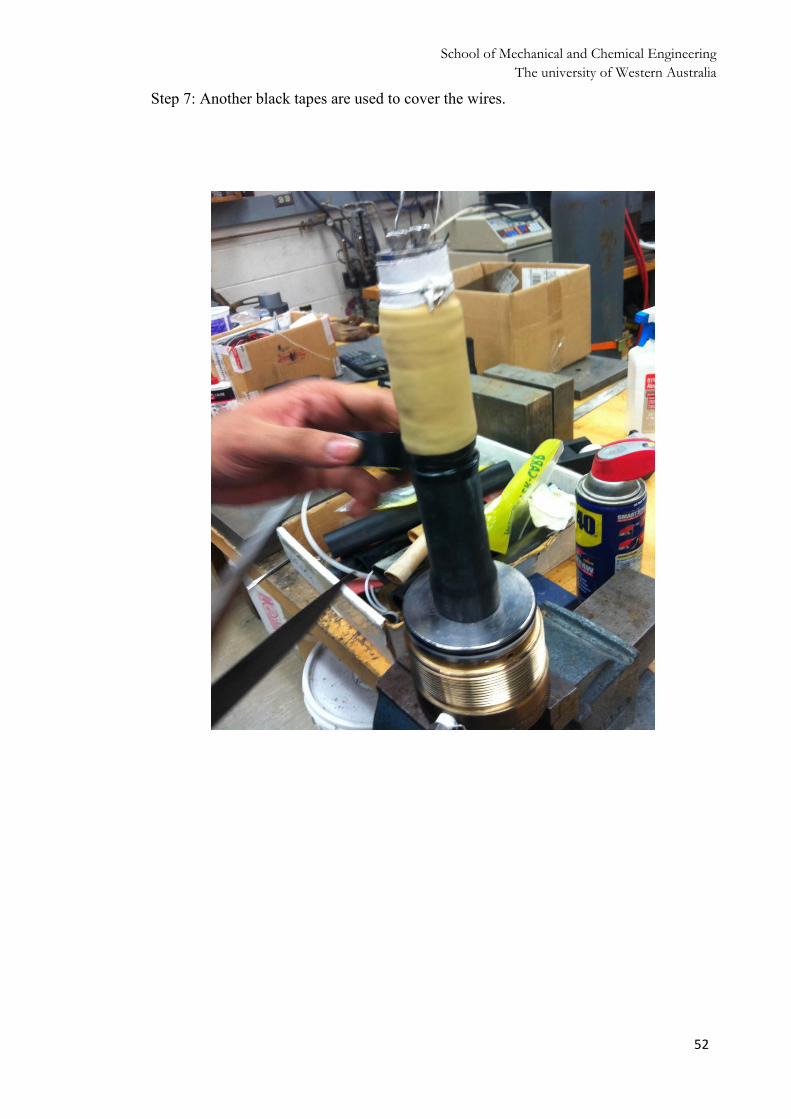
Step 7: Another black tapes are used to cover the wires.
52
School of Mechanical and Chemical Engineering The university of Western Australia
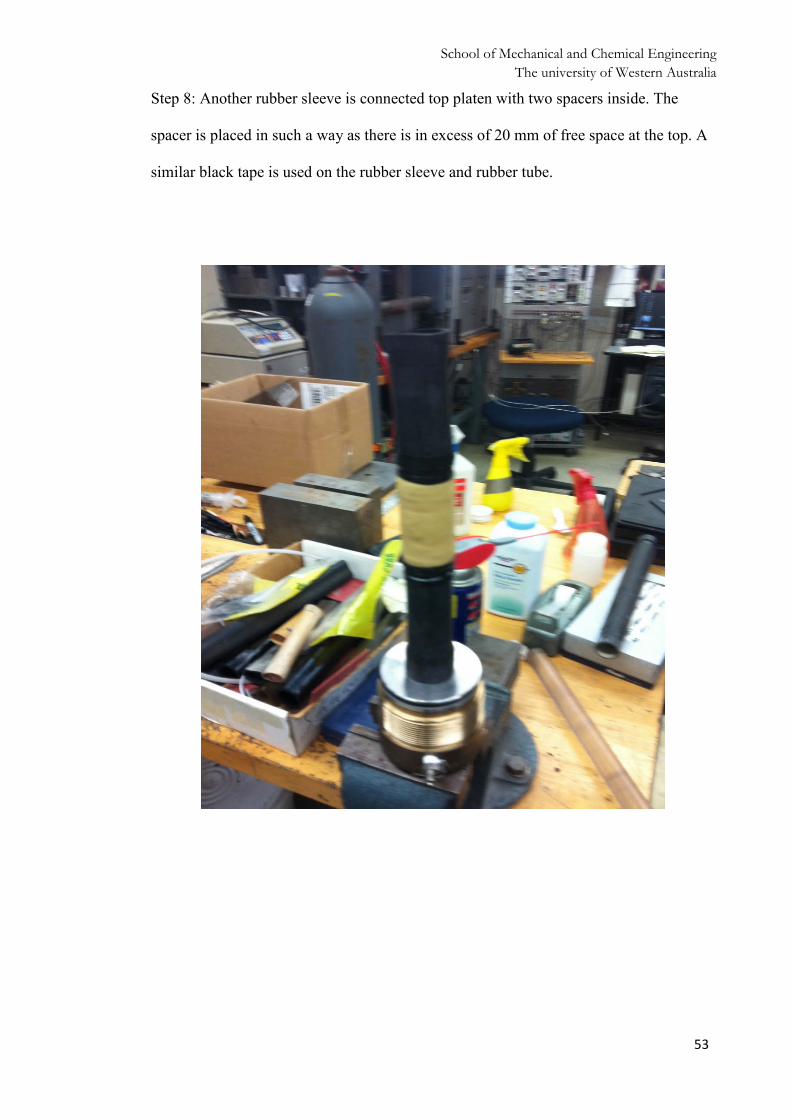
Step 8: Another rubber sleeve is connected top platen with two spacers inside. The
spacer is placed in such a way as there is in excess of 20 mm of free space at the top. A
similar black tape is used on the rubber sleeve and rubber tube.
53

School of Mechanical and Chemical Engineering The university of Western Australia
Step 9: A long heat shrink rubber tube is shrunk around the last one with two black
tapes covered.
54

School of Mechanical and Chemical Engineering The university of Western Australia
Step 10: It is then placed in the cell and closed using the other end cap.
55
School of Mechanical and Chemical Engineering The university of Western Australia
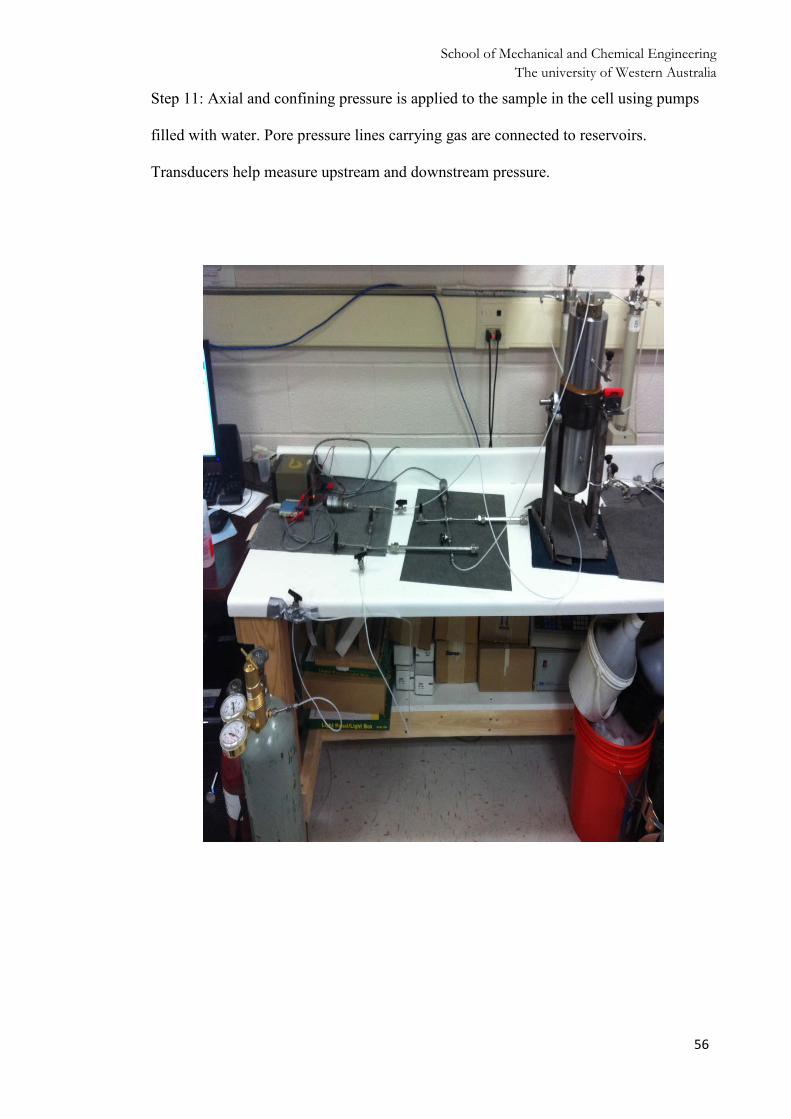
Step 11: Axial and confining pressure is applied to the sample in the cell using pumps
filled with water. Pore pressure lines carrying gas are connected to reservoirs.
Transducers help measure upstream and downstream pressure.
56
School of Mechanical and Chemical Engineering The university of Western Australia
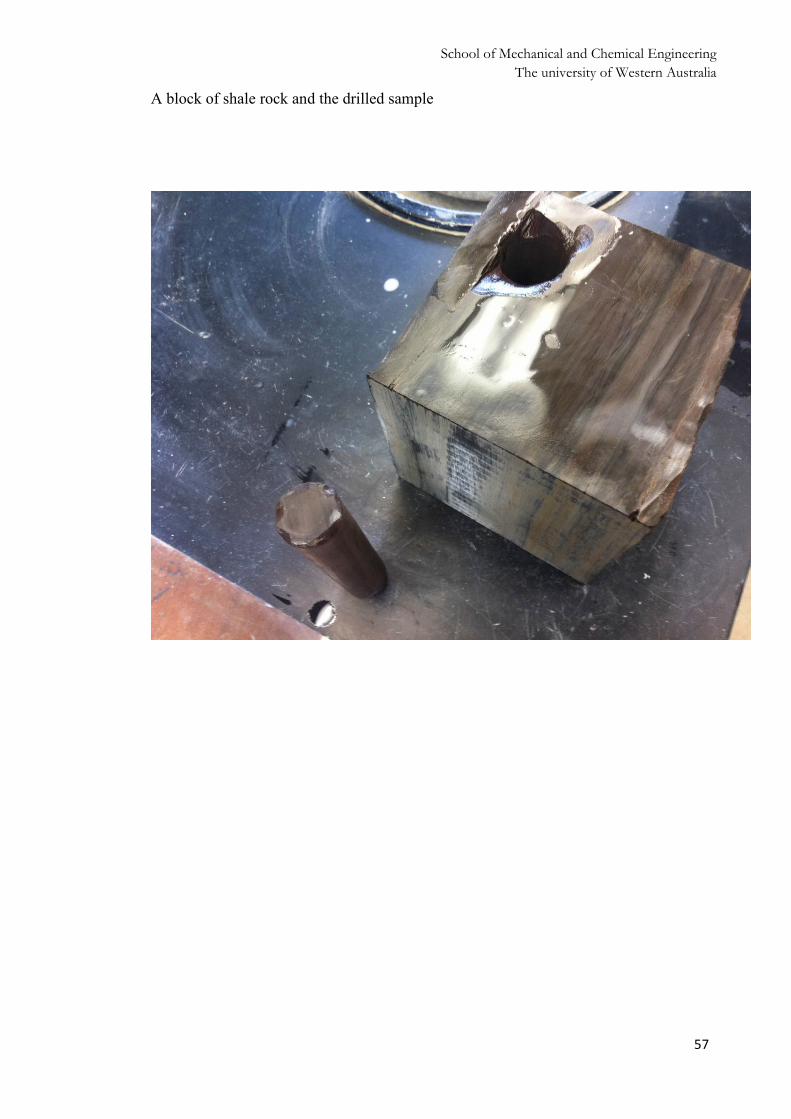
A block of shale rock and the drilled sample
57
School of Mechanical and Chemical Engineering The university of Western Australia
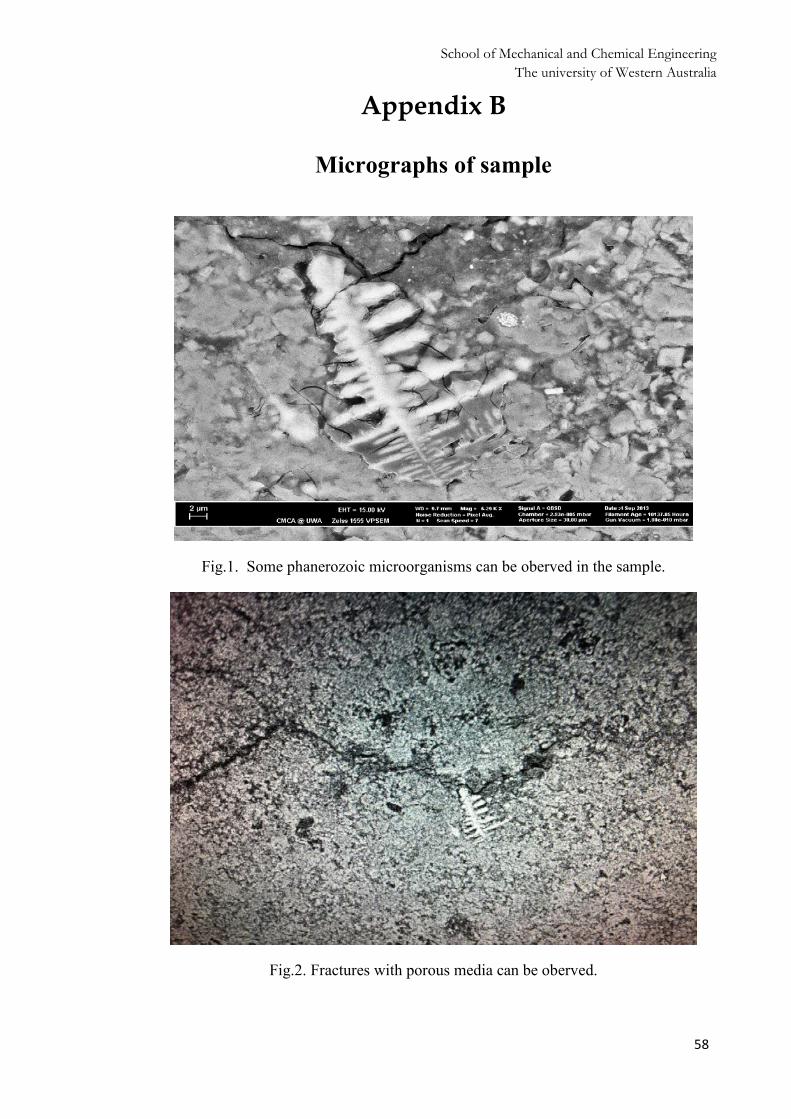
Appendix B
Micrographs of sample
Fig.1. Some phanerozoic microorganisms can be oberved in the sample.
Fig.2. Fractures with porous media can be oberved.
58