Embed Size (px)
Citation preview

NASA Technical Memorandum 106629
AIAA-94-2079
l
/
/¢ ii
t /
Experimental Investigation of Jet-InducedMixing of a Large Liquid Hydrogen
Storage Tank
C. S. Lin
Anatex CorporationBrook Park, Ohio
M. M. Hasan and N. T. Van Dresar
Lewis Research Center
Cleveland, Ohio
Prepared for the6th Joint Thermophysics and Heat Transfer Conference
cosponsored by the American Institute of Aeronautics and Astronauticsand the American Society of Mechanical Engineers
Colorado Springs, Colorado, June 20-23, 1994
(NASA-TM- I06629) EXPERIMENTALINVESTIGATION OF JET-INDUCED MIXING
" OF A LARGE LIQUIO HYDROGEN STORAGE
TANK (NASA. Lewis Research Center)National Aeronautics and l 2 DSpace Administration
N94-33607
Unclas
G3/34 0012113
https://ntrs.nasa.gov/search.jsp?R=19940029101 2018-08-26T12:36:35+00:00Z

EXPERIMENTAL INVESTIGATION OF JET-INDUCED MIXING OF A
LARGE LIQUID HYDROGEN STORAGE TANK
C.S. Lin
Analex Corporation
3001 Aerospace ParkwayBrook Park, Ohio 44142
M.M. Hasan and N.T. Van Dresar
National Aeronautics and Space AdministrationLewis Research Center
Cleveland, Ohio 44135
Abstract
Experiments have been conducted to investigate the
effect of fluid mixing on the depressurization of a large liquid
hydrogen storage tank. The test tank is approximately ellipsoi-
dal, having a volume of 4.89 m 3 and an average wall heat fluxof 4.2 W/m 2 due to external heat input. A mixer unit was
installed near the bottom of the tank to generate an upward
directed axial jet flow normal to the liquid-vapor interface.
Mixing tests were initiated after achieving thermally stratifiedconditions in the tank either by the introduction of hydrogen
gas into the tank or by self-pressurization due to ambient heat
leak through the tank wall. The subcooled liquid jet directed
towards the liquid-vapor interface by the mixer induced vaporcondensation and caused a reduction in tank pressure. Tests
were conducted at two jet submergence depths for jet Reynoldsnumbers from 80 000 to 495 000 and Richardson numbers
from 0.014 to 0.52. Results show that the rate of tank pressure
change is controlled by the competing effects of subcooled jetflow and the free convection boundary layer flow due to
external tank wall heating. It is shown that existing correla-
tions for mixing time and vapor condensation rate based on
small scale tanks may not be applicable to large scale liquid
hydrogen systems.
Nomenclature
A S
Cp
D, D s
liquid-vapor interface area
specific heat of liquid
tank diameter, liquid-vapor interface diameter
jet nozzle diameter
g
Gr*
gravitational acceleration
the modified Grashof number, Gr* = gl3qw HI4/k v2
H l, Hj
hfg
liquid height, jet submergence depth
latent heat of condensation
Ja
k
m c
P, Pi, Pf
Pr
Qbl(X)
Qc(x)
Qbl*
Qj
qw
Ri
Rej
st¢
T b, Tj, Ts
Tdome
(TcTb)
CrcTj)
Jakob number, Ja = Cp (T s - Tb) / hfg
thermal conductivity
average mass condensation rate at the liquid-vaporinterface
tank pressure, initial tank pressure, and final tank
pressure
Prandtl number of bulk liquid, v/ct
volume flow rate of the free convection boundary
layer along the tank wall
jet volume flow at a distance ofx downstream from
the jet nozzle
Qbl(X) evaluated at x = H l
Qc(x) evaluated at x = Hj
jet volume flow rate at the jet nozzle outlet
wall heat flux
Richardson number evaluated at the begining of
each test, gl_(Ts-Tj) i Hj / uj2
jet Reynolds number, uj d/v
average condensation Stanton number, Stc= m c
hfg/[A s p Cp v s (Ts-Tb)]
bulk liquid temperature, jet temperature, and
interace temperature
dome temperature
liquid subcooling
jet subeooling

tm, tin* mixing time, dimensionless mixing time
uj jet velocity
V l liquid volume
V Saverage r.m.s turbulent velocity (or turbulence
intensity) at the liquid-vapor interface
height (vertical distance) measured from the tankbottom or downstream distance from
the jet nozzle
Greek Symbols
thermal diffusivity of liquid
thermal expansion coefficient of liquid
kinematic viscosity of liquid
P liquid density
surface tension
Introduction
Pressure control of a cryogenic storage tank in low
gravity is one of the key advanced technologies being devel-
oped in the cryogenic fluid management program at NASA. In
pressure control technology, fluid mixing such as axial jet-induced mixing is considered an efficient method to reduce the
pressure of a cryogenic tank. In normal gravity, when a
partially filled cryogenic tank is subjected to external heating
and the fluid is thermally stratified, the tank pressure increases
with a rate usually higher than its homogeneous pressure rise
rate 1. Due to the temperature stratification the bulk liquid is
generally subcooled. By using a mixer located near the bottom
of the tank, the tank liquid is circulated and the subeooled axial
jet can be directed towards the liquid-vapor interface. The
subcooled jet spreads from the jet nozzle outlet, but remains
confined to the axial region. The jet impinges on the liquid-
vapor interface, which is kept horizontal by gravity, turns
radially outward, and eventually deflects down into the bulk
liquid near the tank wall and mixes with the bulk liquid. This
mixing of the tank liquid by the jet destroys the liquid tempera-ture stratification and induces vapor condensation at the
interface, resulting in the reduction of tank pressure. The
required mixing time and vapor condensation rate at the
interface are the two key elements in the mixing process to
reduce tank pressure. The high jet flow rate fluid mixing and
the associated vapor condensation results, which are not
influenced by the buoyancy effects, may be applicable for the
design of space-based systems.
Use of the jet-induced mixing process to control the
thermodynamic state of propellents in storage tanks has been
extensively investigated. Several mixing time correlations 2-6
have been proposed based on the concentration equilibrium,
thermal equilibrium, or pressure equilibrium. Most correla-tions were obtained for small scale cylindrical tanks with
negligible buoyancy effects. In large systems, the buoyancy
due to thermal stratification generally impedes the motion of
the colder and denser jet flow and possibly prevents the jet
flow from reaching the liquid surface. The mixing timecorrelation recently developed by Lin et al.6 for a liquid
hydrogen tank included the effect of buoyancy due to thethermal stratification. The Richardson number (Ri) was used
to characterize the buoyancy effect. The study of Lin et al. 6
showed that the mixing time required to destroy the thermal
stratification increases significantly with the increase in Ri
when Ri > 0.5. However, the buoyancy effect can be neglected
ifRi <_0.5. The Richardson number was defined based on the
jet submergence depth (Hi) and the temperature difference
between the interface and the jet (Ts-T j) at the begining ofmixing process.
Several experiments 7"11 have been conducted to study
the steady state vapor condensation rate at the liquid-vaporinterface in a tank with jet-induced mixing. For high jet
submergence, Hj/D s > 3, Sonin et al.10 developed a vaporcondensation rate correlation for a steam-water system with
negligible buoyancy effect. Brown et al.t I extended this work
to include the effect of the low jet submergence, 0.5 < H:/D s < 3.The condensation correlation developed in Refs. I(_ and 11
was expressed in terms of liquid subcooling (Ts-Tb). Thecorrelation was modified by Lin et al.6 and was expressed as
a function of jet subeooling (Ts-Tj). The modified steady statecondensation rate correlation was then used to predict the
transient condensation rate in the fluid mixing of a hydrogen
tank using the instantaneous value of jet subcooling. The
limited liquid hydrogen data of Ref. 6 is fairly described bythis modified condensation rate correlation.
The experimental work reported in Ref. 6 was performed
with a small (0.14 m 3) cylindrical tank with relatively low wall
heat fluxes (3 to 30 W/m2). Therefore, the effect of free
convection boundary layer (along the tank wall) on the jet-
induced mixing process was negligible. However, for a typical
cryogenic storage system, the tank size may be large enoughsuch that the flow rate of the warm fluid in the free convection
boundary layer may be significant. This warm flow moves
along the tank wall towards the interface and turns inward to
oppose the subcooled jet. Consequently, evaporation may
occur at the outer part of the interface (due to free convection
flow) with condensation occurring at the inner part of the
interface (due to jet flow). Therefore, the average vaporcondensation rate at the interface will be reduced and the
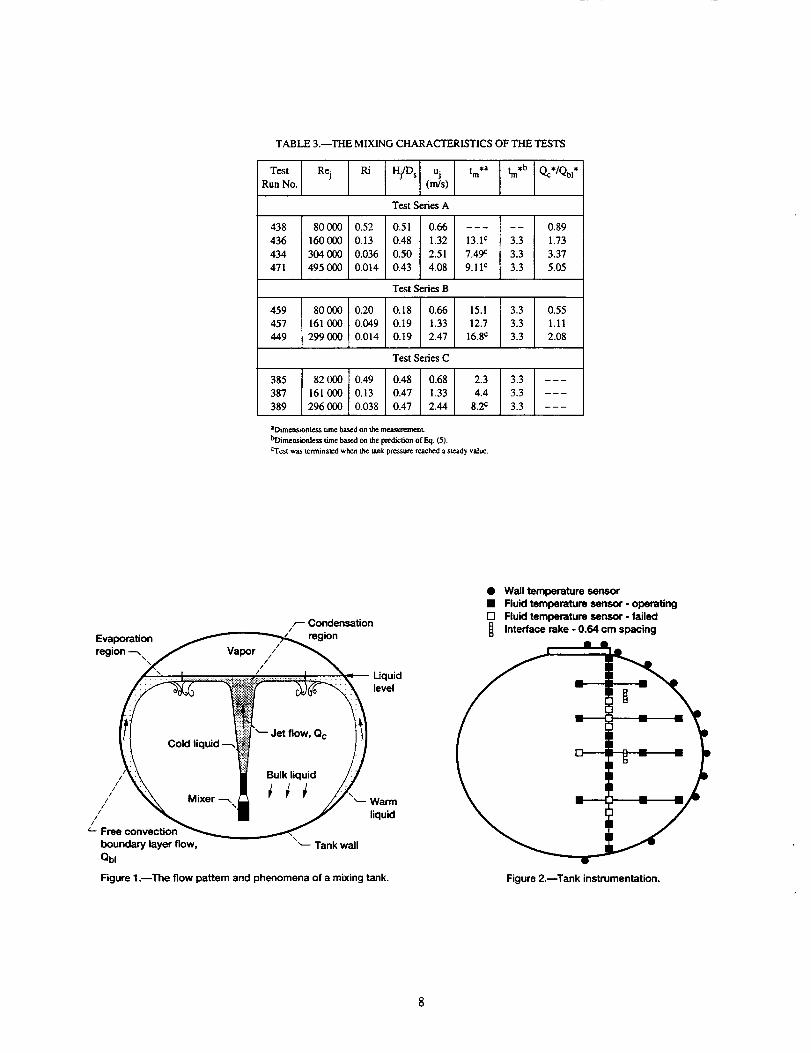
mixing time will be increased. The idealized flow pattern and
phenomena are shown in Fig. 1.
This paper presents the experimental results in a large
storage tank where the liquid hydrogen is mixed by an axial
turbulent jet directed normally towards the liquid-vapor
2

interface.Theeffectof jetvolumeflowrateandliquidfilllevelonthemixingtimeandtheaveragevaporcondensationrateat theinterfaceis investigated.Theinfluenceof freeconvectionflowduetowallheatleakonthemixingprocessandtheresultingtankpressurechangeisalsoexamined.Theresultsarecomparedwiththoseobtainedforasmallscaletank.6
The Experiment
The tests were conducted at the NASA Lewis Research
Center's K-Site Facility located at Plum Brook Station in
Sandusky, Ohio. The test facility had a 7.6 m diameter
spherical vacuum chamber enclosing a 4.0 m diameter cylin-
drical shroud which in turn enclosed the LH 2test tank. The test
tank was suspended by fiberglass composite struts. The shroudwas maintained at a constant temperature of 350 K by electri-
cal resistance heating to obtain a constant heat input to the test
tank. The pressure in the vacuum chamber during the testseries was on the order of 10 -4 to 10 -3 Pa.
The LH 2 test tank was insulated with 2 blankets of multi-layer insulation, each blanket consisted of 17 layers of double
aluminumized Mylar separated by silk netting. The tank was
constructed of 2219 aluminum and was approximately an
eUipsoidal volume of revolution. The major-to-minor axis
ratio was 1.2 with the major diameter of 2.2 m. The test tankhad a volume of 4.89 m 3, an internal surface area of 14 m 2,and
a mass of 149 kg. Most of the wall was 2.08 mm thick except
for the thick bolted flange and lid at the top, thickened lands
for support lugs, and a thickened equatorial region.
The experimental setup was basically the same as had
been used for the self-pressurization tests in Refs. 1 and 12.
However, two systems were added in the present study: a
pressurization system and a mixing system• The pressuriza-
tion system was designed such that the pressurant (GH 2) was
supplied from high pressure storage bottles at ambient tem-
perature. A diffuser was installed near the top of the test article
and the gas pressurant was fed into the vapor region directly•
The pressurant flow rate was calculated from pressure dropmeasurements across a square edged orifice placed in the
pressurant line. The orifice was instrumented with high and
low range differential pressure transducers as well as an
upstream pressure transducer and temperature sensor• A mixer
unit was installed inside the test tank to generate axial jet-
induced mixing. The mixer unit was the one designed for the
Shuttle Centaur hydrogen tank and was the same one used in
Ref. 6. Figure 1 shows a schematic that depicts the mixer as
installed in the elliptical test tank. The jet nozzle outlet had aninner diameter of 0.0221 m and was located in the center about
0.51 m from the tank bottom•
A capacitance probe was installed to measure the liquid
fill level with an accuracy of +0.019 m. Instrumentation rakeswere used for the mounting of silicon diodes temperature
sensors for temperature measurement. Locations of various
temperature sensors in the test tank are shown in Fig. 2. The
fluid temperatures and external tank wall temperature meas-
urements had an accuracy of _+0.1 and _+0.6 K, respectively.
Tank pressure was measured by pressure transducers in direct
communication with the tank ullage with an accuracy of
_+0.7 Pa. The pressurant flow rate measurement had an esti-
mated accuracy of_-z-0.18 and _+0.40 kg/hr for the low and high
range differential pressure transducers, respectively. The mixer
flow rate was measured by a turbine flowmeter with an
estimated accuracy of_+0.02 m3/hr.
The heat leak through the tank wall was determined from
a boil-off test. The procedure was the same as that of Refs. 1
and 12. With the shroud temperature maintained at 350 K the
boil-off rate was about 5.6 SCMH (standard cubic meter per
hour) which yielded an average wall heat flux of 4.2 W/m 2.
In each test, the tank liquid was initially saturated at about
117 kPa. The tank was then pressurized either by using the
pressurization system to introduce GH 2 into the tank or byself-pressurization due to the ambient heat leak through the
tank wall. If the tank was self-pressurized, the bulk liquid
would be subcooled and thermally stratified. If the tank was
pressurized by the introduction of GH 2, thermal stratificationwould be limited to a very thin thermal layer underneath the
liquid surface. The mixer was turned on when the tank
pressure reached a specified level• The test was terminated
when the tank pressure reached a steady value or if the planned
testing time was reached.
Results and Discussion
Three series of experiments consisting of ten tests wereconducted. The tests were conducted at about 85 and 50 per-
cent liquid fill levels (in volume) with the jet flow rate rangingfrom 0.91 to 5.63 m3/hr. The initial condition of each mixing
test was established by raising the tank pressure by self-
pressurization or by the addition of gaseous hydrogen such
that the bulk liquid was subcooled. Table I shows the experi-mental conditions for all the tests•
Within each test series, the initial conditions such as
liquid fill and liquid subcooling were very similar and the only
controlling variable was the jet volume flow rate. Therefore,within each test series, the effect of free convection flow
(along the tank wall) on the mixing of tank fluid induced by
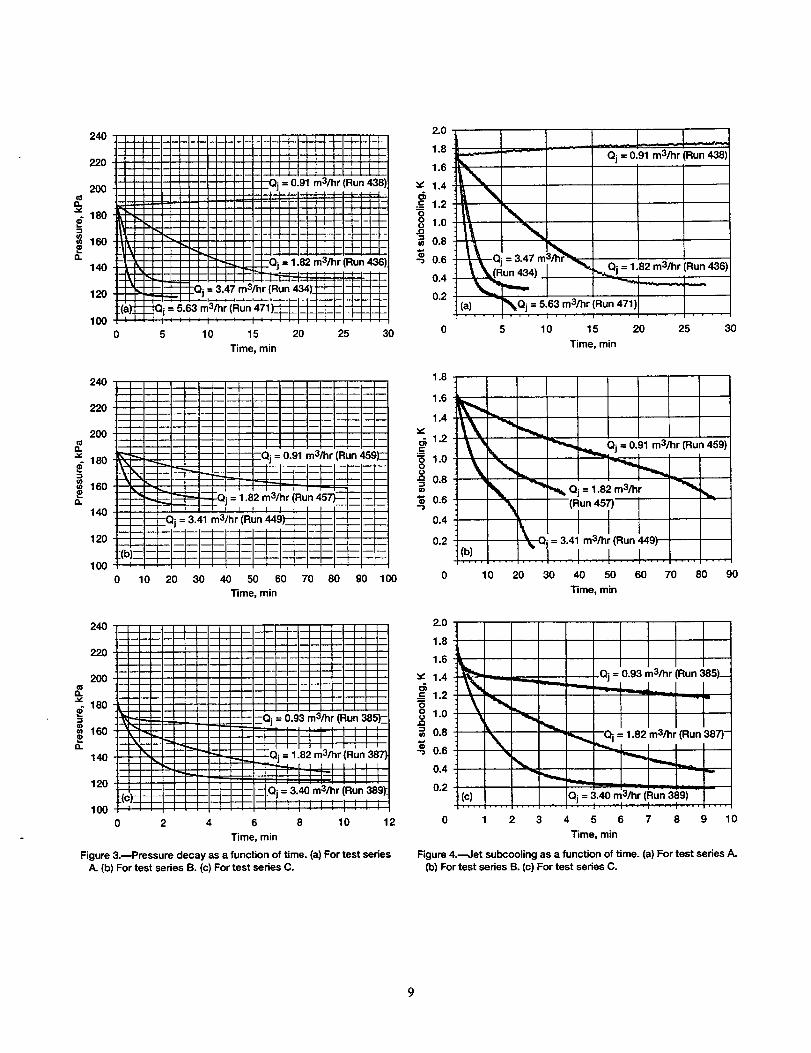
various jet flow rates can be investigated. Figures 3(a) to (c)
show the tank pressure decay as a function of time for various
jet volume flow rates for all the test series• The pressure decayrate is faster for a higher jet flow rate as a result of the enhanced
vapor condensation at the liquid-vapor interface• However, intest run 438, which has the lowest jet flow rate, the tank
pressure increases with time during the mixing. This indicates
that the net mass transfer at the liquid-vapor interface is
evaporation due to the free convection flow along the tank
wall. Also, the jet momentum may not be sufficient to over-
come the opposing effect of buoyancy due to the thermalstratification.

AsolutionforaturbulentfreeconvectionboundarylayerwithconstantwallheatfluxanduniformbulktemperaturehasbeenobtainedbyVlietetal.13usingthevelocityandtempera-tureprofilesemployedby EckertandJackson14in theiranalysesof turbulentfreeconvectiononaverticalplateatconstantwall temperature.UsingVlietetal.'sresults,thevolumeflowrateintheboundarylayerforacylindricaltankcanbewrittenas
Qbl(X)=0.292_Dv1/7(g_qw/pCp)2/7x 8/7 (1)
whereDisthetankdiameterandx is thedistancemeasuredfromthetankbottom.It isobviousthatQblincreasessignifi-cantlywiththetanksize.Equation(1)isusedtoestimateQblforthenearlyellipsoidaltankof thepresentstudy.WiththemodifiedGrashofnumberdefinedasGr*=g[3qwHI4/kv2,thevolumeflowrateintheboundarylayerattheinterfacelocationisestimatedtobe
Qbl* = 0.2927r Ds v(Gr*/Pr) 2/7 (2)
where D s is the diameter of the liquid-vapor interface. Equa-tion (2) is expected to over-predict the the volume flow rate
in the natural convection boundary layer for an ellipsoidaltank. This is because of the effects of the tank wall curvature
and the heat leak through the tank bottom. Due to buoyancy,
the heating of the tank bottom generally creates a mixing
region near the tank bottom and delays the formation (shifted
upwards) of the thermal boundary layer at the sidewall due tosidewall heating. 15
The analysis for a turbulent free circular jet is used to
estimate the jet volume flow rate at the liquid-vapor interfacelocation. According to Schlichting 16, the volume flow rate
(Qc), which increases with distance from the orifice due to theentrainment of the flow from the surroundings, can be calcu-
lated by
X
Qc(x) = 0.456 Qj_- (3)
where Qj is the jet volume flow rate at the jet nozzle outlet, xis the distance from the nozzle outlet, and d is the diameter of
nozzle. The total jet volume flow rate at the liquid-vaporinterface location is estimated to be
Qc * = 0.456 Qj _ (4)
The values of Qbl* and Qc* are listed in Table II. Fluidproperties at 110 kPa saturated condition were used to calcu-
late Qbl*"
The jet induced flow Qc* brings colder fluid to the central
part and the boundary flow Qbl* brings warmer fluid to the
outer part of the surface. The net mass transfer at the interface
results from condensation in the central part and evaporation
in the outer part of the interface due to the flow rates Q¢* and
Qbi*, respectively. Also, buoyancy due to thermal stratifica-tion may impede the upward motion of the colder and denser
jet flow and may significantly reduce the condensation rate at
the liquid-vapor interface. The findings of Refs. 6, 10, and 11
suggest that buoyancy effects may be quantified in terms ofthe Richardson number, Ri. Based on the definition of Ri used
in Ref. 6, the buoyancy effects due to thermal stratification of
the bulk liquid are insignificant if Ri < 0.5. Comparison of
Qbl* and Qc* in Table II and the pressure change rate duringthe mixing as shown in Figs. 3(a) to (c) shows that the effect
of free convection flow along the tank wall on the jet mixing
process decreases as the jet volume flow rate (Qj) and thus Qc*
increases. In the test run 438, the jet flow rate Qj is low such
that Qc* and Qbl* are comparable. The pressure increases withtime during the mixing as shown in Fig. 3(a) which suggeststhat the net mass transfer at the liquid-vapor interface is
evaporation. The condensation rate in the test run 438 may
also have been significantly reduced due to relatively high
value of Richardson number (Ri = 0.52, in Table 111).In the test
run 459, the tank pressure during mixing decreases even
though Qbl* is greater than Qc*- This is, in part, due to the factthat the Richardson number for this test is low (Ri = 0.2, in
Table HI). If the jet flow rate is high enough such that Qc* is
much greater than Qbl*, then there may be condensationoccuring over most of the interface. As shown in Table II, the
test run 471 represents this case.
As shown in Table I, test run 385 has the same jet volume
flow rate as test run 438. However, unlike test run 438, the tank
pressure in test run 385 decreases (Fig. 3(c)) during the mixing
process. This is because, for tank pressurization using gaseoushydrogen, the pressurization time required to reach the target
tank pressure is too short for the free convection flow to befully developed and also the liquid temperature is less strati-
fied. Therefore, the effect of wall heat leak in the mixing
process is greater in test series A than in test series C.
The ratio of the liquid-vapor interface diameter to the jet
nozzle diameter, Ds/d, ranged from 85 tol00 in all the tests.Thus, as the jet moved upward and reached the liquid surface,
it had to travel a long distance in the radial direction before
moving back towards the tank bottom. This made it difficult
for the axial jet to induce complete mixing of the tank fluid.
Therefore, unlike the experiments ofRef. 6 in which Ds/d wasabout 25, the thermal equilibrium state was not reached in
these tests. Each test was terminated when the tank pressure
reached a steady value or if the planned testing time was
reached. Table III shows the mixing characteristics for all the
tests. There are only five test runs (out often) in which the tank
pressure reached a steady value when the test was terminated.
In Ref. 6, the mixing time was defined as the time required forthe tank to reach the equilibrium pressure. Thus, the mixing
time measured for these five test runs can be used to compare
4

thepredictionsofmixingtimecorrelationdeveloped in Ref. 6
for a small scale cylindrical tank:
trnUjd { 3.3tm * = -- =Ds 2 2.6 + 2.1 Ri
Ri < 0.5
Ri > 0.5(5)
From Table 11I, it is seen that the mixing time for test runs
in which the tank pressure reached a steady value is under-
predicted by Eq. (5). This may be due to the combined effectsof natural convection flow, tank size, and tank geometry. The
effect of natural convection flow can be investigated from the
present data. Since in each test series, the modified Grashof
number (Gr*) is nearly constant, the effect of natural convec-tion flow on the central jet flow will decrease as the jet
Reynolds numbers (jet volume flow rates) increases. There-fore, as shown in Table 111, the comparison improves as the jet
Reynolds number (Rej) and then the ratio Qc*/QbI* increase.Also, the comparison seems to be slightly better for testseries C because the natural convection flow is not fully
developed in these tests.
Vapor condensation at the interface is the key mechanism
to reduce the tank pressure. Sonin et al.l° obtained an empiri-
cal correlation for the rate at which a pure saturated vapor
condenses on the free surface of a turbulent liquid in a steam-
water system, under conditions where buoyancy effects are
insignificant. The vapor was saturated and the vapor conden-
sation was controlled by the interface turbulence at the liquid
side. Their vapor condensation rate correlation is expressed as
St c = 0.0198 Pr "°'33 (1 - 0.5 Ja) (6)
where St c, defined as Stc= m e hfg/[A s p Cp vs (Ts-Tb)], is theaverage condensation Stanton number, Ja is the Jakob num-
ber, and m e is the average vapor mass condensation rate at theinterface. Equation (6) is strictly valid for Ja << 1. The liquid
subcooling (Ts-Tb) and average turbulence intensity at the
interface (v s) are the controlling parameters for the vaporcondensation rate.
The average turbulent r.m.s, velocity at the interface, v s,
for low jet submergence can be determined by
_ujd[ -3.06131) D_ 1Vs - -_s [10.04 [32 - (7.14 [32
for 0.5 < Hj / D s < 3 (7)
where [_1---0.34 and [32= 0.24 from Ref. 17 and 151= 0.33 and
I_2= 0.23 from Ref. 18. For Ja << 1, the steady state correlationof Eq. (6) has been modified by Lin et al. 6 for the applicationof transient cases:
mchfg
Stc = AsPCpVs(T s - Tj)
× [1 + (D s / d) 2 (0.0198 Pr -0"33) (v s / uj )]
= 0.0198 Pr -0"33 (1 - 0.5 Ja) (8)
where the liquid subcooling (T s -Ti0) has been replaced by jet
subcooling (Ts-T j) which is usually measured during the test.The jet subcooling as a function of time is shown in Figs. 4(a)
to (c). According to the range of jet subcooling shown in
Figs. 4(a) to (c), the Jakob number is less than 0.05 for all the
tests.
Equation (8) is used to predict the change of vapor massfor the tests in test series A. The reason to use test series A for
comparison is that H)/D s is about 0.5 and the vapor superheatfor these tests is relatively mild. The vapor is superheated with
the temperature difference (Tdome-Ts) ranging from 40 to100 K for test series A. These conditions are relatively close
to the applicable range of the correlation. The vapor mass isobtained from a curve-fitted one-dimensional temperature
distribution. This one-dimensional calculation is a good
approximation because the data indicates that the radial varia-
tion of the vapor temperature is small.
Figures 5(a) to (c) show the estimated vapor mass as afunction of time. The vapor mass predicted by using Eq. (8) is
also included in the figures for comparison. According to the
previous discussion, Eq. (8) should over-predict the average
condensation rate at the liquid-vapor interface because of theeffect of natural convection flow. Figure 5(a) indeed shows
this fact. As the jet volume flow rate increases, the comparison
gets better. Surprisingly, Figs. 5(b) and (c) show that Eq. (8)
under-predicts the average condensation rate. This can be
explained by the fact that, in Figs. 5(b) (for test run 434) and(c) (for test run 471), the jet volume flow rate is sufficiently
high that surface breakup occurs. The agitation of the liquid-
vapor interface induces significant condensation and Eq. (8),which was developed based on the assumption of a flat
interface, does not apply. In Ref. 7, an equation was providedto estimate the condition for the onset of surface breakup:
Rej > 0.46 (Ap g 0) 1/4 Hj / (p 1/2 v) (9)
where Ap is the density difference between the liquid and the
vapor and _3 is the surface tension of the liquid. Equation (9)
gives the prediction of minimum jet Reynolds number (Rej)for the jet to penetrate the liquid-vapor interface. Using thiscriteria, the jet Reynolds number for the onset of the surface
breakup for the tests at 85 percent fill level is about 230 000.
Comparing with the jet Renolds numbers listed in Table Ill,
thejetReynoldsnumbersforbothtestruns434and471aregreaterthan230000.ThiscomparisonsupportsourargumentassociatedwithFigs.5(b)and(c).
Conclusion
Experiments have been conducted to investigate the
effect of fluid mixing on the depressurization of a large scale
liquid hydrogen storage tank. Under the experimental condi-
tions in the present study, the following conclusions can bedrawn:
1. For a large cryogenic fluid storage tank subjected tovery low wall heat flux of 4.2 W/m 2, the effect of natural
convection flow on the jet induced mixing process may not be
neglected. The boundary layer flow of warm fluid (along the
tank wall) due to natural convection decreases the average
condensation rate at the liquid-vapor interface and increases
the mixing time.
2. The dimensionless mixing time for the tests under
comparable conditions (Table m) is under-predicted by the
correlation (Eq. (5)) developed based on small scale tankresults.
3. The thermal equilibrium state is very difficult to
achieve for fluid in a large scale mixing tank, i.e., in a tank with
large ratio of liquid surface diameter to jet nozzle diameter.
References
1. Hasan, M.M, Lin, C.S., and Van Dresar, N.T., "Self-
Pressurization of a Flightweight Liquid Hydrogen Stor-
age Tank Subjected to Low Heat Flux," Cryogenic Heat
Transfer-1991, A. Adorjan and A. Bejan, eds., ASMEHTD-Vol. 167.
2. Fossett, H. and Prosser, L.E., "The Application of Free Jets
to the Mixing of Fluids in Bulk," Proceedings of the
Institute of Mechanical En_neers, Vol. 160, No. 2,
pp. 224-232, 1949.
3. Okita, N. and Oyama, Y., "Mixing Characteristics in Jet
Mixing," Oaem. l_ng. Japan,\Vol. 27, No. 4, pp. 252-259,1963.
4. Wollen, M.A., Evaluation of Jet Induced Mixing for
Centaur LH 2Tank,".NASA TM--696083-333, August,1983.
5. Poth, L.J. and Van Hook, J.R., "Control of Thermody-
namic State of Space-Stored Cryogens by Jet Mixing,"
J. Spacecraft, Vol. 9, No. 5, pp. 332-336, 1972.
6. Lin, C.S., Hasan, M.M, and Nyland, T.W., "Mixing and
Transient Interface Condensation of a Liquid Hydrogen
Tank," AIAA Paper 93-1968, 1993.7. Thomas, R.M., "Condensation of Steam on Water in
Turbulent Motion," Int. J. Multiphase Flow, Vol. 5,
No. 1, pp. 1-15, 1979.
8. Dominick, S.M., "Mixing Induced Condensation Inside
Propellant Tanks," AIAA Paper 84-0514, 1984.9. Meserole, J.S., Jones, O.S., Brennan, S.M., and Fortini, A.,
Mixing-Induced Ullage Condensation and Fluid
Destratification," AIAA Paper 87-2018, 1987.10. Sonin, A.A., Shimko, M.A., and Chun, J.H., "Vapor
Condensation onto a Turbulent Liquid-I. The Steady
State Condensation Rate as a Function of Liquid-SideTurbulence," Int. J. Heat Mass Trans., Vol. 29, No. 9,
pp. 1319-1332, 1986.
11. Brown, J.S., Helmick, M.R., and Sonin, A.A., "Vapor
Condensation at a Turbulent Liquid Surface in Systems
with Possible Space-Based Application," AIAA Paper89-2846, 1989.
12. Van Dresar, N.T., Lin, C.S., and Hasan, M.M., "Self-
Pressurization of a Flightweight Liquid Hydrogen Tank:
Effects of Fill Level at Low Heat Flux," AIAA Paper92-0818,1992.
13. Vliet, G.C., Brogan, J.J., Sheppard, T.S., Morse, F.H., and
Hines, F.L., "Stratified Layer Flow Model: A Numerical
Approach to Liquid Temperature Stratification," J. Space-
craft, Vol. 1, No. 6, pp. 666-672, 1964.
14. Eckert, E.R.G. and Jackson, J.W., "Analysos of Turbulent
Free-Convection Boundary Layer on Flat Flate," NACA
Rept. 1015, pp. 255-261, 1951
15. Tatom, J.W., Brown, W.H., Knight, L.H., and Coxe, E.F.,
"Analysis of Thermal Stratification of Liquid Hydrogen
in Rocket Propellant Tanks," Advances in Cryogenic
Engineering, Vol. 9, pp. 265-272, 1963.
16. Schlichting, H., "Boundary Layer Theory", McGraw Hill,
pp. 749, 1979.
17. Brown, J.S., Khoo, B.C., and Sonin, A.A., "Rate Correla-
tion for Condensation of Pure Vapor on Turbulent,
Subcooled Liquid," Int. J. Heat Mass Trans., Vol. 33,
No. 9, 1990.
18. Lin, C.S. and Hasan, M.M., "Effect of Liquid Surface
Turbulent Motion on the Vapor Condensation in a
Mixing Tank," Proceedings of the 4th International
Symposium on Transport Phenomena in Heat and Mass
Transfer, Sudney, Australia, 14-19 July, 1991, Trans-
port Phenomena in Heat and Mass Transfer, edited by
J.A. Reizes, pp. 1526-1537, 1992

TABLE I.--EXPERIMENTAL CONDITIONS FOR MIXING TESTS
Ds Pi Pr (T(SK)J)iTeStrun PressurizatiOnsource Initial Liquid Fill (m3Q/_r) (m) (kPa) (kPa)
no. % Vl(m3)
438 S
436 S
434 S
471 S
459 S 48.3
457 S 49.1
449 S 49.1
385 G 85.3
387 G 84.3
389 G 84.9
Test Series A
86.9 4.25 0.91 1.87 187.0 193.5 1.7
85.3 4.17 1.82 1.9t 187.0 131.6 1.7
86.3 4.22 3.47 1.88 186.1 128.4 1.7
81.6 3.99 5.63 1.99 186.3 117.8 1.9
Test Series B
2.36 0.91 2.22 186.3 158.3 1.6
2.40 1.82 2.22 186.5 149.5 1.6
2.40 3.41 2.22 186.1 145.8 1.6
Test Series C
4.17 0.93 1.91 178.5 158.7 1.7
4.12 1.82 1.93 181.2 127.8 1.7
4.15 3.40 1.92 182.2 121.8 1.7
S: Self-pressurization G: Gaseous hydrogen pressurant
TABLE 2.---COMPARISON OF VOLUME FLOW RATE AT THE
INTERFACE LOCATION DUE TO THE CENTRAL JET AND
THE NATURAL CONVECTION FLOW
Test Jet submergence I Qc* 1 Liquid Height InterfaceRun No. depth, Hi(m) (m3/b-r) Hi(m) Dia., Ds(m)
Test Series A a
438 0.95 17.8 1.46
436 0.92 34.5 1.43
434 0.94 67.3 1.45
471 0.86 99.9 1.37
Test Series B a
Gr*
459 0.41 7.7 0.92
457 0.42 15.8 0.93
449 0.42 29.6 0.93
Test SeriesC b
385 0.92 17.7 1.43
387 0.90 33.8 1.41
389 0.91 63.8 1.42
I Qbl*(m3/hr)
1.87 9,2×10 t4 20.0
1.91 8.4× 10¹⁴ 20,0
1.88 8.9x 10¹⁴ 20.0
1.99 7.1×10¹⁴ 19.8
2.22 1.4× 10¹⁴ 14.0
2.22 1.5 × 10¹⁴ 14.2
2.22 1.5 × 10¹⁴ 14.2
1.91 .... c c
1.93
1.92 ....
aSelf-press urization.
bGaseous hydrogen pressurant.
CThe natural convection flow is not fully developed.
CHARACTERISTICSOFTHETESTS
Run No. (m/s)
Test Series A
438 80 000 0.52 0.51 0.66 - - 0.89
436 160000 0.13 0.48 1.32 13.1 ¢ 3.3 1.73
434 304 000 0.036 0.50 2.51 7.49 c 3.3 3.37
471 495 000 0.014 0,43 4.08 9.11 c 3.3 5.05
Test Series B
459 80 000 0.20 0.18 0.66 15.1 3.3 0.55
457 161 000 0.049 0.19 1.33 12.7 3.3 i.11
449 299 000 0.014 0.19 2.47 16.8 c 3.3 2.08
Test Series C
385 82 000 0.49 0.48 0.68 2.3 3.3
387 161 000 0.13 0.47 1.33 4.4 3.3
389 296 000 0.038 0.47 2.44 8.2 ¢ 3.3 - - -
TABLE 3.--THE MIXING
aDimcnsionless time basedonthe measurement.bDimensionless time basedon the predictionof Eq.(5).
¢Tesl waS terreinaled when the tank pressure reached a steady value.
Evaporation
region _\ Vapor/
//
/-- Co .ndensationreg,on
Liquid
level
_-- Jet flow, QcCold liquid
/// Mixer --_
//
//
Free convection
boundary layer flow,
Qbl
Bulk liquid
"--- Warm
liquid
\'--- Tank wall
Figure 1 .--The flow pattern and phenomena of a mixing tank.
• Wail temperature sensor
• Fluid temperature sensor - operating
[] Fluid temperature sensor - failed
Interface rake - 0.64 cm spacing
Figure 2._Tank instrumentation.
240
220
200¢=
n
_'- 180==
=o 160==a.
140
120
100 5.63 m3/hr (Run 471 .....
0 5 10 15 20 25 30
Time, min
240
220
20O¢=0.
"< 180
160
a.
140
120
1000 10 20 30 40 50 60 70 80 90 100
Time, min
240_i
220
120 _Qj = 3.40 m3/hr (Run 389_
100 .(c)- ---J ................
2 4 6 8 10 12
Time, min
Figure 3._Pressure decay as a function of time. (a) For test seriesA. (b) For test series B. (c) For test series C.
2OO
O.
"_- 180
_ _00
2.0
1.8
.¢_ 1.2
1.0
_ o.8•_ 0.6
0.4
0,2
\Qj = 0.91 m3/hr (Run 438)
\
(a)
,,_.=Qj= 1.82 m3/hr Run 436]
_Oj...=.5.63 m3/h.r {Run471),
5 10 15 20 25 30
Time, min
1.8
1.6
1.4
l.2
1.0
0.8
0.6
0.4
0.2
- "_ r (Run 459)
_ Qj = 1.8"2m3/hr _
(Run 457) L
= 3.41 m3/hr (Run 449)--
(b) I I I [
10 20 30 40 50 60 70 80 90
Time, min
2.0
1.8
c_ 1.21"41"6_ __.__ -- --"P_'_,_-QJ= 0"93 m3/hr IRon385)-_ --=---
1.0 _
== 0.8 _ _ _QJ = 1.82 m3/hr (Run 387)-0.6 • _
o.4 _ "_" "---- ==p
0.2 (c) Qj = 3.40 m /hr (Run 389)= i = = ....
0 1 2 3 4 5 6 7 8 9 10
Time, min
Figure 4._Jet subcooling as a function of time. (a) For test series A.(b) For test series B. (c) For test series C.

1.2
1.0
o.6
0.6
a.
:_ 0.4
0.2
Experiment
Prediction of eq. (131_'_=
(a)
5 10 15 20 25
Time, min
30
1.0
0.9
0.8
0.7
0.6¢ot_
E 0.5
_0.4
:_ 0.3
0.2
0.1(b)
0 1 2
! I 1Prediction of eq. (8)
=_Experiment
3 4 5 6
Time, min
1.0
0.9
0.8
0.7
0.6
E 0.5
_0.4
:_ o.3
1).2
0.1
_,_ Prediction of eq. (8)_
Ex _eriment
(c)
0 1 2 3 4 5 6 7 8
Time, min
Figure 5.--The change of vapor mass as a function of time. (a) For
test run 436; Qj = 1.82 m3/hr. (b) For test run 434; Qj = 3.47 m3/hr.
(c) For test run 471 ; Qj = 5.63 m3/hr.
]0

Form Approved
REPORT DOCUMENTATION PAGE OMBNo. 0704-0188
Public repor*dngburden for this collectionof informationis estimateclto average 1 hourper response, includingthe time for reviewinginstructions,searching existingdata sources,gathenng and maintainingthe data needed, and completingand reviewingthe collectionof information. Send comments regarding this burdenestimate or any other aspect of thiscollection of information,includingsuggestionsfor reduci_J this burden, to WashingtonHeadquartersServices, Directoratefor InformationOperations and Reports, 1215 JeffersonDavis Highway, Suits 1204, Adington,VA 22202-4302, and to the Office of Management and Budget,PaperworkReductionProject (0704-0188), Washington,DC 20503.
1. AGENCY USE ONLY (Leave blank) 2. REPORT DATE 3. REPORT TYPE AND DATES COVERED
June 1994 Technical Memorandum
4. TITLE AND SUBTITLE
Experimental Investigation of Jet-Induced Mixing of a Large Liquid Hydrogen
Storage Tank
6. AUTHOR(S)
C. S. Lin, M. M. Hasan, and N. T. Van Dresar
7. PERFORMINGORGANIZATIONNAME(S)AND ADDRESS(ES)
National Aeronautics and Space AdministrationLewis Research Center
Cleveland, Ohio 44135-3191
9. SPONSORIN_NITORING AGENCY NAME(S) AND ADDRESS(ES)
National Aeronautics and Space Administration
Washington, D.C. 20546-0001
5. FUNDING NUMBERS
WU-506-42-73
8. PERFORMING ORGANIZATION
REPORT NUMBER
E-8926
10. SPONSORING/MONITORING
AGENCY REPORT NUMBER
NASATM-106629
AIAA-94-2079
11. SUPPLEMENTARY NOTES
Prepared for the 6th Joint Thermophysics and Heat Transfer Confercnoc cospoasom.x] by the/Lmcfican Institute of Aeronautics and Asu-o.antics and the
American Society of Mechanical Engineers, Colorado Springs, Colorado, June 20-23, 1994. Chin-Shun Lin, Analcx Corporation, 3001 Aerospace
Parkway, Brook Park, Ohio 44142 (work funded by NAS3-25776); Mohammad M. Hasan and Neil I". Van Dresar, NASA Lewis Research Center.
Responsible person, Mohammad M. Hasan, organization code 5340, (216) 433-7494.12a. DISTRIBUTION/AVAILABILITY STATEMENT 12b. DISTRIBUTION CODE
Unclassified - Unlimited
Subject Category 34
13. ABSTRACT (Maximum200 words)
Experiments have been conducted to investigate the effect of fluid mixing on the depressurization of a large liquidhydrogen storage tank. The test tank is approximately ellipsoidal, having a volume of 4.89 m 3 and an average wall heat
flux of 4.2 W/m 2 due to external heat input. A mixer unit was installed Dear the bottom of the tank to generate an upward
directed axial jet flow normal to the liquid-vapor interface. Mixing tests were initiated after achieving thermally strati-
fied conditions in the tank either by the introduction of hydrogen gas into the tank or by self-pressurization due to
ambient heat leak through the tank wall. The subcooled liquid jet directed towards the liquid-vapor interface by the
mixer induced vapor condensation and caused a reduction in tank pressure. Tests were conducted at two jet submergence
depths for jet Reynolds numbers from 80 000 to 495 000 and Richardson numbers from 0.014 to 0.52. Results show that
the rate of tank pressure change is controlled by the competing effects of subcooled jet flow and the free convection
boundary layer flow due to external tank wall heating. It is shown that existing correlations for mixing time and vaporcondensation rate based on small scale tanks may not be applicable to large scale liquid hydrogen systems.
14. SUBJECT TERMS
Liquid hydrogen storage tank; Jet mixing; Pressure decay; Vapor condensation
17. SECURITY CLASSIFICATIONOF REPORT
Unclassified
NSN 7540-01-280-5500
18. SECURITY CLASSIRCATION
OF THIS PAGE
Unclassified
19. SECURITY CLASSIFICATION
OF ABSTRACT
Unclassified
15. NUMBER OF PAGES
1216. PRICE CODE
A03
20. UMITATION OF ABSTRACT
Standard Form 298 (Rev. 2-89)
Prescribed by ANSI Std. Z39-18298-102