Embed Size (px)
Citation preview
This content has been downloaded from IOPscience. Please scroll down to see the full text.
Download details:
IP Address: 129.132.202.155
This content was downloaded on 05/12/2013 at 08:21
Please note that terms and conditions apply.
Experimental and numerical assessment of low-frequency current distributions from UMTS
and GSM mobile phones
View the table of contents for this issue, or go to the journal homepage for more
2013 Phys. Med. Biol. 58 8339
(http://iopscience.iop.org/0031-9155/58/23/8339)
Home Search Collections Journals About Contact us My IOPscience
IOP PUBLISHING PHYSICS IN MEDICINE AND BIOLOGY
Phys. Med. Biol. 58 (2013) 8339–8357 doi:10.1088/0031-9155/58/23/8339
Experimental and numerical assessment oflow-frequency current distributions from UMTS andGSM mobile phones
Marie-Christine Gosselin1,2, Sven Kuhn1,2 and Niels Kuster1,2
1 Foundation for Research on Information Technologies in Society (IT’IS), Zeughausstrasse 43,8004 Zurich, Switzerland2 ETH Zurich, Zurich, Switzerland
E-mail: [email protected]
Received 15 July 2013, in final form 11 October 2013Published 11 November 2013Online at stacks.iop.org/PMB/58/8339
AbstractThe evaluation of the exposure from mobile communication devices requiresconsideration of electromagnetic fields (EMFs) over a broad frequency rangefrom dc to GHz. Mobile phones in operation have prominent spectralcomponents in the low-frequency (LF) and radio-frequency (RF) ranges. Whilethe exposure to RF fields from mobile phones has been comprehensivelyassessed in the past, the LF fields have received much less attention. Inthis study, LF fields from mobile phones are assessed experimentally andnumerically for the global system for mobile (GSM) and universal mobiletelecommunications system (UMTS) communication systems and conclusionsabout the global (LF and RF) EMF exposure from both systems are drawn.From the measurements of the time-domain magnetic fields, it was foundthat the contribution from the audio signal at a normal speech level, i.e.,−16 dBm0, is the same order of magnitude as the fields induced by the currentbursts generated from the implementation of the GSM communication system atmaximum RF output level. The B-field induced by currents in phones using theUMTS is two orders of magnitude lower than that induced by GSM. Knowingthat the RF exposure from the UMTS is also two orders of magnitude lowerthan from GSM, it is now possible to state that there is an overall reduction ofthe exposure from this communication system.
(Some figures may appear in colour only in the online journal)
1. Introduction
Over the past two decades, numerous scientists have investigated the possible effects ofelectromagnetic fields (EMFs) on humans. Studies have been conducted to identify potentialbiological effects due to exposure to weak EMF over a broad frequency range coveringextremely low frequencies to radio frequencies. Although there are various findings of
0031-9155/13/238339+19$33.00 © 2013 Institute of Physics and Engineering in Medicine Printed in the UK & the USA 8339
8340 M-C Gosselin et al
biological effects reported in the low-frequency (LF) and radio-frequency (RF) ranges, aconcrete mechanism has not yet been established. Thus, the effects from any particularfrequency range cannot be disregarded when assessing the exposure to complex transmitterssuch as mobile phones, which generate fields in various frequency ranges (LF and RF).
Currently, mobile phones operated at the human head are considered the strongest sourceof human exposure to RF EMF, i.e., worst-case exposure can approach the established safetylimits. Over the past decade, the majority of exposure assessment studies have focused onexposure to the strong RF EMF generated by phone antennas operating at frequencies between400 MHz and 3 GHz. However, LF EMF, i.e., lower than 20 kHz, are also generated by otherelements of the phone, e.g., by the supply currents or the audio speaker. There are considerablyfewer studies that address the characterization of exposure to these fields from mobile phonesused in the normal operating mode, i.e., at the head.
While there is a very limited number of studies that have assessed LF exposure from mobilephones using global system for mobile (GSM) communications experimentally (Andersenand Pedersen 1997, Jokela et al 2004, Perentos et al 2007, Tuor et al 2005) and numerically(Ilvonen et al 2005, Ilvonen and Sarvas 2007, Perentos et al 2008), there is no data at allin the literature on LF exposure from phones using the universal mobile telecommunicationssystem (UMTS) communication system. Despite this, UMTS technologies are becoming moreand more common as GSM technology is slowly being phased out. Characterization of theRF output power of UMTS phones has shown that the average exposure to RF EMF of thiscommunication system is smaller than that of GSM by more than a factor of 100 (Kuehnand Kuster 2013). Nevertheless, a recommendation for this technology cannot be made untilevaluation of the LF exposure, which has the potential to be higher than that of GSM due tothe higher current consumption of UMTS3 signal processors, has been completed.
The objective of this study is to close the gap in the knowledge of the LF exposure frommobile phones using GSM and UMTS networks. In detail, that includes:
• experimental assessment of the B-fields from mobile phones in GSM900, GSM1800, andUMTS1950 bands, and
• evaluation of the compliance with safety guidelines/standards based on induced fields andcurrent density in anatomical heads.
2. Methods
2.1. Communication systems
Communication channel separation in GSM (3GPP 1999) is implemented with time divisionmultiple access (TDMA), which results in transmission bursts. Dominant supply currents aredrawn in bursts with frequency components at 217 (frame frequency) and 8.3 Hz (1/26 missingframe). Wideband code division multiple access (W-CDMA) (3GPP 2002) is used to separatethe communication channels in UMTS. Since the transmission with the base station is quasi-continuous, the current from the battery is not drawn in bursts. Both communication systemsmight exhibit additional weak LF spectral components due to power control contributions at<2 Hz for GSM (Wiart et al 2000) as well as 750 and 1500 Hz for UMTS (Pedersen andAndersen 1999, Andersen et al 2010).
3 Here, the term UMTS is used to refer to UMTS-FDD, which is more frequently employed than UMTS-TDD,mainly used for data transfer.
Assessment of LF current distributions from mobile phones 8341
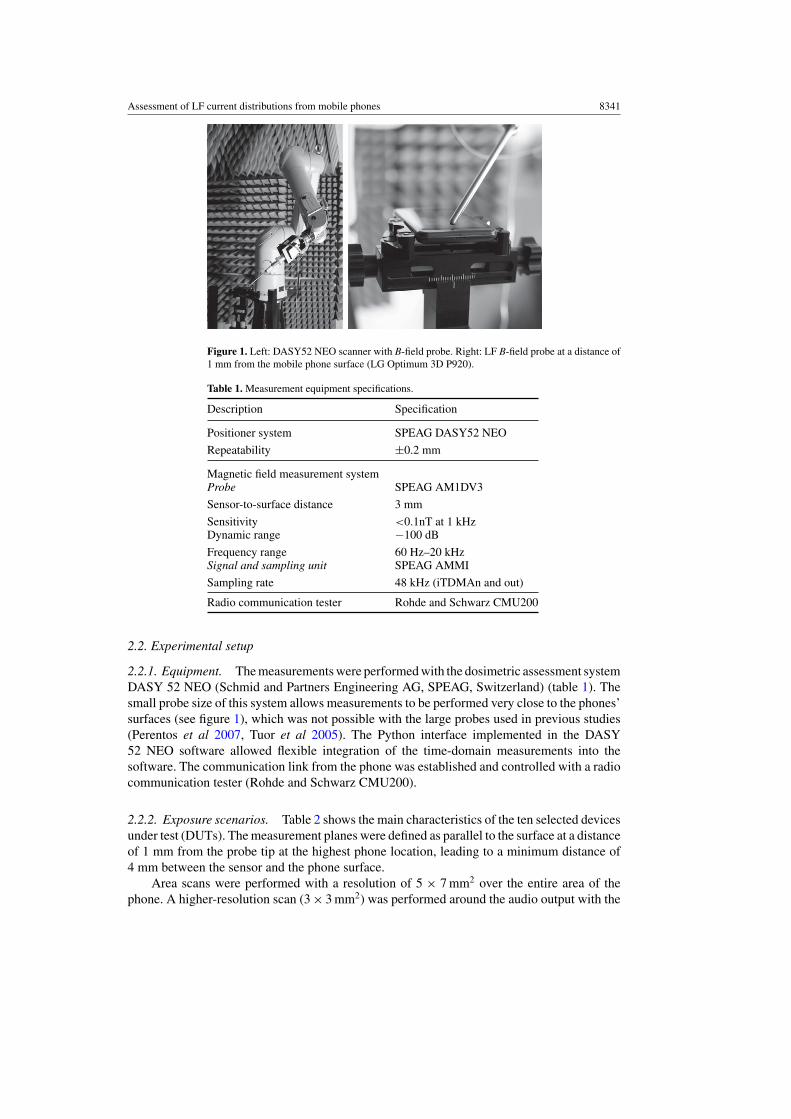
Figure 1. Left: DASY52 NEO scanner with B-field probe. Right: LF B-field probe at a distance of1 mm from the mobile phone surface (LG Optimum 3D P920).
Table 1. Measurement equipment specifications.
Description Specification
Positioner system SPEAG DASY52 NEO
Repeatability ±0.2 mm
Magnetic field measurement systemProbe SPEAG AM1DV3
Sensor-to-surface distance 3 mm
Sensitivity <0.1nT at 1 kHzDynamic range −100 dB
Frequency range 60 Hz–20 kHzSignal and sampling unit SPEAG AMMI
Sampling rate 48 kHz (iTDMAn and out)
Radio communication tester Rohde and Schwarz CMU200
2.2. Experimental setup
2.2.1. Equipment. The measurements were performed with the dosimetric assessment systemDASY 52 NEO (Schmid and Partners Engineering AG, SPEAG, Switzerland) (table 1). Thesmall probe size of this system allows measurements to be performed very close to the phones’surfaces (see figure 1), which was not possible with the large probes used in previous studies(Perentos et al 2007, Tuor et al 2005). The Python interface implemented in the DASY52 NEO software allowed flexible integration of the time-domain measurements into thesoftware. The communication link from the phone was established and controlled with a radiocommunication tester (Rohde and Schwarz CMU200).
2.2.2. Exposure scenarios. Table 2 shows the main characteristics of the ten selected devicesunder test (DUTs). The measurement planes were defined as parallel to the surface at a distanceof 1 mm from the probe tip at the highest phone location, leading to a minimum distance of4 mm between the sensor and the phone surface.
Area scans were performed with a resolution of 5 × 7 mm2 over the entire area of thephone. A higher-resolution scan (3 × 3 mm2) was performed around the audio output with the
8342 M-C Gosselin et al
Table 2. Main characteristics of the DUTs.
ID Phone model Type OS Release date
Nokia 6120 Nokia 6120 Bar - April 2007Sony Ericsson W910 Sony Ericsson W910i Slide - Oct 2007Sony Ericsson W760i Sony Ericsson W760i Slide - May 2008MotorolaV1050 Motorola V1050 Flip - January 2005HTCdiam100 HTC Diam100 Touch Diamond Smart Windows phone May 2008HTCtopa100 HTC Topa100 Touch Diamond2 Smart Windows phone April 2009iPhone3 g Apple iPhone 3 g Smart iOS July 2008iPhone4 Apple iPhone 4 Smart iOS June 2010SamsungGT-I9001 Samsung Galaxy GT-I9001 Smart Android June 2010LG LG P920 Optimus 3D Smart Android July 2011
Table 3. PCL and corresponding typical average RF power for each communication system.
0 dB −6 dB −12 dB
Communication system PCL mW PCL mW PCL mW
GSM900 PCL5 250 PCL8 63 PCL11 16GSM1800 PCL0 125 PCL3 31 PCL6 8UMTSa – ∼250 – ∼63 – ∼16a For devices of power class 3 (3GPP 2002).
audio signal turned on. The B-field decay from the phone surface was assessed by performinga 1D scan with a resolution of 1 mm perpendicular to the phone surface at one location onthe front side of the phone. For all measurements, the microphone was turned off to preventpick-up of sounds in the vicinity of the microphone.
Some measurements were performed using multiple RF power control levels (PCLs) (seetable 3) to allow discrimination of the LF B-fields related to the communication system fromother consumers. On the other hand, the influence of the power control in real networks andenvironments as well as the usage of discontinuous transmission were not assessed in thisstudy.
The following configurations were measured for each DUT4 in the GSM900, GSM1800,and UMTS bands:
• at highest PCL, i.e., 0 dB, with audio on: area scans (front, back, speaker);• at PCL = −6 dB with audio off: area scan (front)5;• at PCLs = 0,−6,−12 dB:
– audio off: z-scan, e.g., perpendicular to the phone surface (front, one location);– audio on: area scan (speaker), limited to 4 DUTs;– audio on: z-scan (speaker, one location), limited to 4 DUTs.
For audio on measurement configurations, a 1 kHz audio signal was transmitted from theAMMI to the CMU200 and then to the phone speaker via the radio interface. The audio signalwas set at a normal speech level for GSM and UMTS, i.e., −16 dBm0 (ANSI 2007).
4 Although the specifications of the MotorolaV1050 phone include UMTS, the connection in this band was veryunstable and did not allow complete measurement; similar behavior was observed for GSM900 and GSM1800 atlower PCLs.5 For the slide and flip phones, only the surface of the phone on which the highest fields were measured, i.e., thebottom part close to the battery, was monitored at the lower power level.
Assessment of LF current distributions from mobile phones 8343
Table 4. Uncertainty budget of the magnetic field measurements.
Unc. Prob. Std.Error description value (%) dist. Div. unc. (%)
Probe sensitivityReference voltage at AMMI output ±3.0 N 1 ±3.0AMCC geometry ±0.4 R
√3 ±0.2
AMCC current ±1.0 R√
3 ±0.6Probe positioning during calibration ±0.07 R
√3 ±0.04
Noise contribution ±0.7 R√
3 ±0.4
Probe systemRepeatability/drift ±1.0 R
√3 ±0.6
Linearity/dynamic range ±0.6 R√
3 ±0.3Probe angle ±2.3 R
√3 ±1.3
Field disturbance ±0.2 R√
3 ±0.1
PositioningProbe positioning ±1.9 R
√3 ±1.1
DUT positioning ±8.3 R√
3 ±4.8
Combined uncertaintyCombined std. uncertainty ±6.0Expanded std. uncertainty ±12.0
2.2.3. Uncertainty budget. The uncertainty budget of the measurement system wasdetermined according to (ANSI 2007) (see table 4). The calibration of the probe was performedusing a Helmholtz coil (AMCC, SPEAG, Switzerland).
2.2.4. Frequency range. The measurement setup characterization has shown that currents areinduced in the coil sensor by vibrations when placed next to a permanent magnet, resulting inparasitic spectral components in the range 20–60 Hz with levels up to 1 μT, the same order ofmagnitude as the fields measured close to the phones’ surfaces. As several permanent magnetscan be found in mobile phones, e.g., at the speaker, to hold a pen, in the sliding mechanism,etc, the spectra were filtered to cut off frequencies below 60 Hz.
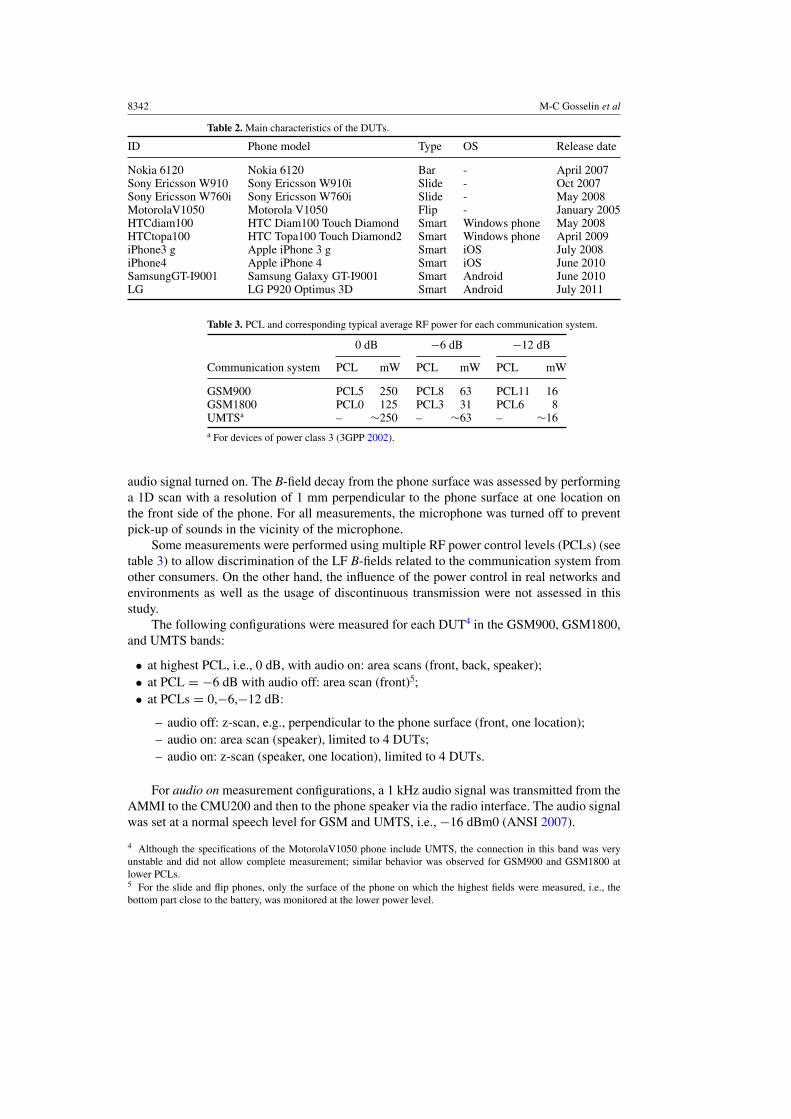
2.2.5. Detection limit. The response of the probe leads to a frequency-dependent detectionlimit. The sensitivity was assessed in the actual setup as well as with a mu-metal shielding(see figure 2). The detection limit was approximated by two linear functions (lower and higherthan 80 Hz); any measurement data lower than this limit was considered as noise and wasfiltered out.
2.3. Numerical assessment
2.3.1. LF numerical solver. The LF currents induced in the human body by magneticfields were analyzed with the Biot–Savart solver and the finite-element method implementedin SEMCAD X 14.8 (Chen et al 2013). Unlike typical finite-element methods, thisimplementation operates on rectilinear meshes, like the finite-difference time-domain method,allowing complex anatomical models to be easily rendered at various geometrical resolutions.
It is important to note that, when using the Biot–Savart quasi-static approximation, onlythe conductivity of the tissues needs to be specified. The E-field distribution of a simulation at a
8344 M-C Gosselin et al
100
101
102
103
104
10−7
10−6
10−5
10−4
10−3
10−2
10−1
100
f /Hz
Brm
s /µT
free spacemu−metaldetection limit
Figure 2. Detection limit of the measurement system with and without shielding from the ambientfields, mu-metal and free-space measurements, respectively.
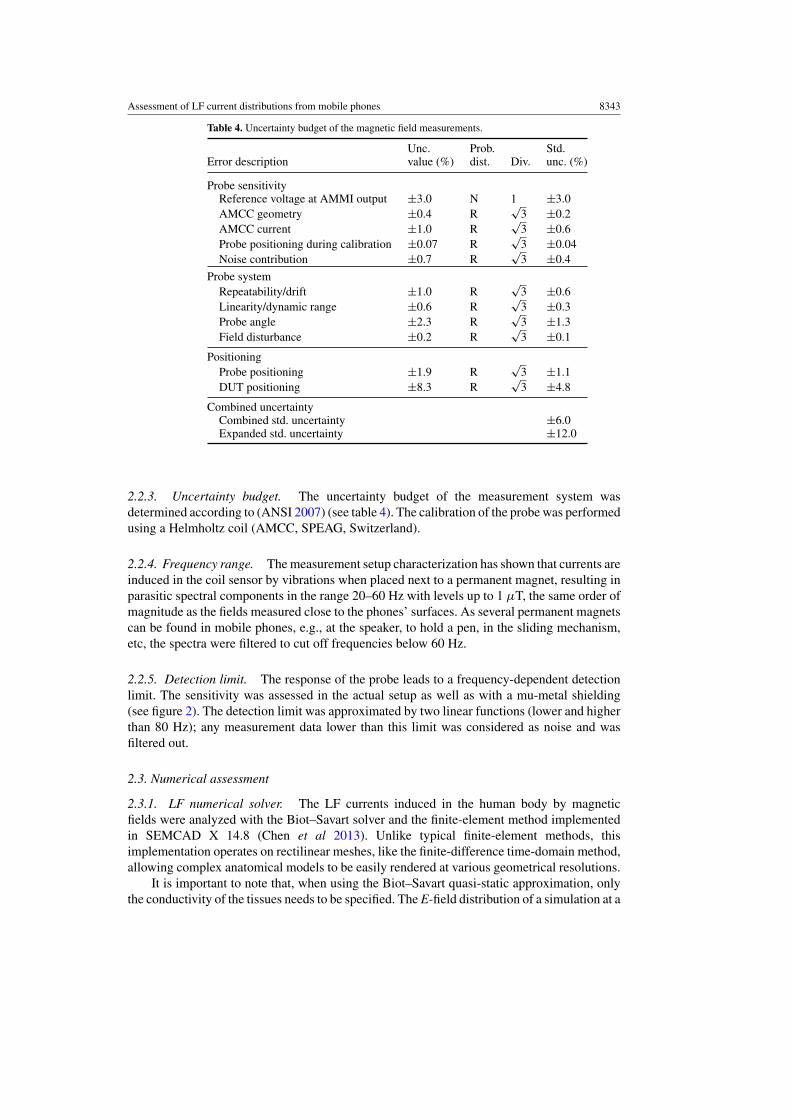
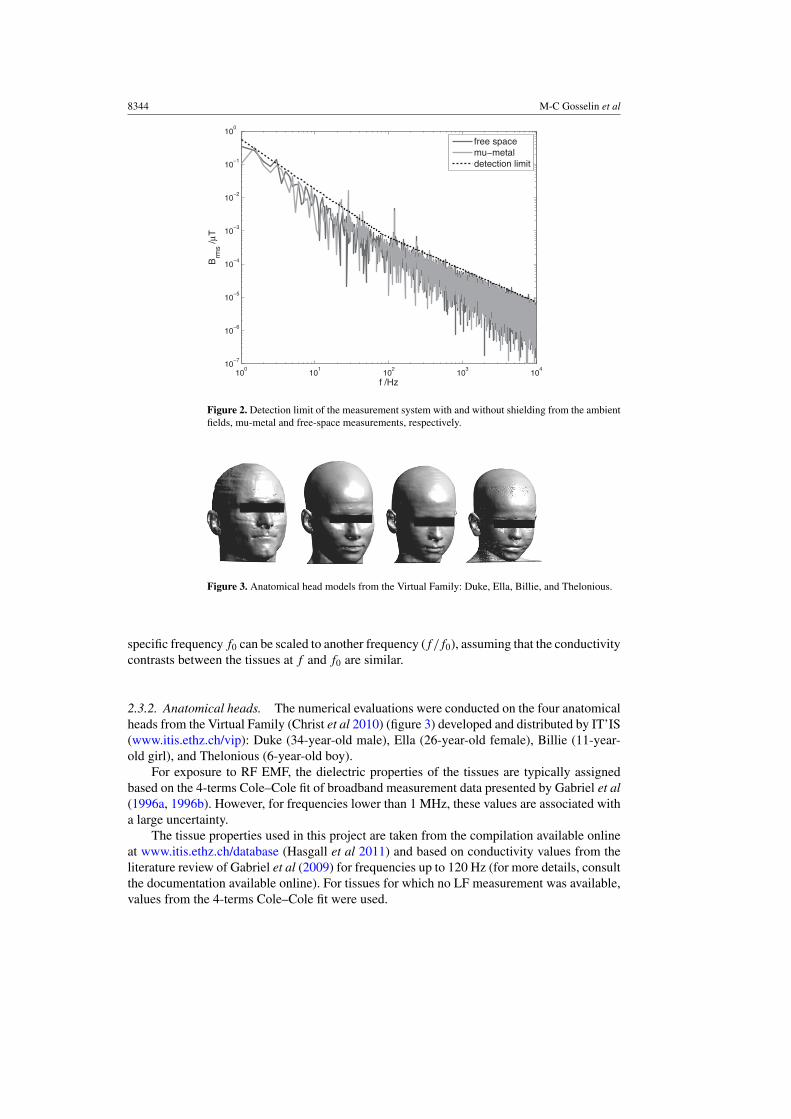
Figure 3. Anatomical head models from the Virtual Family: Duke, Ella, Billie, and Thelonious.
specific frequency f0 can be scaled to another frequency ( f / f0), assuming that the conductivitycontrasts between the tissues at f and f0 are similar.
2.3.2. Anatomical heads. The numerical evaluations were conducted on the four anatomicalheads from the Virtual Family (Christ et al 2010) (figure 3) developed and distributed by IT’IS(www.itis.ethz.ch/vip): Duke (34-year-old male), Ella (26-year-old female), Billie (11-year-old girl), and Thelonious (6-year-old boy).
For exposure to RF EMF, the dielectric properties of the tissues are typically assignedbased on the 4-terms Cole–Cole fit of broadband measurement data presented by Gabriel et al(1996a, 1996b). However, for frequencies lower than 1 MHz, these values are associated witha large uncertainty.
The tissue properties used in this project are taken from the compilation available onlineat www.itis.ethz.ch/database (Hasgall et al 2011) and based on conductivity values from theliterature review of Gabriel et al (2009) for frequencies up to 120 Hz (for more details, consultthe documentation available online). For tissues for which no LF measurement was available,values from the 4-terms Cole–Cole fit were used.
Assessment of LF current distributions from mobile phones 8345
The conductivity of skin at LF is problematic. For segmented models, in particular thoseof the Virtual Family, a homogeneous skin with a thickness of 2–4 mm is modeled. ReportedLF conductivities of the skin often take only the outermost layer into consideration, the stratumcorneum, which is about 0.1 mm thick and mainly made of dead cells (1 × 10⁻⁴ S m−1). Theuncertainty on this value is very high, particularly because it is highly dependent on the degreeof moisture; reported values for wet skin in the LF range reach 2 × 10⁻³ S m−1 (Raicu et al2000). These very low values of conductivity result in high and very localized induced fields,the volume of which is overestimated due to the homogeneous skin layer of the anatomicalmodels. Additionally, the nerve endings do not reach the stratum corneum and the ICNIRPlimits at low frequencies are based on nerve stimulation. Thus, a value of skin conductivitybased on a weighted average of the components of its deeper layers (mainly muscles, fat, andblood), i.e., 1×10⁻¹ S m−1, as suggested by Dimbylow (2005), is more realistic and was usedin this study.
2.3.3. Exposure scenarios. The numerical sources were placed on the left side6 of the headsaccording to the procedure described in Kainz et al (2005). For the loop source that is usedto model the fields from the communication system and the audio speaker, the uncertaintyregarding the location of the maxima on the phone was taken into account by translating thesources by ±10 mm in the plane of the phone, leading to a 3 × 3 exposure matrix.
2.4. Compliance with guidelines and standards
The exposure to non-ionizing radiation is regulated in most countries by guidelines developedeither by the International Commission on Non-Ionizing Radiation Protection (ICNIRP) orthe Institute of Electrical and Electronics Engineers (IEEE). The ICNIRP 1998 guidelines(ICNIRP 1998) cover frequencies from dc up to 300 GHz, whereas the 2010 guidelines(ICNIRP 2010) are specific for LF EMF (1 Hz–100 kHz). As both guidelines are presently inforce, research groups interested in LF exposure usually compare compliance to both, as wealso do here. The IEEE has published a safety standard for exposure to EMF at frequenciesup to 3 kHz (IEEE 2002).
2.4.1. Basic restrictions. In ICNIRP (1998), EMF up to 10 MHz are limited by the maximumcurrent density in the head and trunk (see table 5) to prevent effects on the nervous system,e.g., peripheral nerve stimulation and induction of phosphenes in the retina. The currentdensity should be averaged over a cross-section of 1 cm2, 〈J〉1 cm2 . In the LF guidelines(ICNIRP 2010), the internal electric field averaged over a small contiguous tissue volume of2 × 2 × 2 mm3, 〈E〉8 mm3 , is used as the basic restriction (table 5). For each specific tissue, theguidelines specify that the 99th percentile value should be reported, an approach which hasbeen criticized by several groups (De Santis et al 2012a, Laakso and Hirata 2012, Bakker et al2012, Chen et al 2013). The influence of the definition of each tissue on the 99th percentilevalue is particularly relevant for localized exposure such as here. Finally, the IEEE (2002)standard defines basic restrictions in terms of the electric field averaged over a straight linesegment of 5 mm length, 〈E〉5 mm (table 6). The implementation of these averaging schemesin SEMCAD X is described in Chen et al (2013).
6 The symmetry of the head and the exposure source allows us to assume similar results for exposure on the rightside, as was already confirmed by Varsier et al (2008) and Gosselin et al (2011).
8346 M-C Gosselin et al
Table 5. ICNIRP basic restrictions (ICNIRP 1998, 2010) for general public exposure.
ICNIRP 1998ICNIRP 2010
Current densityInternal electric field
mA m −2 (rms)V m−1 (rms)
Frequency range Head and trunk CNS head Head and body
Up to 1 Hz 8 – –1–4 Hz 8/ f 0.1/ f 0.44–10 Hz 2 0.1/ f 0.410–25 Hz 2 0.01 0.425 Hz–1 kHz 2 4 × 10⁻⁴ f 0.41–3 kHz f /500 0.4 0.43–100 kHz f /500 1.35 × 10⁻⁴ f 1.35 × 10⁻⁴ f100 kHz–10 MHz – 1.35 × 10⁻⁴ f 1.35 × 10⁻⁴ f
Table 6. IEEE C95.6-2002 basic restrictions (IEEE 2002) on the induced E-field, Ei, for generalpublic exposure. Ei = E0 for f � fe; Ei = E0( f / fe) for f � fe.
fe E0
Exposed tissue Hz V m−1 (rms)
Brain 20 5.89 × 10⁻³
Heart 167 0.943Hands, wrists, feet, and ankles 3350 2.10Other tissue 3350 0.701
2.4.2. Complex waveforms. The peak value of a time-domain signal cannot be directlycompared to the safety limits, which are frequency dependent. A frequency-weightingtechnique for how to treat signals with frequency contents lower than 100 kHz (ICNIRP 2003)allows assessment independent of signal characteristics. This approach has been appliedin various contexts, either including a frequency-dependent phase shift (Jokela et al 2004,Kannala et al 2009), omitting it (Nadakuduti et al 2012), or comparing both (De Santis et al2012b). We do not consider this phase shift here, as the rationale for doing so is unconvincing.
The ICNIRP guidance (ICNIRP 2003) suggests to use the basic restrictions to assessthe conservativeness of the exposure, which is expressed in the original statement (ICNIRP1998) in terms of current density. The time derivative of the magnetic flux density, dB/dt,can be derived from the current density dB/dt = J/KB, where KB = 0.064 A m−2 s T−1. Ateach measurement point, the time-domain signal is first transformed to the frequency domain,where the normalized weighting function derived from the ICNIRP guidelines, based on Bor dB/dt, is applied. The inverse Fourier transform (IFT) is then applied, and the weightedtime-domain signal can be analyzed in terms of B or dB/dt and compared to the limits usedfor the normalization of the weighting function. This treatment ensures that when there isconstructive addition of the spectral components, it is taken into account in the complianceanalysis. Thus, the ratio to the considered limit, or compliance factor, CF, can be expressed as
CFmeasmax = max
√√√√ ∑i=x,y,z
(d
dtIFT
(Bmeas
i ( f )
Jlim( f )KB
))2
, (1)
for consideration of the basic restrictions, i.e., the limit in terms of J (or dB/dt).
Assessment of LF current distributions from mobile phones 8347
The corner frequency used in the 2003 guidance (820 Hz) is based on the limit onoccupational exposure. Here, we have chosen an approach consistent with the 1998 guidelinesfor general public exposure, using the current density values up to 100 kHz (see table 5).
2.4.3. Evaluation of numerical results. Simulations were performed at the frequency f0—217 Hz for the communication system and 1 kHz for the audio signal—and the quantityof interest, Qsim( f0)—which can be 〈J〉1 cm2 (ICNIRP 1998), 〈E〉8 mm3 (ICNIRP 2010), or〈E〉5 mm (IEEE 2002)—is extracted. To assess the exposure from the measured signals with acomplex waveform, frequency scaling is applied. The results are normalized to the appropriatecurrent by comparing the B-field from the measurement (Bmeas( f0)
∣∣z=z0
) and the simulation(Bsim( f0)
∣∣z=z0
) in the plane z = z0, and multiplied by the normalized spectral content(Bmeas
z ( f )/Bmeasz ( f0)):
Qsim( f ) = Qsim( f0) × f
f0× max(Bmeas( f0)|z=z0 )
max(Bsim( f0)|z=z0 )× Bmeas
z ( f )
Bmeasz ( f0)
. (2)
Additional scaling to the conductivity should be performed for the current density, but sincehere the LF dielectric properties are used for most tissues (section 2.3.2), this is not necessary.The frequency-domain signal is weighted with the frequency-dependent limits, Lim( f ), andtransformed back to the time domain, where the maximum is extracted. The compliance factoris, thus, given by
CF simmax = max
(IFT
(Qsim( f )
Lim( f )
)). (3)
3. Validation of experimental setup
The experimental setup was validated by measuring the magnetic fields of a calibratedtelephone magnetic field simulator (TMFS, SPEAG, Switzerland) and a thin wire fed bya sinusoidal source. The peak magnetic field reading 10 mm above the TMFS deviated <3%from the target value. The maximum value of magnetic field measured with a resolutionof 0.7 mm in a plane 1 mm above the thin wire was 3.45 μT, deviating <3% from theanalytically determined target value of 3.42 μT. Both deviations are well within the totalexpanded measurement uncertainty of the system of 7.3% (table 4) when the uncertainty dueto the phone positioning is disregarded.
4. Experimental assessment
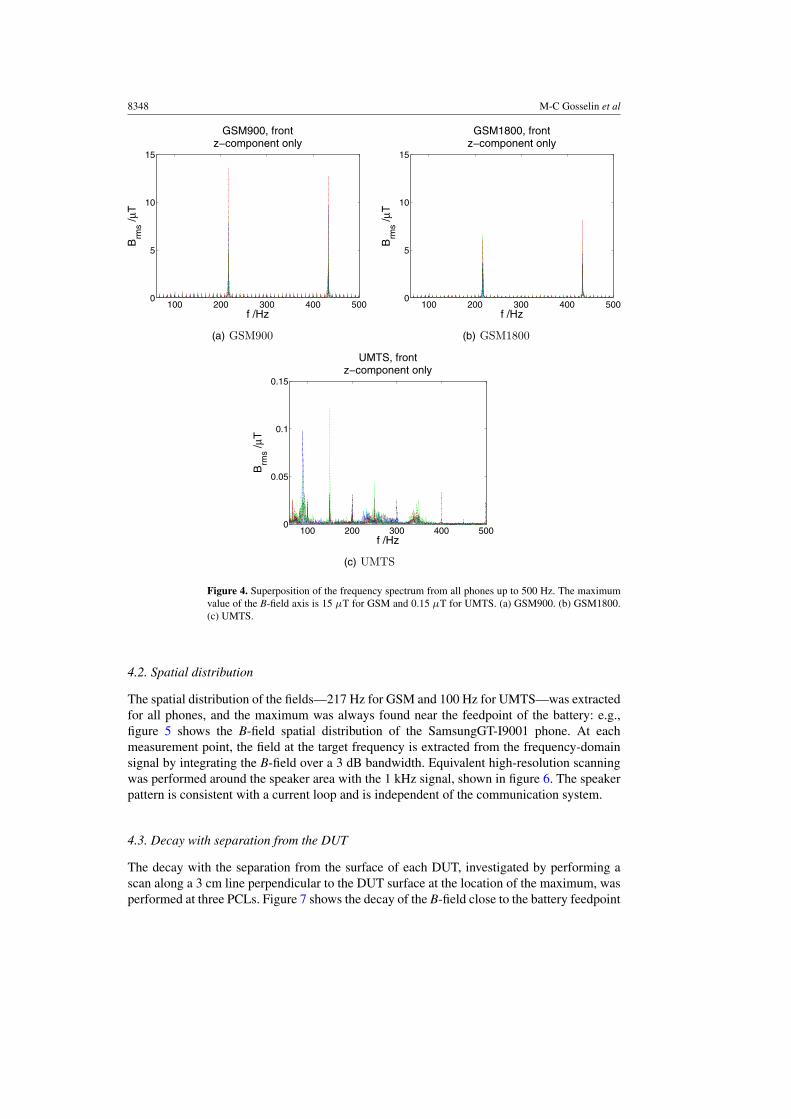
4.1. Frequency content
Figure 4 shows the frequency content for all phones at frequencies up to 500 Hz. As expectedfor the GSM communication system, fields at 217 Hz and harmonics are measured with allphones at 900 and 1800 MHz. Although the experimental setup did not allow measurementslower than 60 Hz, the 8.3 Hz component of the GSM communication system is seen by thepresence of its harmonics in figures 4(a) and (b).
For UMTS, the fields are in general much smaller than for GSM—note that the B-fieldaxis in figure 4(c) is a factor of 100 smaller than for figures 4(a) and (b). Further, no frequencycomponent is systematically much larger than the others, e.g., the power control performed ata frequency of 1500 Hz does not draw current bursts from the battery. A more detailed analysisshowed that, for all phones, a 100 Hz component can be detected, most probably due to thetime frame of 10 ms used in UMTS.
8348 M-C Gosselin et al
100 200 300 400 5000
5
10
15
f /Hz
Brm
s /µT
GSM900, frontz−component only
(a) GSM900
100 200 300 400 5000
5
10
15
f /Hz
Brm
s /µT
GSM1800, frontz−component only
(b) GSM1800
100 200 300 400 5000
0.05
0.1
0.15
f /Hz
Brm
s /µT
UMTS, frontz−component only
(c) UMTS
Figure 4. Superposition of the frequency spectrum from all phones up to 500 Hz. The maximumvalue of the B-field axis is 15 μT for GSM and 0.15 μT for UMTS. (a) GSM900. (b) GSM1800.(c) UMTS.
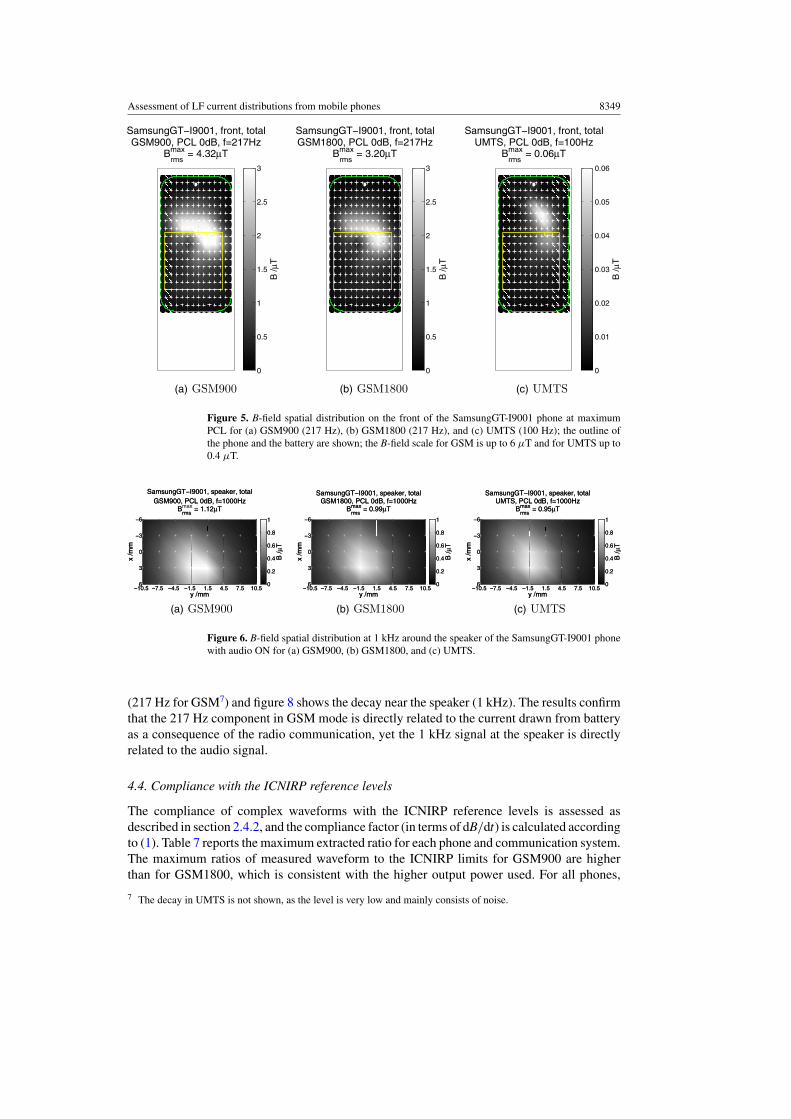
4.2. Spatial distribution
The spatial distribution of the fields—217 Hz for GSM and 100 Hz for UMTS—was extractedfor all phones, and the maximum was always found near the feedpoint of the battery: e.g.,figure 5 shows the B-field spatial distribution of the SamsungGT-I9001 phone. At eachmeasurement point, the field at the target frequency is extracted from the frequency-domainsignal by integrating the B-field over a 3 dB bandwidth. Equivalent high-resolution scanningwas performed around the speaker area with the 1 kHz signal, shown in figure 6. The speakerpattern is consistent with a current loop and is independent of the communication system.
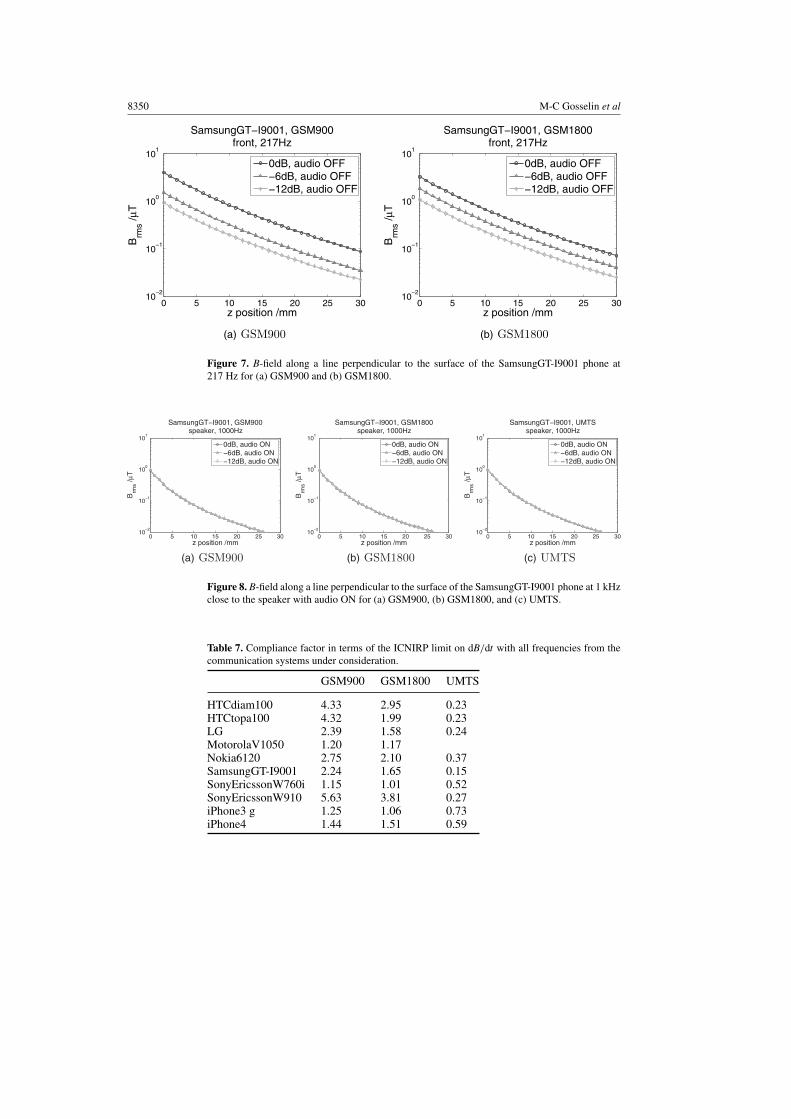
4.3. Decay with separation from the DUT
The decay with the separation from the surface of each DUT, investigated by performing ascan along a 3 cm line perpendicular to the DUT surface at the location of the maximum, wasperformed at three PCLs. Figure 7 shows the decay of the B-field close to the battery feedpoint
Assessment of LF current distributions from mobile phones 8349
SamsungGT−I9001, front, totalGSM900, PCL 0dB, f=217Hz
Brmsmax = 4.32µT
B /µ
T
0
0.5
1
1.5
2
2.5
3
(a) GSM900
SamsungGT−I9001, front, totalGSM1800, PCL 0dB, f=217Hz
Brmsmax = 3.20µT
B / µ
T
0
0.5
1
1.5
2
2.5
3
(b) GSM1800
SamsungGT−I9001, front, totalUMTS, PCL 0dB, f=100Hz
Brmsmax = 0.06µT
B /µ
T
0
0.01
0.02
0.03
0.04
0.05
0.06
(c) UMTS
Figure 5. B-field spatial distribution on the front of the SamsungGT-I9001 phone at maximumPCL for (a) GSM900 (217 Hz), (b) GSM1800 (217 Hz), and (c) UMTS (100 Hz); the outline ofthe phone and the battery are shown; the B-field scale for GSM is up to 6 μT and for UMTS up to0.4 μT.
−10.5 −7.5 −4.5 −1.5 1.5 4.5 7.5 10.56
3
0
−3
−6
y /mm
x /m
m
SamsungGT−I9001, speaker, totalGSM900, PCL 0dB, f=1000Hz
Brmsmax = 1.12µT
B /µ
T
0
0.2
0.4
0.6
0.8
1
−10.5 −7.5 −4.5 −1.5 1.5 4.5 7.5 10.56
3
0
−3
−6
y /mm
x /m
m
SamsungGT−I9001, speaker, totalGSM1800, PCL 0dB, f=1000Hz
Brmsmax = 0.99µT
B / µ
T
0
0.2
0.4
0.6
0.8
1
−10.5 −7.5 −4.5 −1.5 1.5 4.5 7.5 10.56
3
0
−3
−6
y /mm
x /m
m
SamsungGT−I9001, speaker, totalUMTS, PCL 0dB, f=1000Hz
Brmsmax = 0.95µT
B /µ
T
0
0.2
0.4
0.6
0.8
1
−10.5 −7.5 −4.5 −1.5 1.5 4.5 7.5 10.56
3
0
−3
−6
y /mm
x /m
m
SamsungGT−I9001, speaker, totalGSM900, PCL 0dB, f=1000Hz
Brms
= 1.12µT
B /µ
T
0
0.2
0.4
0.6
0.8
1
(a) GSM900
−10.5 −7.5 −4.5 −1.5 1.5 4.5 7.5 10.56
3
0
−3
−6
y /mm
x /m
m
SamsungGT−I9001, speaker, totalGSM1800, PCL 0dB, f=1000Hz
Brmsmax = 0.99µT
B / µ
T
0
0.2
0.4
0.6
0.8
1
(b) GSM1800
−10.5 −7.5 −4.5 −1.5 1.5 4.5 7.5 10.56
3
0
−3
−6
y /mm
x /m
m
SamsungGT−I9001, speaker, totalUMTS, PCL 0dB, f=1000Hz
Brmsmax = 0.95µT
B /µ
T
0
0.2
0.4
0.6
0.8
1
(c) UMTS
Figure 6. B-field spatial distribution at 1 kHz around the speaker of the SamsungGT-I9001 phonewith audio ON for (a) GSM900, (b) GSM1800, and (c) UMTS.
(217 Hz for GSM7) and figure 8 shows the decay near the speaker (1 kHz). The results confirmthat the 217 Hz component in GSM mode is directly related to the current drawn from batteryas a consequence of the radio communication, yet the 1 kHz signal at the speaker is directlyrelated to the audio signal.
4.4. Compliance with the ICNIRP reference levels
The compliance of complex waveforms with the ICNIRP reference levels is assessed asdescribed in section 2.4.2, and the compliance factor (in terms of dB/dt) is calculated accordingto (1). Table 7 reports the maximum extracted ratio for each phone and communication system.The maximum ratios of measured waveform to the ICNIRP limits for GSM900 are higherthan for GSM1800, which is consistent with the higher output power used. For all phones,
7 The decay in UMTS is not shown, as the level is very low and mainly consists of noise.
8350 M-C Gosselin et al
0 5 10 15 20 25 3010
−2
10−1
100
101
z position /mm
Brm
s /µT
SamsungGT−I9001, GSM900front, 217Hz
0dB, audio OFF−6dB, audio OFF−12dB, audio OFF
(a) GSM900
0 5 10 15 20 25 3010
−2
10−1
100
101
z position /mm
Brm
s /µT
SamsungGT−I9001, GSM1800front, 217Hz
0dB, audio OFF−6dB, audio OFF−12dB, audio OFF
(b) GSM1800
Figure 7. B-field along a line perpendicular to the surface of the SamsungGT-I9001 phone at217 Hz for (a) GSM900 and (b) GSM1800.
0 5 10 15 20 25 3010
−2
10−1
100
101
z position /mm
Brm
s /µT
SamsungGT−I9001, GSM900speaker, 1000Hz
0dB, audio ON−6dB, audio ON−12dB, audio ON
(a) GSM900
0 5 10 15 20 25 3010
−2
10−1
100
101
z position /mm
Brm
s /µT
SamsungGT−I9001, GSM1800speaker, 1000Hz
0dB, audio ON−6dB, audio ON−12dB, audio ON
(b) GSM1800
0 5 10 15 20 25 3010
−2
10−1
100
101
z position /mm
Brm
s /µT
SamsungGT−I9001, UMTSspeaker, 1000Hz
0dB, audio ON−6dB, audio ON−12dB, audio ON
(c) UMTS
Figure 8. B-field along a line perpendicular to the surface of the SamsungGT-I9001 phone at 1 kHzclose to the speaker with audio ON for (a) GSM900, (b) GSM1800, and (c) UMTS.
Table 7. Compliance factor in terms of the ICNIRP limit on dB/dt with all frequencies from thecommunication systems under consideration.
GSM900 GSM1800 UMTS
HTCdiam100 4.33 2.95 0.23HTCtopa100 4.32 1.99 0.23LG 2.39 1.58 0.24MotorolaV1050 1.20 1.17Nokia6120 2.75 2.10 0.37SamsungGT-I9001 2.24 1.65 0.15SonyEricssonW760i 1.15 1.01 0.52SonyEricssonW910 5.63 3.81 0.27iPhone3 g 1.25 1.06 0.73iPhone4 1.44 1.51 0.59
Assessment of LF current distributions from mobile phones 8351
Avg all phones, front, Local Max dB/dtGSM900, PCL = 0dB
Max Ratio = 1.11, noAudio
Rat
io to
ICN
IRP
lim
it
0
0.1
0.2
0.3
0.4
0.5
0.6
0.7
0.8
0.9
1
(a) GSM900
Avg all phones, front, Local Max dB/dtGSM1800, PCL = 0dB
Max Ratio = 0.74, noAudio
Rat
io to
ICN
IRP
lim
it
0
0.1
0.2
0.3
0.4
0.5
0.6
0.7
0.8
0.9
1
(b) GSM1800
Avg all phones, front, Local Max dB/dtUMTS, PCL = 0dB
Max Ratio = 0.18, noAudio
Rat
io to
ICN
IRP
lim
it
0
0.1
0.2
0.3
0.4
0.5
0.6
0.7
0.8
0.9
1
(c) UMTS
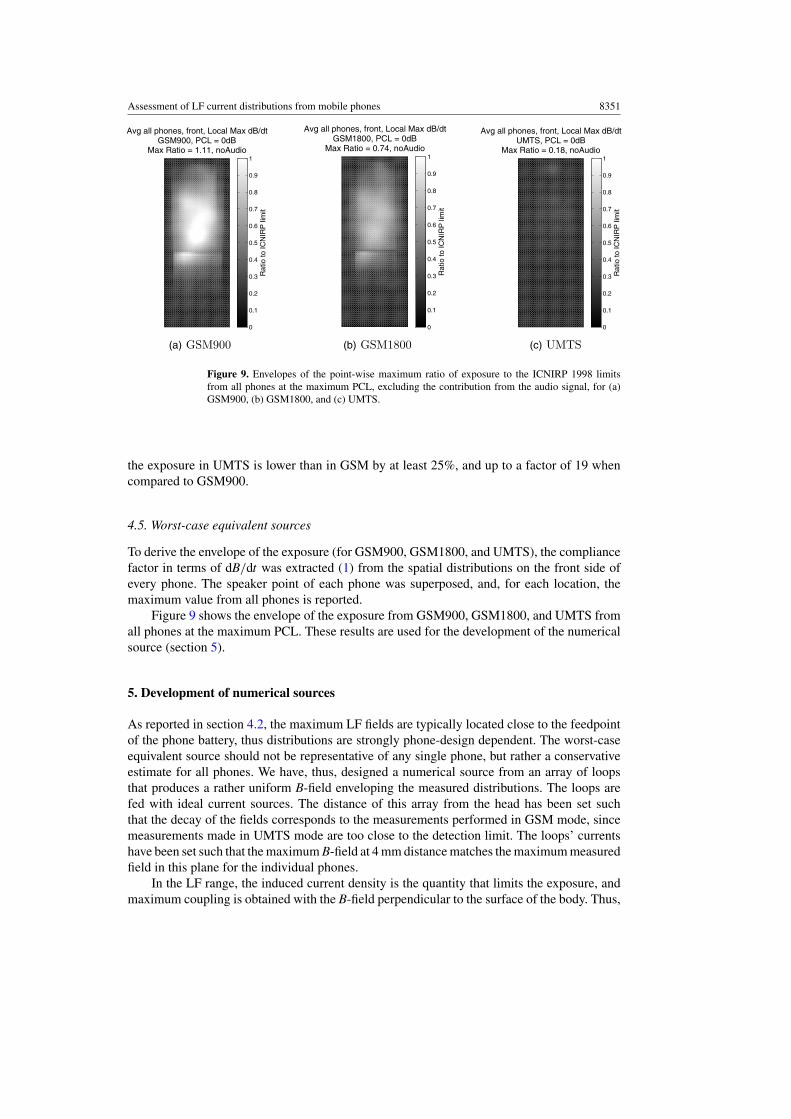
Figure 9. Envelopes of the point-wise maximum ratio of exposure to the ICNIRP 1998 limitsfrom all phones at the maximum PCL, excluding the contribution from the audio signal, for (a)GSM900, (b) GSM1800, and (c) UMTS.
the exposure in UMTS is lower than in GSM by at least 25%, and up to a factor of 19 whencompared to GSM900.
4.5. Worst-case equivalent sources
To derive the envelope of the exposure (for GSM900, GSM1800, and UMTS), the compliancefactor in terms of dB/dt was extracted (1) from the spatial distributions on the front side ofevery phone. The speaker point of each phone was superposed, and, for each location, themaximum value from all phones is reported.
Figure 9 shows the envelope of the exposure from GSM900, GSM1800, and UMTS fromall phones at the maximum PCL. These results are used for the development of the numericalsource (section 5).
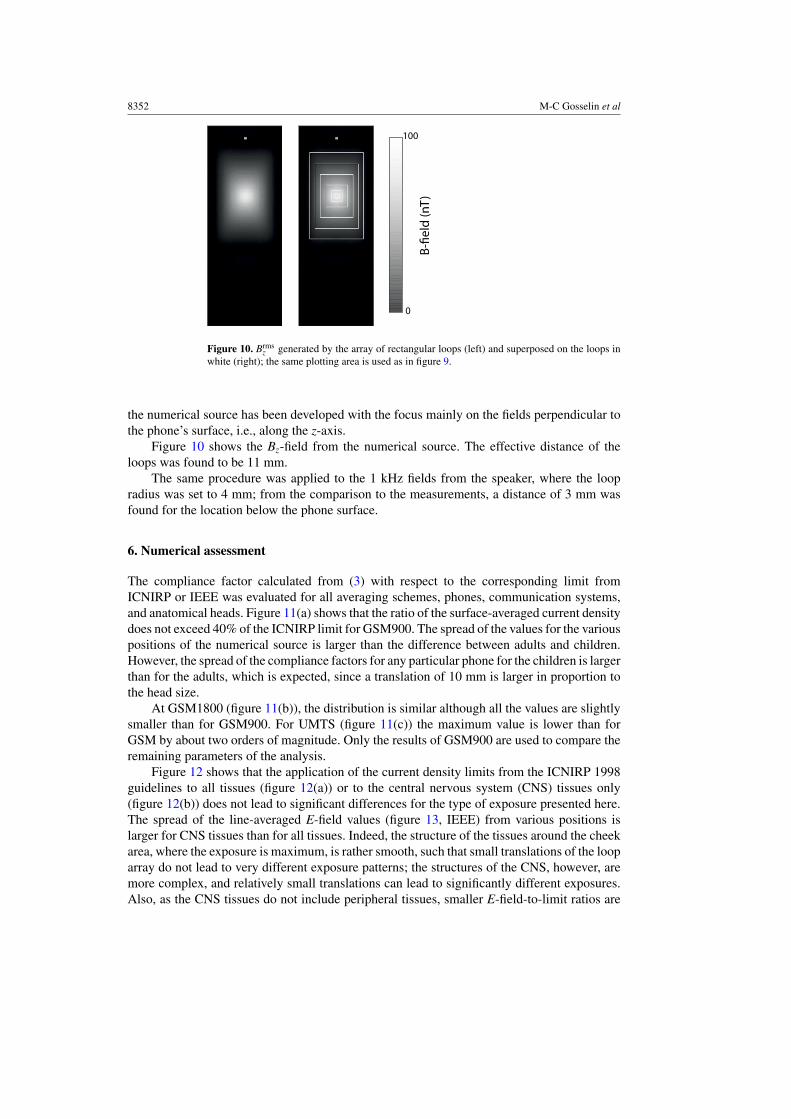
5. Development of numerical sources
As reported in section 4.2, the maximum LF fields are typically located close to the feedpointof the phone battery, thus distributions are strongly phone-design dependent. The worst-caseequivalent source should not be representative of any single phone, but rather a conservativeestimate for all phones. We have, thus, designed a numerical source from an array of loopsthat produces a rather uniform B-field enveloping the measured distributions. The loops arefed with ideal current sources. The distance of this array from the head has been set suchthat the decay of the fields corresponds to the measurements performed in GSM mode, sincemeasurements made in UMTS mode are too close to the detection limit. The loops’ currentshave been set such that the maximum B-field at 4 mm distance matches the maximum measuredfield in this plane for the individual phones.
In the LF range, the induced current density is the quantity that limits the exposure, andmaximum coupling is obtained with the B-field perpendicular to the surface of the body. Thus,
8352 M-C Gosselin et al
0
100
Figure 10. Brmsz generated by the array of rectangular loops (left) and superposed on the loops in
white (right); the same plotting area is used as in figure 9.
the numerical source has been developed with the focus mainly on the fields perpendicular tothe phone’s surface, i.e., along the z-axis.
Figure 10 shows the Bz-field from the numerical source. The effective distance of theloops was found to be 11 mm.
The same procedure was applied to the 1 kHz fields from the speaker, where the loopradius was set to 4 mm; from the comparison to the measurements, a distance of 3 mm wasfound for the location below the phone surface.
6. Numerical assessment
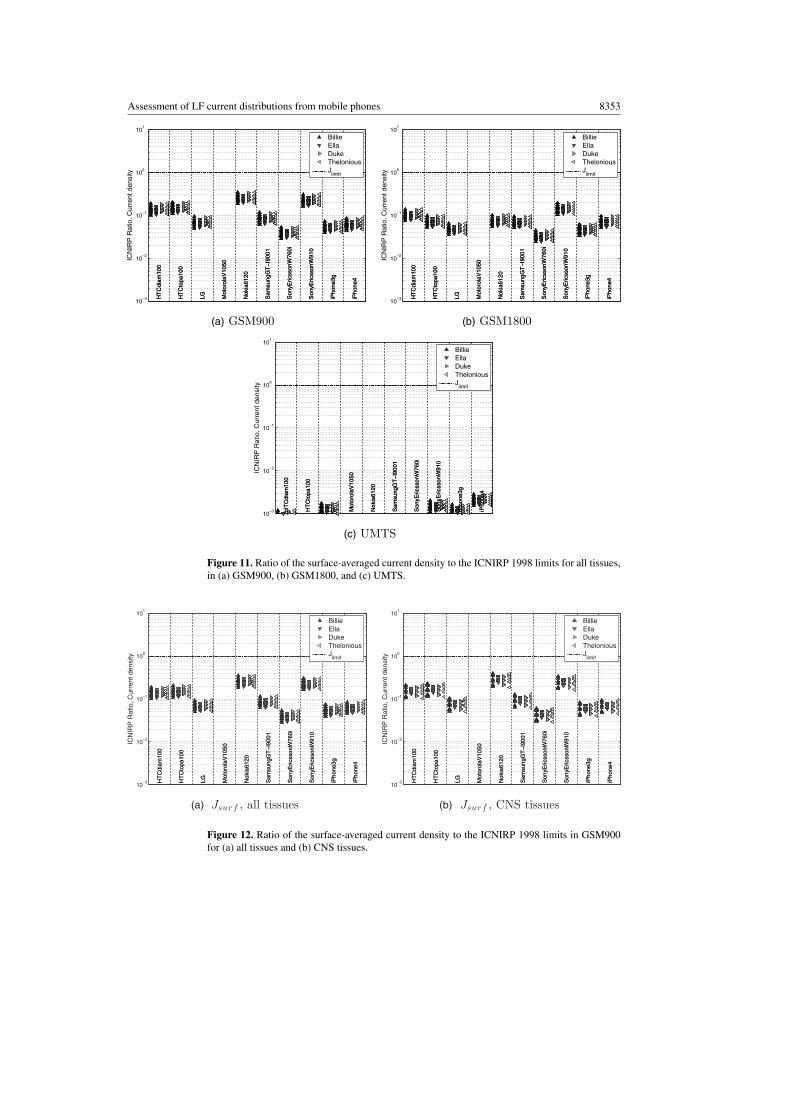
The compliance factor calculated from (3) with respect to the corresponding limit fromICNIRP or IEEE was evaluated for all averaging schemes, phones, communication systems,and anatomical heads. Figure 11(a) shows that the ratio of the surface-averaged current densitydoes not exceed 40% of the ICNIRP limit for GSM900. The spread of the values for the variouspositions of the numerical source is larger than the difference between adults and children.However, the spread of the compliance factors for any particular phone for the children is largerthan for the adults, which is expected, since a translation of 10 mm is larger in proportion tothe head size.
At GSM1800 (figure 11(b)), the distribution is similar although all the values are slightlysmaller than for GSM900. For UMTS (figure 11(c)) the maximum value is lower than forGSM by about two orders of magnitude. Only the results of GSM900 are used to compare theremaining parameters of the analysis.
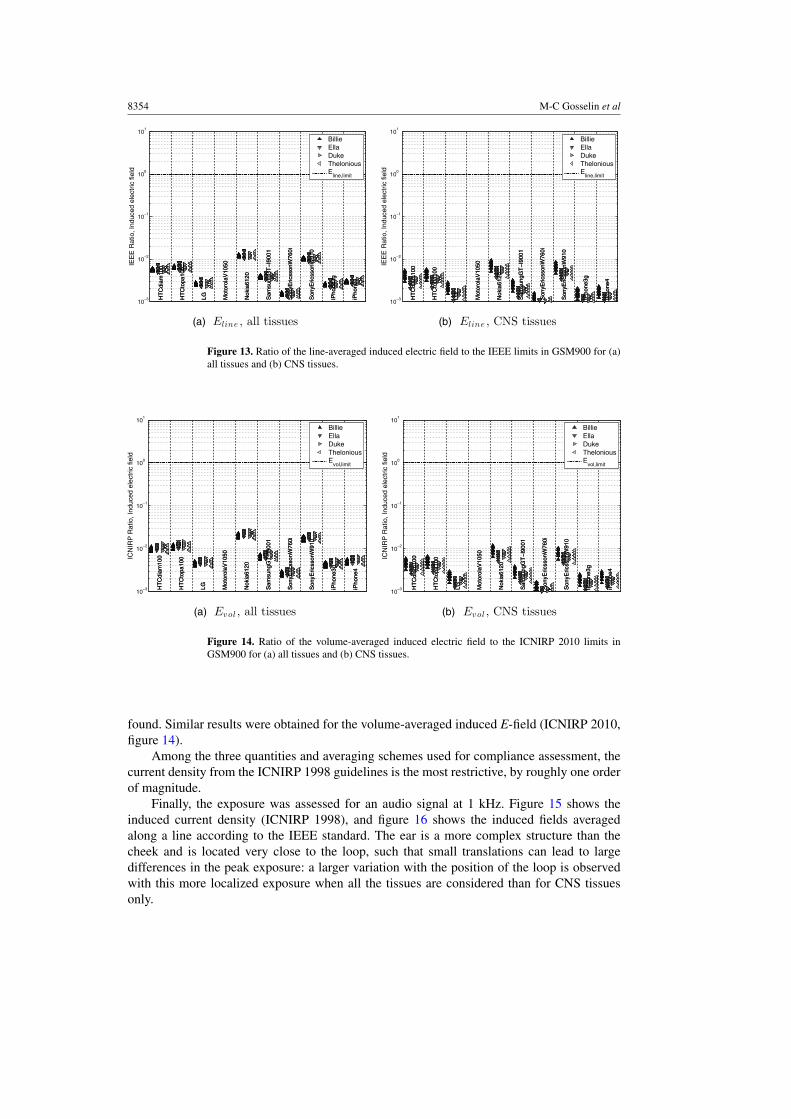
Figure 12 shows that the application of the current density limits from the ICNIRP 1998guidelines to all tissues (figure 12(a)) or to the central nervous system (CNS) tissues only(figure 12(b)) does not lead to significant differences for the type of exposure presented here.The spread of the line-averaged E-field values (figure 13, IEEE) from various positions islarger for CNS tissues than for all tissues. Indeed, the structure of the tissues around the cheekarea, where the exposure is maximum, is rather smooth, such that small translations of the looparray do not lead to very different exposure patterns; the structures of the CNS, however, aremore complex, and relatively small translations can lead to significantly different exposures.Also, as the CNS tissues do not include peripheral tissues, smaller E-field-to-limit ratios are
Assessment of LF current distributions from mobile phones 8353
HT
Cdi
am10
0
HT
Cto
pa10
0
LG Mot
orol
aV10
50
Nok
ia61
20
Sam
sung
GT
−I9
001
Son
yEric
sson
W76
0i
Son
yEric
sson
W91
0
iPho
ne3g
iPho
ne4
10−3
10−2
10−1
100
101
HT
Cdi
am10
0
HT
Cto
pa10
0
LG Mot
orol
aV10
50
Nok
ia61
20
Sam
sung
GT
−I9
001
Son
yEric
sson
W76
0i
Son
yEric
sson
W91
0
iPho
ne3g
iPho
ne4
ICN
IRP
Rat
io, C
urre
nt d
ensi
ty
BillieEllaDukeTheloniousJ
limit
(a) GSM900
HT
Cdi
am10
0
HT
Cto
pa10
0
LG Mot
orol
aV10
50
Nok
ia61
20
Sam
sung
GT
−I9
001
Son
yEric
sson
W76
0i
Son
yEric
sson
W91
0
iPho
ne3g
iPho
ne4
10−3
10−2
10−1
100
101
HT
Cdi
am10
0
HT
Cto
pa10
0
LG Mot
orol
aV10
50
Nok
ia61
20
Sam
sung
GT
−I9
001
Son
yEric
sson
W76
0i
Son
yEric
sson
W91
0
iPho
ne3g
iPho
ne4
ICN
IRP
Rat
io, C
urre
nt d
ensi
ty
BillieEllaDukeTheloniousJ
limit
(b) GSM1800
HT
Cdi
am10
0
HT
Cto
pa10
0
LG Mot
orol
aV10
50
Nok
ia61
20
Sam
sung
GT
−I9
001
Son
yEric
sson
W76
0i
Son
yEric
sson
W91
0
iPho
ne3g
iPho
ne4
10−3
10−2
10−1
100
101
HT
Cdi
am10
0
HT
Cto
pa10
0
LG Mot
orol
aV10
50
Nok
ia61
20
Sam
sung
GT
−I9
001
Son
yEric
sson
W76
0i
Son
yEric
sson
W91
0
iPho
ne3g
iPho
ne4
ICN
IRP
Rat
io, C
urre
nt d
ensi
ty
BillieEllaDukeTheloniousJ
limit
(c) UMTS
Figure 11. Ratio of the surface-averaged current density to the ICNIRP 1998 limits for all tissues,in (a) GSM900, (b) GSM1800, and (c) UMTS.
HT
Cdi
am10
0
HT
Cto
pa10
0
LG Mot
orol
aV10
50
Nok
ia61
20
Sam
sung
GT
−I9
001
Son
yEric
sson
W76
0i
Son
yEric
sson
W91
0
iPho
ne3g
iPho
ne4
10−3
10−2
10−1
100
101
HT
Cdi
am10
0
HT
Cto
pa10
0
LG Mot
orol
aV10
50
Nok
ia61
20
Sam
sung
GT
−I9
001
Son
yEric
sson
W76
0i
Son
yEric
sson
W91
0
iPho
ne3g
iPho
ne4
ICN
IRP
Rat
io, C
urre
nt d
ensi
ty
BillieEllaDukeTheloniousJ
limit
(a) Jsurf , all tissues
HT
Cdi
am10
0
HT
Cto
pa10
0
LG Mot
orol
aV10
50
Nok
ia61
20
Sam
sung
GT
−I9
001
Son
yEric
sson
W76
0i
Son
yEric
sson
W91
0
iPho
ne3g
iPho
ne4
10−3
10−2
10−1
100
101
HT
Cdi
am10
0
HT
Cto
pa10
0
LG Mot
orol
aV10
50
Nok
ia61
20
Sam
sung
GT
−I9
001
Son
yEric
sson
W76
0i
Son
yEric
sson
W91
0
iPho
ne3g
iPho
ne4
ICN
IRP
Rat
io, C
urre
nt d
ensi
ty
BillieEllaDukeTheloniousJ
limit
(b) Jsurf , CNS tissues
Figure 12. Ratio of the surface-averaged current density to the ICNIRP 1998 limits in GSM900for (a) all tissues and (b) CNS tissues.
8354 M-C Gosselin et al
HT
Cdi
am10
0
HT
Cto
pa10
0
LG Mot
orol
aV10
50
Nok
ia61
20
Sam
sung
GT
−I9
001
Son
yEric
sson
W76
0i
Son
yEric
sson
W91
0
iPho
ne3g
iPho
ne4
10−3
10−2
10−1
100
101
HT
Cdi
am10
0
HT
Cto
pa10
0
LG Mot
orol
aV10
50
Nok
ia61
20
Sam
sung
GT
−I9
001
Son
yEric
sson
W76
0i
Son
yEric
sson
W91
0
iPho
ne3g
iPho
ne4
IEE
E R
atio
, Ind
uced
ele
ctric
fiel
d
BillieEllaDukeTheloniousE
line,limit
(a) Eline , all tissues
HT
Cdi
am10
0
HT
Cto
pa10
0
LG Mot
orol
aV10
50
Nok
ia61
20
Sam
sung
GT
−I9
001
Son
yEric
sson
W76
0i
Son
yEric
sson
W91
0
iPho
ne3g
iPho
ne4
10−3
10−2
10−1
100
101
HT
Cdi
am10
0
HT
Cto
pa10
0
LG Mot
orol
aV10
50
Nok
ia61
20
Sam
sung
GT
−I9
001
Son
yEric
sson
W76
0i
Son
yEric
sson
W91
0
iPho
ne3g
iPho
ne4
IEE
E R
atio
, Ind
uced
ele
ctric
fiel
d
BillieEllaDukeTheloniousE
line,limit
(b) Eline , CNS tissues
Figure 13. Ratio of the line-averaged induced electric field to the IEEE limits in GSM900 for (a)all tissues and (b) CNS tissues.
HT
Cdi
am10
0
HT
Cto
pa10
0
LG Mot
orol
aV10
50
Nok
ia61
20
Sam
sung
GT
−I9
001
Son
yEric
sson
W76
0i
Son
yEric
sson
W91
0
iPho
ne3g
iPho
ne4
10−3
10−2
10−1
100
101
HT
Cdi
am10
0
HT
Cto
pa10
0
LG Mot
orol
aV10
50
Nok
ia61
20
Sam
sung
GT
−I9
001
Son
yEric
sson
W76
0i
Son
yEric
sson
W91
0
iPho
ne3g
iPho
ne4
ICN
IRP
Rat
io, I
nduc
ed e
lect
ric fi
eld
BillieEllaDukeTheloniousE
vol,limit
(a) Evol , all tissues
HT
Cdi
am10
0
HT
Cto
pa10
0
LG Mot
orol
aV10
50
Nok
ia61
20
Sam
sung
GT
−I9
001
Son
yEric
sson
W76
0i
Son
yEric
sson
W91
0
iPho
ne3g
iPho
ne4
10−3
10−2
10−1
100
101
HT
Cdi
am10
0
HT
Cto
pa10
0
LG Mot
orol
aV10
50
Nok
ia61
20
Sam
sung
GT
−I9
001
Son
yEric
sson
W76
0i
Son
yEric
sson
W91
0
iPho
ne3g
iPho
ne4
ICN
IRP
Rat
io, I
nduc
ed e
lect
ric fi
eld
BillieEllaDukeTheloniousE
vol,limit
(b) Evol , CNS tissues
Figure 14. Ratio of the volume-averaged induced electric field to the ICNIRP 2010 limits inGSM900 for (a) all tissues and (b) CNS tissues.
found. Similar results were obtained for the volume-averaged induced E-field (ICNIRP 2010,figure 14).
Among the three quantities and averaging schemes used for compliance assessment, thecurrent density from the ICNIRP 1998 guidelines is the most restrictive, by roughly one orderof magnitude.
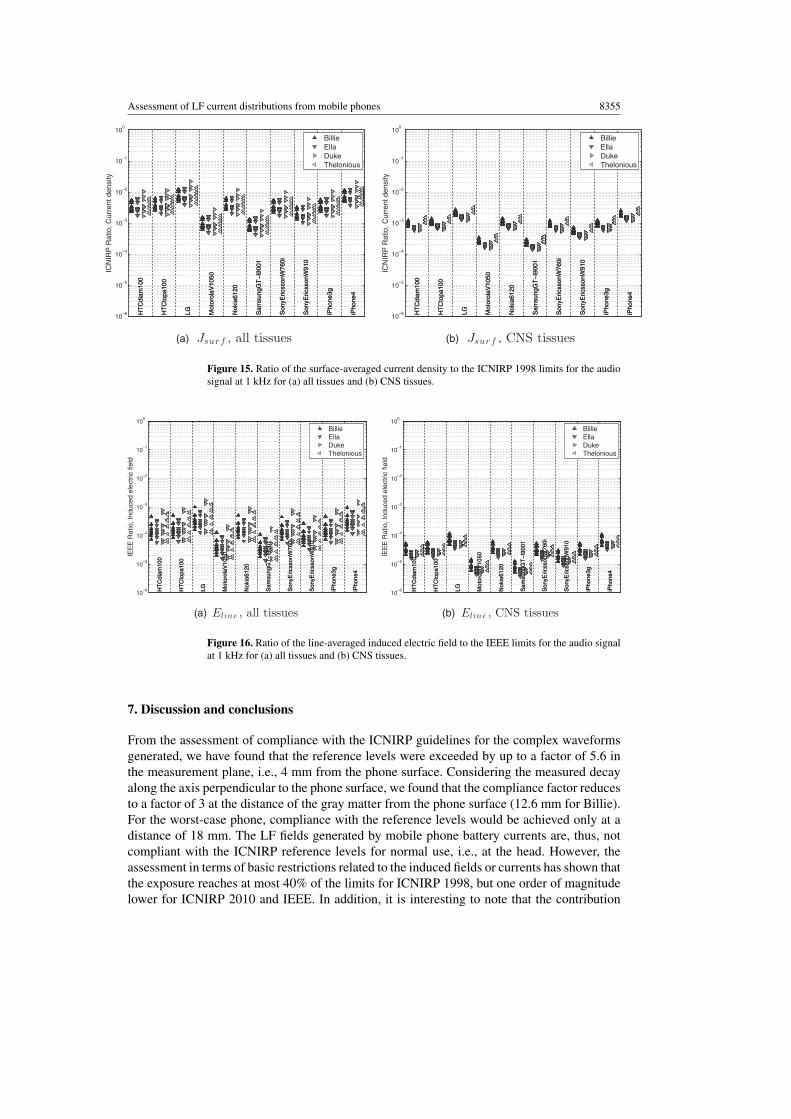
Finally, the exposure was assessed for an audio signal at 1 kHz. Figure 15 shows theinduced current density (ICNIRP 1998), and figure 16 shows the induced fields averagedalong a line according to the IEEE standard. The ear is a more complex structure than thecheek and is located very close to the loop, such that small translations can lead to largedifferences in the peak exposure: a larger variation with the position of the loop is observedwith this more localized exposure when all the tissues are considered than for CNS tissuesonly.
Assessment of LF current distributions from mobile phones 8355
HT
Cdi
am10
0
HT
Cto
pa10
0
LG Mot
orol
aV10
50
Nok
ia61
20
Sam
sung
GT
−I9
001
Son
yEric
sson
W76
0i
Son
yEric
sson
W91
0
iPho
ne3g
iPho
ne4
10−6
10−5
10−4
10−3
10−2
10−1
100
HT
Cdi
am10
0
HT
Cto
pa10
0
LG Mot
orol
aV10
50
Nok
ia61
20
Sam
sung
GT
−I9
001
Son
yEric
sson
W76
0i
Son
yEric
sson
W91
0
iPho
ne3g
iPho
ne4
ICN
IRP
Rat
io, C
urre
nt d
ensi
ty
BillieEllaDukeThelonious
(a) Jsurf , all tissues
HT
Cdi
am10
0
HT
Cto
pa10
0
LG Mot
orol
aV10
50
Nok
ia61
20
Sam
sung
GT
−I9
001
Son
yEric
sson
W76
0i
Son
yEric
sson
W91
0
iPho
ne3g
iPho
ne4
10−6
10−5
10−4
10−3
10−2
10−1
100
HT
Cdi
am10
0
HT
Cto
pa10
0
LG Mot
orol
aV10
50
Nok
ia61
20
Sam
sung
GT
−I9
001
Son
yEric
sson
W76
0i
Son
yEric
sson
W91
0
iPho
ne3g
iPho
ne4
ICN
IRP
Rat
io, C
urre
nt d
ensi
ty
BillieEllaDukeThelonious
(b) Jsurf , CNS tissues
Figure 15. Ratio of the surface-averaged current density to the ICNIRP 1998 limits for the audiosignal at 1 kHz for (a) all tissues and (b) CNS tissues.
HT
Cdi
am10
0
HT
Cto
pa10
0
LG Mot
orol
aV10
50
Nok
ia61
20
Sam
sung
GT
−I9
001
Son
yEric
sson
W76
0i
Son
yEric
sson
W91
0
iPho
ne3g
iPho
ne4
10−6
10−5
10−4
10−3
10−2
10−1
100
HT
Cdi
am10
0
HT
Cto
pa10
0
LG Mot
orol
aV10
50
Nok
ia61
20
Sam
sung
GT
−I9
001
Son
yEric
sson
W76
0i
Son
yEric
sson
W91
0
iPho
ne3g
iPho
ne4
IEE
E R
atio
, Ind
uced
ele
ctric
fiel
d
BillieEllaDukeThelonious
(a) Eline , all tissues
HT
Cdi
am10
0
HT
Cto
pa10
0
LG Mot
orol
aV10
50
Nok
ia61
20
Sam
sung
GT
−I9
001
Son
yEric
sson
W76
0i
Son
yEric
sson
W91
0
iPho
ne3g
iPho
ne4
10−6
10−5
10−4
10−3
10−2
10−1
100
HT
Cdi
am10
0
HT
Cto
pa10
0
LG Mot
orol
aV10
50
Nok
ia61
20
Sam
sung
GT
−I9
001
Son
yEric
sson
W76
0i
Son
yEric
sson
W91
0
iPho
ne3g
iPho
ne4
IEE
E R
atio
, Ind
uced
ele
ctric
fiel
d
BillieEllaDukeThelonious
(b) Eline , CNS tissues
Figure 16. Ratio of the line-averaged induced electric field to the IEEE limits for the audio signalat 1 kHz for (a) all tissues and (b) CNS tissues.
7. Discussion and conclusions
From the assessment of compliance with the ICNIRP guidelines for the complex waveformsgenerated, we have found that the reference levels were exceeded by up to a factor of 5.6 inthe measurement plane, i.e., 4 mm from the phone surface. Considering the measured decayalong the axis perpendicular to the phone surface, we found that the compliance factor reducesto a factor of 3 at the distance of the gray matter from the phone surface (12.6 mm for Billie).For the worst-case phone, compliance with the reference levels would be achieved only at adistance of 18 mm. The LF fields generated by mobile phone battery currents are, thus, notcompliant with the ICNIRP reference levels for normal use, i.e., at the head. However, theassessment in terms of basic restrictions related to the induced fields or currents has shown thatthe exposure reaches at most 40% of the limits for ICNIRP 1998, but one order of magnitudelower for ICNIRP 2010 and IEEE. In addition, it is interesting to note that the contribution
8356 M-C Gosselin et al
from the audio signal at a normal speech level, i.e., −16 dBm0, is the same order of magnitudeas the fields induced by the current bursts generated from the implementation of the globalsystem for mobile (GSM) communication system.
The current-induced B-field generated from the communication system via the UMTSare two orders of magnitude lower than via GSM, which disproves the hypothesis that higherlow-frequency (LF) fields are generated with the UMTS due to the high current consumptionof the complex processing circuitry. This finding provides useful information regarding LFfields generated during UMTS use, and, together with the knowledge that RF exposure fromthe UMTS is two orders of magnitude lower than from GSM, we may now state that there isan overall reduction in the average exposure when this communication system is used.
Open questions remain, e.g., related to the use of UMTS-TDD, which could lead todifferent results. We did not consider UMTS-TDD in this project, as the devices used donot support this technology. In addition, TDD is intended mainly for data transfer, where theexposure at the head is not a main concern other than for voice over Internet protocols (VoIP).Further studies should include UMTS-TDD in the context of VoIP as well as very recentcommunications technologies such as TD-SCDMA, LTE for VoIP, and EV-DO (an extensionof CDMA2000) for VoIP.
Finally, the power control scheme in GSM based on hard handovers could lead toadditional LF components in the spectrum, but these would be dependent on the networkand the movements of the user holding the mobile device. These components are expected tocarry much less energy than those related to the time-frame structure of the communicationsystem.
Acknowledgments
This research project was financed by the FSM (Research Foundation Mobile Communication).Marie-Christine Gosselin is a NSERC (Natural Sciences and Engineering Research Councilof Canada) grant holder.
References
3GPP 1999 Digital cellular telecommunications system (phase 2+): radio transmission and reception 3GPP TS 05.05version 8.6.0, release 1999
3GPP 2002 UE Radio transmission and reception (FDD) 3GPP TS 25.101 version 5.2.2, release 5Andersen J B, Mogensen P E and Pedersen G F 2010 Power variations of wireless communication systems
Bioelectromagnetics 31 302–10 (www.ncbi.nlm.nih.gov/ pubmed/20112260)Andersen J B and Pedersen G F 1997 Radiat. Prot. Dosim. 72 249–57ANSI 2007 American National Standards methods of measurement of compatibility between wireless communications
devices and hearing aids ANSI C63.19-2007 (New York The American National Standards Institute) pp 1–145Bakker J F, Paulides M M, Neufeld E, Christ A, Chen X L, Kuster N and van Rhoon G C 2012 Children and adults
exposed to low-frequency magnetic fields at the ICNIRP reference levels: theoretical assessment of the inducedelectric fields Phys. Med. Biol. 57 1815–29
Chen X L, Benkler S, Chavannes N, De Santis V, Bakker J, van Rhoon G, Mosig J and Kuster N 2013 Analysis ofhuman brain exposure to low-frequency magnetic fields: a numerical assessment of spatially averaged electricfields and exposure limits Bioelectromagnetics 34 375–84
Christ A et al 2010 The virtual family – development of surface-based anatomical models of two adults and twochildren for dosimetric simulations Phys. Med. Biol. 55 N23–38
De Santis V, Douglas M, Nadakuduti J, Benkler S and Kuster N 2012b Exposure evaluation of therapeutic magneticfield mats Technical Report BAG 11.002460/434.0000/-99 (Zurich: ITIS Foundation)
De Santis V, Douglas M, Kuster N and Chen X L 2012a EMC EUROPE’12: Int. Symp. on ElectromagneticCompatibility pp 1–4
Assessment of LF current distributions from mobile phones 8357
Dimbylow P 2005 Development of the female voxel phantom, NAOMI, and its application to calculations ofinduced current densities and electric fields from applied low frequency magnetic and electric fields Phys.Med. Biol. 50 1047–70
Gabriel C, Peyman A and Grant E 2009 Electrical conductivity of tissue at frequencies below 1 MHz Phys. Med.Biol. 54 4863–78
Gabriel S, Lau R W and Gabriel C 1996a The dielectric properties of biological tissues: II. Measurements in thefrequency range 10 Hz to 20 GHz Phys. Med. Biol. 41 2251–69
Gabriel S, Lau R W and Gabriel C 1996b The dielectric properties of biological tissues: III. Parametric models forthe dielectric spectrum of tissues Phys. Med. Biol. 41 2271–93
Gosselin M C, Kuhn S, Crespo-Valero P, Cherubini E, Zefferer M, Christ A and Kuster N 2011 Estimation ofhead tissue-specific exposure from mobile phones based on measurements in the homogeneous SAM headBioelectromagnetics 32 493–505
Hasgall P, Neufeld E, Gosselin M C, Klingenbock A and Kuster N 2011 Thermal and electromagnetic parametersof biological tissues ITIS database (Reston, VA: Integrated Taxonomic Information System) available atwww.itis.ethz.ch/database
ICNIRP 1998 Guidelines for limiting exposure to time-varying electric, magnetic, and electromagnetic fields (up to300 GHz) Health Phys. 74 494–522
ICNIRP 2003 Guidance on determining compliance of exposure to pulsed and complex non-sinusoidal waveformsbelow 100 kHz with ICNIRP guidelines Health Phys. 84 383–7
ICNIRP 2010 Guidelines for limiting exposure to time-varying electric and magnetic fields (1 Hz to 100 kHz) HealthPhys. 99 818–36
IEEE 2002 IEEE Standard for Safety Levels with Respect to Human Exposure to Electromagnetic Fields 0–3 kHzIEEE Std C95.6-2002 (New York: IEEE)
Ilvonen S and Sarvas J 2007 Magnetic-field-induced ELF currents in a human body by the use of a GSM phone IEEETrans. Electromagn. Compat. 49 294–301
Ilvonen S, Sihvonen A P, Karkkainen K and Sarvas J 2005 Numerical assessment of induced ELF currents in thehuman head due to the battery current of a digital mobile phone Bioelectromagnetics 26 648–56
Jokela K, Puranen L and Sihvonen A P 2004 Assessment of the magnetic field exposure due to the battery current ofdigital mobile phones Health Phys. 86 56–66
Kainz W, Christ A, Kellom T, Seidman S, Nikoloski N, Beard B and Kuster N 2005 Dosimetric comparison of thespecific anthropomorphic mannequin (SAM) to 14 anatomical head models using a novel definition for themobile phone positioning Phys. Med. Biol. 50 3423–45
Kannala S, Toivo T, Alanko T and Jokela K 2009 Occupational exposure measurements of static and pulsed gradientmagnetic fields in the vicinity of MRI scanners Phys. Med. Biol. 54 2243–57
Kuehn S and Kuster N 2013 Field evaluation of the human exposure from multiband, multisystem mobile phonesIEEE Trans. Electromagn. Compat. 55 275–87
Laakso I and Hirata A 2012 Reducing the staircasing error in computational dosimetry of low-frequencyelectromagnetic fields Phys. Med. Biol. 57 N25–34 www.ncbi.nlm.nih.gov/pubmed/22290579
Nadakuduti J, Douglas M, Capstick M, Kuhn S and Kuster N 2012 Application of an induced field sensor forassessment of electromagnetic exposure from compact fluorescent lamps Bioelectromagnetics 33 166–75
Pedersen G F and Andersen J B 1999 RF and ELF exposures from cellular phone handsets: TDMA and CDMAsystems Radiat. Prot. Dosim. 83 131–8 http://rpd.oxfordjournals.org/ content/83/1-2/131.short
Perentos N, Iskra S, McKenzie R J and Cosic I 2007 Characterization of pulsed ELF magnetic fields generated byGSM mobile phone handsets IFMBE Proc. 14 2706–9
Perentos N, Iskra S, McKenzie R J and Cosic I 2008 Simulation of pulsed ELF magnetic fields generated by GSMmobile phone handsets for human electromagnetic bioeffects research Australas. Phys. Eng. Sci. Med. 31 235–42
Raicu V, Kitagawa N and Irimajiri A 2000 A quantitative approach to the dielectric properties of the skin Phys. Med.Biol. 45 L1–4
Tuor M, Ebert S, Schuderer J and Kuster N 2005 Assessment of ELF exposure from GSM handsets and developmentof an optimized RF/ELF exposure setup for studies of human volunteers Technical Report BAG 2.23.02.-18/02.001778 (Zurich: ITIS Foundation)
Varsier N, Wake K, Taki M, Watanabe S, Takebayashi T, Yamaguchi N and Kikuchi Y 2008 SAR characterizationinside intracranial tumors for case-control epidemiological studies on cellular phones and RF exposure Ann.Telecommun. 63 65–78
Wiart J, Dale C, Bosisio A V and Le Cornec A 2000 Analysis of the influence of the power control and discontinuoustransmission on RF exposure with GSM mobile phones IEEE Trans. Electromagn. Compat. 42 376–85