Embed Size (px)
Citation preview

lable at ScienceDirect
Energy 171 (2019) 77e94
Contents lists avai
Energy
journal homepage: www.elsevier .com/locate/energy
Experimental and CFD validation of the thermal performance of acryogenic batch freezer with the effect of loading
Amisha Chauhan a, Jon Trembley b, Luiz C. Wrobel a, Hussam Jouhara a, *
a ICollege of Engineering, Design and Physical Sciences, Brunel University London, Uxbridge, UB8 3PH, UKb Air Products PLC, Hersham Place Technology Park, Molesey Road, Surrey, KT12 4RZ, UK
a r t i c l e i n f o
Article history:Received 17 September 2018Received in revised form14 December 2018Accepted 19 December 2018Available online 20 December 2018
Keywords:CFDCryogenic storageExperimental analysisBatch freezer
* Corresponding author.E-mail address: [email protected] (H.
https://doi.org/10.1016/j.energy.2018.12.1490360-5442/© 2018 Elsevier Ltd. All rights reserved.
a b s t r a c t
Cryogenic freezing systems are used in many industries to preserve food and cell cultures. The freezingmethods adopted involve multiple systems to preserve cultures, with many freezing systems using aselection of direct freezing and long-term storage allowing mass and time-efficient freezing methods.However, risks associated with direct freezing using liquid nitrogen can cause cell degradation andcrystallisation. This study will focus on the implementation of a batch freezer, using liquid nitrogensprays to freeze products. The effectiveness of the freezing process will be investigated experimentallyfor an array of operating conditions. Using numerical methods, additional loading configurations andoperation temperatures were also studied to characterise the freezing profile of the system.
© 2018 Elsevier Ltd. All rights reserved.
1. Introduction
The principle of cryogenic preservation can be used in manyapplications, ranging from food preservation to biological preser-vationwith the use of cryogenic and low temperature systems usedto cooling systems; The cryogenic preservation of biological cul-tures aims to effectively freeze samples with minimal variance insurface temperature, and with minimal changes in biologicalcomposition with a focus on energy efficient systems [1e4]. Thepurpose of this study is to investigate and reflect on the thermalperformance on the innovative batch freezer system for the storageof biological substances. The use of effective freezing and storage ofbiological substances has led to samples such as blood and bonemarrow being used years after freezing with minimal changes intheir biological composition. However, some issues prevail in foodpreservation with large variations occurring due to insufficientrecirculation zones, lowering the heat transfer coefficient in thearea, and the production of ice crystals [5,6]. The production of icecrystals lowers the food quality of produce [7,8], similarly to bio-logical cultures. Conventional studies of the insulative properties ofpackaging involve the observation of temperature variances [9].The insulative properties of the air layers existing between the
Jouhara).
packaging and product are difficult to determine experimentally.Throughout the application of cryopreservation, a number of pre-treatments have been explored. Rooni et al. [10] investigated pre-treatment of lingocellulosic materials by using a thermobox andhydrolysis. The study considers a water based pre-treatment tomaximise the production of ethanol during fermentation. Similarly,the use of cryogenics has been used in multiple cooling operationssuch as PV/T cooling [11]and milk chilling units [12,13]with thecombination between cryogenics and renewables beinginvestigated.
A large number of CFD simulations exist to study these insu-lative properties. The majority of studies carried out so far involvethe preservation of solid structures and cultures, with successwhen shafts and porous materials are used. The methods of storingsolids are vastly different to that of liquids. The principle of pre-serving liquids has been observed in the preservation of fruit pulp.Reno et al. [14] investigated the storage of liquids using a freezertunnel, with pulp being contained in metal drums and boxes. Thestorage containers proved to have effective freezing properties dueto the high thermal conductivity of the metal container. Previousstudies by Becker and Fricke [15] highlighted the significantdecrease in heat transfer with the addition of packaging. Zhao et al.[16] investigated the effects of packaging through CFD simulations,which were conducted with an air cooling process with the addi-tion of forced convection. The study highlighted the temperaturedistribution between packaged strawberries with the influence of

A. Chauhan et al. / Energy 171 (2019) 77e9478
open and closed containers. Further investigations from Alvarezet al. [17] highlighted the influence of product placement andpackaging, which can lead to a high variance in temperaturesthroughout the whole system due to the increased thermal resis-tance. The study suggests the addition of vents in packaging forfood storagedalthough this is not viable for biological preserva-tion. Similar works into frost formation with the observation intemperature fluctuations were conducted by Urquiola et al. [18].The study suggests that the current preservation of vegetables us-ing air leads to a deteriorating product quality at both microscopicand macroscopic scales. The research employs CFD simulations topredict airflow for vegetable storagewith variations in heat transferand frost formation. The simulation is based on a 2D schematic dueto the geometry of the sliced carrots, with observation of thechange in surface temperature. The study itself verifies the accuracyof CFD modelling to determine effective freezing patterns. The useof simulation work is evident when predicting freezing patterns.The most common turbulence models have been simulated forfreezing applications. Hu and Sun [19] compared three variations ofthe k-epsilon model in an industrial food application to observe themost accurate model. The simulation was conducted on an air blastchiller operating at a set point temperature and set airflow speed.The study also observed any weight and moisture loss experiencedduring the air blast freezing process. The study reflects the under-prediction of the heat transfer coefficient with LRN turbulencemodels but robust results with both the RNG and standard k-epsilonmodels accurately predicting the localised heat transfer coefficient.
The process of freezing itself is a vast topic with many availableoperations such as blast freezing [20], spray freezing [21], immer-sion freezing [22], and plate freezing [23] being the mostcommonly used both in cryogenic and mechanical freezing, witheach method using a wide range of preservation fluids such as re-frigerants, air, carbon dioxide, gaseous and liquid forms of nitrogen.Gaseous and liquid forms of nitrogen are the most common cryo-genic fluids used in preservation systems. Although batch freezingis commonly achieved with cooling and the principles of forcedconvectionwith the installation of a fan, a large amount of varianceoccurs. The variance in heat transfer coefficient is due to irregularsample shapes and inefficient storage methods, the most commonstorage methods being air blast freezers with immersion freezing.To aid blast freezing, a blanching stage may be present before theblast freezing stage. Xin et al. [24] investigated the use of blanchingpre-treatments on fresh fruits before high pressure freezing tech-niques, although the majority of crystals forming on the productwas significantly reduced [25,26] with an even product tempera-ture. The techniques for blanching used in multiple studies with acombination of freezing systems, but the scale up of such a tech-nology remains the main issue, alongside operational costs [20,27].To maximise the economic implementation of cryogenic systemsthe waste heat recovery of cold temperature exhausts by usingthermo-electric modules [28,29]. The same technology has beenimplemented in LNG vaporisers [30]. The capture of latent heat hasbeen investigated with phase change materials to monitor thechange in microcapsules but the scalability of the technology forlarge biological substances seems unlikely due to the sensitivity ofcells with nanoparticles and the associated safety risks [31]. Simi-larly, the economic use of cryogenics has been implemented withincascade refrigeration systems allowing for an effective refrigerantloop allowing the nitrogen to be separated from liquefied naturalgas without the traditional intensive energy processes. The increasepossibility of extracted nitrogen can be further implemented inliquidation units for other cryogenic applications. The possibility oflocalised generation units has been investigated by Ahmad et al.[32] for the implementation of a cryogenic heat exchanger to pro-vide cooling, but the feasibility and application of large-scale
remote within the food preservation industry is yet to beexplored due to the masses of space needed for storage tanks forliquid nitrogen, air and the heat exchanger itself.
Rodezno et al. [33] investigated the heat transfer coefficient ofcatfish fillets with a blast freezing technique using two cryogenicfluidsdliquid Carbon Dioxide and air. The results highlighted theincreased heat transfer rate and energy rate of a cryogenic system,in comparison to an air-cooled system. The results also highlightedthe direct relation between freezing time and the deterioration ofquality with a prolonged freezing time. The results reflect that air-cooled systems have a higher moisture content rate in producecompared to a cryogenically cooled system, with the quality furtherdeteriorating in the product storage life span. The process of gas-based blast system is used in large scale systems for the storageof meat carcasses. Hu and Sun [34] conducted a CFD simulation ofan air blast freezing method on a large piece of ham. The simulationwas based on the air cooling method, but highlights the air andtemperature distributions around the freezer. The simulationdetermined the mass transfer with the consideration of evapora-tion and condensation of water crystals. Although the simulation isonly based on the heat transfer between meat and air, visualisationallows the identification of low heat transfer zones, which canfurther identify areas of crystallisation and increased moisturecontent. Similar results are shown by Issa and Lawrence [35] duringthe experimental heat transfer study of beef carcasses by mistsprays. The experiment involved spraying a cooled air and watersuspension onto the carcass. Similarly to Rodezno et al. [33], themoisture content was observed. The freezing time was shown to beconsiderably larger, with an overall freezing time of 20.9 h. Due tothe large scale and complex geometry of the produce, the process ofachieving a uniform heat transfer is increasingly difficult [36]. Goralet Kluza [37] investigated the heat transfer coefficient of vegetableswith impingement freezing using air to reach a temperatureof�40 �C; similarly as experienced withmany air blast systems, theoperation of an impingement system is highly dependent on thenozzle type and spray pattern. One of the major observationsaround an impingement system is the difficulty to maintain auniform velocity around the product specimen, thus causing vari-ations of the heat transfer coefficient throughout the product. Withproduct temperature being one of the key concerns with cryogenicfreezing, a series of heat transfer coefficient collection methodshave been employed to monitor localised changes in surface tem-perature. The collection methods employed by Goral and Kluzainvolved a developed flux sensor with a combination of thermo-conductive silicon paste. Amarante and Lanoiselle [38] investigatedindustrial methods for obtaining the heat transfer coefficient,allowing a localised surface heat transfer coefficient to be calcu-lated. The experimental procedure involved a PVC disc with surfacethermocouples installed throughout the thickness of the disc butalso two heat flux sensors accounting for conductive and convec-tive thermal effects. Amarante et al. [39] further developed thecollection method by implementing flux meters. The principlessurrounding the measurement of flux sensors for this particularstudy involved a series of thermocouples placed within a copperdisc set in PVC. Such methods were validated further by Amaranteand Lanoiselle [38], with the application of heat flux sensors withinindustrial freezing equipment to map freezing profiles and pro-cesses. The findings of heat transfer coefficient measurement sys-tems reflected areas of insufficient heat transfer alongside theimportance of varying refrigerant fluid temperature. Fricke andBecker [40] further developed semi-empirical expressions bydeveloping semi empirical correlations regarding size and shape ofthe samples used to aid freezing predictions for numericalsimulations.
Meziani [41] investigated the preservation of yeast cultures in

A. Chauhan et al. / Energy 171 (2019) 77e94 79
dough, and the resulting fermentation process. The processinvolved an air freezing method being used in combination withliquid nitrogen immersion freezing. The air blast temperaturehighlighted a significantly long freezing time of over 4 h, whereasthe utilisation of liquid nitrogen managed to freeze the produce inless than 15min. The results highlighted the maintained glutenintegrity with immersion freezing, but significantly reduced theyeast population due to cell damage and the subsequent decreasedcarbon dioxide production. The preservation of cells has beeninvestigated with singular air blast freezers. The technique proveduseful for preventing the potential of cell damage through crys-tallisation experienced through immersion freezing. Volkert et al.[42] investigated the process of cell preservationdin particular thepreservation of bacteria. The experimental study involved sprayingair directly onto a petri dish at �30 �C. The study presented thepotential of using a singular freezing method without damagingcell cultures and fast freezing without immersion freezing. Theutilisation of two different freezing methods is evident from thepreservation of cell cultures to the preservation of food [22,43]. Asimilar principle is adopted in the earlier works of cryo-mechanicalfreezing. Agnelli and Mascheroni [44] adopted a similar principle tofreeze a variety of foodstuff. The method used involved the directcontact of liquid nitrogen through immersion freezing. Immersionand conventional freezing methods are commonly used inconjunction with each other due to the fast freezing of one tech-nology and the stability of the other. Earlier works [45] investigatedthe heat transfer effectiveness of the technology, highlighting thehigh heat transfer rate of cryogenic freezing, and suggest that thecombination of both technologies is the best storage method.However, in comparison with modern freezing methods, thechange in technology is minimal. The improvement of the tech-nology is based on the improvement of mechanical parts ratherthan the freezing method. Individual spray-related systems func-tion on air but with prolonged and inefficient freezing times. Thethermal effects of immersion freezing are highly noted in theliterature, but the process itself can lead to high levels of crystal-lisation as a compromise to fast freezing. The application of hybridblast freezers exist, with air being mixed with liquid nitrogen [46]but a fully cryogenic-based freezer has not been developed. Theapplication of cryogenic fluids for freezing has been used in im-mersion freezing with fluids ranging from liquid carbon dioxide[47] and liquid nitrogen but a fully cryogenic blast freezing optionhas not been developed. Gazda [46] investigated the effects of ahybrid system in comparison to an air blast system; the overallexergy of the hybrid model is significantly higher than the con-ventional method. The findings presented highlight the potential ofhaving one freezing and storage method, and the potential to findan optimum freezing strategy. The findings predict the potentialincrease in hybrid and fully cryogenic blast methods of freezing.Similarly, the use of injection-based technologies is difficult topredict due to the droplet size, fluid properties, injection type andassociated changes in heat transfer. Multiple studies have beenconducted on impinging jets in both mechanical and cryogenicfreezing applications. Awonorin [48] effectively investigated theheat transfer properties of liquid nitrogen droplets for freezinggelatine bricks but due to the complexities of industrial models andexternal influences, further predictions about freezing patternshave not been produced. The selection of freezing techniques isdependent on a multitude of factors such as desired freezing time,geometry and the produce, size and economic limitations. Table 1summarises the applicability of different freezing technologies.
In the present work, the proposed preservation method utilisesthe thermal potential of liquid nitrogenwith the technology behindair blast freezing, allowing for a hybrid system. The preservationwill be of glycerine-filled blood bags, with a proposed storage
method investigating the effect of stacking. The freezing process ofbiochemical substances has not been widely simulated due to thelevel of complexities existing within the mixture, and the lack ofthermal properties available. In this work, the associated change inproduct core temperature due to shelf loading conditions, productconfiguration and thermal profiles will be investigated. The resultsreflect the applicability and effectiveness of such preservationtechnologies. The investigation is based on two conditions: thedetermination of the heat transfer coefficient and the performanceof the system. Both sets of data will reflect the cooling rate of thechamber but also the effectiveness of processing biological culturesin a continuous operation.
2. Experimental apparatus
There are many experimental freezing methods currentlyavailable, ranging from blast freezers to immersion freezing, allutilising different heat transfer mechanisms to effectively freezeand provide effective storage for produce. The freezer used for theexperimental observation is a lab scale batch freezer. The operationof the freezer is based on the premise of direct injection of liquidnitrogen into the fan, which distributes cold nitrogen gas aroundthe freezer chamber. The distribution of cold air is conducted usingan axial fan, which will distribute cold air to all three shelves andthe products placed. The dimensions of the stainless-steel chamberare: 65� 50� 50 cm with a volume of 0.16m3. Fig. 1a shows theschematic of the system as an electronic drawing. A schematic ofthe freezer is shown in Fig. 1b, alongside the loading conditions andplacement of the blood bags. The heat transfer coefficient will beconducted on each shelving level and in left right and centre po-sitions as defined in section 3.4.
The operation of the lab scale freezer is based on the principlesof forced convection; the activation of the fan will manuallydistribute the cold gas around the freezer at relatively high veloc-ities to induce freezing. The increase of fan frequency will increasethe effects of forced convection resulting in a more uniform heattransfer in a short operating time. Factors such as stacking andpositioning also play a key role in the heat transfer mechanism, aspreviously noted in the literature [36,37]. The stacking location forthe batch freezer needs to be loaded in a specific way, the gapbetween the air and product needs to be 50% of the product depthto allow effective air circulation. A recommended value of 70mmbetween blood bags is advised during stack loading.
3. Experimental procedure
3.1. Temperature monitoring
To characterise the thermal performance of the system, 10 T-type thermocouples were placed inside the blood bags to monitorthe changes of the core temperature. 1 Thermocouple were alsoplaced within the freezer monitoring changes in air temperature.The lab scale freezer itself also contains a probe providing livemonitoring.
3.2. Velocity reading
Due to the thermal restrictions of anemometers, a series of ve-locity readings were conducted using a pre-calibrated conventionalhandheld anemometer (Testo 425). The velocity readings weremapped at �10 �C at a steady point temperature via an integratedautomatic control system. The readings were conducted at fanspeeds of 285RPM and 1995RPM. The positions of velocity readingsare shown in Fig. 2a and b.

Table 1Comparative table of freezing techniques.
PreservationMethod
ProcessLoad
System Operation System Drawbacks System Advantages
ImmersionFreezing[22,47,49,50]
Batch Products are placed within a porous bag and immersed within afluid. The fluid is a compatible refrigerant or freezing fluid.
� Potential for crosscontamination
� Large system footprint� Limited amount of bio-
compatible immersion fluids� Dated preservation technology� Potential for crystallisation and
cellular level damage
� Allows for continuous systemfreezing processes
� Quick freezing time� Minimal down time
Plate freezing[23,38,51e54]
Batch Products are arranged in-between two freezing plates; the platescontain a cooling coil. When in contact with product, the coilcools the plate via conduction.
� Inconsistent producttemperature
� Inconsistent freezing patternswhich is dependent on theplacement of sensors
� Significant amount ofmaintenance time required
� Unsuitable for continuousoperation
� Cost effective systems� Small footprint� Maximises available volume of the
system� Vast amount of compatible and
available refrigerants� Minimal risk of cross contamination
InjectionFreezing[21,55e59]
Continuous Product is loaded into a system where a jet of cryogenic fluid issprayed. Typically, this is on a continuous bed to achieve massamounts of freezing in a short amount of time
� High rate of refrigerantconsumption
� Direct contact with cryogenicfluid creates high levels ofcrystallisation
� Suitable for continuous freezing andoperation.
� Allows for mass production
IndividualQuickFreezing[24,60e63]
Singular Single product is placed within chamber space where a cryogenicfluid is sprayed directly onto the product.
� Ineffective for mass productiondue to large processing time
� Irreversible damage to cells dueto multiple cell types withinone system
� Efficient thawing processcurrently unavailable
� Uneconomical for smallproducts
� Cannot be used for foodprocessing due to the highlevel of cellular damage
� Suitable for large complex productssuch as carcasses and livestock
� Quick freezing and processing time� Can be applied for medical
applications where aesthetic is notthe main concern
ConventionalSlowFreezing[31,61,64e66]
Batch Commonly used in hybrid systems where items are quicklyfrozen and then placed within slow freezing using conventionalfreezers.
� Prolonged freezing time� Cannot be used for mass
freezing production� Commonly used within hybrid
systems for storage.
� Ideal of storage solutions� Components readily available� Suitable for continuous use� Cost Effective
IsochoricFreezing [67e71]
Batch Products are lowered into a pressurised vessel containingsolution that is of equal osmotic concentration than the sample.The product is brought to a thermal equilibrium between waterand ice formation within the cells.
� Unsuitable for long termstorage
� Relatively new technology,potential for scale up poses tobe a problem
� Unknown processing functions,capabilities for continuousprocessing is currentlyunknown.
� Preserves cell quality by preventingosmotic changes occurring duringconventional freezing techniques.
� Emerging freezing technology
Fig. 1. a: 3D Render of Batch Freezer (b) Lab scale set up of Batch Freezer.
Fig. 2. a Velocity measurement schematic (empty) (b) Velocity measurement sche-matic (fully loaded).
A. Chauhan et al. / Energy 171 (2019) 77e9480
3.3. Blood bag positioning
The positioning of blood bags is shown in Fig. 2b. They areplaced in single and double stack configurations. To ensure uni-formity across all the blood bags, the specimens are conventionalblood transfusion bags with identical dimensions and a 600mllimit. The blood bags have been filled with water and glycerine,with a ratio of 9:1 respectively.
3.4. Heat transfer coefficient observation
The heat transfer coefficient was measured with a heated cop-per disc and monitoring the cooling rate of the freezer system as

A. Chauhan et al. / Energy 171 (2019) 77e94 81
shown in Fig. 3. The heat transfer coefficient study acted as abaseline and was conducted with an unloaded configuration. Theheat transfer coefficient can be calculated by:
h ¼m � Cp �
�DTDt
�
A � DT (1)
where:
h is the mean heat transfer coefficient (W/(m2.�C))A is the surface area of the copper disc (m2)DT is the temperature difference between the mean producttemperature during the freezing process and the freezer's airtemperature (�C)m: mass (kg)Cp: Specific heat (J/(kg.�C))DT: Difference in disc temperature (�C)Dt : Difference in time (s)
The procedure involves the heating of copper discs, containing athermocouple to monitor and record their cooling rate. The discsare placed within a pre-defined temperature water bath to heatthem up to 80 �C. The temperature of the discs is kept constant. Theplacement and use of the copper discs are dependent on the setpoint temperature of the freezing system. The system will aim toreach the set point temperature and allowing for a period of steadystate operation. The heated copper burgers are placed within thesystem and allowed to cool to observe the cooling rate of the sys-tem. The obtained data allows us to estimate an average heattransfer coefficient.
4. CFD model
Computational Fluid Dynamics (CFD) is an increasingly utilisedtechnology which determines a fluid flow field by solving thegoverning flow equations, i.e. momentum, continuity and energyequations as highlighted below:
Conservation of Mass:
vUi
vxi¼ 0 (2)
Fig. 3. Experimental set up and methodology of the heat transfer coefficient.
The conservation of mass (continuity) equation highlights thebalance in masses between the inlet and outlet.
Conservation of Momentum:
rvUj
vtþ rUi
vUj
vxi¼ �vP
vxj� m
v2Uj
vx2iþ rgj (3)
The momentum equations utilised during the simulation reflectthe laws of motion represented as stress tensors. The equationshighlight the change in momentumwith local changes in time andsurface tension. The first part of the equation highlights the changein time and convection, with the latter part representing diffusionand surface/tensile forces.
Conservation of Energy:
rcmvTvt
þ rcmUivTvxi
¼ �PvUi
vxiþ l
v2Tvx2i
� tijvUj
vxi(4)
The energy equation accounts for changes in the internal energywithin the system. The first half of the equation represents thechange in time and the influence of the convective term. The latterhalf represents pressure, heat flux through diffusion and irrevers-ible heat transfer. The equation is based on the first law ofthermodynamics.
The tool uses the problem geometry with an applied set ofboundary conditions to characterise the flow field in the system.The tool requires a significant amount of computational powerdepending on the application. CFD is a powerful tool able to modelcomplex processes ranging from multiphase models, combustionmodels and even chemical reactions alongside the modelling of theinteraction between solids and liquids [72]. The development ofCFD has led to an increased accuracy in predicting system perfor-mance and reliability of computational models. The prediction oftemperature distribution has been investigated in many preserva-tion applications, with the majority investigating effective storagemethods. The results obtained from CFD simulations highlight thefluctuations in heat transfer alongside the identification of poorheat transfer zones. The CFD model used to simulate the freezer isbased on the rotating fan geometry enclosed within a box with theexact dimension and volume of the freezer. The positioning of theblood bags is as shown in the proposed shelf configurations. Theproposed CFD geometry was constructed in ANSYS DesignModelleras a three-dimensional computational model. Tomimic the thermalprofile of the freezer, a user-defined function (UDF) was compiledto simulate the change in air temperature as the liquid nitrogenspray is activated, alongside a transient solving algorithm.
4.1. CFD methodology
ANSYS Fluent was the chosen Computational Fluid Dynamics(CFD) software to simulate the heat transfer mechanismwithin thefreezer. The proposed model will effectively represent the heattransfer with the influence of a swirling flow induced by an axialfan. The k-epsilon turbulence model was activated alongside theeffects of scalable wall functions to increase the stability of thesystem. The process for the heat transfer itself is based in thegoverning energy transport equation. As the simulation is based onthe disengagement of liquid nitrogen injectors, the operating gaswithin the chamber is assumed to be a single-phase nitrogen gas.The chosen wall boundary conditions model accounts for coarsermeshes located near walls, and the consideration of a swirl domi-nated flow [73]. The fan was simulated using a moving referenceframe method with the definition of pressure-velocity coupling forincreased simulation stability.

Table 2Mesh sensitivity study.
Level Number of Cells Cell Type Skewness Time per Iteration
Coarse 506,402 Hexahedral 0.656 5e10sCoarse 566,030 Tetrahedral 0.701 5e10sMedium 1,402,790 Hexahedral 0.732 10e12sMedium 1,497,204 Tetrahedral 0.759 10e14sFine 2,059,241 Hexahedral 0.895 15sþFine 2,504,259 Tetrahedral 0.851 15sþ
A. Chauhan et al. / Energy 171 (2019) 77e9482
4.2. Assumptions
The following assumptions were made prior to conducting thesimulation:
1. The thermal profile of the injector has been utilised rather thana physical model of the injector to mimic the cooling profile ofthe system.
2. The glycerine bags are all initially set at a uniform temperatureof 17 �C.
3. No heat transfer occurs at the walls of the freezer; thus, therelevant zones have been set as adiabatic regions.
4. The presence of liquid nitrogen will not be includeddonly thegaseous phase.
4.3. Mesh refinement study
A mesh refinement study was initially conducted to verify theaccuracy and efficiency of the mesh. The different meshes wereselected by analysing the skewness of each mesh density and celltype. Typically, a mesh of skewness under 0.7 is considered to be agood mesh for a hexahedron mesh type and 0.8 for a tetrahedralmesh. The results obtained from the mesh refinement study areshown in Table 2.
The results obtained from the mesh refinement study highlightthe increased performance with a structured hexahedral meshcompared to an unstructured tetrahedral mesh. The uniformity ofthe mesh ensures the correct density near walls when simulating aswirling flow. The overall results obtained from the mesh inde-pendence study highlight a skewness of 0.895 for the fine
Table 3Empty freezer velocity measurements.
Empty Freezer
285 RPM
Loading Location Velocity Rea
Top Shelf C1.3 1.06m/sC2.3 0.68m/sC3.3 0.69m/sA1.1 0.62m/A2.1 (No Load) 0.72m/sA3.1 0.54m/s
Middle Shelf F1.3 1.16m/sF2.3 1.31m/sF3.3 0.67m/sD1.1 0.50m/sD2.1 (No Load) 0.70m/sD3.1 0.39m/s
Bottom Shelf I1.3 0.59m/sI2.3 1.41m/sI3.3 0.47m/sG1.1 0.42m/sG2.1 (No Load) 0.91m/sG3.3 0.49m/s
hexahedral mesh, and 0.851 for the fine tetrahedral mesh. Thesimulation time for all mesh densities shows an increase in simu-lation time as the mesh density increases, with a reflected increasein accuracy. Themesh density betweenmedium and fine reflects anincrease in accuracy of approximately 13%; therefore, a fine meshwas applied throughout the simulation. The mesh sensitivity studywas conducted with the default relaxation factors, with a residualtolerance set at 1e-8.
4.4. Boundary conditions
To define the inlet and outlet profiles, a pressure velocitycoupling was applied throughout the entire schematic. As the fanrotation is the dominant feature, a Velocity Inlet of 0.001m/s wasapplied in the fan flow direction as initialisation. The boundaryconditions selected also account for the thermal changes within thefreezer with the operation of the injectors as experienced in the labscale system. The UDF profile is based on an experimental profile,obtained with each test as a function of time to reach a set tem-perature. The outlet was set as a Pressure Outlet at the exhaust.
4.5. User defined function (UDF)
The development of a user defined function is primarilycompiled in Cþþ and applied to the fluid properties within theglycerine filled bags. The UDF starts at an arbitrary loading tem-perature of 20 �C, with the only variable being the set point tem-perature. To accurately simulate the phase change phenomenaoccurring in the process, a UDF was created based on the energyrequired to reach the phase change point, based on the thermo-physical properties of glycerine and water. The duration of phasechange is independently based on the freezing profile of the glyc-erine and water mixture, with the duration to the set point beingbased on the energy required to reach the set point.
5. Results and discussion
5.1. Experimental results
5.1.1. Air flow velocitiesAir velocity measurements were taken in an empty and a fully
loaded freezer at 285 RPM and 1995 RPM. The relative positions for
1995 RPM
ding Loading Location Velocity Reading
C1.3 7.24m/sC2.3 2.12m/sC3.3 2.10m/sA1.1 3.03m/sA2.1 (No Load) 3.82m/sA3.1 3.79m/sF1.3 4.12m/sF2.3 8.75m/sF3.3 3.86m/sD1.1 3.3m/sD2.1 (No Load) 3.92m/sD3.1 2.73m/sI1.3 4.54m/sI2.3 8.43m/sI3.3 5.46m/sG1.1 2.59m/sG2.1 (No Load) 4.88m/sG3.3 2.59m/s

Table 4Fully loaded freezer velocity measurements.
Full Freezer
285 RPM 1995 RPM
Location Velocity Reading Location Velocity Reading
Top Shelf C1.3 1.77m/s C1.3 3.52m/sC2.3 0.54m/s C2.3 3.66m/sC3.3 0.71m/s C3.3 2.51m/sA1.1 0.68m/s A1.1 3.64m/sA2.1 (No Load) 0.44m/s A2.1 (No Load) 1.99m/sA3.1 0.94m/s A3.1 2.75m/s
Middle Shelf F1.3 0.88m/s F1.3 5.72m/sF2.3 1.53m/s F2.3 10.3m/sF3.3 1.02m/s F3.3 4.84m/sD1.1 0.51m/s D1.1 3.16m/sD2.1 (No Load) 0.52m/s D2.1 (No Load) 2.61m/sD3.1 0.73m/s D3.1 2.07m/s
Bottom Shelf I1.3 0.76m/s I1.3 4.41m/sI2.3 1.64m/s I2.3 9.58m/sI3.3 0.78m/s I3.3 3.74m/sG1.1 0.44m/s G1.1 1.61m/sG2.1 (No Load) 0.76m/s G2.1 (No Load) 4.24m/sG3.3 0.56m/s G3.3 2.39m/s
-80
-70
-60
-50
-40
-30
-20
-10
0
10
20
30
0:00:00 0:07:12 0:14:24 0:21:36 0:28:48 0:36:00 0:43:12 0:50:24 0:57:36
Tempe
rature
(°C)
Dura on (HH:MM:SS)
A1.1 G1.1 A3.1 G3.1 C3.3 I3.3 C2.3 I2.3 C1.3 I1.3
Fig. 4. Freezing profile of glycerine filled blood bags.
Fig. 5. Liquid nitrogen consumption.
A. Chauhan et al. / Energy 171 (2019) 77e94 83
the velocity readings for an empty freezer are shown in Fig. 2a. Thereadings taken are shown in Table 3.
From the results obtained, the locations of low velocity zoneshave been identified highlighting potential low performing heat
Fig. 6. Streamlines for a double stack system at 1995 RPM

Fig. 7. Streamlines for a single stack system at 1995 RPM
A. Chauhan et al. / Energy 171 (2019) 77e9484
transfer zones. Both fan configurations have high velocity areas insome zones. The high speed and low speed zones are highlighted inthe table in red and blue, respectively.
Table 3 and Fig. 2b show the velocity recordings and probepositions of a fully loaded freezer. The readings for both 285 RPMand 1995 RPM are shown in Table 4.
The results in Table 3 show an improved air distribution as theeffect of the loading and the corresponding velocity changes as aresult of turbulence. The results show an overall increase and amore even distribution of air at a lower RPM value between both
(a) Contour Profile at -40°C (b)
(c) Contour Profile at -60°C (d)
Fig. 8. Temperature contour p
loaded and unloaded freezers. During a higher RPM operation witha full load, the majority of the recorded values are high velocities,giving a preliminary indication of a high heat transfer area.
5.1.2. Default operating conditionsThe initial operation of the systemwas conducted at a high RPM
(1995 RPM) for a single stack loading configuration. The glycerinefilled blood bags were loaded at an ambient core temperature of20 �C, and the observed temperature profile was gathered from theambient starting point up to�70 �C. The results are shown in Fig. 4.The loading locations of the bags are shown in Fig. 2.
The temperature profile (Fig. 4) experienced during the opera-tion highlights an effective and steady freezing profile. Unlike otherdirect contact freezing methods, sharp temperature decreases arenot seen in this process as experienced with immersion freezing.The lack of sharp temperature decreases also indicates the lack ofcrystallisation, leading to a higher quality produce. The graphsuggests that blood bags located in zones C1.3 and C3.3 experiencethe sharpest decrease with spikes in temperature, due to thepositioning of the bags in relation to the injector. Similarly, zonesG1.3 and G3.1 reflect areas of high temperature due to a lack ofrecirculation. The middle spectrum of temperatures reflects asteady temperature decline with minimal temperature spikes.
Contour Profile at -50°C
Contour Profile at -70°C
lot of freezer operation.
A. Chauhan et al. / Energy 171 (2019) 77e94 85
5.1.3. Liquid nitrogen consumptionThe consumption of liquid nitrogen was monitored throughout
the test duration with its weight being recorded at the beginningand at the end of each test. The monitoring of liquid nitrogenconsumption was carried out by recording the weight differencebetween each test for each temperature profile, calculated by usingequation (5). The liquid nitrogen consumption for each tempera-ture profile is shown in Fig. 5.
w ¼ r � v (5)
where:
w is the weight difference of the tank before and after the ex-periments (kg).r is the density of liquid nitrogen, which is 0.808 kg/L.
5.2. CFD results
The observed velocity streamlines demonstrate the operation ofa high RPM using a double stack schematic (Fig. 6) and a singlestack schematic (Fig. 7). The streamlines highlight the change inresistance in the system,with the reflected change in themaximumvelocity. Fig. 6 shows the maximum velocity at 8.6m/s, with anaverage velocity of 3.62m/s throughout the shelf distribution. Thevelocity streamlines for a double stack system show a relativelyhigh velocity around the bags located close to the fan. There is anincrease in velocity through the exhaust system and surrounding
0
1
2
3
4
5
6
7
8
9
10
11
12
A1.1
A2.1
A3.1
B1.2
B2.2
B3.2
C1.3
C2.3
C3.3
D1.1
D2.1
D 3.1
E 1.2
E 2.2
E3.2
Velo
city
(m/s
)
Freezer Lo
Velocity (Experimental) 70HzVelocity (Experimental) 10Hz
Fig. 9. Velocity profile for both C
area, highlighting a potential area of increased convection. Thestreamlines depict an increase in velocity through the sides of thesystem but a lower velocity closer to the system extremities. Thelow velocity areas in a single stack (Fig. 7) located away from the fanhighlights the potential area of high temperature variation. Incomparison to a single stack system the maximumvelocity is lowerby 0.04m/s, and similarly the sides of the system show an increasein velocity passing through the sides. The increase in velocityhighlights an area of increased convection, thus demonstrating animproved freezing pattern. Unlike the double stack configuration,the single stack configuration depicts an increased velocity due tothe lack of resistance towards the outer edge of the system.
5.2.1. Temperature contour profileThe contour plots presented in Fig. 8 represent the variation in
temperature during the freezer operation between �40 �Cand �70 �C. The temperature contour plot at �40 �C shows a largeamount of temperature variation in comparison to the other tem-perature contours, which may be due to the increased liquid ni-trogen injection because of the �70 �C set point. The temperaturesobserved during operation at �40 �C (Fig. 8a) show a significantvariation on the upper surface of the block. The temperature vari-ation on the surface towards the back of the system furthest fromthe fan shows a significantly lower temperature in comparison toadjacent placed bags. The variation in temperature in these regionshighlight strong recirculation zones within those areas, similarlythe areas depicted as having higher temperatures are due to thehigh-speed flow, poor recirculation due to the vacuum effect
F1.3
F2.3
F3.3
G1.
1G
2.1
G3.
1H 1
.2H2
.2H3
.2I 1
.3I2
.3I3
.3
ca on
Velocity (CFD) 70HzVelocity (CFD) 10Hz
FD and experimental values.

-80
-70
-60
-50
-40
-30
-20
-10
0
10
20
0:00
:00
0:01
:34
0:03
:08
0:04
:42
0:06
:16
0:07
:50
0:09
:24
0:10
:58
0:12
:32
0:14
:06
0:15
:40
0:17
:14
0:18
:48
0:20
:22
0:21
:56
0:23
:30
0:25
:04
0:26
:38
0:28
:12
0:29
:46
0:31
:20
0:32
:54
0:34
:28
0:36
:02
0:37
:36
0:39
:10
0:40
:44
0:42
:18
0:43
:52
0:45
:26
0:47
:00
0:48
:34
0:50
:08
Tem
pera
ture
(°C)
Time (HH:MM:SS)
A1.1 (EXP) A1.1 (CFD) A3.1 (EXP) A3.1 (CFD)
Fig. 10. Experimental and CFD temperature profiles for Zone A.
-80
-70
-60
-50
-40
-30
-20
-10
0
10
20
30
0:00
:00
0:01
:36
0:03
:12
0:04
:48
0:06
:24
0:08
:00
0:09
:36
0:11
:12
0:12
:48
0:14
:24
0:16
:00
0:17
:36
0:19
:12
0:20
:48
0:22
: 24
0:24
:00
0:25
: 36
0:27
:12
0 :28
:48
0:30
:24
0:32
:00
0:33
:36
0:35
:12
0:36
:48
0:38
:24
0:40
:00
0:41
: 36
0 :43
:12
0 :44
: 48
0:46
:24
0 :48
:00
0:49
:36
Tempe
rature
(°C)
Dura on (HH:MM:SS)
C3.3 (EXP) C3.3 (CFD) C2.3 (EXP) C2.3 (CFD) C1.3 (EXP) C1.3 (CFD)
Fig. 11. Experimental and CFD temperature profiles for Zone C.
A. Chauhan et al. / Energy 171 (2019) 77e9486
created by the exhaust and frictional effects within the regions.Fig. 8b shows the contour plot at �50 �C; unlike the �40 �C oper-ation, the decrease in temperature variation reflects a significantlyincreased uniformity due to the increase in liquid nitrogen injectors
lowering the air temperature and associated heat transfer betweenthe product and air. The circulation towards the back of the freezeris reflected in the stability of temperatures with an average bag coretemperature deviation of 10 K. Fig. 8c shows the operation

-80
-70
-60
-50
-40
-30
-20
-10
0
10
20
30
0:00
:02
0:01
:36
0:03
:10
0:04
:44
0:06
:18
0:07
:52
0:09
:26
0:11
:00
0:12
:34
0:14
:08
0:15
:42
0:17
:16
0:18
:50
0:20
:24
0:21
:58
0:23
:32
0:25
:06
0:26
:40
0:28
:14
0:29
:48
0:31
:22
0:32
:56
0:34
:30
0:36
:04
0:37
:38
0:39
:12
0:40
:46
0:42
:20
0:43
:54
0:45
:28
0:47
:02
0:48
:36
0:50
:10
G1.1 (EXP) G1.1 (CFD) G3.1 (EXP) G3.1 (CFD)
Fig. 12. Experimental and CFD temperature profiles for Zone G.
-80
-70
-60
-50
-40
-30
-20
-10
0
10
20
30
0:00
:00
0:01
:36
0:03
:12
0:04
:48
0:06
:24
0:08
:00
0:09
:36
0:11
:12
0:12
:48
0:14
:24
0:16
: 00
0:17
: 36
0:19
: 12
0:20
:48
0:22
:24
0:24
:00
0 :25
:36
0:27
:12
0:28
:48
0:30
:24
0:32
:00
0:33
:36
0:35
:12
0:36
:48
0:38
:24
0 :40
: 00
0 :41
: 36
0:43
:12
0:44
:48
0:46
:24
0:48
: 00
0:49
: 36
Tem
pera
ture
(°C)
Dura on (HH:MM:SS)I3.3 (EXP) I3.3 (CFD) I2.3 (EXP) I2.3 (CFD) I1.3 (EXP) I1.3 (CFD)
Fig. 13. Experimental and CFD temperature profiles for Zone I.
A. Chauhan et al. / Energy 171 (2019) 77e94 87
at �60 �C, with similar results as �50 �C. The results show a slightincrease in temperature near the exhaust region highlighting thelack of recirculation in the area, and the change in temperatureprofile due to suction. Fig. 8d shows the operation at a set pointtemperature of �70 �C, the temperature difference experienced bythe glycerine filled blood bags is minimal with the average systemdifference being around 5 K.
5.3. Validation
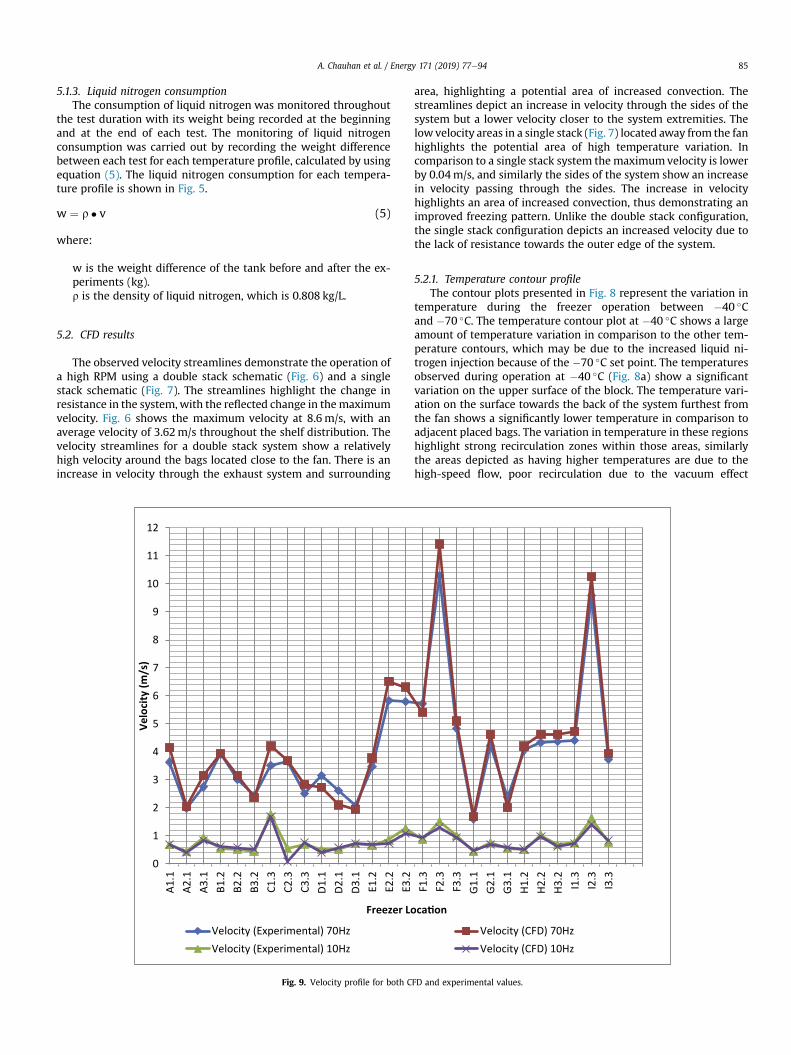
5.3.1. Velocity profileBoth experimental and numerical velocity readings were taken
in corresponding positions, for both high and low fan speed con-figurations and as a double stack. The velocity readings obtainedare shown in Fig. 9, according to the positioning schematic shownin Fig. 2a and b. The CFD results depict the expected over-prediction

0
20
40
60
80
100
120
0.1 0.2 0.3 0.4 0.5 0.6 0.7 0.8 0.9 1
HTC
(W/m
²/°C)
Fan Speed Percentage (285-1995RPM)
Top ShelfLe Side
Top ShelfRight Side
MiddleShelf LeSide
MiddleShelfRight Side
B mShelf LeSide
B mShelfRight Side
Fig. 14. Heat transfer coefficient at �40 �C.
A. Chauhan et al. / Energy 171 (2019) 77e9488
of velocity values, due to many factors such as instrumentationerrors and turbulence model over-predictions. Both experimentaland CFD values show a similar trend with an average velocityvariance of 16%. The corresponding high RPM shows a higheramount of variance; this may be due to many reasons such as thephysical movement of the probe due to increased velocity. Thecorresponding low velocity measurements highlight a less variedvelocity result with an average velocity variation of 9% betweenCFD and experimental results.
5.3.2. Blood bag temperaturesZone A.The position of Zone A is shown in Fig. 2b with the corre-
sponding loading configuration highlighted in the figure. Fig. 10shows the CFD and experimental temperature profiles for Zone A,located towards the extremities of the system towards the exhaust.Both CFD and experimental values show very similar trends, with
0
20
40
60
80
100
120
0.1 0.2 0.3 0.4 0.5
HTC(W
/m²/°C)
Fan Speed PercenTop Shelf Le Side Top Shelf R
Middle Shelf Right Side B m Sh
Fig. 15. Heat transfer co
the CFD values showing a slight under-prediction of 12.4%, withboth following the overall trend of the experimental data. Bothexperimental and CFD results show a prolonged horizontal periodwhen the core temperature reaches freezing point due to thetransfer of latent heat to the surroundings. Zone A is also locatednear the exhaust and influenced by the vacuum properties createdfrom the exhaust during operation. The thermal effects of theglycerine-filled bags at these locations are discussed in section 5.2.2with the aid of contour plots. The variation in temperature betweenzone A1.1 and zone A3.1 is due to the positioning of each bag,despite them being in the same zone. The temperature variationbetween both bags highlights the effect of the exhaust suction, withzone A1.1 being most affected by the exhaust causing a delayedfreezing to reach the desired set point. Both sets of experimentaland CFD data show a steady and smooth decline in temperature.
Zone C.The positioning of loads in zone C is shown in Fig. 2a and b. Zone
0.6 0.7 0.8 0.9 1
tage (285 - 1995 Hz)ight Side Middle Shelf Le Side
elf Le Side B m Shelf Right Side
efficient at �50 �C.

0
20
40
60
80
100
120
0.1 0.2 0.3 0.4 0.5 0.6 0.7 0.8 0.9 1
HTC(W
/m²/°C)
Fan Speed Percentage (2860 - 1995 Hz)
Top ShelfLe Side
Top ShelfRight Side
MiddleShelf LeSide
MiddleShelf RightSide
B mShelf LeSide
B mShelf RightSide
Fig. 16. Heat transfer coefficient at �60 �C.
A. Chauhan et al. / Energy 171 (2019) 77e94 89
C is located closest to the injectors on the top shelf. The experi-mental data show a singular sharp spike in temperature due to theincrease in injection resulting in droplets interacting with thesurface of the bag, as shown in Fig. 11. The CFD data for zones C1.3,C2.3 and C3.3 do not reflect this spike in temperature due to theUDF applied to the load in zone C. The UDF implies a phase changepoint which is significantly higher than the experimental data. Asthe UDF is based on an arbitrary profile, a level of variation existsduring the phase change stage. The experimental results reflect asudden but small spike in temperature due to the proximity to theinjectors. The results highlight a steady decrease. Similarly to pre-vious results, the UDF does not highlight the horizontal period
0
20
40
60
80
100
120
0.1 0.2 0.3 0.4 0.5 0.6
HTC(W
/m²/°C)
Fan Speed Percentage
Fig. 17. Heat transfer co
experienced experimentally at the start of the test. The lack ofhorizontal period reflected in the experimental sets of data high-light a quicker transfer of latent heat in the specific area. Thetemperature variation between experimental and CFD data high-lights a smooth decline to the set point temperature. The CFD UDFutilised overpredicts the freezing pattern for zones C2.3 and C3.3.The average variation between the loading conditions to reach theset point temperature has a maximum difference of 52.5% and45.5%, respectively, in comparison to 27.2% in zone C1.3. The overprediction is more pronounced in the results for the phase changepoint to the set point.
Zone G.
0.7 0.8 0.9 1(10 - 70 Hz)
Top ShelfLe Side
Top ShelfRight Side
MiddleShelf LeSideMiddleShelf RightSideB mShelf LeSideB mShelf RightSide
efficient at �70 �C.

A. Chauhan et al. / Energy 171 (2019) 77e9490
The location of zone G is also shown in Fig. 2a and b, indicatingthe position of the glycerine-filled blood bags. The relative locationof Zone G is on the bottom shelf, located close to the freezer door.The temperature profile of the bags is shown in Fig. 12 for bothexperimental and CFD data. The loading position in comparison tozone A follows a similar trend due to the translational proximitybetween both zones. The data reflects the progressive decrease tothe set point temperature without sudden temperature spikes. TheUDF applied to zone G highlights a prominent over prediction inzones G1.1 and G3.1. The maximum overprediction between theexperimental and CFD results for zone G1.1 differs by 55% in com-parison to G3.3 with an overprediction of 69%. Both zones reflect asteady decline to the set point temperature. The location of zone Gitself is towards the back of the system and indirectly placed fromthe exhaust system. The steady decline is reflected in the location asthe thermal variations experienced with suction are significantlyreduced for both sets of data. The lack of suction also allowsrecirculation of the area and the bottom shelf. This is evident due tothe relatively shorter horizontal period reflecting an increasedtransfer in latent heat between the gas and glycerine filled bags. As
Fig. 18. Temperature contour plot of
experienced with all numerical simulations, a level of differencewill always exist between numerical prediction and the obtainedexperimental results.
Zone I.Similarly to zone G, zone I is located directly beneath zone C and
follows an identical loading pattern as shown in Fig. 2a and b.Fig. 13 depicts both CFD and experimental sets of data. Zone I islocated just under the injector profile. Both CFD predictions forzones I2.3 and I3.3 highlight a relatively significant over predictionwith a maximum difference of 46.5% and 96.1% between CFD andexperimental results. Unlike previous data sets, a small amount ofunder prediction exists in Zone I2.3 between �22 �C and �70 �C,which may be due to the assumption of a steady decline to the setpoint temperature. Unlike zone C, the temperature profile of zone Ishows a horizontal profile in which transfer of latent heat isoccurring. As the glycerine-filled bags are located furthest awayfrom the exhaust, the relatively prolonged freezing time may bedue to the poor recirculation within the region. The trend is dis-cussed in section 5.2.2, showing an increased temperature alongthe upper surface of the bags highlighting a region of poor
double stack loading at 285 RPM

A. Chauhan et al. / Energy 171 (2019) 77e94 91
recirculation. The region of poor recirculation is evident because ofthe temperature variation between each zone shown in section5.2.2. The recirculation primarily affects the transfer of latent heatbut, after the freezing point has been reached, the zone experiencesa rapid decrease in temperature to the set point.
5.4. Heat transfer coefficient
The reflected experimental results shown in Figs. 14e17 high-light the associated heat transfer results. The heat transfer coeffi-cient studywas conducted as a baseline experiment to gather initialobservations about the system. The observation of the system wasconducted with the copper specimen as mentioned in section 3.4.
5.4.1. -40 �CThe operation at �40 �C reflects the obtained and average heat
transfer coefficient of the system as shown in Fig. 14. The heattransfer coefficient obtained reflects a positive trend with an in-crease in heat transfer coefficient with the increase in forced con-vection due to the increased fan operation. The data reflects minor
Fig. 19. Temperature contour plot
fluctuations due to the change in positioning for each HTC calcu-lation. The level of fluctuation is prevalent in both middle sectionson both left and right; this may be due to positioning. The heattransfer coefficient data obtained also reflect potential areas of poorheat transfer.
5.4.2. -50 �CUnlike the operation in �40 �C, the calculation of the heat
transfer coefficient at �50 �C reflects an improved average heattransfer operation due to the larger temperature differential. Bothmiddle shelf locations reflect a higher heat transfer coefficient dueto the location of the disc with respect to the flowand impingementdirection. The comparison between the �40 �C and �50 �C opera-tions reflect a consistent poor heat transfer zone towards the bot-tom shelf, as validated through CFD investigations. The dataobtained is reflected in Fig. 15.
5.4.3. -60 �CAs expected, the decrease operational temperature increased
the temperature differential, therefore resulting in a fractionally
of double stack at 1995 RPM

A. Chauhan et al. / Energy 171 (2019) 77e9492
improved cooling rate as shown in Fig. 16.
5.4.4. -70 �CThe final set point at�70 �C is reflected in Fig.17. The data in this
figure reflects a substantially large increase in heat transfer coef-ficient for a 1995RPM operation in comparison to all previoustemperature set points. The final set point temperature offers ahigher temperature differential and reflected cooling rate. Thebottom shelf zones are still predominantly reflecting poor areas ofheat transfer as discussed in section 5.2.
6. Proposed additional loading
By utilising CFD, additional loading techniques can be investi-gated to identify the ideal loading condition and observe theresulting change in the flow profile and associated changes intemperature. The simulations were re-conducted using identicalboundary conditions, numerical models and pre-imposed modelassumptions, with the only variable being the stacking and change
Fig. 20. Temperature contour plo
in RPM. The simulation was re-conducted using a double stack at ahigh and low RPM, and a single stack at a low RPM.
6.1. Double stack at 285 RPM
The effect of stacking was investigated by placing an additionallayer of glycerine-filled bags on top of the existing configuration.The simulation was based on an operation at 285 RPM. Fig. 18shows the results of the operation of a double stack system at285 RPM, with a temperature range of �40 �C to �70 �C. Fig. 18adepicts the operation at �40 �C. The results show a significanttemperature variation, with the bags placed on the outer edge ofthe system at a relatively low temperature in comparison to theother bags. The increase in low temperature zones can be due to theintroduction of a streamlined flow, allowing proper recirculation ofair when it reaches the outer extremities of the system. As theoperation continues to the set point of �70 �C, there is anincreasing amount of uniformity with temperature variationsdecreasing with each temperature increment. Fig. 18b and c shows
t of single stack at 285 RPM

A. Chauhan et al. / Energy 171 (2019) 77e94 93
the results for the operation at �50 �C and �60 �C, respectively,highlighting an increased uniformity. As observed in the originalsimulation, high temperature is observed on the bottom shelf to-wards the fan; the addition of another stack highlights a similartrend but stabilises towards the operation of the set point. The finaloperational set shows a small increase in temperature towards theexhaust, highlighting the pressure effects as expected but stilldisplaying an overall uniformity.
6.2. Double stack at 1995 RPM
The double stack configuration was simulated again with ahigher operation of 1995 RPM. Fig. 19a depicts the operationat �40 �C, the contour plot shows a significant increase in tem-peratures which may be due to the increase in frictional forcesbetween the gas and the glycerine-filled bag experienced with ahigher RPM. The subsequent temperature plot in Fig. 19b shows anincreased uniformity of the temperature, with a similar trend oflow temperatures towards the back of the system. The temperatureprofile of the system highlights the increasing stability as theoperation reaches the set point, with minimal levels of variation atthe final set point.
6.3. Single stack at 285 RPM
The single stack configuration was simulated again under alower RPM along the same temperature points as the originalsimulation. The results are shown in Fig. 20. The temperaturecontour plot at �40 �C highlights a significant amount of hightemperatures on the surface of the blood bags, indicating the fric-tional effects of the gas and the blood bags. The subsequent tem-perature plots reflect an increased stability as shown in Fig. 20. Asthe single stack system is identical to the original simulation, theincrease in temperature experienced in Fig. 20 reflects areas pre-viously identified as having recirculation and experiencing thesuction effects of the exhaust. The operation of the fan throughoutthe configuration shows the slow reduction of high temperatureareas, which still exist after reaching the set point. Similarly to thehigh RPM operation, the low RPM schematic depicts high tem-perature zones at the bottom shelf at the desired set point tem-perature. This can indicate poor flow circulation in the specificregion in the bottom shelf.
7. Conclusions
It is evident from the results presented in this paper that theimplementation of a liquid nitrogen injector improves the freezingperformance of the system compared to direct immersion freezing,allowing achieving short freezing times without spikes in tem-perature. The lack of spiked temperatures highlights the lack ofcrystallisation within the product, leading to a higher productquality. In comparison to other freezing methods, the contact be-tween product and liquid nitrogen is minimal. As observed fromboth CFD and experimental results, there are localised areas ofextremely low temperatures; this may be due to the bag placementin relation to the liquid nitrogen injectors. The CFD data show avariation in temperature throughout each load but the temperaturevariation is still small in comparison to immersion freezing or otherdirect contact freezing methods. The freezing profile is alsodependent on the positioning and stacking of the bags as reflectedin the freezing predictions. It is evident that the addition of stacksincreases the flow resistance throughout the system as the velocityincreases. The results show that a double stack provides an excel-lent performance in a high RPM configuration, and could beimplemented in systems where freezing is required in less than an
hour. Both high RPM sets of data showed an increased velocityresistance but produced the same temperature variations as theirlower RPM counterpart, with the only difference being the decreasein freezing time experienced with a high RPM. The system itselfachieves a low temperature smoothly and effectively without theneed of additional systems to maintain the temperature, whilstmaintaining product integrity with high levels of uniform producttemperature.
Acknowledgements
This project was funded by AirProducts PLC (Agreement Num-ber: 216-206-P).
References
[1] Jouhara H, Olabi AG. Editorial: industrial waste heat recovery. Energy2018;160:1e2. https://doi.org/10.1016/J.ENERGY.2018.07.013.
[2] Olabi AG. Energy quadrilemma and the future of renewable energy. Energy2016;108:1e6. https://doi.org/10.1016/J.ENERGY.2016.07.145.
[3] Foley A, Olabi AG. Renewable energy technology developments, trends andpolicy implications that can underpin the drive for global climate change.Renew Sustain Energy Rev 2017;68:1112e4. https://doi.org/10.1016/J.RSER.2016.12.065.
[4] Olabi AG. Renewable energy and energy storage systems. Energy 2017;136:1e6. https://doi.org/10.1016/J.ENERGY.2017.07.054.
[5] Dima JB, Santos MV, Baron PJ, Califano A, Zaritzky NE. Experimental study andnumerical modeling of the freezing process of marine products. Food BioprodProcess 2014;92:54e66. https://doi.org/10.1016/j.fbp.2013.07.012.
[6] Biglia A, Comba L, Fabrizio E, Gay P, Aimonino DR. Case studies in food freezingat very low temperature. Energy Proc 2016;101:305e12. https://doi.org/10.1016/j.egypro.2016.11.039.
[7] Kiani H, Sun D-W. Water crystallization and its importance to freezing offoods: a review. Trends Food Sci Technol 2011;22:407e26. https://doi.org/10.1016/j.tifs.2011.04.011.
[8] Paciulli M, Ganino T, Pellegrini N, Rinaldi M, Zaupa M, Fabbri A, et al. Impact ofthe industrial freezing process on selected vegetables d Part I. Structure,texture and antioxidant capacity. Food Res Int 2015;74:329e37. https://doi.org/10.1016/J.FOODRES.2014.04.019.
[9] Kondjoyan A. A review on surface heat and mass transfer coefficients duringair chilling and storage of food products. Int J Refrig 2006;29:863e75. https://doi.org/10.1016/j.ijrefrig.2006.02.005.
[10] Rooni V, Raud M, Kikas T. The freezing pre-treatment of lignocellulosic ma-terial: a cheap alternative for Nordic countries. Energy 2017;139:1e7. https://doi.org/10.1016/J.ENERGY.2017.07.146.
[11] Han Y, Li M, Wang Y, Li G, Ma X, Wang R, et al. Impedance matching controlstrategy for a solar cooling system directly driven by distributed photovol-taics. Energy 2019;168:953e65. https://doi.org/10.1016/J.ENERGY.2018.11.148.
[12] Edwin M, Joseph Sekhar S. Techno- Economic evaluation of milk chilling unitretrofitted with hybrid renewable energy system in coastal province. Energy2018;151:66e78. https://doi.org/10.1016/J.ENERGY.2018.03.050.
[13] Edwin M, Sekhar SJ. Thermal performance of milk chilling units in remotevillages working with the combination of biomass, biogas and solar energies.Energy 2015;91:842e51. https://doi.org/10.1016/J.ENERGY.2015.08.103.
[14] RenoMJ, Resende JV, PeresAP,GiarollaTMO,PradoMET.Heat transfer andenergyconsumption in the freezing of guava pulp in large containers. Appl Therm Eng2011;31:545e55. https://doi.org/10.1016/j.applthermaleng.2010.10.015.
[15] Becker BR, Fricke BA. Heat transfer coefficients for forced-air cooling andfreezing of selected foods. Int J Refrig 2004;27:540e51. https://doi.org/10.1016/j.ijrefrig.2004.02.006.
[16] Zhao CJ, Han JW, Yang XT, Qian JP, Fan BL. A review of computational fluiddynamics for forced-air cooling process. Appl Energy 2016;168:314e31.https://doi.org/10.1016/j.apenergy.2016.01.101.
[17] Alvarez G, Bournet P-E, Flick D. Two-dimensional simulation of turbulent flowand transfer through stacked spheres. Int J Heat Mass Tran 2003;46:2459e69.https://doi.org/10.1016/S0017-9310(02)00546-X.
[18] Urquiola A, Alvarez G, Flick D. Frost formation modeling during the storage offrozen vegetables exposed to temperature fluctuations. J Food Eng 2017.https://doi.org/10.1016/j.jfoodeng.2017.06.025.
[19] Hu Z, Sun D-W. Predicting local surface heat transfer coefficients by differentturbulent k-ε models to simulate heat and moisture transfer during air-blastchilling. Int J Refrig 2001;24:702e17. https://doi.org/10.1016/S0140-7007(00)00081-5.
[20] Moerman F, Fikiin K. Chapter 20 e hygienic design of air-blast freezing sys-tems. Handb Hyg Contr Food Ind 2016:271e316. https://doi.org/10.1016/B978-0-08-100155-4.00020-0.
[21] Li D, Chen B, Wu WJ, Wang GX, He YL. Multi-scale modeling of tissue freezingduring cryogen spray cooling with R134a, R407c and R404a. Appl Therm Eng2014;73:1489e500. https://doi.org/10.1016/j.applthermaleng.2014.03.034.

A. Chauhan et al. / Energy 171 (2019) 77e9494
[22] Liang D, Lin F, Yang G, Yue X, Zhang Q, Zhang Z, et al. Advantages of im-mersion freezing for quality preservation of litchi fruit during frozen storage.LWT - Food Sci Technol 2015;60:948e56. https://doi.org/10.1016/j.lwt.2014.10.034.
[23] Alberto Dopazo J, Fern�andez-Seara J. Experimental evaluation of freezingprocesses in horizontal plate freezers using CO2 as refrigerant. Int J Refrig2012;35:2093e101. https://doi.org/10.1016/j.ijrefrig.2012.08.018.
[24] Xin Y, Zhang M, Xu B, Adhikari B, Sun J. Research trends in selected blanchingpretreatments and quick freezing technologies as applied in fruits and veg-etables: a review. Int J Refrig 2015;57:11e25. https://doi.org/10.1016/J.IJREFRIG.2015.04.015.
[25] Wang J, Yang X-H, Mujumdar AS, Wang D, Zhao J-H, Fang X-M, et al. Effects ofvarious blanching methods on weight loss, enzymes inactivation, phyto-chemical contents, antioxidant capacity, ultrastructure and drying kinetics ofred bell pepper (Capsicum annuum L.). LWT 2017;77:337e47. https://doi.org/10.1016/J.LWT.2016.11.070.
[26] Jaworska G, Berna�s E. Effects of pre-treatment, freezing and frozen storage onthe texture of Boletus edulis (Bull: Fr.) mushrooms. Int J Refrig 2010;33:877e85. https://doi.org/10.1016/J.IJREFRIG.2009.12.031.
[27] Xiao H-W, Pan Z, Deng L-Z, El-Mashad HM, Yang X-H, Mujumdar AS, et al.Recent developments and trends in thermal blanching e a comprehensivereview. Inf Process Agric 2017;4:101e27. https://doi.org/10.1016/J.INPA.2017.02.001.
[28] Weng C-C, Lin M-C, Huang M-J. A waste cold recovery from the exhaustedcryogenic nitrogen by using thermoelectric power generator. Energy2016;103:385e96. https://doi.org/10.1016/J.ENERGY.2016.02.146.
[29] Zhao Y, Wang S, Li Y. Thermoelectric power generation using LNG cold energyand flue gas heat. Energy Proc 2017;105:1932e5. https://doi.org/10.1016/J.EGYPRO.2017.03.562.
[30] Ghorbani B, Hamedi M-H, Amidpour M, Mehrpooya M. Cascade refrigerationsystems in integrated cryogenic natural gas process (natural gas liquids (NGL),liquefied natural gas (LNG) and nitrogen rejection unit (NRU)). Energy2016;115:88e106. https://doi.org/10.1016/J.ENERGY.2016.09.005.
[31] Gurruchaga H, Saenz del Burgo L, Hernandez R, Orive G, Selden C, Fuller B,et al. Advances in the slow freezing cryopreservation of microencapsulatedcells. J Contr Release 2018;281:119e38. https://doi.org/10.1016/J.JCONREL.2018.05.016.
[32] Ahmad A, Al-Dadah R, Mahmoud S. CFD modelling of a novel liquid Nitrogen/Air engine and cryogenic heat exchanger for small scale applications. EnergyProc 2017;142:3654e60. https://doi.org/10.1016/J.EGYPRO.2017.12.258.
[33] Espinoza Rodezno LA, Sundararajan S, Solval KM, Chotiko A, Li J, Zhang J, et al.Cryogenic and air blast freezing techniques and their effect on the quality ofcatfish fillets. LWT - Food Sci Technol 2013;54:377e82. https://doi.org/10.1016/j.lwt.2013.07.005.
[34] Hu Z, Sun D. Effect of fluctuation in inlet airflow temperature on CFD simu-lation of air-blast chilling process. J Food Eng 2001;48:311e6. https://doi.org/10.1016/S0260-8774(00)00172-2.
[35] Issa RJ, Lawrence T. Experimental heat transfer study of beef carcasses chilledby mist sprays. Exp Heat Transf 2014;28:69e88. https://doi.org/10.1080/08916152.2013.813877.
[36] Dempsey P, Bansal P. The art of air blast freezing: design and efficiencyconsiderations. Appl Therm Eng 2012;41:71e83. https://doi.org/10.1016/j.applthermaleng.2011.12.013.
[37] G�oral D, Kluza F. Heat transfer coefficient in impingement fluidization freezingof vegetables and its prediction. Int J Refrig 2012;35:871e9. https://doi.org/10.1016/J.IJREFRIG.2011.11.010.
[38] Amarante A, Lanoisell�e J-L. Heat transfer coefficients measurement in indus-trial freezing equipment by using heat flux sensors. J Food Eng 2005;66:377e86. https://doi.org/10.1016/J.JFOODENG.2004.04.004.
[39] Amarante A, Lanoisell�e J-L, Ramirez A. Direct measurement of heat transferrates and coefficients in freezing processes by the use of heat flux sensors.Chem Eng Res Des 2003;81:1105e12. https://doi.org/10.1205/026387603770866254.
[40] Fricke BA, Becker BR. Sensitivity of freezing time estimation methods to heattransfer coefficient error. Appl Therm Eng 2006;26:350e62. https://doi.org/10.1016/J.APPLTHERMALENG.2005.07.005.
[41] Meziani S, Ioannou I, Jasniewski J, Belhaj N, Muller J-M, Ghoul M, et al. Effectsof freezing treatments on the fermentative activity and gluten networkintegrity of sweet dough. LWT - Food Sci Technol 2012;46:118e26. https://doi.org/10.1016/j.lwt.2011.10.017.
[42] Volkert M, Ananta E, Luscher C, Knorr D. Effect of air freezing, spray freezing,and pressure shift freezing on membrane integrity and viability of Lactoba-cillus rhamnosus GG. J Food Eng 2008;87:532e40. https://doi.org/10.1016/j.jfoodeng.2008.01.008.
[43] Ketata M, Desjardins Y, Ratti C. Effect of liquid nitrogen pretreatments onosmotic dehydration of blueberries. J Food Eng 2013;116:202e12. https://doi.org/10.1016/j.jfoodeng.2012.10.035.
[44] Agnelli ME, Mascheroni RH. Cryomechanical freezing. A model for the heattransfer process. J Food Eng 2001;47:263e70. https://doi.org/10.1016/S0260-8774(00)00126-6.
[45] Delgado AE, Sun D-W. Heat and mass transfer models for predicting freezingprocesses e a review. J Food Eng 2001;47:157e74. https://doi.org/10.1016/S0260-8774(00)00112-6.
[46] Gazda W. Application possibilities of the strategies of the air blast-cryogeniccooling process. Energy 2013;62:113e9. https://doi.org/10.1016/
j.energy.2013.06.054.[47] Xu Z, Guo Y, Ding S, An K, Wang Z. Freezing by immersion in liquid CO2 at
variable pressure: response surface analysis of the application to carrot slicesfreezing. Innovat Food Sci Emerg Technol 2014;22:167e74. https://doi.org/10.1016/J.IFSET.2013.06.005.
[48] Awonorin SO. Analysis of the heat transfer coefficient for liquid nitrogendroplets in cryogenic freezing of foods: analyse du coefficient de transfert dechaleur de gouttelettes d'azote liquide dans des conditions de cryocong�elationdes aliments. Int J Refrig 1993;16:143e51. https://doi.org/10.1016/0140-7007(93)90071-F.
[49] Lucas T, Flick D, Raoult-Wack AL. Mass and thermal behaviour of the foodsurface during immersion freezing. J Food Eng 1999;41:23e32. https://doi.org/10.1016/S0260-8774(99)00068-0.
[50] Sun Q, Sun F, Xia X, Xu H, Kong B. The comparison of ultrasound-assistedimmersion freezing, air freezing and immersion freezing on the musclequality and physicochemical properties of common carp (Cyprinus carpio)during freezing storage. Ultrason Sonochem 2018. https://doi.org/10.1016/J.ULTSONCH.2018.10.006.
[51] Radchenko NI. On reducing the size of liquid separators for injector circulationplate freezers. Int J Refrig 1985;8:267e9. https://doi.org/10.1016/0140-7007(85)90004-0.
[52] Visser K. Automatic plate freezer development. Int J Refrig 1986;9:367.https://doi.org/10.1016/0140-7007(86)90010-1.
[53] Cao XC, Wan JQ, Song LY. Experimental study of plate freezer with the ejector.Proc Eng 2015;121:1238e44. https://doi.org/10.1016/J.PROENG.2015.09.151.
[54] Estrada-Flores S. Cryogenic freezing of food. Ref Modul Food Sci 2016. https://doi.org/10.1016/B978-0-08-100596-5.03175-9.
[55] Eggerstedt SN, Dietzel M, Sommerfeld M, Süverkrüp R, Lamprecht A. Proteinspheres prepared by drop jet freeze drying. Int J Pharm 2012;438:160e6.https://doi.org/10.1016/J.IJPHARM.2012.08.035.
[56] Barresi AA, Marchisio DL. Computational Fluid Dynamics data for improvingfreeze-dryers design. Data Br 2018;19:1181e213. https://doi.org/10.1016/J.DIB.2018.05.141.
[57] Moerman F, Fikiin K. Hygienic design of air-blast freezing systems. Elsevier;2016. p. 271e316. https://doi.org/10.1016/B978-0-08-100155-4.00020-0.Handb. Hyg. Control Food Ind.
[58] MacLeod CS, McKittrick JA, Hindmarsh JP, Johns ML, Wilson DI. Fundamentalsof spray freezing of instant coffee. J Food Eng 2006;74:451e61. https://doi.org/10.1016/j.jfoodeng.2005.03.034.
[59] Somasundaram S, Tay AAO. A study of intermittent liquid nitrogen sprays.Appl Therm Eng 2014;69:199e207. https://doi.org/10.1016/J.APPLTHERMALENG.2013.11.066.
[60] Huan Z, He S, Ma Y. Numerical simulation and analysis for quick-frozen foodprocessing. J Food Eng 2003;60:267e73. https://doi.org/10.1016/S0260-8774(03)00047-5.
[61] Alhamdan A, Hassan B, Alkahtani H, Abdelkarim D, Younis M. Freezing of freshBarhi dates for quality preservation during frozen storage. Saudi J Biol Sci2018;25:1552e61. https://doi.org/10.1016/J.SJBS.2016.02.003.
[62] Oswald I, Rickert M, Brüggemann G-P, Niehoff A, Fonseca Ulloa CA, Jahnke A.The influence of cryopreservation and quick-freezing on the mechanicalproperties of tendons. J Biomech 2017;64:226e30. https://doi.org/10.1016/J.JBIOMECH.2017.08.018.
[63] Akisaka T, Yoshida H, Hosoi M. Improved preservation of Amoeba proteusultrastructure revealed by quick-freezing followed by freeze-substitution. EurJ Protistol 2000;36:303e15. https://doi.org/10.1016/S0932-4739(00)80006-1.
[64] Bulut M, Bayer €O, Kırtıl E, Bayındırlı A. Effect of freezing rate and storage onthe texture and quality parameters of strawberry and green bean frozen inhome type freezer. Int J Refrig 2018;88:360e9. https://doi.org/10.1016/J.IJREFRIG.2018.02.030.
[65] De Santis L, Coticchio G. Reprint of: theoretical and experimental basis of slowfreezing. Reprod Biomed Online 2011;23:290e7. https://doi.org/10.1016/J.RBMO.2011.07.001.
[66] Bansal P, Fothergill D, Fernandes R. Thermal analysis of the defrost cycle in adomestic freezer. Int J Refrig 2010;33:589e99. https://doi.org/10.1016/J.IJREFRIG.2009.11.012.
[67] N�astase G, Lyu C, Ukpai G, Serban A, Rubinsky B. Isochoric and isobaricfreezing of fish muscle. Biochem Biophys Res Commun 2017;485:279e83.https://doi.org/10.1016/J.BBRC.2017.02.091.
[68] N�astase G, Perez PA, Serban A, Dobrovicescu A, Stef�anescu M-F, Rubinsky B.Advantages of isochoric freezing for food preservation: a preliminary analysis.Int Commun Heat Mass Tran 2016;78:95e100. https://doi.org/10.1016/J.ICHEATMASSTRANSFER.2016.08.026.
[69] Rubinsky B, Perez PA, Carlson ME. The thermodynamic principles of isochoriccryopreservation. Cryobiology 2005;50:121e38. https://doi.org/10.1016/J.CRYOBIOL.2004.12.002.
[70] Szobota SA, Rubinsky B. Analysis of isochoric subcooling. Cryobiology2006;53:139e42. https://doi.org/10.1016/J.CRYOBIOL.2006.04.001.
[71] Bilbao-Sainz C, Sinrod A, Powell-Palm M, Dao L, Takeoka G, Williams T, et al.Preservation of sweet cherry by isochoric (constant volume) freezing. InnovatFood Sci Emerg Technol 2018. https://doi.org/10.1016/J.IFSET.2018.10.016.
[72] Jouhara H, Chauhan A, Nannou T, Almahmoud S, Delpech B, Wrobel LC. Heatpipe based systems - advances and applications. Energy 2017;128:729e54.https://doi.org/10.1016/j.energy.2017.04.028.
[73] Functions AFU. Ansys Fluent Guide 2011:1e39.