Embed Size (px)
Citation preview

ISSN 1520-295X
Experimental and Analytical Studies ofBase Isolation Systems for Seismic Protection
of Power Transformers
by
Nobuo Murota, Maria Q. Feng and Gee-Yu LiuUniversity of California, Irvine
Department of Civil and Environmental EngineeringEngineering Gateway 4139
Irvine, California 92697
Technical Report MCEER-05-0008
September 30, 2005
This research was conducted at the University of California, Irvine, Bridgestone Corporation and theNational Center for Research on Earthquake Engineering, and was supported primarily by the
Earthquake Engineering Research Centers Program of the National Science Foundationunder award number EEC-9701471.

NOTICEThis report was prepared by the University of California, Irvine, Bridgestone Cor-poration and the National Center for Research on Earthquake Engineering as aresult of research sponsored by the Multidisciplinary Center for Earthquake Engi-neering Research (MCEER) through a grant from the Earthquake Engineering Re-search Centers Program of the National Science Foundation under NSF award num-ber EEC-9701471 and other sponsors. Neither MCEER, associates of MCEER, itssponsors, the University of California, Irvine, Bridgestone Corporation or the Na-tional Center for Research on Earthquake Engineering, nor any person acting ontheir behalf:
a. makes any warranty, express or implied, with respect to the use of any infor-mation, apparatus, method, or process disclosed in this report or that such usemay not infringe upon privately owned rights; or
b. assumes any liabilities of whatsoever kind with respect to the use of, or thedamage resulting from the use of, any information, apparatus, method, or pro-cess disclosed in this report.
Any opinions, findings, and conclusions or recommendations expressed in thispublication are those of the author(s) and do not necessarily reflect the views ofMCEER, the National Science Foundation, or other sponsors.

Experimental and Analytical Studies ofBase Isolation Systems for Seismic Protection of
Power Transformers
by
Nobuo Murota1, Maria Q. Feng2 and Gee-Yu Liu3
Publication Date: September 30, 2005Submittal Date: April 5, 2005
Technical Report MCEER-05-0008
Task Number 1.10b
NSF Master Contract Number EEC-9701471
1 Senior Engineer, Department of Seismic Isolation Engineering, Bridgestone Corpora-tion, Japan
2 Professor, Department of Civil and Environmental Engineering, University of Cali-fornia, Irvine
3 Associate Research Fellow, National Center for Research on Earthquake Engineer-ing, Taipei, Taiwan
MULTIDISCIPLINARY CENTER FOR EARTHQUAKE ENGINEERING RESEARCHUniversity at Buffalo, State University of New YorkRed Jacket Quadrangle, Buffalo, NY 14261


iii
Preface
The Multidisciplinary Center for Earthquake Engineering Research (MCEER) is a nationalcenter of excellence in advanced technology applications that is dedicated to the reductionof earthquake losses nationwide. Headquartered at the University at Buffalo, State Univer-sity of New York, the Center was originally established by the National Science Foundationin 1986, as the National Center for Earthquake Engineering Research (NCEER).
Comprising a consortium of researchers from numerous disciplines and institutionsthroughout the United States, the Center’s mission is to reduce earthquake losses throughresearch and the application of advanced technologies that improve engineering, pre-earthquake planning and post-earthquake recovery strategies. Toward this end, the Centercoordinates a nationwide program of multidisciplinary team research, education andoutreach activities.
MCEER’s research is conducted under the sponsorship of two major federal agencies: theNational Science Foundation (NSF) and the Federal Highway Administration (FHWA),and the State of New York. Significant support is derived from the Federal EmergencyManagement Agency (FEMA), other state governments, academic institutions, foreigngovernments and private industry.
MCEER’s NSF-sponsored research objectives are twofold: to increase resilience by devel-oping seismic evaluation and rehabilitation strategies for the post-disaster facilities andsystems (hospitals, electrical and water lifelines, and bridges and highways) that societyexpects to be operational following an earthquake; and to further enhance resilience bydeveloping improved emergency management capabilities to ensure an effective responseand recovery following the earthquake (see the figure below).
-
Infrastructures that Must be Available /Operational following an Earthquake
Intelligent Responseand Recovery
Hospitals
Water, GasPipelines
Electric PowerNetwork
Bridges andHighways
More
Earthquake
Resilient Urban
Infrastructure
System
Cost-
Effective
Retrofit
Strategies
Earthquake Resilient CommunitiesThrough Applications of Advanced Technologies

iv
A cross-program activity focuses on the establishment of an effective experimental andanalytical network to facilitate the exchange of information between researchers locatedin various institutions across the country. These are complemented by, and integrated with,other MCEER activities in education, outreach, technology transfer, and industry partner-ships.
This report presents a comprehensive analysis of the use of base isolation technology for seismicprotection of electric power transformers. The lightweight nature and base displacement constraintsof power transformers require a different philosophy (from buildings and bridges) in designing a baseisolation system. Two isolation systems were developed, one using sliding bearings combined withrubber bearings and the other using segmented high-damping rubber bearings. Tri-axial earthquakesimulator testing was performed using a large-scale transformer model equipped with real bushings.Numerical simulation confirmed that the two isolation systems can perform differently under tri-axial ground motions, even when designed with the same force-displacement hysteresis. Inconclusion, base isolation technology, when properly designed, was shown to be a highly effectivemethod for seismic protection of power transformers.

v
ABSTRACT
This report presents a comprehensive study involving tri-axial earthquake simulator
testing on seismic isolation of electric power transformers. The lightweight nature and base
displacement constraints of power transformers require a different philosophy (from buildings
and bridges) in designing a base isolation system. In this study, two isolation systems were
developed, one using sliding bearings combined with rubber bearings and the other segmented
high-damping rubber bearings. Tri-axial earthquake simulator testing was performed using a
large-scale transformer model equipped with real bushings. Important observations were made
on the seismic responses of the transformer and its bushing. In particular, the vertical component
of the ground motion induced high-frequency response of the bushing when the transformer was
isolated with the sliding isolation system. Numerical simulation confirmed that the two isolation
systems, even designed with the same force-displacement hysteresis, can perform differently
under tri-axial ground motions. This is because the vertical motion changes the friction forces
in the sliding bearings that can excite high modes in the transformer-bushing system.
Furthermore, the effect of the interaction with the bushing connecting cables on the seismic
isolation performance was experimentally evaluated in this study. In conclusion, the base
isolation technology, when properly designed, is a highly effective measure for seismic
protection of power transformers.


vii
ACKNOWLEDGEMENTS
This research was funded by the Multidisciplinary Center for Earthquake
Engineering Research (MCEER). The earthquake simulator testing was carried out at the
National Center for Research on Earthquake Engineering (NCREE) in Taiwan. I would
like to express my greatest appreciation to the engineering staff in NCREE and
Bridgestone Corporation for their generous cooperation.
Finally, I would like to thank Professor Masanobu Shinozuka and Professor
Roberto Villaverde in University of California at Irvine, and Professor Chin-Hsiung Loh
in National Taiwan University for their valuable advice and instructions.


ix
TABLE OF CONTENTS
SECTION TITLE PAGE 1 INTRODUCTION 1 1.1 Background 1 1.2 Conventional Seismic Design of Transformer 6 1.3 Past Studies on Seismic Protection of Transformer 10 1.4 Base Isolation for Seismic Protection of Transformer 11 1.5 Research Objectives 12 1.6 Organization of Technical Report 14
2 DESIGN OF BASE ISOLATION SYSTEMS FOR POWER TRANSFORMERS 2.1 Overview 15 2.2 Conventional Base Isolation System 16 2.3 Mechanism of Rubber Bearing 17 2.4 Design of Rubber Bearing 22 2.4.1 Preliminary Design Based on Stiffness Requirement 22 2.4.2 Prediction of Ultimate Capacity of Rubber Bearing 26 2.5 Base Isolation System for Lightweight Structure 30 2.5.1 Sliding Bearing 30 2.5.2 Segmented Rubber Bearing 33 2.6 Proposed Design Procedure of Isolation System for Transformer 33 3 EARTHQUAKE SIMULATOR TEST/PHASE-1 47 3.1 Overview 47 3.2 Experimental Setup 47 3.2.1 Earthquake Simulator 47 3.2.2 Transformer Model 47 3.2.3 Porcelain Bushing 49 3.2.4 Instrumentation 51 3.3 Combined Sliding-Rubber Bearing Isolation System 53 3.3.1 Low-Damping Rubber Bearing 53 3.3.2 Sliding Bearing 55 3.3.3 Design Performance 59 3.3.4 Preliminary Performance Test 60 3.4 Testing Program 61 3.5 Dynamic Characterization of Transformer Model and Bushing 65 3.6 Test Results 67 3.6.1 Uni-Axial Shaking 67 3.6.1.1 Response of Transformer/Bushing System 67 3.6.1.2 Performance of Isolation System 69 3.6.2 Bi-Axial Shaking 83 3.6.3 Tri-Axial Shaking 84 3.7 Summary 85

x
TABLE OF CONTENTS (Cont’d)
SECTION TITLE PAGE 4 EARTHQUAKE SIMULATOR TEST/PHASE-2 97 4.1 Overview 97 4.2 Experimental Setup 97 4.2.1 Transformer Model 97 4.2.2 Porcelain Bushing 97 4.3 Segmented High-Damping Rubber Bearing Isolation System 99 4.4 Flexible Rubber Ring 101 4.5 Testing Program 103 4.6 Dynamic Characterization of Transformer Model and Bushing 107 4.7 Test Results 108 4.7.1 Uni-Axial Shaking 108 4.7.1.1 Response of Transformer/Bushing System 108 4.7.1.2 Performance of Isolation System 109 4.7.2 Bi-, and Tri-Axial Shaking 111 4.8 Summary 111
5 NUMERICAL ANALYSIS 131 5.1 Overview 131 5.2 Mathematical Model of the System 131 5.3 Numerical Expression of Isolator Characteristics 134 5.3.1 Friction Force of Sliding Bearing 134 5.3.2 Restoring Force Characteristics
of High-Damping Rubber Bearing 136 5.4 Comparison with Phase-1 Test Results 137 5.5 Study on Amplification in Bushing-Response under
Phase-1 Tri-axial Shaking 139 5.5.1 Response under Sinusoidal Wave Input 139 5.5.2 Response under Earthquake Input 141 5.6 Comparison with Phase-2 Test Results 162 5.7 Case Study of Existing Transformer/Bushing System 163 5.8 Summary 171
6 CONCLUSIONS 191 6.1 Background 191 6.2 Conclusions 191
7 REFERENCES 193 APPENDIX A ADDITIONAL TEST RESULTS 197

xi
LIST OF ILLUSTRATIONS
FIGURE TITLE PAGE 1-1 Number of Residence Experiencing in Power Cuts after Kobe Earthquake 3 1-2 Damage of Electric Equipment in Substations 4 1-3 Transformers in Electric Substation 5 1-4 Porcelain Bushing 7 1-5 Qualification Test of Bushing and Spectra for Required Response Spectrum (IEEE 693-1997) 8 1-6 Task-Flow of Research 13 2-1 Laminated Rubber Bearing 20 2-2 An Example of Hysteresis Curve of High-Damping Rubber Bearings 20 2-3 Relationship of Shear Modulus and Equivalent Damping Ratio versus Shear Strain 21 2-4 Definition of Bi-Linear Model for Isolators 23 2-5 Overlapped Effective Area of Rectangular Type Bearing at Displacement X [2-8] 23 2-6 Design Diagram for Ultimate Properties of Isolators 30 2-7 Sliding Bearing 31 2-8 Sliding Velocity Dependency of Friction Coefficient: Compressive Stress =12(MPa), Confined PTFE 32 2-9 Compressive Stress Dependency of Friction Coefficient: Velocity = 200(mm/sec), Confined PTFE 32 2-10 Segmented Rubber Bearings 34 2-11 Equivalent Linearization Analysis of Base-isolated Transformer/ Bushing System 35 2-12 Iteration-Flow for Computation of Response Displacement 40 2-13 Relationship of Transit Line and Capacity Curve 41 2-14 Relationship of Fundamental Period and Response Acceleration 42 2-15 Relationship of Fundamental Period and Response Displacement 42 2-16 Response Spectrum of Artificial Wave: ArtT-R1, Art-NY, and Art-KT 43 2-17 Time History Record of Artificial Wave: Art-R1, Art-NY, and Art-KT 44 2-18 Comparison of the Results by EQLM and Time-history Analysis 45 3-1 Earthquake Simulator in NCREE, Transformer Model and Bushing 48 3-2 Characteristics of Porcelain Bushings 50 3-3 Layouts of Sliding Bearings and Rubber Bearings 52 3-4 Low-Damping Rubber Bearing 54 3-5 Sliding Bearing 57 3-6 Response Spectrum of Input Ground Motion 62

xii
LIST OF ILLUSTRATIONS (Cont’d)
FIGURE TITLE PAGE 3-7 Dynamic Characterization Test of Bushings 66 3-8 Time History of Transformer Response Acceleration: 161kV/El Centro/x375 71 3-9 Time History of Bushing Response Acceleration: 71 161kV/El Centro/x375 3-10 Time History of Transformer Response Acceleration: 161kV/Kobe/x375 72 3-11 Time History of Bushing Response Acceleration: 161kV/Kobe/x375 72 3-12 Response Acceleration vs. Peak Ground Acceleration in 161kV/El Centro/Uni-Axial Shaking 73 3-13 Response Acceleration vs. Peak Ground Acceleration in 161kV/Northridge/Uni-Axial Shaking 73 3-14 Response Acceleration vs. Peak Ground Acceleration in 161kV/Kobe/Uni-Axial Shaking 74 3-15 Maximum Response Acceleration: 161kV/Northridge/x375 75 3-16 Maximum Response Acceleration: 161kV/Kobe/x375 75 3-17 Maximum Response Displacement: 161kV/Northridge/x375 76 3-18 Maximum Response Displacement: 161kV/Kobe/x375 76 3-19 FFT Analysis of Response Acceleration in 161kV/El Centro/x375 77 3-20 Distribution of Response Acceleration at Bushing, 161kV/Kobe/x375 78 3-21 Change of Vertical Load on Sliding Bearings: 161kV/B/Kobe/x375 79 3-22 Maximum Response Acceleration: 69kV/Northridge/x375 80 3-23 Maximum Response Acceleration: 69kV/Kobe/x375 80 3-24 Force-Displacement Curve of Sliding Bearing: 161kV/B/Kobe/x500 81 3-25 Force-Displacement Curve of Low-damping Rubber Bearing: 161kV/B/Kobe/x500 81 3-26 Total Force-Displacement Curve of Isolation System in 161kV/B/Kobe/x375 82 3-27 Correlation between Response Acceleration under Uni- and Bi-Axial Shaking 86 3-28 Force-Displacement Curve of Sliding Bearing and Low-Damping Rubber Bearing under Bi-axial Shaking: 161kV/B/Kobe/xy375, x-dir., W-N, W-S 87 3-29 Comparison of Experimental and Analytical Force-Displacement Curves of Sliding Bearing 88 3-30 Total Force-Displacement Curve under Bi-Axial Shaking: 161kV/B/Kobe/xy375 89 3-31 Locus of Center at Transformer Bottom under Bi-Axial Shaking: 161kV/B/Kobe/xy375 89

xiii
LIST OF ILLUSTRATIONS (Cont’d)
FIGURE TITLE PAGE 3-32 Response Acceleration at the Top of 161kV Bushing under Tri-Axial Shaking: 161kV/B/Northridge/xyz375, x-dir. 90 3-33 Comparison of Maximum Response Acceleration in Uni-, Bi-, and Tri-Axial Shaking: 161kV/B/Northridge/x, xy, xyz375 91 3-34 Comparison of Maximum Response Acceleration in Uni-, Bi-, and Tri-Axial Shaking: 161kV/B/Kobe/x, xy, xyz375 91 3-35 Comparison of Maximum Response Acceleration in Uni-, Bi-, and Tri-Axial Shaking: 161kV/B/El Centro/x, xy, xyz375 92 3-36 Correlation between the Response Accelerations under Bi- and Tri-Axial Shaking 93 3-37 Comparison of the Vertical Load on Sliding Bearing under Bi- and Tri-Axial Shaking 94 3-38 Force-Displacement Curve of Sliding Bearing under Bi- and Tri-Axial Shaking: 69kV/B/Northridge/xy375, xyz375, x-dir. 95 4-1 Test Set-Up of Phase-2 Testing 98 4-2 Segmented High-Damping Rubber Bearing 100 4-3 Flexible Rubber Ring 102 4-4 Response Spectrum of Artificial Wave: N-S and E-W Components of Art-693 105 4-5 Dynamic Identification Test Results of Bushing with/without Flexible Rubber Ring 112 4-6 Time Histories of Response Acceleration in RB/Art-693/x375 113 4-7 Time Histories of Response Acceleration in RF/Art-693/x375 114 4-8 Normalized Fourier Amplitude of RB/Art-693/x375 115 4-9 Normalized Fourier Amplitude of RF/Art-693/x375 116 4-10 Normalized Fourier Amplitude of FB/Art-693/x375 117 4-11 Normalized Fourier Amplitude of FF/Art-693/x375 118 4-12 Maximum Response Acceleration in Art-693 and Kobe 119 4-13 Maximum Response Acceleration and Displacement at each Measurement Point: Chi-Chi/x375 120 4-14 Maximum Response Acceleration and Displacement at each Measurement Point: Art-693/x375 121 4-15 Maximum Response Acceleration and Displacement at each Measurement Point: Kobe/x375 122 4-16 Shear Force-Horizontal Displacement Relationship of Bushing with Rubber Ring: RB/Kobe/x375 123 4-17 Force-Displacement Curve of Isolation System in RB/Art-693/x375 124 4-18 Force-Displacement Curve of Isolation System in RB/Kobe/x375 124 4-19 Load History Dependence of High-damping Rubber Bearing 125 4-20 Force-Displacement Curve of SHRB in RB/Kobe/x375 126

xiv
LIST OF ILLUSTRATIONS (Cont’d) FIGURE TITLE PAGE 4-21 Vertical Load Change of each SHRB in FB/Kobe/x375 127 4-22 Comparison of Maximum Response Acceleration in Uni-, Bi-,
and Tri-Axial Shaking: RB/Art-693, and RB/Chi-Chi 128 4-23 Comparison of Force-Displacement Curve under x-, and xz-Shaking 129 4-24 Comparison of Force-Displacement Curve of
Slider System (Phase-1) and SHRB System (Phase-2) 130 5-1 Numerical Model of Transformer/Bushing System
in Phase-1 and -2 132 5-2 Comparison of Test Results and Numerical Simulation: 161kV/F/El Centro/x375, Fixed-Base System 144 5-3 Comparison of Test Results and Numerical Simulation: 161kV/F/Kobe/x375, Fixed-Base System 145 5-4 Comparison of Test Results and Numerical Simulation: 161kV/F/Northridge/x375, Fixed-Base System 146 5-5 Comparison of Test Results and Numerical Simulation: 161kV/B/El Centro/x375, Base-Isolated System 147 5-6 Comparison of Test Results and Numerical Simulation: 161kV/B/Kobe/x375, Base-Isolated System 148 5-7 Comparison of Test Results and Numerical Simulation: 161kV/B/Northridge/x375, Base-Isolated System 149 5-8 Force-Displacement Curve of Isolation System:
161kV/B/El Centro/x375 150 5-9 Force-Displacement Curve of Isolation System:
161kV/B/Kobe/x375 151 5-10 Comparison of Test Results and Numerical Simulation: 161kV/B/Kobe/xy375, Base-Isolated System 152 5-11 Comparison of Test Results and Numerical Simulation: 161kV/B/Northridge/xy375, Base-Isolated System 153 5-12 Force-Displacement Curve of Isolation System:
161kV/B/Northridge/xy375 154 5-13 Comparison of Test Results and Numerical Simulation: 161kV/B/Kobe/xyz375, Base-Isolated System 155 5-14 Comparison of Test Results and Numerical Simulation: 161kV/B/Northridge/xyz375, Base-Isolated System 156 5-15 Force-Displacement Curve of Isolation System:
161kV/B/Kobe/xyz375 157 5-16 Simplified Model for Parametric Study 158 5-17 Sinusoidal Wave Input in Horizontal and Vertical Direction 158 5-18 Comparison of Response Acceleration under x-, and xz-Shaking 159 5-19 Relationship of Bushing Natural Frequency in Horizontal Direction and Maximum Response Acceleration in x-direction 160

xv
LIST OF ILLUSTRATIONS (Cont’d)
FIGURE TITLE PAGE 5-20 Relationship of System Natural Frequency in Vertical Direction and Maximum Response Acceleration in x-direction 160 5-21 Relationship of Friction Coefficient versus Maximum Response Acceleration and Maximum Response Displacement 161 5-22 Numerical Model (Bi-Linear Model) of SHRB defined from Test Results: FB/Kobe/x375 173 5-23 Comparison of Test Results and Numerical Simulation: RF/Art-693/x375 174 5-24 Comparison of Test Results and Numerical Simulation: FB/Art-693/x375 175 5-25 Comparison of Test Results and Numerical Simulation: FB/Kobe/x375 176 5-26 Comparison of Test Results and Numerical Simulation: RB/Art-693/x375 177 5-27 Comparison of Test Results and Numerical Simulation: RB/Kobe/x375 178 5-28 Comparison of Force-Displacement Curves in Test Results
and Numerical Simulation: FB/Art-693/x375 179 5-29 Comparison of Force-Displacement Curves in Test Results
and Numerical Simulation: RB/Kobe/x375 180 5-30 Comparison of Test Results and Numerical Simulation: RB/Art-693/xy375, x-dir. 181 5-31 Comparison of Force-Displacement Curves in Test Results
and Numerical Simulation: RB/Art-693/xy375, x-dir. 182 5-32 Comparison of Force-Displacement Curves in Test Results
and Numerical Simulation: RB/Kobe/xy250, x-dir. 183 5-33 Case Study: 220kV/500kV Transformer and Numerical Model 184 5-34 Time Histories of Fixed-Base System: Art-693 x0.5gz0.4g 185 5-35 Time Histories of Base-Isolated System: Art-693 x0.5gz0.4g 186 5-36 Maximum Response Acceleration at each Node in Fixed-Base, Base-Isolated/SHRB, and Base-Isolated/Slider System:
Art-693 x0.5gz0.4g 187 5-37 Comparison of Response Acceleration in Sliding Bearing System
with Friction Coef.=0.073 and 0.03: Art-693 x0.5gz0.4g 188 5-38 Comparison of Force-Displacement Curves in Sliding System with
Friction Coef.=0.073 and 0.03: Art-693 x0.5gz0.4g 189 A-1 Cable-Connected Base-Isolated Transformer Model 200 A-2 Geometry of the Test Setup 200 A-3 An Aluminum Strand Cable: Class AA / 37×4.079 mm dia. 201 A-4 Maximum Response Acceleration at each Measurement Point in the Fixed-Base and the Base-Isolated System 201

xvi
LIST OF ILLUSTRATIONS (Cont’d)
FIGURE TITLE PAGE A-5 Maximum Response Acceleration at each Measurement Point in the Base-Isolated System 202 A-6 Maximum Response Displacement at each Measurement Point in the Base-Isolated System 202 A-7 Normalized Fourier Amplitude at Bushing Top and Pole Top in Base-Isolated System under Art/x375 203

xvii
LIST OF TABLES
TABLE TITLE PAGE 1-1 Major Damage in Substations during Kobe Earthquake 2 1-2 Comparison of Standard for Seismic Evaluation of Facilities in Substation in Several Countries (JESC E00001 (1999)) 9 3-1 Specification of Earthquake Simulator in NCREE 49 3-2 Symbols of Measurement Instruments for Acceleration and Displacement 51 3-3 Symbols of Measurements in Load Cells Installed 53 3-4 Dimensions and Properties of Rubber Bearings 56 3-5 Physical Properties of Rubber Compound for Rubber Bearing 56 3-6 Dimensions and Properties of PTFE Disc 58 3-7 Dimensions and Properties of Rubber Pad for Sliding Bearing 58 3-8 Physical Properties of Rubber Compound for Sliding Bearing 59 3-9 Physical Properties of PTFE Material for Sliding Bearing 59 3-10 Design Parameter Values of Isolation System 60 3-11 Initial Performance Test of Rubber Bearing 61 3-12 Target PGA of Earthquake Simulator Testing in Phase-1 64 3-13 Dynamic Characteristics of Transformer Model and Bushings 65 3-14 Friction Coefficient and Surface Pressure on Sliding Bearing 70 3-15 Total Performance of Isolation System 70 4-1 Design Properties of Segmented Rubber Bearings 99 4-2 Design Parameters of Flexile Rubber Ring 103 4-3 Constant Stress Scale of Testing 103 4-4 Target PGA of Earthquake Simulator Testing in Phase-2 106 4-5 Dynamic Identification Test Results 107 5-1 Comparison of Test Results and Numerical Simulation in Fixed- Base System in Uni-Axial Shaking 138 5-2 Maximum Response Acceleration of Test Results and Numerical Simulation of Base-Isolated System in Uni-Axial Shaking: Phase-1 138 5-3 Maximum Response Acceleration of Test Results and Numerical Simulation of Base-Isolated System in Bi-Axial Shaking: Phase-1 139 5-4 Maximum Response Acceleration of Test Results and Numerical Simulation of Base-Isolated System in Tri-Axial Shaking: Phase-1 139 5-5 Maximum Response Acceleration under Sinusoidal Wave Input 140 5-6 Cases of Parametric Study 141 5-7 Maximum Response Acceleration of Test Results and Numerical Simulation in Ui-Axial Shaking: Phase-2 163 5-8 Material Constants of Beam Element 164 5-9 Geometric Properties of Beam Element 164

xviii
LIST OF TABLES (Cont’d)
TABLE TITLE PAGE 5-10 Stiffness of Rotation Spring 165 5-11 Characteristics of Element Bearing of SHRB 165 5-12 Summary of Time History Analysis : Art-693:PGA x0.5g + z0.4g 167 5-13 Summary of Time History Analysis in Fixed-Based,
SHRB System, and Sliding Bearing System: x0.5g z0.4g Shaking 168 5-14 Comparison of Results of Slider System under x-, and xz-Shaking:
Art-693 169 5-15 Effect of Friction Coefficient to Response of
Transformer/Bushing System 170 5-16 Simulation Results with Rubber Ring/Fixed-Base:
Tri-Axial Shaking x0.5gz0.4g 170 A-1 Program of Additional Testing 198

1
SECTION 1
INTRODUCTION
1.1 Background
Recent major earthquakes have significantly damaged many electrical power networks that are
important to the delivery of electric power to tens of thousands of people in urban areas.
Examples of these destructive earthquakes include: the 1994 Northridge earthquake in the United
States, the 1995 Kobe (Hyogo-ken Nanbu) earthquake in Japan, the 1999 Izmit earthquake in
Turkey, and the 1999 Chi-Chi earthquake in Taiwan. The seismic damage to electrical power
facilities and their impacts are shown in Table 1-1, Figure 1-1, and Figure 1-2. While the
duration of system disruption was relatively short to moderate (one day for Northridge; three
days for Kobe; and two weeks for Chi-Chi), the estimated direct losses were reported to be in the
hundreds of millions of dollars for each event. For example, the Los Angeles Department of
Water and Power (LADWP) reported that following the Northridge earthquake, LADWP
expended approximately $10.4 million to clean up debris, replace damaged equipment, and
restore operations at its transmission-level facilities following the Northridge earthquake. In
addition to the clean-up and repair costs, LADWP experienced revenue loss when the system
went black following the earthquake. The net operational losses for LADWP’s electrical system
in a blackout condition average about $4.4 million per day. Furthermore, loss of power
immediately after an earthquake can disrupt emergency response and recovery operations for the
affected region. Thus power utilities are interested in ways to minimize, if not eliminate,
earthquake damage and disruption to their systems (Shinozuka).
Since expensive substations are key facilities of electrical power networks, there needs to be a
way to protect them from earthquakes. In fact, many of them are extremely vulnerable to seismic
damage because they were designed to much lower seismic standards. Because transformers
represent crucial substation equipment, the loss of their functionality can be devastating to the
entire power system. For example, immediately following the 1994 Northridge and the 1995
Kobe earthquakes, many power transformers suffered severe damage and lost operation because

2
of damage to the porcelain bushings, which are usually mounted on the top of the transformer
(Shinozuka, 1995; Pansini 1998).
The power transformer is a device, without moving parts, which transfers electric power from
one circuit to another by electromagnetic means. Typically, both the voltage and current undergo
changes between the circuits. The size, shape, and installation of the transformer vary according
to the voltage it handles, as shown in Figure 1-3. The basic components of a transformer are
coils, an iron or steel core, a tank, oil, and bushings. The coils and the core are usually enclosed
in the steel tank to protect it from vandalism and for safety purposes. The oil is usually placed in
the tank to cover the coils and the core to provide cooling. Bushings take the terminals of the
coils through the tank, insulating them from the tank, as shown in Figure 1-4. These typically
consist of a conductor through an insulating collar, usually made of porcelain. For higher
voltages, the porcelain cylinders may also be filled with oil or contain layers of insulation with
metal foil inserted between them to equalize electric stresses among the layers.
Table 1-1 Major Damage in Substations during Kobe Earthquake
Equipment Number of damage
Transformer 52
Disconnect switch 10
Condenser 4
Breaker 41
Lightning arrester 15
Some of the modes of failure in a transformer system during an earthquake include anchorage failure that can cause ripping of the transformer case and oil leakage and/or foundation failure causing rocking and tilting. An unanchored transformer sometimes causes an overturning of an entire transformer system during a severe earthquake. On the other hand, the tightly fixed

3
Figure 1-1 Number of Residence Experiencing Power Cuts after Kobe Earthquake
0
50
100
150
200
250
300
0 50 100 150 200
Tim e after earthquake shock (hour)
Number of electricity break (x1
0000)

4
Broken arresters at the Itami Substation [ An EQE Summary Report, 1995]
Damage to Transformer in Izmit Substation [EERI,1999]
Figure 1-2 Damages in Electrical Equipments in Substations

5
Figure 1-3 Transformers in Electric Substation

6
anchorage system may cause fatal damage in internal elements of the transformers by the high
impact forces that are transmitted.
Another type of damage frequently occurs in a transformer system is the failure of porcelain
bushings mounted on the transformer. The frequency usually varies from 3 to 15 (Hz) and may
sometime cause large amplification in its response acceleration during earthquake. The failures
on bushings include oil leakage from connection-interface of transformer and bushing or fracture
of porcelain body. The porcelain is a brittle material and has almost no energy-absorbing
capabilities, and the damage in the bushing will occur at the mounting-end of bushing by stress
concentration, uplift of porcelain body, slip of gasket, caused by the inertia force as a results of
high response acceleration during earthquake.
1.2 Conventional Seismic Design of Transformer
Since transformer bushings form an integral part of power transmission and distribution systems,
their structural and electrical integrity are critical to maintaining power transmission. To mitigate
the damage in transformer system and other electrical substation equipment, representatives from
electrical utilities and equipment manufacturers, together with consulting engineers and members
of the academic community jointly developed a new national standard, IEEE 693-1997. These
requirements are expected to improve the seismic capability of substation equipment and provide
the guidelines for seismic testing and qualification of bushings. In IEEE 693-1997, the bushings
for 161-kV and larger must be qualified using earthquake simulator testing in which the input
motion shall match the specified Required Response Spectrum shown in Figure 1-5. Three types
of earthquake simulator testing are identified in IEEE 693-1997: 1) time-history shake table test;
2) resonant frequency search; and 3) sine-beat testing. Time history records of input motion for
the shake table test shall match the specified response spectrum. In IEEE 693-1997, three
seismic performance levels (PL) are specified -- High, Moderate, and Low. Each level is defined
by response spectrum with 2, 5, and 10% damping. Corresponding peak ground acceleration of
the spectrum of each levels are, 1.0g, 0.5g, and 0.25g for the horizontal direction, and 0.8g, 0.4g,
and 0.2g for the vertical direction. However, IEEE 693-1997 also stated that because testing
under the specified performance level is often impractical and not cost effective, it may be

7
( Figure from Gilani Amir S. et al. (1999))
Figure 1-4 Porcelain Bushing
Flange
Condensor
Center Core

8
(Photo from [1-10])
10-1
100
101
102
0
0.2
0.4
0.6
0.8
1
1.2
1.4
1.6
1.8
Frequency (Hz)
Re
spo
nse
Sp
ect
ra, A
cce
lera
tion
(g)
2%
5%
10%
20%
Figure 1-5 Qualification Test of Bushing and Spectra for Required Response Spectrum (IEEE 693-1997)

9
substituted by the shaking of one-half of PL. The test results shall be evaluated with a safety
factor of two against the requirements of PL. The reduced response spectrum of 0.5 x PL is
designated High-, and Moderate-Required Response Spectrum as shown in Figure 1-5.
In Japan, JEAG 5003 (1999) specified the required procedure to evaluate the seismic
performance of transformer/bushing system. The specified seismic-level of the ground motion is
0.5g in horizontal and 0.3g in vertical direction. The required test for the bushing is a resonant
sine wave shaking test. A shaking table test is optional, and the actual site-record shall be applied
(compare to the artificial wave specified in IEEE 693). A comparison of the design requirements
in IEEE 693-1997, JEAG 5003, and IEC68-3-3 (European code) is summarized in Table 1-2.
Table 1-2 Comparison of Standard for Seismic Evaluation of Facilities in Substation in Several Countries (JESC E0001 (1999))
JEAG 5003
(1999) IEEE 693 (1997) IEC 68-3-3 (1991)
Method Tests or Analysis Tests or Analysis Tests Voltage class. N/A X X Seismic- performance class. N/A X X
Design-level class. N/A X General Specific
Frequency range
0.5 to 10 Hz; <0.5, >10Hz is tested by 0.5 or 10 Hz
1 to 33 Hz 1 to 35 Hz 1 to 35 Hz
Seismic-intensity Class. N/A Low Mid. High Low Mid High Low Mid. High
Hor. 0.3g, or 0.5g at pocket end
0.25 0.5 0.2 0.3 0.5 0.2 0.3 0.5 Input level (g) Ver. 0.15g, or 0.5g at
pocket end 0.2 0.4 0.1 0.15 0.25 0.1 0.15 0.25
Input point Low end of frame or bushing-pocket
Low end of frame (equipment)
Low end of frame (equipment)
Low end of frame (equipment)
Input direction Uni-Axial. If required, Bi-Axial (x,z.).
Tri- or Bi-Axial *In Bi-Axial (x,z),
intensity x 2
Uni-Axial :desired *Multi-Axial is not recommended
Uni- or Multi-Axial *In Bi-Axial (x,z),
intensity x 2
Sine 3 Resonance-sine waves
10 cycle/beat (only discont.-sw.)
Sine-Sweep Sine-Beat
Sine-Beat Continuous sine Input
wave form Random Actual e.q.record Art-Wave matching
RRS Art-Wave matching RRS
Art-Wave matching RRS
Dynamic analysis Time history Modal analysis
R-spectrum anls. Modal analysis

10
1.3 Past Studies on Seismic Protection of Transformer
Wilcoski (1997) conducted seismic qualification and fragility testing of a 500-kV transformer
bushing by using the shaking table test to determine the dynamic characteristics of the bushing,
to qualify the bushing to the IEEE 693-1997 spectrum anchored at 0.5g, and to define the
capacity of bushings. A fundamental frequency of approximately 6 Hz and a damping ratio of
between 2 to 3 % of critical were reported. During the fragility test, when the 2% IEEE 693-1997
response spectrum is matched with a PGA of 1.0g, the bushing leaked oil.
Villaverde (1999) conducted field-testing and analytical study of 230-kV and 500-kV bushings
mounted on transformers. The objectives of the studies were to evaluate the dynamic
characteristics of the transformer-bushing systems and to compute the amplification between the
accelerations at the bushing flange and the ground as a result of the flexibility of the transformer
tank and the turrets to which the bushings were attached. For the 230-kV bushings, a
fundamental frequency of approximately 6Hz and a damping ratio of 2% of critical were
reported. For the 500-kV bushings, a fundamental frequency of between 3 to 4 Hz and a damping
ratio of between 2 and 4 % of critical were reported.
The seismic testing and evaluation of two 196-kV and three 550-kV bushings was carried out at
the University of California at Berkeley (Gilani Amir, 1999). The objectives of the studies were
to compute the dynamic properties of the bushings, to qualify the bushings to the IEEE 693-1997
required response spectrum, and to characterize the seismic performance of the bushings. For the
196-kV bushings, fundamental frequencies of between 14 and 16 Hz and damping ratios of
between 2 to 4 % of critical were measured. For the 550-kV bushings, fundamental frequencies
of approximately 8 Hz and damping ratio of between 3 to 4 % of critical were measured. None of
the three 550-kV bushings met the IEEE 693-1997 requirements of the moderate-level
qualification (target PGA equal to 1.0g). When subjected to severe shaking, all three bushings
experienced oil leakage at the gasket connection and slip of the upper porcelain unit over the
flange.

11
Bonacina (1995) and Serino (1995) performed several feasibility studies of base isolation for
substation facilities by numerical simulation. Practical design examples of base isolation system
for 170-kV gas-insulated substations were introduced. Two types of isolation systems were
studied: 1) a high damping rubber bearing system (HRB) and 2) helical spring devices with
viscous dampers (HS+VD) system. The designed isolation period of each system varied in the
range of 1.5 to 2.0 seconds and 8% to 20% damping ratios. The response displacements were in
the range of 17 to 19 centimeters. The effectiveness of the systems was demonstrated. Fujita
(1984 and 1985) made experimental and analytical study on the base isolation of heavy weight
equipment such as power transformers. This study mainly focused on the development of
isolation devices. The research was carried out in early application stage of base isolation in
Japan. However, the study did not cover the interaction of the porcelain bushing mounted on top
of those facilities. Their test-frame did not contain any bushings.
1.4 Base Isolation for Seismic Protection of Transformer
The base isolation technology has gained popularity in the recent decade as one of the
rehabilitation measures for seismic protection of structures. This is especially true in Japan,
where over 1000 base-isolated buildings have been constructed or are under construction since
the 1995 Kobe earthquake. Many types of isolation systems have been developed, such as high-
damping rubber bearing systems, lead-rubber bearing systems, systems of low-damping bearing
combined with dampers, and sliding bearing systems. The fundamental period and displacement
of such base-isolated buildings are generally over 3.0 seconds and over 300 mm. The reduction
of response acceleration to the ground motion is less than 30%. Some of the applications of base
isolation include bridges, LNG tanks, warehouses, nuclear plants, and other industry facilities.
The first application of an electric facility was the high-voltage condenser system in Haywards,
New Zealand, in 1988 (Skinner, 1993). The isolation system consists of low-damping rubber
bearings and steel dampers. The bearings are 400 mm x 400 mm in plane dimensions and 254
mm in total height. The load-sustaining capacity of the bearing is 5,000 kgf. The system shifted
the effective period from 0.2 second in the fixed-base system to 1.8 seconds. A major difference
of design requirements between base isolation of conventional structures and electric facilities
(i.e. transformer/bushing system) are the lightweight structure that makes it difficult to make

12
long period-shifting. When a base isolation scheme is planned for a transformer/bushing system,
the goal is to protect the transformer and the porcelain bushing that makes up only a few
percentage of the entire weight. The small mass of the bushing is sensitive to high-mode
frequency even with a small-amplitude acceleration.
1.5 Research Objectives
The objective of this research is to develop a new methodology for seismic protection of power
transformer/bushing systems by application of modern base isolation schemes by performing
comprehensive analytical and experimental study. Tri-axial earthquake simulator testing with a
large-scale model was used for the first time in this field. Design of a base isolation system for
the transformer/bushing system presents a unique challenge for the following two reasons.
1. The entire mass of the system is much lighter than a building, making it difficult to
lengthen the natural period.
2. The base isolation system should reduce the response acceleration of the bushing
and transformer without resulting in a large base displacement. A large
displacement is not desired considering the interaction with the cable-connected
other facilities.
A task flowchart of this research project is shown in Figure 1-6. First, tri-axial earthquake
simulator testing was conducted. The testing program was part of a joint research project
between MCEER and the National Center of Research on Earthquake Engineering (NCREE) in
Taipei, Taiwan, and the earthquake simulator test was conducted at NCREE. A large-scale 2 m x
2 m x 1.8 m transformer model with a bushing, together with two types of isolation systems were
designed and manufactured for the project. Actual porcelain bushings of 161-kV and 69-kV sizes
were used in the testing. Two types of isolation systems, one using sliding bearings combined
with rubber bearings and the other segmented high-damping bearings, were developed in this
project. The testing program was classified into two phases by the type of isolation system.
Phase-1 tested the isolation system consisting of sliding bearings and low-damping rubber
bearings, while Phase-2 tested a segmented high-damping rubber bearing (SHRB) system.

13
I. Phase-1 Testing: ( Aug. 1999 ~ Sep. 1999) 1. Isolation System : 4xSliding bearings + 2xLow damping rubber bearings 2. Transformer Model and Bushing:
235.5 kN Frame-structure with counter weight 161kV & 69kV bushings
3. Ground Motion : 1940 El Centro, 1994 Northridge (Sylmar), 1995 Kobe (Takatori)
II. Phase-2 Testing: ( Jan.2002 )
1. Isolation System : 4x Segmented High-damping Rubber Bearings (SHRB)
2. Transformer Model and Bushing: 145kN Frame-structure with counter weight 161kV Bushing Rubber Ring to elongate the period of bushing
3. Ground Motion : 1994 Northridge (Sylmar), 1995 Kobe (Takatori) 1999 Chi-Chi, Artificial wave- ART 693
III. Analytical Study 1. Numerical Model Calibrated by test results in Phase-1, and
Phase-2 2. Parametric Study :
Effect of bushing mass, natural frequency, stiffness 3. Case Study: Numerical simulation of existing transformer with/without
base isolation
Figure 1-6 Task-Flow of Research

14
Next, numerical study of the base-isolated transformer/bushing system was conducted. A
simplified mathematical model of the base-isolated transformer/bushing was proposed, where the
properties of the isolation system were expressed as non-linear functions. The model was
calibrated by the Phase-1 and -2 tests. Finally, the results of experimental and analytical study
were reviewed and the effectiveness of the base isolation as the measure of seismic protection of
transformer/bushing system was discussed.
1.6 Organization of Technical Report
This report is organized into six sections. Section 2 contains an introduction followed by a
review of the design procedure for base isolation systems. Section 3 and 4 discuss the earthquake
simulator testing of Phases -1, and -2 including the base isolators, transformer and bushing
model, test setup, test programs, and test results. Section 5 presents numerical analysis of base-
isolated transformer system, including comparison with the test results and case studies. Finally,
Section 6 provides a summary and conclusions of the research. Appendix A presents additional
earthquake simulator test results of transformer/bushing system that includes the bushing
electrical connection interaction.

15
SECTION 2 DESIGN OF BASE ISOLATION SYSTEMS
FOR POWER TRANSFORMERS
2.1 Overview
In this chapter, the concept of base isolation for transformer/bushing system is proposed. Since
the transformer is light compared to a building, it requires a different engineering approach. A
large 500-kV transformer can weigh 2400 kN. If four isolators are installed beneath the corner
of the transformer-bottom, the weight per isolator is only 600 kN. The diameter of the rubber
bearing for 600 kN is estimated at about 400 mm. Generally, the target period of base isolation is
over 2.0 seconds and, as a result, displacement for design-basis earthquake (DBE) will reach
more than 300 mm. Under the maximum credible earthquake (MCE), the displacement is
usually more than 400 mm, and a bearing with 400 mm diameter will loose its stability.
Therefore, displacement should be repressed to a certain level by control of period shifting and
increase of damping. Actually, the large displacement is not desired for those electric facilities
considering interaction in interconnected equipment in the substation system. On the other hand,
the reduction of response acceleration is not required to such a level as required in general base
isolation. The aim is not to protect the human life or valuable properties inside building but to
protect transformers and porcelain bushings from fracture by overturning or over-stress. Based
on the above discussion, the design philosophy of a base-isolation plan for the facilities in the
substation is summarized as follows:
1. The response acceleration of transformer and bushing shall be reduced.
2. Large displacement is not desirable.
3. Reduction of the acceleration may be smaller than that of base-isolation design for a
conventional structure.
The design basis of a base-isolation system for the transformer/bushing is discussed in the
following section by showing some design examples and analyses.

16
2.2 Conventional Base Isolation System
Base isolation is an aseismic design concept to reduce the seismic force transmitted to the
structure by supporting it with a flexible element at the base to elongate the natural period of the
structure and thereby decouples it from the ground. The first base-isolated building in the United
States, Foothill Communities Law and Justice Center in San Bernadino, California, was
constructed in 1985 (Clark, 1997). During the 1995 Kobe earthquake (officially known as
Hyogo-ken Nanbu earthquake), two base-isolated buildings located in the suburb of Kobe
demonstrated excellent performance and verified the effectiveness of the base isolation. Through
this experience, base isolation technology has been widely accepted and gained great popularity
in Japan. At this time, there are more than 1000 base-isolated buildings and additional 200 base-
isolated buildings appear to be scheduled for construction each year.
Basically, base isolation systems provide functions of restoring force and energy dissipation. The
rubber bearing, made up with layers of alternating rubber and steel plates, as shown in Figure 2-
1, is the most popular device for providing a restoring force. The two components of the rubber
bearing are bonded to each other by strong special adhesion materials. The steel plates act as
confinement for the rubber layers to support vertical loads with low horizontal stiffness.
Generally, the ratio of the vertical stiffness and horizontal stiffness is over 1000.
Ordinarily, there are three types of rubber bearings: 1) Natural Rubber Bearings (NRB); 2) High-
damping Rubber Bearings (HRB); and 3) Lead-rubber Bearings (LRB). With NRB, over 60% of
total weight of rubber is natural rubber. The NRB has almost linear characteristics in the
horizontal force – displacement relationship and low damping. Therefore, when using NRB,
additional damping devices such as hydraulic dampers, steel bar dampers or friction dampers, are
required in order to control the response displacement. HRB is a type of rubber bearing in
which a specially-compounded rubber material is used to provide energy-dissipation capability
during deformation, in addition to its restoring function with its stiffness. LRB is another type of
rubber bearing that has both spring and damping functions combined. The cylindrical-shaped
lead core is vertically inserted at the center of the bearing for energy dissipation.

17
Recently, extensive research and development work has been carried out for the sliding bearing.
The sliding bearing has a sliding surface generally made of PTFE (poly-tetra-fluoro-ethylene)
mating with a stainless steel plate. The coefficient of friction of the sliders is 0.10 to 0.20 with
normal PTFE and stainless plates, and 0.02 to 0.04 with lubricated PTFE and PTFE-coated
stainless plate. Sliding bearings are used mainly in combination with rubber bearings as a
restoring force element to control the sliding displacement during an earthquake and to prevent
excessive permanent displacement after an earthquake. The merit of this system is to be able to
achieve a longer period shifting with larger damping. Also, this system is quite effective in the
case of a structure that has relatively lightweight – under 2 MN – such as residential house,
industrial equipment, or power transformer.
2.3 Mechanism of Rubber Bearings
Much research of the mechanism of the laminated rubber bearings has been analytically and
experimentally conducted in the past two decades (Constantinou, 1990; Gent, 1959). The
derivation of governing equations to describe the mechanical behavior of the laminated rubber
bearing is omitted for simplicity. The essential equations for practical design procedures are
introduced below. Physical parameters of the laminated rubber bearings are presented here.
They include: outer rubber diameter D, inner rubber diameter d, unit rubber layer thickness tr,
shim plate thickness ts, number of rubber layers nr, and total rubber height h. The horizontal
stiffness Kh and vertical stiffness Kv are presented in the following equations.
h
AGK
hAE
K
effeqh
effcv
⋅=
⋅= (2-1)
(2-2)

18
rr
rr
eff
ap
ap
c
tnh
tdD
tDS
dDDA
SEE
EE
E
⋅=
−=
−⋅⋅=
+=+
=
∞
factorshapefirstis4
)(or4
areasectionalcrossis)(4
or4
)21(,11
1
where,
1
222
210
ππ
κ
layersrubber unit of s thicknesis layersrubber ofnumber is
heightrubber totalis
modulusshear is factorcorrectionis
rubber of modulusbulk ismodulussYoung'is0
r
r
eq
tnhG
EE
κ∞
Among the parameters shown above, first shape factor S1, or sometime simply called shape
factor, is a key factor. S1 is the ratio of the free surface area of the rubber relative to the load-
supporting area of one unit rubber layer of the rubber bearing. In the case of circular rubber
bearings without a center hole, S1 is derived from the following equation.
When S1 becomes larger, the rubber pad becomes thinner and as a result, the pad will have a
larger stiffness in the loading direction. Generally, S1 is 20 to 30 for rubber bearings. As shown
in the above equations, the apparent Young’s modulus for the loading direction of the rubber pad
will be affected by the square of S1 (Thomas, 1982). Vertical stiffness Kv is calculated with the
modulus Ec, which is corrected with bulk modulus E∞ of the rubber material itself. On the other
hand, the horizontal stiffness is calculated with shear modulus Geq without any influence from
rr tD
Dt
D
areafreearealoadingS
441 2
1 ===π
π(2-3)

19
(2-5)
(2-4)
the shape factor S1. If the bearing also has energy dissipation capability, equivalent damping
ratio heq is generally used as the representative physical property and is calculated by the
following equation.
amplitudeshear is
cycleperenergydissipatediswhere,
C
d
X
W
As introduced in the preceding section, the rubber bearings having energy dissipation capacity
are HRB and LRB. Both bearings have heq from 15% to 25%. Figure 2-2 shows a typical
horizontal force-displacement curve of HRB during cyclic loading. Figure 2-3 shows the
relationship between shear strain and shear modulus Geq, and equivalent damping ratio heq of
HRB. This non-linear relationship between shear strain, Geq and heq is generally determined
experimentally. In practical design, those functions are provided by manufactures. As an
example, some rubber bearing manufactures provide the following polynomial equations for this
purpose.
where, γ is shear strain
The coefficients ai and bi are determined from the force-displacement relationships obtained by
both scaled and full-size model testing. Therefore, shear modulus Geq should be understood as
effective shear modulus Geq, which means that this is the property determined by particular
testing with a certain shape of a test specimen. The certain shape of a test specimen in this case
is the alternately laminated rubber bearing. Those force-displacement relationships as shown in
Figure 2-2 are generally modeled in a dynamic analysis, either as equivalent linear properties or
as an elasto-plastic bilinear model. The equivalent linear model with Kh and heq will provide a
reasonably good approximation with such a simple procedure as response spectrum analysis,
221
Ch
deq XK
Wh⋅
⋅=π
ii
n
ieq
ii
n
ieq
bgh
afGG
γγ
γγ
⋅==
⋅===
∑
∑
=
=
0
0
)(
)(
(2-6)

20
Figure 2-1 Laminated Rubber Bearing
-150 -100 -50 0 50 100 150-150
-100
-50
0
50
100
150
Horizontal Displacement (mm)
Ho
rizon
tal L
oad
(kN
)
Figure 2-2 An Example of Hysteresis Curve of High-Damping Rubber Bearings
Hor
izon
tal L
oad
(kN
)
Flange
Cover Rubber
Inner Rubber Bolt Holes
Reinforcing Plate

21
Figure 2-3 Relationship of Shear Modulus and Equivalent Damping
Ratio versus Shear Strain
0 0.5 1 1.5 2 2.5 30
0.5
1
1.5
2
2.5
Shear strain γ: (-)
Shear modulus G(γ
): (MPa)
0 0.5 1 1.5 2 2.5 30
0.05
0.1
0.15
0.2
0.25
0.3
Shear strain γ: (-)
Equivalent damping ratio Heq(γ
): (-)

22
whereas bilinear modeling offers more precise and detailed response information by nonlinear
time history analysis. The determination of the bilinear model is shown in Figure 2-4. The force-
displacement relationship is modeled with initial stiffness K1, post yielding stiffness K2 and yield
load Qy or yield deflection δy. In the case of LRB, because the hysteresis curve shows typical
elasto-plastic characteristics, the modeling procedure is directly determined from actual
performance curve. In the case of HRB, which shows rather viscous-elastic behavior in its
hysteresis curve, K2 and Qy will be changed according to the loading amplitude. Therefore, the
assumption of reasonable loading amplitude is needed to translate the characteristics to a bilinear
model. However, the target displacement of the isolation system will not differ much from
structure to structure and will be at a similar level with adequate design earthquake levels. If the
calculated bearing displacement is significantly different from the assumed displacement,
another displacement will be assumed and next calculation will be performed. For a few trial and
error procedures, a reasonable solution will be obtained.
2.4 Design of Rubber Bearings
2.4.1 Preliminary Design based on Stiffness Requirement
The dynamic behavior of the structure is mostly characterized by the isolation system. It is a
great benefit of the base isolation. Even if the structure has an irregular shape with a large
eccentricity in inertia, earthquake response will not be affected so much for the base-isolated
structure. The target period of base isolation is generally 2.0 to 3.0 seconds at the design
earthquake level. Such period shifting will result in a base displacement of 150 to 300 mm. The
first shape factor, S1, is the influential factor to the vertical stiffness and is determined by the
vertical stiffness requirement restricted by the creep performance under long-term vertical load
(Thomas, 1982). The vertical frequency, fv, is generally required over 12 Hz resulting in S1,
practically and empirically, in the range of 20 to 30. The diameter of the bearing, if circular in
shape, will be mainly decided by the vertical load to be carried by the bearing. The maximum
compressive stress of the rubber area is restricted by the long-term deterioration of the rubber,
such as creep, as well as the buckling characteristics of the bearing. Higher compressive stress
will result in decreasing ultimate displacement by virtue of buckling. Generally, the long-term

23
Figure 2-4 Definition of Bi-Linear Model for Isolators
Figure 2-5 Overlapped Effective Area of Rectangular Type Bearing
at Displacement X [2-8]
K1
K2
Qy
Kh
Horizontal Disp. δy
Qd
Shea
rFor
ce
X
L
Overlapped Area Aeff’
Load sustaining volume

24
compressive stress is in the range of 4 to 10 MPa. The design procedure is summarized as
follows.
Design base displacement XD and maximum displacement XM are generally determined
from the response spectrum with assumed design horizontal frequency fh (or the period
Th).
II. Design Procedure
Step-1 : total rubber thickness h
M
M
D
D XhXhγγ
≥= with
∞=⋅⋅⋅⋅⋅⋅⋅
=⋅
EEGG
PX
Xf
Tf
eq
D
M
M
D
v
hh
,,),(propertiesmaterialrubberstrainshearbasedesign
strainshearallowablemaximumloadvertical
ntdisplacememaximumntdisplacemebasedesign
frequencyverticaldesign
)1(frequencyhorizontaldesign
ConditionsDesign.I.
0 κγ
γ
(2-7)

25
Step-2 : shape factor S1
Step-3 : diameter D
Step-4 : unit rubber layer thickness tr and number of layer nr
where, int| a| is the integer value closest to the real value of a
(2-10)
(2-11)
(2-12)
(2-9) h
v
c
h
v
h
v
KK
GE
EEEG
S
ESEGESE
GE
KK
ff
=⎟⎟⎟⎟
⎠
⎞
⎜⎜⎜⎜
⎝
⎛
−
−+=∴
++⋅+
===⎟⎟⎠
⎞⎜⎜⎝
⎛
∞
∞∞
∞
∞
χχκ
χ
κκ
where,)(2
))1(
)21()21(
21
01
210
210
2
gPf
K
GhK
D
hh
h
22
21
4
4
π
π
=
⎟⎠
⎞⎜⎝
⎛ ⋅=
rrr t
hnandSDt int
4 1
==
(2-8)

26
In Step-2, a reasonable S1 is decided first and fv is calculated later. The vertical frequency, fv, is
not an important design factor as long as it falls in a reasonable range, such as, 12≤ fv ≤ 20Hz.
After the completion of these calculations, the ultimate capacity of the bearings shall be checked
as shown below.
2.4.2 Prediction of Ultimate Capacity of Rubber Bearings
The ultimate properties of the rubber bearing may be classified into two types: rubber breaking
and buckling. In a typical design, breaking will occur at over 400% shear strain with a
corresponding ultimate displacement of over 600 mm. This displacement is usually large enough
for base isolation. A bearing with a large diameter to height ratio will have no buckling before
the rubber breaks. However, in many cases, the bearings will experience buckling before
breaking (Kelly, 1993). Here, we derive a new design factor called the secondary shape factor,
S2, calculated by the following equation:
hDS =2
Many experiments verified that the bearing in the range of S2 ≥ 5 is stable until rubber breaking
and has no buckling problem. However, to obtain the isolation period over 2.0 seconds, the
rubber height becomes at least over 160 mm even if the softest rubber compound is used. It
means that the diameter of the bearing will be over 800 mm. A typical compressive stress of a
bearing is 6.0 MPa, and the sustaining column load is calculated as 3.0 MN. This corresponds to
the vertical load on interior located column of an 8-story reinforced concrete (RC) building.
Buildings with less weight would be isolated with the smaller diameter resulting in a smaller S2.
Considering the majority of the structures weigh lighter than 8-story RC building, buckling will
be the critical failure mode of a rubber bearing.
The prediction of buckling behavior of a rubber bearing under combined compression and shear
loading is not simple because of its geometric and material nonlinearity. The load under zero
(2-13)

27
(2-15)
deflection assumption is considered as the critical buckling load, Pcr, by many analytical and
experimental studies. Koh and Kelly (1988) derived the critical load, Pcr, under zero
displacement with linear assumption as follows:
2
2
21
2
,
2)4(
HIEPGAP
PPPPP
SbESS
ESSScr
π==
++−=
Ieff is effective moment of inertia,
4
64DIeff ⋅= π
When S2>3, equation (2-14) will be approximated as follows.
Eb is the apparent Young’s modulus of a thin rubber pad for bending deformation. Fujita (1985)
provided the equation for Eb as follows,
)plateshimof thicknessis ,)1((heightbearingis
,
where,
ssr
effSeffS
ttntnHH
hHII
hHAA
⋅−+⋅=
⎟⎠⎞
⎜⎝⎛⋅=⎟
⎠⎞
⎜⎝⎛⋅=
1
210
1
)321(
1
−
∞ ⎟⎟⎟⎟
⎠
⎞
⎜⎜⎜⎜
⎝
⎛
++
=ESE
Eb
κ
( )21
EScr PPP =
(2-14)
(2-16)
(2-18)
(2-19)
(2-17)

28
Then the critical stress for buckling will be derived as follows.
Buckle (1994) introduced Pcr under large displacement for rectangular type bearing by reducing
Pcr at zero displacement with the ratio of the effective overlapped area at the displacement X, as
shown in Figure 2-5.
⎥⎦⎤
⎢⎣⎡ −⋅=′
LX
crPcrP 1
direction loadingin length bearingiswhere, L
For the circular bearing, the overlapped-area is expressed in more complicated form as shown in
(2-23).
⎟⎠⎞
⎜⎝⎛ −⋅= )2sin(
21
2
2'
ddD
effA θθ
XeffA ofnt displacemeat area overlapped is '
where,
diameterbearingisntdisplacemehorizontalis
)/arccos(
DX
DXd =θ
The critical load is given as follows.
''
'effAcr
effAeffA
crPcrP ⋅=⋅= σ
However, many test results verify that the critical load given by the above-mentioned procedure
is conservative enough, and even for circular bearings. The simple equation for a rectangular
bearing (2-21) is also applicable in practical design, as shown in (2-24).
( )21
24GES bcr
πσ = (2-20)
(2-21)
(2-22)
(2-23)

29
⎥⎦⎤
⎢⎣⎡ −⋅=
DX
crPcrP 1'
bearing ofdiameter iswhere, D
Equation (2-24) is translated by introducing effA and 2S into (2-25).
⎟⎟⎠
⎞⎜⎜⎝
⎛−=⎟
⎠⎞
⎜⎝⎛ ⋅−=
211'
ScrDh
hX
crcrγσσσ
Using (2-25), design criteria of bearings regarding buckling stress is expressed with given design
compressive stress σ as (2-26).
⎟⎟⎠
⎞⎜⎜⎝
⎛−≤
cr
Sσσγ 12
where,
hX=γ , is shear strain of rubber, and
AP=σ , is design compressive stress on rubber bearing
Another criteria of ultimate properties is breaking of bearing, which is determined by testing.
Generally, the breaking property is defined as breaking strain bγ under given design
compressive stress σ . With relationship of equation (2-26) and bγ , the demand of ultimate
properties of bearings can be illustrated in a diagram with σ and γ , as shown in Figure 2-6.
The intersection of maximum compressive stress and shear strain must be within the enclosed are
bounded by the horizontal-vertical axis, the line expressed by (2-26), and bγγ = .
(2-26)
(2-24)
(2-25)

30
Figure 2-6 Design Diagram for Ultimate Properties of Isolators
2.5 Base Isolation Systems for Lightweight Structures
2.5.1 Sliding Bearing
For a lightweight structure, the small axial load on a bearing makes it impossible to design a
rubber bearing which satisfies the requirements for buckling, breaking, and creeping safety, as
discussed before. One of the countermeasures is to apply sliding bearings in such an isolation
system.
A sliding bearing generally consists of a PTFE disc and a stainless steel plate. A rubber pad is
usually attached to the PTFE disc. The general configuration of a sliding bearing is shown in
Figure 2-7. Compressive stress on PTFE is designed within the range of 10 MPa to 30 MPa. In
order to endure high compressive stresses, PTFE is usually confined with glass fiber or carbon
fiber. One of the functions of the rubber pad is to reduce the shock generated when the static
friction force is broken and the bearing slides (usually called “breaking away”). If there were no
rubber pad, the shock would stimulate the high frequency mode response of the isolated
Shear strain γ 2S
crσ C
ompr
essi
ve st
ress
bγ
No failure Stable
Instable
Breaking
Breaking
⎟⎟⎠
⎞⎜⎜⎝
⎛−=
crS
σσγ 12
bγγ =

31
structure. The friction coefficient of PTFE usually depends on sliding velocity and compressive
stress. Higher sliding velocity increases the friction coefficient. A typical relationship of sliding
velocity and friction coefficient is shown in Figure 2-8. The test data was obtained with a PTFE
disc confined with glass fiber. However, as the figure indicates, at the velocity range under
earthquake ground motions, such as ≥250 cm/s, the friction coefficient can be considered
constant.
Another typical characteristic of sliding bearings is compressive stress dependence. The friction
coefficient will be lower when the compressive stress becomes higher. For example, the friction
coefficient at 10 MPa is 0.14; whereas at 30 MPa, it becomes 0.090 (see Figure 2-9). The
compressive stress is generally limited by the fracture and creep characteristics of the PTFE
material.
Figure 2-7 Sliding Bearing
Flange
PTFE Plate Stainless Plate

32
0 50 100 150 200 250 3000
0.02
0.04
0.06
0.08
0.1
0.12
0.14
0.16
0.18
0.2
Sliding Velocity (mm/sec)
Fric
tion
Co
eff
icie
nt
Figure 2-8 Sliding Velocity Dependency of Friction Coefficient:
Compressive Stress =12MPa, Confined PTFE
0 5 10 15 20 25 300
0.02
0.04
0.06
0.08
0.1
0.12
0.14
0.16
0.18
0.2
Face Pressure (MPa)
Fric
tion
Co
eff
icie
nt
Figure 2-9 Compressive Stress Dependency of Friction Coefficient:
Velocity = 200(mm/sec), Confined PTFE
Fric
tion
Coe
ffici
ent
Fric
tion
Coe
ffici
ent

33
2.5.2 Segmented Rubber Bearing
A segmented rubber bearing is another prospective solution of isolation of lightweight structures.
It has a structure of layers consisting of several laminated rubber bearings with stabilizing plates
as shown in Figure 2-10. This type of structure has low stiffness, large deformation capability,
and good stability. Its main use is a spring element for tuned-mass dampers--vibration controls
for high-rise buildings. Masaki (1999) conducted an experimental and analytical study on the
application of segmented rubber bearings. Basically, the deformation capability is computed as
the deformation of an element bearing multiplied by the number of layers. However, the rotation
of the element bearing at the end fixed to the stabilizing plates, and the bending stiffness of the
stabilizing plate itself affects the ultimate deformation of the bearing. Masaki studied the
instability characteristics of the element rubber bearings with a bending moment at one end and
verified that the bending moment causes the reduction of its stability. According to the results of
experiments by Masaki, the ultimate deformation of an element bearing in a segmented structure
will be reduced to approximately 80% of the individual element. The precise analytical
approach will be a topic of future study.
2.6 Proposed Design Procedure of Isolation System for Transformer
The preliminary response-analysis of base-isolated structures can be determined by the statically
equivalent method, namely the equivalent linearization method (EQLM). In UBC 97, the EQLM
formulas provide displacements and forces and are based on constant-velocity spectra over the
period range of 1.0 to 3.0 seconds. In the calculation procedure, the isolation system is modeled
with equivalent linear properties. The solution is given by a response spectrum.
In this study, we apply this static analysis, EQLM, to the preliminary design of the base isolation
system for a transformer. The isolation system is modeled with a bi-linear characteristic and the
solution is obtained by an iterative process with response spectrum, as shown in Figure 2-11.
The IEEE 693-1997 Required Response Spectrum (RRS), which is introduced in Chapter 1, is
applied as the demand-spectrum. The IEEE 693-1997 RRS (High Level) is defined as follows:

34
[Element Bearing]
Element bearing
Stabilizer
・ Low stiffness with stable performance at large displacement
Figure 2-10 Segmented Rubber Bearings

35
Figure 2-11 Equivalent Linearization Analysis of Base-isolated
Transformer/Bushing System
Element RB
0
1
2
3
4
5
6
7
8
9
0 0.1 0.2 0.3 0.4 0.5 0.6
Sd (m )
Sa (m/se
c2)
M
hK ,
isolator of ratio dampingisolator of stiffness
er transformof ass:
::
hK
mM
Isolator System
Response Spectrum IEEE-693 (1997)
Shea
r Fo
rce
K2
K1
Shear Displacement
Qd
Kh

36
(Hz)0.330.8for66.04.01)28.52.13(
(Hz)0.81.1for 25.1
(Hz)1.10for 144.1
≤<+−−=
≤<=
≤<=
frf
rS
frS
frfS
A
A
A
( )[ ] 1156.2/10068.021.3
(Hz)frequencynaturalis
system theof ratio dampingis
onaccelerati response of Spectrum is
where,
ζ
ζ
Lnr
f
S A
−=
The RRS is specified for the seismic evaluation of the electrical equipment in a substation, such
as a porcelain bushing, by a shaking table test using earthquake ground motion. Ground motion
shall have spectral ordinates that equal or exceed the RRS. Because the RRS is specified as the
input to the bushing, this spectrum already includes the amplification from the transformer body.
Therefore, it is conservative to use this RRS for the design of base isolation systems for power
transformers.
The spectrum related to the frequency range of base isolation is:
rfS A 144.1=
AS and DS , the spectrum of response displacement, has the following relationship:
AD Sf
S ⋅⎟⎟⎠
⎞⎜⎜⎝
⎛⋅
=2
21
π
Substituting (2-28) into (2-29), and erase f from the equation, then the relationship of AS and
DS is expressed as follows.
(2-27)
(2-28)
(2-29)

37
DA S
rCS 1220 ⋅⋅=
π572.0where, 0 =C
The force-deflection relationship of the bi-linear model for the isolation system is expressed as
follows:
δδ ⋅=+⋅= hd KQKQ 2
The definition of the each variable is shown in Figure 2.4. In an equivalent linear system, the
following relationship is assumed:
ASMQ ⋅=
DS=δ
Substituting (2-31), (2-32), and (2-33) into (2-30),
h
h
KMrC
rCM
K
⋅⋅=∴
⋅⋅=⋅
0
220
1
δ
δδ
The damping factor r is the function of damping ratioζ of the bilinear-model at displacement δ
as follows.
( ) δδ
δ
πζ
⋅+
⎟⎟⎠
⎞⎜⎜⎝
⎛−
−⋅⋅⋅=
2
212KQ
KKQQ
d
dd
Damping factor is expressed with ζ as follows.
(2-30)
(2-31)
(2-32)
(2-33)
(2-34)
(2-35)

38
( )[ ]1156.2
100ln68.021.3 ζ−=r
The response displacement δ and acceleration SA are given as the cross point of the curve
expressed by (2-37) obtained by substituting (2-36) into (2-30), and performance curve of
isolation system. The relationship expressed by (2-37) is called as transit curve.
( )[ ]D
A SCS 1
1156.2100ln68.021.3 2
20 ⋅
⎭⎬⎫
⎩⎨⎧ −⋅= ζ
Practically, the solution of response displacement δ that satisfies (2-33) will be given by an
iteration process as indicated in Figure 2-12. The capacity curve of the isolation system is
modeled as bi-linear characteristics with parameters of yield force ratio α and fundamental
period fT .
gMQd
⋅=α
22
KMTf π=
Figure 2-13 shows the relationship of the transit line and capacity curve when the α = 0.08 and
fT =2.0 seconds. Figures 2-14 and 2-15 are the design diagram of isolation system with
parameter of α and fT .
In general base-isolation design of buildings, α varies from 0.04 to 0.06 and fT varies between
3.0 and 4.0 seconds. However, according to the curves in Figure 2-13, the resulting response
displacement will be over 300 mm and it will be too large considering the complicated
interconnection with other equipment. The author recommends making the fT less that 2.0
seconds and increase the α to more than 0.07. These boundaries become part of the design
principle in this research for isolators of transformers or other equipment in substations.
(2-36)
(2-38)
(2-39)
(2-37)

39
In order to verify the proposed procedures, the result of the EQLM was compared with time-
history analysis. Nine time-history ground motion were generated based on the target spectrum
RRS 693-1997 for 2% damping and PGA=0.5g. Seven records have random phase angles (Art-
R1 to Art-R7, respectively), one with phase angle of 1995 Kobe (Takarazuka) EW (Art-KT), and
one with phase angle of 1994 Northridge (Sylmar) S11 (Art-NY). Each ground motion has slight
difference in its PGA from 0.5g in target spectrum. However, the spectrum agrees better to target
spectrum than modify its PGA to 0.5g. The response spectra of acceleration and time histories of
Art-R1, Art-KT, and Art-NY are shown in Figures 2-16 and 2-17.
The comparison of time-history analysis results under PGA of 0.25, 0.50, and 0.70g and EQLM
was shown in Figure 2-18. The solution line of EQLM covers all of the time history results. It
indicates that the proposed method by EQLM gives a good approximated solution with
reasonable safety margin in its practical use.

40
Figure 2-12 Iteration-Flow for Computation of Response Displacement
0
1δδ =
=
i
i
i
diih
QKK
δδ +⋅
= 2 ( )( )[ ]
1156.2100ln68.021.3
2
2
21
ii
iid
did
i
r
KQKK
ζδδ
δ
πζ
−=
⋅+
⎟⎟⎠
⎞⎜⎜⎝
⎛−
−⋅⋅=
πδ i
eqiii
rC
KMrC
572.0,
21
1 =⎟⎟⎠
⎞⎜⎜⎝
⎛⋅⋅=+
εδδ <−+ ii 1
1+← ii
:δ
Yes
No
Iterated response displacement

41
0 100 200 300 400 5000
0.2
0.4
0.6
0.8
1
1.2
1.4
1.6
1.8
2
M ax. Resp. Displacem ent (m m )
Max. Resp. Acceleration (g)
αf=0.08
Tf=1.0 sec
Tf=1.5 sec
Tf=2.0 sec
Tf=2.5 sec
Tf=3.0 sec
Transit Curve
αf=0.08
Capacity Curve for Tf=2.0 sec
Figure 2-13 Relationship of Transit Line and Capacity Curve

42
1 1.5 2 2.5 30
0.2
0.4
0.6
0.8
1
1.2
1.4
1.6
1.8
2
Fundam ental Period Tf (sec)
Maximum Response Acceleration (g)
α=0.04α=0.06
α=0.08α=0.10α=0.12
Figure 2-14 Relationship of Fundamental Period and Response Acceleration
1 1.5 2 2.5 30
100
200
300
400
500
600
700
800
Fundam ental Period Tf (sec)
Maximum Response Displacement (m
m) α=0.04
α=0.06
α=0.08
α=0.10
α=0.12
Figure 2-15 Relationship of Fundamental Period and Response Displacement

43
A rt-N Y
0
500
1000
1500
0 2 4 6 8 10
Natural Period (s)
Acceleration (mm/s
2)
A rt-R 1
0
500
1000
1500
0 2 4 6 8 10
Natural Period (s)
Acceleration (mm/s
2)
A rt-K T
0
500
1000
1500
0 2 4 6 8 10
Natural Period (s)
Acceleration (mm/s
2)
Figure 2-16 Response Spectrum of Artificial Wave: Art-R1, Art-KT, and Art-NY
IEEE-693
IEEE-693
IEEE-693

44
A rt-R 1
-1000
-500
0
500
1000
0 5 10 15 20 25 30 35 40
Tim e (s)
Acceleration
(mm/s
2)
A rt-K T
-1000
-500
0
500
1000
0 5 10 15 20 25 30 35 40
Tim e (s)
Acceleration
(mm/s
2)
A rt-N Y
-1000
-500
0
500
1000
0 5 10 15 20 25 30 35 40
Tim e (s)
Acceleration
(mm/s
2)
Figure 2-17 Time History Record of Artificial Wave: Art-R1, Art-NY, and Art-KT

45
0 0.2 0.4 0.6 0.8 1 1.20.1
0.2
0.3
0.4
0.5
0.6
0.7
0.8
0.9
PG A (g)
Maximum Response Acc. (g)
0 0.2 0.4 0.6 0.8 1 1.20
100
200
300
400
500
600
700
800
900
PG A (g)
Maximum Response Disp. (m
m)
Figure 2-18 Comparison of the Results by EQLM and Time-History Analysis
: Art-R1 to R7 : Art-NY : Art-KT : EQLM
: Art-R1 to R7 : Art-NY : Art-KT :EQLM


47
SECTION 3
EARTHQUAKE SIMULATOR TEST/PHASE-1
3.1 Overview
In this section, the earthquake simulator test /Phase-1 is reported. In this phase, the combined
sliding and low-damping rubber bearing system was used. The system consists of PTFE-sliding
bearings and low-damping rubber bearings. The test cases were classified into uni-axial (x-
direction), bi-axial (x-,y-direction), and tri-axial (x-,y-, and z-direction) shaking. First, dynamic
characteristics of each test-component were identified by random vibration tests. After that, tri-
axial shaking was conducted using several records of site-motion. The results were analyzed and
discussed.
3.2 Experimental Setup
3.2.1 Earthquake Simulator
The size of the earthquake simulator in NCREE is 5m x 5m in plan and the maximum payload is
500 kN. The simulator has six degrees of freedom and the maximum stroke and velocity are
±250 mm and ±1000 mm/sec, respectively. Specifications of this earthquake simulator are
summarized in Table 3-1 and a schematic view of the simulator is shown in Figure 3-1.
3.2.2 Transformer Model
The transformer model was a four-layered steel frame structure. It has 80 pieces of lead blocks
loaded inside to provide additional weight. The total weight of the transformer model was 235
kN in Phase-1 (Ref: 145 kN in Phase-2). At the top of the frame, a bushing was connected with
bolts through the bushing flanges to a column, which was assumed as the turret of the
transformer. Figure 3-1 shows a photo of the frame. The transformer model can be assumed as a
scaled-model of the actual transformer. The target transformer was a large-size one, such as over

48
Figure 3-1 Earthquake Simulator in NCREE, Transformer Model and Bushing
( from NCREE web site [3-1] )

49
500 kV, weighing approximately 2500 kN. In this case, the assumed scale-factor of the
transformer model was in the range of 1/3 to 1/4.
Table 3-1 Specification of Earthquake Simulator in NCREE
3.2.3 Porcelain Bushing
The bushings tested were used in an actual field installation for 15 years and were provided by
the Taiwan Power Company. In Phase-1, two types of bushings, 69-kV and 161-kV, were used.
Their characteristics and dimensions from the original specifications are shown in Figure 3-2,
which were redrawn from the original drawings. According to the description on the drawings,
both bushings were manufactured by Toshiba Corporation Japan in 1977. These 161-kV and 69-
kV transmission systems are a popular size for power stations in Taiwan. According to JEAG
Table Size 5m x 5m
Specimen Weight Capacity 500kN
Overturning Moment Capacity 150tonf⋅m
Frequency Range Min. 0.1Hz , Max 50Hz
Displacement Longitudinal : ±250 mm
Transverse : ±100 mm
Vertical : ±100 mm
Velocity Longitudinal : ±1000 mm/sec
Transverse : ±600 mm/sec
Vertical : ±500 mm/sec
Acceleration Longitudinal : ±1.0 g
Transverse : ±3.0 g
Vertical : ±1.0 g
Actuator Force Longitudinal : ±220kN
Transverse : ±600kN
Vertical : ±600kN

50
Type Form VE-60ZN VEU-140ZT
Insulation Class 69 kV 161 kV
Rated Current 2000 A 1200 A
BIL 350 kV 750 kV
Approximated
Weight
1.324kN 3.434kN
Total Length 1945 mm 3496 mm
161-kV Bushing 69-kV Bushing
Figure 3-2 Characteristics of Porcelain Bushings

51
50003 “Seismic Design Guideline of Electric Facilities in Power Substation” and other
references, the typical material properties of porcelain are as follows: Young’s modulus is
5.88x10⁴ MPa, Poisson’s ratio is 0.23, and tensile strength is minimum 40MPa.
3.2.4 Instrumentation
Accelerometers and displacement transducers for x, y and z directions were installed at the
simulator platform, at the bottom and top of the transformer model, and at four points on the
bushings at the following locations (measured from the middle flange of the bushing):
• 161-kV bushing: 1st node: -112cm .2nd node: –60cm 3rd node: +88cm
4th node: 197.5cm
• 69-kV bushing: 1st node: -64cm .2nd node: –30cm 3rd node: +41cm
4th node: 100cm
3-component load cells for the measurement of the reaction forces of the sliding and rubber
bearings were installed above each of the bearings. The detailed information of the instruments
and their locations are shown in Figure 3-3, together with Table 3-2 and Table 3-3.
Table 3-2 Symbols of Measurement Instruments for Acceleration and Displacement
Acceleration (g) Displacement (mm) Measurement
Point x-dir. y-dir. z-dir. x-dir. y-dir. z-dir.
Table AX1 AY1 AZ1 long lateral transverse
Bottom of
transformer AX2 AY2 - DX2 DY2 -
Top of transformer AX3 AY3 AZ2 DX3 DY3 DZ2
Middle of bushing ABX3 ABY3 ABZ3 DBX3 DBY3 DBZ3
Top of bushing ABX4 ABY4 ABZ4 DBX4 DBY4 DBZ4

52
AY1
AY2
AY3
ABY3
ABY4
AX1
AX2
AX3
ABX3
ABX4 DBX4
DBX3
DX3
long lateral
DBY4
DBY3
DY3
DX2
x
z
y
z
DY2
x
y
N-E S-E
N-W
RBRB
SLB
SLB SLB
SLB
2200
1900
SLB : Sliding Bearing RB : Rubber Bearing
S-W
Figure 3-3 Layouts of Sliding Bearings and Rubber Bearings

53
Table 3-3 Symbols of Measurements in Load Cells Installed
Load Cell ID x-dir. y-dir. z-dir.
SLB-SE SESX SESY FES
SLB-SW SWSX SWSY FWS
SLB-NE SENX SENY FEN
SLB-NW SWNX SWNY FWN
RB-S SWESX SWESY -
RB-N SWENX SWENY -
3.3 Combined Sliding-Rubber Bearing Isolation System
An isolation system combining sliding bearings with low-damping rubber bearings was designed
and applied for the transformer. This system enables reasonable period shifting and allows large
displacement without buckling problems, which rubber bearings with a small diameter usually
possess. A sliding bearing was installed under each of the four corners of the transformer model
and two rubber bearings were installed at the midpoint of opposite sides, as shown in Figure 3-3.
Coordinate axes were mapped on the simulator platform with the N-S direction as the x-axis and
the E-W direction as the y-axis. The positions of the sliding bearings were identified as N-E, N-
W, S-E, S-W and the positions of the rubber bearings were identified N and S. The sliding
bearings carried the entire weight of the transformer model, including the bushing. The rubber
bearings worked only as horizontal restoring force elements, sustaining no vertical load. An
experimental study on a similar system was performed by Feng (1994) and Constantinou (1990).
Such a system has an advantage for isolation of lightweight structures like small office buildings
and residential houses.
3.3.1 Low-Damping Rubber Bearing
In order to reduce the stiffness and to maintain a large deflection capability, each rubber bearing
unit actually consisted of two stacked rubber bearings, which were fixed with bolts through
mating flange plates as shown in Figure 3-4. The designed characteristics of the rubber bearings

54
Low-damping Rubber Bearing
Figure 3-4 Low-Damping Rubber Bearing

55
are summarized in Table 3-4, and the typical physical properties of the rubber compound are
shown in Table 3-5. The natural rubber compound shows a clear linear relationship in the stress-
strain curve with a small degree of damping. The natural rubber compound used in these
bearings had a shear modulus, G, of 0.45 MPa and a damping ratio, heq, of about 3%. In this
system, the energy dissipation function was provided mainly by the sliding bearings. Because
the rubber bearings carried no vertical load, the ratio of the thickness of a unit rubber layer to the
diameter was relatively large, resulting in a first shape factor of 10.2. The absence of a vertical
load allowed for a slim shape of the rubber bearing. As a result, the second shape factor for the
double-decked bearing was 1.58. In order to prevent any vertical loading (either compression or
tension) on the rubber bearing during the testing, a 10 mm clearance between the bearing flange
and the transformer bottom was maintained. Instead of fixing bolts, loose pins were used to
transmit the horizontal load.
3.3.2 Sliding Bearing
A sliding bearing consists of a laminated rubber pad and a PTFE disc fixed together with keys
and bolts (See Figure 3-5). The purpose of using the laminated rubber pad is to alleviate the
degree of shock due to the stick-slip action of the sliding bearing (Iizuka, 1998). The
characteristics of the sliding bearing are summarized in Tables 3-6 and 3-7. The rubber
compound used in the rubber pad was a high modulus natural rubber compound whose shear
modulus, G, was 1.2 MPa. The high modulus rubber compound produces a design with small
breaking-away displacement and a compact size. The rubber pad used in the sliding bearing does
not require a large deformation capacity such as a conventional rubber bearing. The physical
properties of the compound are summarized in Table 3-8.

56
Table 3-4 Dimensions and Properties of Rubber Bearing
Outer Diameter D 304mm
Inner Diameter d 58.5mm
Unit Rubber Thickness tr 6.0mm
Number of Layers nr 16
Shim Plate Thickness ts 1.6mm
Total Rubber Height h 96mm for NB
192mm for DNB
Rubber Compound Type Natural Rubber(NR):G5
Apparent Shear Modulus G 0.44MPa
1st Shape Factor S1 10.2
2nd Shape Factor S2 3.17 for Single Bearing
1.58 for Doubled Bearing
Horizontal Stiffness Kh 0.321kN/mm
Table 3-5 Physical Properties* of Rubber Compound for Rubber Bearing
Property Specification
Hardness 39+4
100% Modulus 0.69+0.2MPa
Tensile Strength > 17.7MPa
Breaking Strain >600%
* by JIS K 6301

57
(In above figure, a=60mm, and t=1.0mm)
Figure 3-5 Sliding Bearing

58
The PTFE disk used in this test had a specially designed reinforcement to endure high axial
stress. The PTFE disk consisted of a 0.2 mm thick PTFE sheet that is reinforced by an Aramid-
chipped fiber. The fiber was bonded to the glass-fiber fabric with an epoxy resin-type adhesive.
The whole sheet was finally bonded to the steel plate with the same type of adhesive. By
reducing the thickness of the PTFE sheet and reinforcing it with the Aramid fiber, the PTFE disk
can sustain a compressive stress of 30 MPa without fracture or creep. The physical properties of
PTFE are summarized in Table 3-9. A stainless steel plate embedded in the back-plate was used
as the mating surface of the sliding bearing.
Table 3-6 Dimensions and Properties of PTFE Disc
Diameter Dp 55 mm
Thickness tp 2.0 mm
Shape Factor S1 13.8
Friction Coef. µ 0.10 – 0.15
Table 3-7 Dimensions and Properties of Rubber Pad for Sliding Bearing
Property Rubber Pad
Outer Diameter D 120mm
Inner Diameter d 0mm
Unit Rubber Thickness tr 2.0mm
Number of Layers nr 5
Shim Plate Thickness ts 2.2mm
Total Rubber Height h 10.0mm
Rubber Compound Type Natural Rubber(NR):G12
Apparent Shear Modulus G 1.18MPa
1st Shape Factor S1 15
2nd Shape Factor S2 12
Horizontal Stiffness Kh 1.33kN/mm
Vertical Stiffness Kv 1372kN/mm

59
Table 3-8 Physical Properties* of Rubber Compound for Sliding Bearing
Property Specification
Hardness 65+5
Modulus at 25% 0.72+0.2MPa
Tensile Strength > 14.7MPa
Breaking Strain > 600%
Table 3-9 Physical Properties of PTFE Material for Sliding Bearing
Property Specification
Hardness
D-1706
D52 to D55
Tensile Strength D638 > 14.7 MPa
Breaking Strain D638 > 200%
3.3.3 Design Performance
The design characteristics of the complete isolation system are summarized in Table 3-10. The
initial stiffness, K1, is the summation of the initial stiffness of the rubber bearings and the
stiffness of the rubber pads in the sliding bearings. After the horizontal load reaches the
maximum static friction load, sliding bearings start to slide (sometimes called “break away”) and
the stiffness decreases to post-sliding stiffness, K2, which is basically the summation of the post-
yield stiffness of the rubber bearings. The designed natural period, Teq, of the system was 1.32
seconds at a deflection of 100 mm, calculated with the effective stiffness, Kh, which corresponds
to the gradient of the line from peak to peak of the bi-linear loop. With the post-sliding stiffness,
K2, the period of the system was calculated as 1.75 seconds. The former natural period is called
the equivalent natural period, Teq, whereas the latter is called the fundamental natural period, Tf.
In general, the natural period, Teq, of a base-isolated building varies from 2.0 to 3.0 seconds.
However, in this case, the small dead load of the transformer model limited the period to less
than 2.0 seconds. The equivalent damping ratio, heq, at 100 mm displacement was 27%, which is
relatively large damping compared with typical isolation systems.
* by JIS K 6301

60
Table 3-10 Design Parameter Values of Isolation System
Characteristics Designed Value
Pre-yield Stiffness K1 (kN/mm) 5.32
Post-yield Stiffness K2 (kN/mm) 0.323
x=100mm : 0.568 Effective Stiffness Kh (kN/mm)
x=200mm : 0.441
x=100mm : 0. 269 Equivalent Damping Ratio heq
x=200mm : 0.174
Vertical Stiffness Kv (kN/mm) 3360
x=100mm : 1.32 Effective Period Teq (sec)
x=200mm : 1.49
Fundamental Period Tf (sec) 1.75
Vertical Natural Freq. Fv (Hz) 58.3
3.3.4 Preliminary Performance Test
The sliding bearings and low-damping rubber bearings were manufactured by Bridgestone
Corporation in Japan. Before shipping to NCREE, all of the rubber bearings were tested for
quality assurance and evaluation of initial performance. The testing conditions and results from
those initial tests are shown in Table 3-11. The testing was carried out individually on all four
rubber bearings. Therefore, the results cannot be directly compared with the results of the
earthquake simulator testing, where each of the rubber bearing units consisted of two stacked
bearings.
The sliding bearings used in this testing were not subjected to an initial performance test.
However, the PTFE disc itself was tested and the results showed that the friction coefficient was
0.08 under a compressive stress of 10 MPa and a very low sliding velocity. In the earthquake
simulator testing, the sliding bearing was subjected to dynamic motion and the friction
coefficient was approximately 0.12.

61
Table 3-11 Initial Performance Test of Rubber Bearing
Testing Condition :
(1) Vertical Load : 29.4 kN (3.0tf)
Compressive stress : 0.32MPa
(2) Horizontal Displacement (Amplitude) : +96mm
(3) Number of Cycle : 3
(4) Horizontal Stiffness Kh is determined from the 3rd cycle.
Bearing No. Kh (kN/mm) G (MPa)
RB-1 0.319 0.438
RB-2 0.307 0.436
RB-3 0.330 0.453
RB-4 0.332 0.456
3.4 Testing Program
Three actual earthquake records were applied as the input earthquake ground motion. They were
1940 El Centro, 1994 Northridge (Sylmar), and 1995 Kobe (Takatori). Their response spectra
under 5 % damping are shown in Figure 3.6 together with the IEEE-693 Required Response
Spectrum. Each time-history record was normalized to PGA = 0.5 g. The dominant frequency is
high for El Centro (2 to 5 Hz) and for Northridge (Sylmar) (1.5 to 3.0 Hz), and very low for
Kobe (Takatori) (0.8 to 2 Hz). The Kobe (Takatori) record was considered as a
“disadvantageous” input for the isolated system because its dominant frequency was close to the
natural frequency of the isolated system and would cause large displacement in the isolation
bearings. Although PGA is still the most popular and convenient parameter to characterize the
earthquake intensity for general design purposes, the Peak Ground Velocity (PGV) is considered
to be another parameter to express intensity of an earthquake, representing the energy of the
seismic motion. The PGV of each motion with PGA normalized to 0.5g in the x-direction is as
follows:
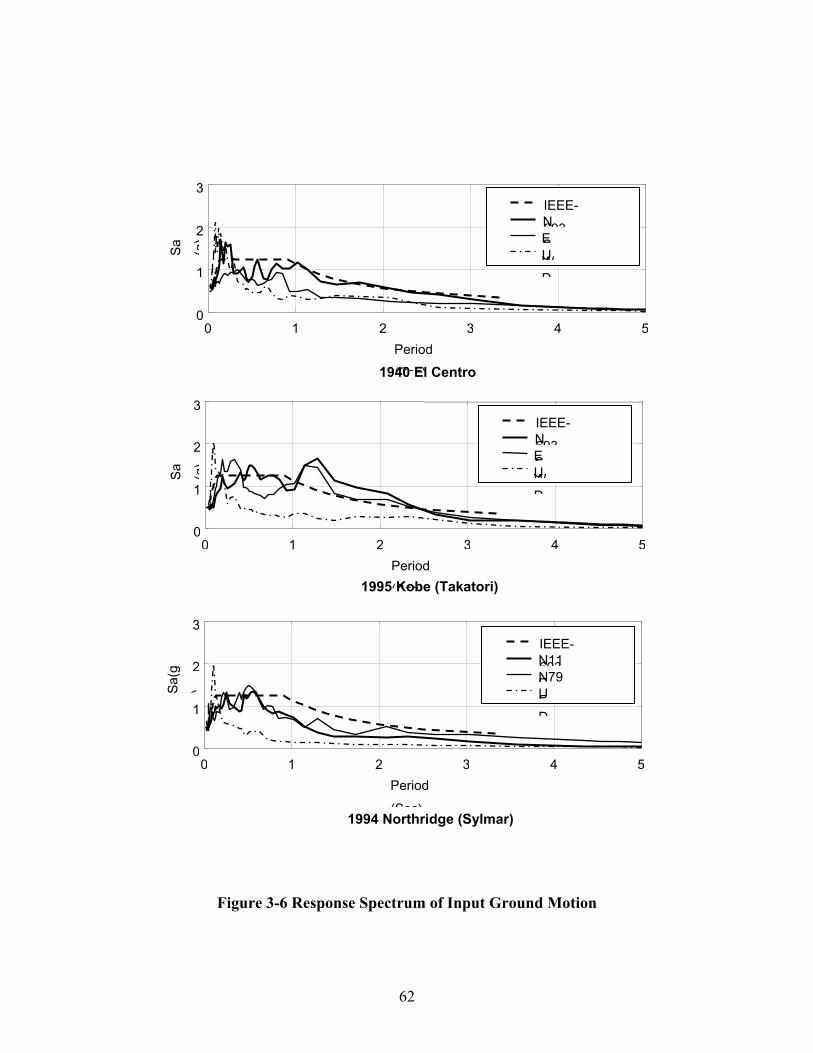
62
Figure 3-6 Response Spectrum of Input Ground Motion
0 1 2 3 4 50
1
2
3
Period (Sec)
Sa
(g)
IEEE-693NSEWUD
1940 El Centro
0 1 2 3 4 50
1
2
3
Period (Sec)
Sa
(g)
IEEE-693NSEWUD
1995 Kobe (Takatori)
0 1 2 3 4 50
1
2
3
Period (Sec)
Sa(g
)
IEEE-693N11EN79EUD
1994 Northridge (Sylmar)

63
1940 El Centro NS : 48.1cm/sec
1994 Northridge (Sylmar) NS : 79.3cm/sec
1995 Kobe (Takatori) EW : 105.7cm/sec
The earthquake simulator was excited in the x, x-y and x-y-z directions. The x-direction was set
as the main direction for excitation and the component with the largest PGA of each motion was
set as the x-direction excitation. The other components in the horizontal direction were set as the
y-direction motion and the up-down component as the z-direction motion.
Because the conventional seismic design parameter for electric facilities was PGA, it was used to
indicate the intensity of the earthquake motion in the tests. PGA was varied from 0.125g to
0.50g when using intervals of 0.125g. The detailed information about PGA in the earthquake
simulator testing is shown in Table 3-12. Because there were no spare bushings, a high PGA
that might damage the bushings during the testing was avoided. As a result, the maximum PGA
for the fixed-based cases was limited to 0.375g, where the maximum PGA for the base-isolated
cases was 0.5g. Only for the Northridge (Sylmar) input, a maximum PGA of 0.625g was tried.
Time scale was not applied to input ground motion.
The test case is identified with the code as follows.
[Example-1]
Bushing: 161 -kV
System: Fixed-base
Earthquake: El Centro, Target PGA 0.375g in x-direction
Code: 161kV/F/El Centro/x375
[Example-II]
Bushing: 69 kV
System: Base-isolated
Earthquake: Northridge (Sylmar), Target PGA 0.375g in x-direction,
0.25g in y-direction, and 0.25g in z-direction
Code: 69kV/B/Northridge/xyz375

64
Table 3-12 Target PGA of Earthquake Simulator Testing in Phase-1
(1) Base-isolated Case:
unit, g 1940 El Centro 1994 Northridge (Sylmar) 1995 Kobe (Takatori)
NS EW UD NS EW UD EW NS UD X y z x Y z x Y z 0.125 0.125
0.250 0.250 0.250 0.375 0.375 0.375 0.500 0.500 0.500
0.625
0.250 0.125 0.250 0.125 0.250 0.250 0.375 0.250 0.375 0.250 0.375 0.250
0.250 0.125 0.125 0.250 0.125 0.125 0.250 0.250 0.125 0.375 0.250 0.250 0.375 0.250 0.250 0.375 0.250 0.250 0.500 0.250 0.250 0.500 0.250 0.250
(2) Fixed-based Case:
1940 El Centro 1994 Northridge (Sylmar) 1995 Kobe (Takatori) NS EW UD NS EW UD EW NS UD x y z x Y z x y z 0.125 0.125
0.250 0.250 0.250 0.375 0.375 0.375
0.250 0.125 0.250 0.125 0.250 0.250 0.375 0.250 0.375 0.250 0.375 0.250
0.250 0.125 0.125 0.250 0.125 0.125 0.250 0.250 0.125 0.375 0.250 0.250 0.375 0.250 0.250 0.375 0.250 0.250

65
3.5 Dynamic Characterization of Transformer Model and Bushing
The dynamic characteristics of the transformer model and bushings were evaluated by random
wave excitation (Chopra). The transformer model, carrying the lead block weight without the
bushing, was subjected to a random wave with peak acceleration of 0.05g. The response
acceleration at the top of the transformer was measured and analyzed through Fast Fourier
Transform. Then, the transfer function was calculated against the input random wave and the
natural frequency was determined.
The dynamic characteristics of the bushings were investigated by mounting the bushings on the
upper part of the frame, which was designed as removable, in the transformer model as shown in
Figure 3-7. An example of the transfer function for the bushing is also shown in Figure 3-7. The
peak of the transfer function curve indicates the natural frequency for the 161-kV bushing was in
the range of 12-13 Hz for the x-, y-, yaw-x- and yaw-y- directions. For the 69-kV bushing, the
natural frequency was found to be around 27 Hz in the x-direction, 29.5Hz in the y-direction, and
25-30 Hz in yaw-x- and yaw-y- directions. The damping ratio was estimated around 1 to 2 % for
each mode of the bushings by the half-power bandwidth method. The natural frequencies in each
direction from the random shaking test are summarized in Table 3-13.
Table 3-13 Dynamic Characteristics of Transformer Model and Bushings
Unit, Hz
x-dir. y-dir. yaw-dir.
Transformer Model 12.5 12.5 x-12.5, y-13
161kV Bushing 12-13 12-12.5 x-, y- 12-13
69kV Bushing 27.0 29.0 x-, y- 25-30

66
AX1 long
AX3
ABX3
ABX4 DBX4
DBX3
DX3
x
z
0 5 10 15 20 25 30 35 400
5
10
15
20
25
30
35
40
45
50
frequency (Hz)
A(to
p)/A
(gro
und)
Transfer Function
Figure 3-7 Dynamic Characterization Test of Bushings

67
3.6 Test Results
The differences of response between base-isolated and fixed-base, between 161-kV and 69-kV
bushings, and between uni-, bi-, and tri-axial shakings are compared and discussed. In the
section of uni-axial shaking, fundamental performance of each element of the system was
analyzed and evaluated. In the sections of bi-axial shaking and tri-axial shaking, much attention
was paid to the difference between the responses under the bi-axial and tri-axial ground motions.
3.6.1 Uni-Axial Shaking
Under uni-axial shaking, the behavior of the system is straightforward and the fundamental
properties of each element in the system can be easily evaluated, whereas the force-displacement
relationship under bi- and tri-axial shaking revealed complicated locus caused by multi-
directional loading.
3.6.1.1 Response of Transformer/Bushing System
161 -kV Bushing:
Figure 3-8 shows the comparison of response acceleration time histories at the transformer
model with and without base isolation under the El Centro 0.375g. In the fixed-base model, the
peak response acceleration at the top of the transformer was amplified to 0.747g from the PGA
of 0.339g.
Figure 3-9 shows the comparison of response acceleration time histories at node-3 (upper
middle) and node-4 (top) of the 161-kV bushing with and without base isolation under the El
Centro 0.375g. Without base isolation, the peak acceleration at the top of the bushing reached
3.66g resulting in an amplification factor to PGA of 10.80. On the other hand, with base
isolation, the peak response acceleration at the top of bushing was 0.354g and the resulting
amplification factor was 1.05. Similar testing results under the Kobe (Takatori) excitations are
shown in Figures 3-10 and 3-11. Peak response accelerations at transformer-bottom,
transformer-top, and bushing-top are plotted as a function of PGA in Figures 3-12 to 3-14. The

68
effectiveness of base isolation was clearly observed, especially in terms of the response of the
bushing top. Base isolation becomes more effective as PGA becomes larger, which is typical of
an isolation system with sliding bearings. Among the three earthquake motions, the largest
response in the base-isolated system was observed under the Kobe (Takatori) earthquake, as
predicted. The peak response acceleration was 1.0g at the top of the bushing and less than 1/3 of
that in the fixed-base system.
Figures 3-15 and 3-16 plot the distribution of the response acceleration at different measurement
points including platform (ground), bottom, and top of the transformer and top of the bushing,
under Northridge and Kobe. The effectiveness of base isolation is very evident in the plots. In
the base-isolated system, the amplification of the response acceleration is very small from the
bottom to the top of transformer. These results indicate the base-isolated transformer body can
be considered as a single mass. The response displacement of each measurement point is also
plotted in Figures 3-17 and 3-18. Large displacement was observed in the isolation system.
The Fourier amplitudes of the response accelerations at the tops of the transformer and the 161
kV bushing are compared in Figure 3-19. In the base-isolated system, it was observed that the
transformer was not sensitive to the ground motion. In the fixed-base system, the interaction of
the transformer and the bushing was observed. The response accelerations at different
measurement points on the bushing under the Kobe (Takatori) 0.375g are displayed in Figure 3-
20. The shape of the response acceleration distribution indicates that the rocking motion around
the fixed end is the dominant movement of the bushing during shaking. The rocking stiffness at
the fixed end will characterize the frequency of the bushing.
In Figure 3-21, the change of axial load on each sliding bearing caused by overturning of the
transformer/161-kV bushing system is plotted under the Northridge (Sylmar) 0.375g. The
maximum change of the vertical load occurred at Slider-WN-- 40% of the initial load. Initial
vertical load of each bearing was 41.3kN for NW, 76.0kN for NE, 73.8kN for SW, and 44.4kN
for SE. The reason of the initial load distribution is assumed that the stiffness of transformer
model is extremely high and the small difference of column height generated the distribution of
the load.

69
69-kV Bushing:
Figures 3-22 and 3-23 compare the peak response accelerations of the transformer/69-kV
bushing system with and without base isolation. The peak response acceleration at the bushing
top in the fixed-base system was reduced to 1/3 of that in the 161-kV system. The difference in
responses between the base-isolated and fixed-base system was relatively small.
The 69-kV bushing, whose fundamental frequency is over 25 Hz, was totally insensitive to the
seismic excitations, according to the dynamic characterization results shown in Table 3-13.
Therefore, the acceleration amplification factor in the fixed-base system with the 69-kV bushing
was also small, showing that little improvement can be made by the base isolation system. The
results proved that those bushings with a high frequency have few problems in seismic damage.
3.6.1.2 Performance of Isolation System
Figures 3-24 and 3-25 show examples of horizontal force-displacement loops for a sliding
bearing and a rubber bearing. Because the weight of the transformer model was not uniformly
distributed to each column, the friction force generated at each sliding bearing differs. The axial
load, friction coefficient, and compressive stress on each PTFE disc are summarized in Table 3-
14. The compressive stress varied from 17.4 to 32.0 MPa and the friction coefficient from 0.145
to 0.102, as a function of the stress. The change in vertical load due to the overturning moment
made the loops of each sliding bearing asymmetrical.
An example of the force-displacement loop of the rubber bearings under the Kobe (Takatori)
161kV/x0375g is shown in Figure 3-26. The maximum displacement was 124 mm,
corresponding to a rubber shear strain of 64.6%. The rubber bearing exhibited a linear-elastic
behavior, typical of its natural rubber compound.
The total force-displacement loops of the isolation system, including the rubber and sliding
bearings, are plotted in Figure 3-23 by superposition of the force-displacement loops of all the

70
bearings. The system performance for K1, K2 and Qd were estimated from the curve and listed in
Table 3-15. They agreed very well with the designed values in Table 3-8.
Table 3-14 Friction Coefficient and Compressive Stress on Sliding Bearing
(Evaluated from the performance loops in case of 161kV/Kobe (Takatori),x0.375g)
Location Axial Load (KN) Friction Coef. Compressive Stress (MPa)
E-N 76.0 0.105 32.0
E-S 44.4 0.130 18.7
W-N 41.3 0.145 17.4
W-S 73.8 0.102 31.1
Table 3-15 Total Performance of Isolation System
( Evaluated from the performance in case of 161kV/Kobe (Takatori), x0.375g)
K1 (kN/mm) 5.17
K2 (kN/mm) 0.356
Qd (kN) 27.3
Qd/Pv 0.116 (=average friction coef.)
Tf (sec) 1.63
Pv: Total Axial Load =235.5kN
Tf: Fundamental Period

71
0 10 20 30 40 50-1
-0.5
0
0.5
1
max= 0.24614
ABX3 : bushing node-3
Time (sec)
Acc
ele
ratio
n(g
)
0 10 20 30 40 50-1
-0.5
0
0.5
1
max= 0.35365
ABX4 : bushing node-4
Time (sec)
Acc
ele
ratio
n(g
)
0 10 20 30 40 50-3
-2
-1
0
1
2
3
max= 1.5844
ABX3 : bushing node-3
Time (sec)
Acc
ele
ratio
n(g
)
0 10 20 30 40 50-4
-2
0
2
4
max= 3.6617
ABX4 : bushing node-4
Time (sec)
Acc
ele
ratio
n(g
)
0 10 20 30 40 50-1
-0.5
0
0.5
1
max= 0.33654
AX1 : ground motion
Time (sec)
Acc
ele
ratio
n (g
)
0 10 20 30 40 50-1
-0.5
0
0.5
1
max= 0.1969
AX2 : bottom of transformer
Time (sec)
Acc
ele
ratio
n (g
)
0 10 20 30 40 50-1
-0.5
0
0.5
1
max= 0.21681
AX3 : top of transformer
Time (sec)
Acc
ele
ratio
n (g
)
0 10 20 30 40 50-1
-0.5
0
0.5
1
max= 0.33897
AX1 : ground motion
Time (sec)
Acc
ele
ratio
n (g
)
0 10 20 30 40 50-1
-0.5
0
0.5
1
max= 0.35063
AX2 : bottom of transformer
Time (sec)
Acc
ele
ratio
n (g
)
0 10 20 30 40 50-1
-0.5
0
0.5
1
max= 0.7467
AX3 : top of transformer
Time (sec)
Acc
ele
ratio
n (g
)
Figure 3-8 Time History of Transformer Response Acceleration:
161kV/El Centro/x375
Base-isolated
Base-isolated Fixed-base
Fixed-base
Upper Middle
Top
Figure 3-9 Time History of Bushing Response Acceleration:
161kV/El Centro/x375
Platform
Bottom
Top

72
0 5 10 15 20 25 30 35 40-1
-0.5
0
0.5
1
max= 0.37509
AX1 : ground motion
Time (sec)
Acc
ele
ratio
n (g
)
0 5 10 15 20 25 30 35 40-1
-0.5
0
0.5
1
max= 0.26969
AX2 : bottom of transformer
Time (sec)
Acc
ele
ratio
n (g
)
0 5 10 15 20 25 30 35 40-1
-0.5
0
0.5
1
max= 0.2825
AX3 : top of transformer
Time (sec)
Acc
ele
ratio
n (g
)
0 5 10 15 20 25 30 35 40-1
-0.5
0
0.5
1
max= 0.37094
AX1 : ground motion
Time (sec)
Acc
ele
ratio
n (g
)
0 5 10 15 20 25 30 35 40-1
-0.5
0
0.5
1
max= 0.36114
AX2 : bottom of transformer
Time (sec)
Acc
ele
ratio
n (g
)
0 5 10 15 20 25 30 35 40-1
-0.5
0
0.5
1
max= 0.56862
AX3 : top of transformer
Time (sec)
Acc
ele
ratio
n (g
)
Figure 3-10 Time History of Transformer Response Acceleration:
161kV/Kobe/x375
0 5 10 15 20 25 30 35 40-1
-0.5
0
0.5
1
max= 0.27783
ABX3 : bushing node-3
Time (sec)
Acc
ele
ratio
n(g
)
0 5 10 15 20 25 30 35 40-1
-0.5
0
0.5
1
max= 0.36532
ABX4 : bushing node-4
Time (sec)
Acc
ele
ratio
n(g
)
0 5 10 15 20 25 30 35 40-2
-1
0
1
2
max= 1.4777
ABX3 : bushing node-3
Time (sec)
Acc
ele
ratio
n(g
)
0 5 10 15 20 25 30 35 40-3
-2
-1
0
1
2
3
max= 2.902
ABX4 : bushing node-4
Time (sec)
Acc
ele
ratio
n(g
)
Figure 3-11 Time History of Bushing Response Acceleration:
161kV/Kobe /x375
Base-isolated
Base-isolated
Fixed-base
Fixed-base
Platform
Bottom
Top
Upper Middle
Top

73
0 0.1 0.2 0.3 0.4 0.5 0.60
0.5
1
1.5
2
2.5
3
3.5
4
4.5
5
Peak G round Acceleration (g)
Maximum Respose Acceleration (g)
FB:Trans.FB:Bush. FF:Trans.FF:Bush.
Figure 3-12 Response Acceleration vs. Peak Ground Acceleration
in 161kV/ElCentro/ Uni-Axial shaking
0 0.1 0.2 0.3 0.4 0.5 0.6 0.7 0.80
0.5
1
1.5
2
2.5
3
3.5
4
4.5
5
Peak G round Acceleration (g)
Maximum Respose Acceleration (g)
FB:Trans.FB:Bush. FF:Trans.FF:Bush.
Figure 3-13 Response Acceleration vs. Peak Ground Acceleration
in 161kV/Northridge/ Uni-Axial shaking
: Base-Iso. Transformer : Base-Iso。Bushing : Fixed-Base Transformer : Fixed-Base Bushing
: Base-Iso. Transformer : Base-Iso。Bushing : Fixed-Base Transformer : Fixed-Base Bushing

74
0 0.1 0.2 0.3 0.4 0.5 0.60
0.5
1
1.5
2
2.5
3
3.5
4
4.5
5
Peak G round Acceleration (g)
Maximum Respose Acceleration (g)
FB:Trans.FB:Bush. FF:Trans.FF:Bush.
Figure 3-14 Response Acceleration vs. Peak Ground Acceleration
in 161kV/Kobe/ Uni-Axial shaking
: Base-Iso. Transformer : Base-Iso。Bushing : Fixed-Base Transformer : Fixed-Base Bushing

75
0 1 2 3 4G round
Trans.Bottom
Trans.Top
Bushing Top
M axim um Response Acceleration (g)
FFFB
Figure 3-15 Maximum Response Acceleration: 161kV/Northridge/x375
0 1 2 3 4G round
Trans.Bottom
Trans.Top
Bushing Top
M axim um Response Acceleration (g)
FFFB
Figure 3-16 Maximum Response Acceleration: 161kV/Kobe/x375
: Base-Isolated : Fixed-Base
: Base-Isolated : Fixed-Base

76
0 50 100 150G round
Trans.Bottom
Trans.Top
Bushing Top
M axim um Response Displacem ent (m m )
FFFB
Figure 3-17 Maximum Response Displacement: 161kV/Northridge/x375
0 50 100 150G round
Trans.Bottom
Trans.Top
Bushing Top
M axim um Response Displacem ent (m m )
FFFB
Figure 3-18 Maximum Response Displacement: 161kV/Kobe/x375
: Base-Isolated : Fixed-Base
: Base-Isolated : Fixed-Base

77
0 5 10 15 20 250
0.5
111.1694
Frequency (Hz)
Norm
alized F. Amp.(-) Transform er-top
0 5 10 15 20 250
0.5
111.1816
Frequency (Hz)
Norm
alized F. Amp.(-) B ushing-top
[ Fixed-base ]
0 5 10 15 20 250
0.5
11.1719
Frequency (Hz)
Norm
alized F. Amp.(-) Transform er-top
0 5 10 15 20 250
0.5
11.1719
Frequency (Hz)
Norm
alized F. Amp.(-) B ushing-top
[ Base-isolated ]
Figure 3-19 FFT Analysis of Response Acceleration in 161kV/ El Centro/x375

78
Figure 3-20 Distribution of Response Acceleration
at Bushing,161kV/Kobe/x375
-5 -4 -3 -2 -1 0 1 2 3 4 5-150
-100
-50
0
50
100
150
200
250
Node Reponse Acceleration
Nod
e P
ositi
on in
z-d
ir.
←Node 4: Top
←Node 3: U. Middle
←Node 2: L. Middle
←Node 1: Bottom
Mounting Face
Kobe-Takatori: Fixed Base
-5 -4 -3 -2 -1 0 1 2 3 4 5-150
-100
-50
0
50
100
150
200
250
Node Reponse Acceleration
Nod
e P
ositi
on in
z-d
ir.
←Node 4: Top
←Node 3: U. Middle
←Node 2: L. Middle
←Node 1: Bottom
Mounting Face
Kobe-Takatori: Base Isolated1995 Kobe (Takatori) : Base-isolated
1995 Kobe (Takatori) : Fixed-base

79
0 10 20 30-100
-50
0
50
100Vertical Load on Slider-NE:Init Load 76.0kN
Time(sec)
Cha
nge
of V
ertic
al L
oad
(%)
0 10 20 30-100
-50
0
50
100Vertical Load on Slider-NW:Init Load 41.3kN
Time(sec)
Cha
nge
of V
ertic
al L
oad
(%)
0 10 20 30-100
-50
0
50
100Vertical Load on Slider-SE:Init Load 44.4kN
Time(sec)
Cha
nge
of V
ertic
al L
oad
(%)
0 10 20 30-100
-50
0
50
100Vertical Load on Slider-SW:Init Load 73.8kN
Time(sec)
Cha
nge
of V
ertic
al L
oad
(%)
Figure 3-21 Change of Vertical Load on Sliding Bearings: 161kV/ Kobe/x375

80
0 1 2 3 4G round
Trans.Bottom
Trans.Top
Bushing Top
M axim um Response Acceleration (g)
FF
FB
Figure 3-22 Maximum Response Acceleration: 69kV/Northridge/x375
0 1 2 3 4G round
Trans.Bottom
Trans.Top
Bushing Top
M axim um Response Acceleration (g)
FFFB
Figure 3-23 Maximum Response Acceleration: 69kV/Kobe/x375
: Base-Isolated : Fixed-Base
: Base-Isolated : Fixed-Base

81
-250 -200 -150 -100 -50 0 50 100 150 200 250-50
-40
-30
-20
-10
0
10
20
30
40
50
Displacem ent(m m )
Shear force (kN
)
Figure 3-24 Force-Displacement Curve of Sliding Bearing: 161kV/B/Kobe/x500
-250 -200 -150 -100 -50 0 50 100 150 200 250-50
-40
-30
-20
-10
0
10
20
30
40
50
Displacem ent(m m )
Shear force (kN
)
Figure 3-25 Force-Displacement Curve of Low-damping Rubber Bearing:
161kV/B/Kobe/x500

82
-250 -200 -150 -100 -50 0 50 100 150 200 250-150
-100
-50
0
50
100
150
Displacem ent(m m )
Shear force (kN
)
Figure 3-26 Total Force-Displacement Curve of Isolation System
in 161kV/B/Kobe/x375

83
3.6.2 Bi-Axial Shaking
The bi-axial shaking test showed similar results to those of the uni-axial shaking. Figure 3-27
shows the correlation between the response accelerations at the top of the bushing (AB4) and the
transformer (A3), in the x-direction under the uni- and bi-axial excitations. Each point plotted on
the figure is the result under uni- and bi-axial excitations with the same PGA in the x-direction.
In the fixed-base system, a strong correlation was demonstrated both fixed and isolated systems
at top of transformer. In the base-isolated system, however, a weak correlation was observed at
top of bushing.
The force-displacement curves of the sliding bearings and the rubber bearings under the Kobe
(Takatori) x0375gy025g are shown in Figure 3-28. The sliding bearings exhibited complicated
loops caused by the plane movement of the transformer model. Assume that the force-
displacement loops for the sliding bearing under uni-axial shaking is a rectangular shape with a
friction force of QS. When the sliding bearing moves in the x-y plane, the x-component of the
friction force Qx at time t is expressed as follows:
Applying (3-1), Qx(t) was calculated using the actual locus(x,y) measured during the Kobe
(Takatori) x0375gy025g excitation and plotted in Figure 3-29. The loops show very good
agreement with the actual test results and verified the relationship expressed in (3-1). The total
force-displacement curves in x- and y-directions under the Kobe (Takatori) x0375gy025g are
shown in Figure 3-30. Compared with Figure 3-26 under the uni-axial shaking, the effect of
multi-axial shaking on the performance of the isolation system can be observed.
(3-1) 2222
,
,
yxy
yxx
QQQQ
yx
ySyxSx
∆+∆
∆=∆+∆
∆=
×=×=
αα
αα
( ) ( ) )1()(,1
where,
−−=∆−−=∆ tytyytxtxx

84
The locus of the gravity center under Kobe (Takatori) x0375gy025g, the largest input to the
base-isolated system, is shown in Figure 3-31. The maximum deflection of the rubber bearing
under the Kobe (Takatori) was 177.6 mm, corresponding to a rubber shear strain of 92.5%.
3.6.3 Tri-Axial Shaking
Under the tri-axial (tri) shaking, the responses of the transformer/bushing system showed
significant difference from those under the uni and bi-axial shaking. The response accelerations
at the tops of the bushing for both 161-kV and 69-kV bushings on the isolated transformer were
amplified and, in some cases, the response exceeded that of the fixed-base system.
Figure 3-32 shows the time-history of the response acceleration in the x-direction of the case
161kV/Northridge/xyz375, for the base-isolated and fixed-base systems. The acceleration at the
bushing top with base isolation reached 1.0g and the amplification of the input was about 3.
Amplification on the bushing was not observed in uni-axial and bi-axial shaking in the base-
isolated system. This phenomenon was a very significant finding through Phase-1 testing.
Figures 3-33, 3-34 and 3-35 compare the peak response acceleration along the height of the
transformer under uni-, bi-, and tri-axial shaking in the cases of 161kV/Northridge, 161kV/Kobe,
and 161kV/El Centro.
Figure 3-36 shows the correlation between the response accelerations at the tops of the bushing
and the transformer under the bi- and tri-axial shaking. In the fixed-base system, there was a
linear correlation between the bi- and tri-axial shaking. In other words, the vertical ground
motion had little effect on the responses in the horizontal directions. However, in the base-
isolated system, there was no linear correlation between the bi- and tri-axial shaking. The
response under the tri-axial excitation was much larger than that under the bi-axial shaking with
the same intensity of ground motion.
Figure 3-37 shows the comparison of the vertical load on the sliding bearings under bi- and tri-
axial shaking for the 69kV system. The vertical load change under bi-axial shaking was caused

85
by overturning of the transformer, whereas under tri-axial shaking the vertical load change was
caused by the combination of overturning-load and vertical ground motion.
In Figure 3-38, the total force-displacement curves of the sliding bearings under the bi- and tri-
axial shaking are compared. The loops under tri-axial shaking were obviously affected by the
change of vertical load due to the vertical excitation. From the above discussion, it was deduced
that the high frequency factor on the friction force of the sliding bearings, which was caused by
the vertical excitation, affected the bushing response. The 161kV bushing showed better results
because the natural frequency of this bushing was lower than that of the 69-kV bushing.
3.7 Summary
The uni-axial, bi-axial and tri-axial seismic simulator testing was carried out for both the fixed-
base and the based-isolated transformer/bushing systems. The input motions were the 1940 El
Centro, 1994 Northridge (Sylmar), and 1995 Kobe (Takatori) earthquake ground motion records.
Under the uni-axial shaking, the response of the base-isolated transformer/bushing system
showed obvious improvement compared to the fixed-base system. Particularly in the 161kV
bushing/transformer system, the response acceleration observed on the bushing attached on the
fixed-base transformer showed severe amplification, whereas the corresponding amplification in
the base-isolated system remained well confined.
Under the bi-axial horizontal shaking, the base-isolated system in general showed improved
responses, although in some cases the amplification at the top of the bushing increased compared
with those under the uni-axial shaking.
Under the tri-axial shaking with the vertical ground motion introduced, the response acceleration
at the top of the bushing was amplified more in the base-isolated system than the same system
under bi-axial horizontal shaking with the same x and y intensities. In some cases, the base-
isolated system showed larger response accelerations than those of the fixed-base system.

86
Fixed-Based : 1D-X v.s. 2D-X
0
0.5
1
1.5
2
2.5
3
0 0.5 1 1.5 2 2.5 3ABX4(1D)
AB
X4(2
D)
69kV system161kV system
Fixed-Based : 1D-X v.s. 2D-X
0
0.2
0.4
0.6
0.8
1
1.2
0 0.2 0.4 0.6 0.8 1 1.2AX3(1D)
AX3
(2D
)
69kV system161kV system
Base-Isolated : 1D-X v.s. 2D-X
0
0.2
0.4
0.6
0.8
1
1.2
0 0.2 0.4 0.6 0.8 1 1.2ABX4(1D)
AB
X4(2
D)
69kV system161kV system
Base-Isolated : 1D-X v.s. 2D-X
0
0.2
0.4
0.6
0.8
1
1.2
0 0.2 0.4 0.6 0.8 1 1.2AX3(1D)
AX3
(2D
)
69kV system161kV system
Figure 3-27 Correlation between Response Accelerations under Uni- and
Bi-Axial Shaking
Trans. Top Trans. Top
Bushing Top Bushing Top

87
-300 -200 -100 0 100 200 300-20
-15
-10
-5
0
5
10
15
20Slider W-N
Displacement(mm)
She
ar fo
rce
(kN
)
Xmax= 162.5416
Qmax= 9.9821
-300 -200 -100 0 100 200 300-20
-15
-10
-5
0
5
10
15
20Slider W-S
Displacement(mm)
She
ar fo
rce
(kN
)
xmax= 162.5416
Qmax= 9.0963
-150 -100 -50 0 50 100 150-30
-20
-10
0
10
20
30Elastomeric Bearing-1
Displacement(mm)
She
ar fo
rce
(kN
)
xmax= 125.631
Qmax= 19.3679
Figure 3-28 Force-Displacement Curve of Sliding Bearing and
Low-Damping Rubber Bearing under Bi-Axial Shaking:
161kV/B/Kobe /xy375, x-dir., W-N, W-S

88
-300 -200 -100 0 100 200 300-100
-80
-60
-40
-20
0
20
40
60
80
100Slider Total
Displacement(mm)
She
ar F
orce
(kN
)
xmax= 162.5416
Qave= 30.9095
-300 -200 -100 0 100 200 300
-3
-2
-1
0
1
2
3
Computed Slider Performance in x-y plane
Displacement(mm)
Nor
mal
ized
She
ar F
orce
for
x-di
rect
ion
Figure 3-29 Comparison of Experimental and Analytical Force-Displacement
Curves of Sliding Bearing
Qmax=

89
-200 -150 -100 -50 0 50 100 150 200-80
-60
-40
-20
0
20
40
60
80
Horizontal Disp.(mm)
Ho
rizon
tal L
oad
(kN
)
Figure 3-30 Total Force-Displacement Curve under Bi-Axial Shaking:
161kV/B/Kobe /xy375
-200 -150 -100 -50 0 50 100 150 200-200
-150
-100
-50
0
50
100
150
200
xmax= 141.0855
ymax= 149.2706
Movement at gravity center : bottom of transformer
x-Displacement(mm)
y-D
ispl
acem
ent(
mm
)
Figure 3-31 Locus of Center at Transformer Bottom under Bi-Axial Shaking:
161kV/B/Kobe/xy375

90
0 5 10 15 20 25 30-4
-2
0
2
4
max= 0.39654
ABX3 : bushing node-3
Time (sec)
Acc
eler
atio
n(g)
0 5 10 15 20 25 30-4
-2
0
2
4
max= 1.0116
ABX4 : bushing node-4
Time (sec)
Acc
ele
ratio
n(g
)
0 5 10 15 20 25 30-4
-2
0
2
4
max=
1.2731
ABX3 : bushing node-3
Time (sec)
Acc
eler
atio
ng
0 5 10 15 20 25 30-4
-2
0
2
4
max= 2.6614
ABX4 : bushing node-4
Time (sec)
Acc
eler
atio
ng
Fixed-base
Figure 3-32 Response Acceleration at the Top of 161kV Bushing under
Tri-Axial Shaking: 161kV/B/Northridge / xyz375, Acceleration
in x-dir.
Base-isolated

91
0 0.5 1 1.5 2G round
Trans.Bottom
Trans.Top
Bushing Top
M axim um Response Acceleration (g)
x375 xy375 xyz375
Figure 3-33 Comparison of Maximum Response Acceleration in Uni-, Bi-, and
Tri-Axial Shaking: 161kV/B/Northridge/x, xy, xyz375
0 0.5 1 1.5 2G round
Trans.Bottom
Trans.Top
Bushing Top
M axim um Response Acceleration (g)
x375 xy375 xyz375
Figure 3-34 Comparison of Maximum Response Acceleration in Uni-, Bi-, and
Tri-Axial Shaking: 161kV/B/Kobe/x, xy, xyz375

92
0 0.5 1 1.5 2G round
Trans.Bottom
Trans.Top
Bushing Top
M axim um Response Acceleration (g)
x375 xy375 xyz375
Figure 3-35 Comparison of Maximum Response Acceleration in Uni-, Bi-, and
Tri-Axial Shaking: 161kV/B/El Centro/x,xy,xyz375

93
Base Isolated : 2D-X v.s. 3D-X
0
0.2
0.4
0.6
0.8
1
1.2
0 0.2 0.4 0.6 0.8 1 1.2AX3(2D)
AX3
(3D
)
69kV system161kV system
Base Isolated : 2D-X v.s. 3D-X
0
0.2
0.4
0.6
0.8
1
1.2
0 0.2 0.4 0.6 0.8 1 1.2ABX4(2D)
AB
X4(3
D)
69kV system161kV system
Fixed Base : 2D-X v.s. 3D-X
0
0.2
0.4
0.6
0.8
1
1.2
0 0.2 0.4 0.6 0.8 1 1.2AX3(2D)
AX3
(3D
)
69kV system161kV system
Fixed Base: 2D-X v.s. 3D-X
0
0.5
1
1.5
2
2.5
3
0 0.5 1 1.5 2 2.5 3ABX4(2D)
AB
X4(3
D)
69kV system161kV system
Fixed-base Base-isolated
Bushing Top
Trans. Top
Trans. Top
Bushing Top
Figure 3-36 Correlation between the Response Accelerations
under Bi and Tri-Axial Shaking

94
bi-axial shaking : 69kV/Northridge (Sylmar) x0375gy025g, Base-isolated
0 10 20 30 40-100
-50
0
50
100Vertical Load on Slider-NE:Init Load 76.0kN
Time(sec)
Cha
nge
of V
ertic
al L
oad
(%)
0 10 20 30 40-100
-50
0
50
100Vertical Load on Slider-NW:Init Load 41.3kN
Time(sec)
Cha
nge
of V
ertic
al L
oad
(%)
0 10 20 30 40-100
-50
0
50
100Vertical Load on Slider-SE:Init Load 44.4kN
Time(sec)
Cha
nge
of V
ertic
al L
oad
(%)
0 10 20 30 40-100
-50
0
50
100Vertical Load on Slider-SW:Init Load 73.8kN
Time(sec)
Cha
nge
of V
ertic
al L
oad
(%)
tri-axial shaking : 69kV/Northridge (Sylmar) x0375gy025gz025g, Base-isolated
0 10 20 30 40-100
-50
0
50
100Vertical Load on Slider-NE:Init Load 76.0kN
Time(sec)
Cha
nge
of V
ertic
al L
oad
(%)
0 10 20 30 40-100
-50
0
50
100Vertical Load on Slider-NW:Init Load 41.3kN
Time(sec)
Cha
nge
of V
ertic
al L
oad
(%)
0 10 20 30 40-100
-50
0
50
100Vertical Load on Slider-SE:Init Load 44.4kN
Time(sec)
Cha
nge
of V
ertic
al L
oad
(%)
0 10 20 30 40-100
-50
0
50
100Vertical Load on Slider-SW:Init Load 73.8kN
Time(sec)
Cha
nge
of V
ertic
al L
oad
(%)
Figure 3-37 Comparison of the Vertical Load on Sliding Bearing
under Bi- and Tri-Axial Shaking

95
Figure 3-38 Force-Displacement Curve of Sliding Bearing under Bi- and
Tri-Axial Shaking: 69kV/B/Northridge /xy375,xyz375, x-dir.
-60 -40 -20 0 20 40 60-50
-40
-30
-20
-10
0
10
20
30
40
50Slider Total
Displacem ent(m m )
Shear Force (kN
)
xm ax= 56.1785
Q ave= 34.2699
[3D-shaking]
-60 -40 -20 0 20 40 60-50
-40
-30
-20
-10
0
10
20
30
40
50Slider Total
Displacem ent(m m )
Shear Force (kN
)xm ax= 42.4482
Q ave= 28.7608
[2D-shaking] xmax= 42.4482 Qmax=28.7608
xmax= 56.1785 Qmax=34.2699


97
SECTION 4 EARTHQUAKE SIMULATOR TEST/PHASE-2
4.1 Overview
In Phase-2, the segmented high-damping bearings were used as isolators, and a flexible rubber
ring was developed and installed between the flanges of bushing and transformer top to change
the dynamic characteristics of the bushing. The frequency was shifted to low-range (assuming a
large-size bushing such as 500-kV) that is generally sensitive to ground motion. The artificial
wave matching to IEEE693-1997 REQUIRED RESPONSE SPECTRUM was generated and
applied.
4.2 Experimental Setup
The basis of the experimental setup of Phase-2 was almost the same as that of Phase-1. As
described later, the weight of the transformer model was reduced and a scale factor was
introduced. Figure 4-1 shows the test setup of base-isolated model.
4.2.1 Transformer Model
The total weight of the transformer model was decreased from 241kN in Phase-1 to 141kN
considering the stability of the segmented isolators. The other dimensions were the same as that
of Phase-1. According to the dynamic identification test results, the natural frequencies of the 1st
and 2nd modes were 12.3 Hz and 28.9 Hz, respectively.
4.2.2 Porcelain Bushing
From the results of Phase-1, it is concluded that the 69-kV bushing had a frequency high enough
to be insensitive to ground motion. Therefore, only the 161-kV bushing was used in Phase-2.

98
Figure 4-1 Test Set-Up of Phase-2 Testing

99
4.3 Segmented High-Damping Rubber Bearing Isolation System
Figure 4-2 shows the segmented high-damping rubber bearing (SHRB) used in this test (Masaki,
1999). The isolation system consisted of four stacks of three element bearings. The thick plates
between each bearing layer were designed to work as stabilizers during large displacement. The
element bearings had a maximum shear-strain capacity of 250%. The total maximum
displacement of SHRB was around 200 mm. The nominal compressive stress was 4.0 MPa. The
design shear modulus and equivalent damping ratio at 100% shear strain was 0.61 MPa and 16%,
respectively. The diameter of the element bearing was 72 mm and the thickness of the unit
rubber layer was 0.9 mm. The number of layers was 31 and the total rubber height was 27.9 mm.
The first and second shape factors, S1 and S2, of the element bearings were 20 and 2.58. The
element bearing itself had poor stability characteristics because of its slim shape, or a small S2.
Therefore, the stabilizing plates installed between each layer of SHRB allow large displacement
without instability. The design fundamental period of the transformer model sustained by the
four SHRB was computed as 1.32 seconds. The design properties are summarized in Table 4-1.
Table 4-1 Design Properties of Segmented Rubber Bearings
1. Element bearing Unit rubber thickness tr 0.9 (mm) Number of layers nr 31 (-) Total rubber height hr 27.9 (mm) Rubber diameter D 72 (mm) First Shape Factor S1 20 (-) Second Shape Factor S2 2.58 (-) Effective area Aeff 4071.50 (mm2)
Shear modulus G 0.418 (N/mm2) Shear stiffness Kh 60.99 (N/mm) Shear force at 300% Qmax 5615.7 (N)
2. Assembled bearing Shear stiffness KhT 81.3 (N/mm) Total rubber height Hr 111.6 (mm)
3. Design compressive force 141 (kN) 4. Fundamental period Tf 1.32 (sec)

100
Figure 4-2 Segmented High-Damping Rubber Bearing

101
4.4 Flexible Rubber Ring
In order to evaluate the response of the bushing under a low frequency, like 3.0 Hz, a flexible
rubber ring (shown in Figure 4.3) was specially designed and manufactured, and was mounted
between the top of the turret and the flange of the bushing. The rubber ring was designed to
contribute to the rocking motion of the bushing and shift the fundamental period of the bushing
with its low tilting stiffness. The tilting stiffness rK of the rubber ring is calculated by the
following equation:
where,
bentE is the apparent Young’s modulus of rubber
0E is Young’s modulus of rubber ( )modulus shear:G,G3≈ =2.2MPa
∞E is bulk modulus of rubber =1200 MPa for this compound
1S is first shape factor of rubber ring
κ is correction factor, =0.85 for this compound
t is rubber-layer thickness
I is second section modulus of the ring
A low damping rubber compound was used, with a shear modulus of 0.4 MPa--one of the softest
compounds in practical use for isolation bearings. The design characteristics of the rubber ring
are shown in Table 4-2.
∞
++
=
⋅=
ESEE
tIEK
bent
bentr
1)3
21(11
210 κ
(4-1)
(4-2)

102
Figure 4-3 Flexible Rubber Ring
Flange of bushing
Porcelain Bushing 161kV
)
φ460
φ4500
φ580
101
φ356
Steel plate bonded to rubber
Rubber layer t=30mm

103
Table 4-2 Design Parameters of Flexible Rubber Ring
tr 30 (mm) Eb 2.845 (MPa) D 460 (mm) I 1.4094e+9 (mm4)
d 356 (mm) Kr 133636.9 (kN・mm)
A 66652.0 (mm2) W 3.43 (kN)
S1 0.867 ( - ) σ 0.05199 (MPa)
E 2 (MPa) hg 1000 (mm)
k 0.85 ( - ) W hg23430000 (kN・mm2)
Em 1200 (MPa) Tr 0.32 (sec) Eb' 2.851 (MPa) f 3.11 (Hz)
4.5 Testing Program
The differences between the Phase-2 and the Phase-1 testing programs were the isolator system,
the input ground motion, the total weight of the model, the application of the flexible rubber ring,
and the application of a scale factor. The scaling chosen in the test was based on constant stress
and constant acceleration. The scale factor applied was 0.6 for length and displacement, and
0.60.5=0.775 for velocity and time. The relationship of constant stress scaling is summarized in
Table 4-3.
Table 4-3 Constant Stress Scale of Testing
0.6 scale model Length L 0.6 Time L1/2 0.775 Mass L2 0.36 Displacement L 0.6 Velocity L1/2 0.775
Real model Test set-up Weight 391.7 kN 141 kN Natural period 1.76 sec 1.36 sec Bushing frequency 11.6 Hz 15 Hz Compressive stress on SHRB
2.3 MPa
Prior to the earthquake simulator tests, dynamic identification of the system was conducted. The
procedure of this test was the same as that of Phase-1, page 65, so the explanation is omitted.

104
The parameters of the earthquake simulator tests were: 1) base-isolated or fixed-base; 2) with
rubber ring (low- frequency mode) or without rubber ring (high-frequency mode); 3) earthquake
record; 4) intensity of earthquake record; 5) direction of shaking. The earthquake records used in
Phase-2 were 1995 Kobe (Takatori), 1999 Chi-Chi (TCU-129), and Art-693. The 1999 Chi-Chi
(TCU-129) is similar to 1940 El Centro in its frequency characteristics. Art-693 was the
artificially-generated wave based on the Required Response Spectrum IEEE-693. The phase
angles of the composed waves were randomly chosen and superimposed. The response spectrum
and Fourier spectrum of Art-693 are shown in Figure 4-4. The typical dynamic characteristics of
Art-693 is the high intensity in the low frequency range, similar to 1995 Kobe (Takatori), close
to the fundamental frequency of the base-isolated transformer. The shaking direction was uni-
axial in the x-direction, bi-axial in the x- and y-directions, tri-axial in the x-, y-, and z-directions,
the same as Phase-1. Bi-axial shaking in the x- and z-directions was added in Phase-2. The
combination of the record, intensity, and shaking direction in each test case is shown in Table 4-
4.

105
10-2
10-1
100
101
102
0
0.2
0.4
0.6
0.8
1
1.2
1.4
Frequency (H z)
Spectrum of re
sponse acceleration (g)
a2am p
Art-693: N-S Component
10-2
10-1
100
101
102
0
0.2
0.4
0.6
0.8
1
1.2
1.4
Frequency (H z)
Spectrum of re
sponse acceleration (g)
a4am p
Art-693: E-W Component
Figure 4-4 Response Spectrum of Artificial Wave: N-S and E-W Components
of ART-693

106
Table 4-4 Target PGA of Earthquake Simulator Testing in Phase-2 (1) Base-isolated Case:
Unit, g Art-693 1999 Chi-Chi (TSU-129) 1995 Kobe (Takatori)
NS EW UD NS EW UD EW NS UD x y z x y z x Y z
0.250 0.250 0.250 0.375 0.375 0.375
0.500
0.250 0.125 0.250 0.125 0.250 0.250 0.375 0.250 0.375 0.250 0.375 0.250
0.25 0.125 0.25 0.125 0.375 0.25
0.250 0.125 0.125 0.250 0.125 0.125 0.250 0.250 0.125 0.375 0.250 0.250 0.375 0.250 0.250 0.375 0.250 0.250
0.500 0.250 0.250 (2) Fixed-base Case:
Art-693 1999 Chi-Chi (TSU-129) 1995 Kobe (Takatori) NS EW UD NS EW UD EW NS UD x y z x y z x y z
0.250 0.250 0.250 0.375 0.375 0.375
0.250 0.125 0.250 0.125 0.250 0.250 0.375 0.250 0.375 0.250 0.375 0.250 0.250 0.125 0.125 0.250 0.125 0.125 0.250 0.250 0.125 0.375 0.250 0.250 0.375 0.250 0.250 0.375 0.250 0.250
Each test case is identified by following parameters:
• Earthquake record: Art-693, Chi-Chi, Kobe
• Shaking direction and target-PGA in x-direction:
x375 = uni-axial shaking in x-direction, target PGA =0.375g, xyz250=tri-axial shaking in
x-,y-, and z-direction, target PGA in x-direction is 0.250g
• System: with (R) or without (F) rubber ring + base-isolated(B) or Fixed-base(F)
RB = with rubber ring in base-isolated system, FR=without rubber ring in base-isolated
system

107
An example of the notification of a test case is as follows.
RF/Art/xz375: EQ record is Art-693, bi-axial shaking in x- and z-directions, target PGA of
platform in x-direction is 0.375g, with rubber ring in fixed-base system
4.6 Dynamic Characterization of Transformer Model and Bushing
The dynamic identification of the transformer model and bushing was performed by a random
vibration test using the same procedure as in Phase-1. As predicted, the results were almost the
same as Phase-1. The 1st and 2nd mode of the transformer model without the bushing was around
16.4 Hz, and 29.6 Hz in x, y, and yaw direction. The 1st and 2nd mode of the 161-kV bushing
without the rubber ring was 12.7 Hz and 16.3 Hz, whereas with rubber ring it was as follows: 1st
mode - 3.9 Hz; 2nd mode - 12.6 Hz; and 3rd mode - 26.1 Hz. The results are summarized in Table
4-5.
The most interesting point is that the fundamental frequency of the bushing was shifted to 3.9 Hz
by the rubber ring, as expected. Considering the scale factor, the equivalent frequency of the
bushing in the real scale is 3.9 x 0.775 = 3.02 Hz. According to a field investigation, the largest
size bushing in the field (500-kV) sometimes had around 3.0 Hz of dominant frequency
(Villaverde, 1999). The transfer function of the bushing with and without the rubber ring is
shown in Figure 4-5.
Table 4-5 Dynamic Identification Test Results
x y yaw-x yaw-y Bushing without RR 12.7 12.7 12.7 12.7 Bushing with RR 3.9 3.9 3.9 3.9 Transformer only 16.4 16.4 26.5 26.0 Rigit Frame only 23.1 26.3 23.4 29.4

108
4.7 Test Results
4.7.1 Uni-Axial Shaking
4.7.1.1 Response of Transformer/Bushing Systems
Figures 4-6 and 4-7 show the time histories in cases of RB/Art693/x375 and RF/Art-693/x375.
The effect of base isolation was observed comparing both records. The FFT analysis of the data
at the bottom of the transformer and the top of the bushing, in RB, RF, FB, and FF/Art-693/x375
are shown in Figures 4-8, 4-9, 4-10, and 4-11. The isolation-period of the RB and FB systems
estimated by FFT analysis varied from 0.69 Hz (FB) to 1.20 Hz (RB). Tests were conducted first
for RB and then for FB. The stiffness of the isolators in the FB system was lower than in the RB
system, caused by the load-history effect of high-damping rubber bearings. In Figure 4-12, the
maximum response acceleration at the transformer-bottom, transformer-top, and bushing-top
under uni-axial shaking in each system is plotted for the cases of Art-693 and Kobe. The order
of response acceleration under all motions was FF > RF >> RB ≈ FB. In the FF system, the
response acceleration in the bushing top was significantly amplified. The amplification factor of
the bushing in the fixed-base system became larger as PGA increased. On the other hand, the
amplification factor of the bushing top in the RF system remained small even as PGA increased.
Figures 4-13 to 4-15 show the distribution of the response acceleration and response relative
displacement along the height of the system under Art-693/x375. The result shows the
interaction effect between the bushing and the transformer model. In the FF system, the
fundamental frequency in the transformer (16 Hz) was close enough to that of the bushing (12
Hz) to cause amplification, while in the RF system they were almost decoupled since the
fundamental frequency of the bushing was reduced to 3.0 Hz by the rubber ring. According to a
survey by this author, the fundamental frequency of a transformer body generally varies from 15
Hz to over 30 Hz. The results in this study indicate the relationship of the bushing frequency to
the transformer frequency has significant influence in the amplification of the response in the
bushing and will be one of the major reasons for severe damage in bushings. The results in the
RB and FB systems show good reduction in acceleration. There was no obvious difference in

109
the accelerations between the RB and FB systems, regardless of the difference in the
fundamental frequency of the bushing.
The response displacements in four systems under each input motion were compared. The
displacement at the bottom of the transformer in the RB and FB systems, which indicate the
shear deflection of SHRB, is around 85 mm under Art-693/x375g in a scaled system. In real-
scale, this 85 mm is translated to 85/0.6 = 142 mm. Considering the many cable connections in
actual transformer systems, this response displacement was controlled in a quite reasonable
range. As summarized in Chapter 2, a major difference between base-isolation for transformer
systems versus conventional isolation, such as building isolation, is the higher stiffness for
limiting the displacement in a transformer. As a result, the isolation period will be less than 1.5
seconds, whereas the period of a conventional system is generally over 2.5 seconds.
Figure 4-16 shows a performance curve of the flexible rubber ring under Kobe (Takatori), uni-
axial shaking. The force-displacement curve represents the relationship between the rotation
angle and the assumed bending moment computed from the response acceleration at the top of
the bushing. The maximum horizontal displacement at the top of the bushing was 20 mm. The
damping ratio computed from the force-displacement curve was around 5%. The initial purpose
of applying this rubber ring was to reduce the apparent fundamental frequency of the bushing
and to evaluate the base-isolation effect in the flexible bushing system. However, the results in
the fixed-base system with the rubber ring (RF-system) indicated that this flexible-joint system
itself had significant effect in reducing the response of acceleration in the bushing. If there are
no other problems in mounting these joints on the turret in an actual transformer, the rubber ring
can be one of the effective measures in improving the seismic performance of
transformer/bushing systems.
4.7.1.2 Performance of Isolation System
Figures 4-17 and 4-18 show the force-displacement curve of the total SHRB system under uni-
axial shaking. The shapes of these plots demonstrate visco-elastic characteristics. These shapes
were more rounded and each plot did not trace the same path, whereas the curve in Phase-1

110
showed a reasonable bi-linear curve. This phenomenon can be explained by the load-history
dependency and velocity-dependency in the restoring force of the high-damping rubber
compound.
In Figure 4-19, the force-displacement curves of RB/Art-693/x375 (Test-A, hereafter) and
FB/Art-693/x375 (Test-B) are plotted and compared. Test-A was performed first and Test-B
followed one day later. The curve of Test-A shows higher load than Test-B at the same
horizontal displacement. This indicates the stiffness was softened by the load-history effect of
the high-damping rubber bearing during Test-A, which is called the “scragging” effect or
Mullins’s effect (Mullins, 1962). In this test, carbon and resin are physical links between
polymers and fillers that are added for damping and reinforcement. When the vulcanized rubber
in the virgin state is first subjected to loading, these physical links are destroyed and the stress
will be relaxed upon the next loading. After some time interval (10 to 24 hours), a percentage of
the destroyed links will re-generate and, as a result, the restoring force characteristics will
partially recover, but never to the virgin state. This is called the recovery phenomena. Murota
(1994) studied the recovery phenomena of a 450 mm-diameter high-damping rubber bearing for
over 100 days. It was concluded that the bearing recovered to almost 90% within seven days,
with full recovery in about three months. According to the FFT analysis for Test-A (Figure 4-8)
and for Test-B (Figure 4-10), the fundamental frequency was 1.2 Hz in Test-A and 0.69 Hz in
Test-B. This difference was obviously caused by the difference in stiffness of the bearing during
each test.
The maximum shear-strain experienced during the entire test program was 178% in
FB/Kobe/x375, as shown in Figure 4-20. The predicted ultimate shear strain of the SHRB was
around 200%, corresponding to a ratio of the diameter to the displacement of 0.8.
The initial sustaining load of each SHRB was 39.5 kN at EN, 37.8 kN at ES, 36.8 kN at WN, and
38.7 kN at WS, for an average of 38.2 kN. The average compressive stress was 2.35 MPa. The
change of vertical load on each SHRB in FB/Kobe/x375 is shown in Figure 4-21. The load
change due to the overturning moment of the transformer was approximately ± 20 kN.
Therefore, approximately ±50% of the static vertical load changed during Kobe/x375.

111
4.7.2 Bi-, and Tri-Axial Shaking
Figure 4-22 shows the comparison of response acceleration in uni-, bi-, and tri-axial shaking of
RB/Art-693 and RB/Chi-Chi. There was no significant difference in these responses. In Phase-1,
there were obvious differences in the response acceleration between uni-axial shaking and bi-, or
tri-axial shaking. A large difference was particularly noted in the bushing response observed
during tri-axial shaking in Phase-1. However, in Phase-2 with SHRB, the response in tri-axial
shaking did not show any amplification at the bushing top.
Figure 4-23 compares the curves of the total system under FB/Kobe/x250 and FB/Kobe/xz250.
There is no significant difference between these curves. This fact indicates the effect of z-
motion was negligible in SHRB systems as long as the compressive stress was kept low enough,
whereas z-motion significantly affected the characteristics of the slider system in Phase-1. Figure
4-24 compares the force-displacement curves in the Phase-1 and Phase-2 tests. The force and
displacement of SHRB in Figure 4-24 was corrected to the same loading conditions.
4.8 Summary
The isolation system consisting of segmented high-damping rubber bearings performed very well
during testing, as well as the sliding system in Phase-1. With SHRB, the response acceleration
of the bushing was reasonably reduced even in tri-axial shaking. So, the problem observed in the
Phase-1 test with the sliding bearing system did not occur. The shear restoring force
characteristics of the SHRB was not entirely affected by the ground motion because the design
compressive stress was relatively low.
The rubber ring worked well as designed. The initial purpose of applying the ring was to study
the difference in the bushing response with a low-frequency type (3 Hz) and a high-frequency
type (12 Hz). Before testing, it was predicted that the bushing would show a larger response
with the rubber ring. However, the test results showed the rubber ring worked to decouple the
frequency of the bushing from the transformer body and the response was dramatically improved.
It is deduced from the results that the interaction of the transformer body and the bushing is one

112
of the significant reasons for amplification of the bushing-response, and the flexible joint for the
bushing will be an effective countermeasure. A new idea of seismic protection for the bushing
will be proposed as a result of these tests. A rubber ring of high-damping material may be more
effective than the standard material used in these tests.
Load-history dependence of high-damping rubber bearings was seen during the entire test
program, which is typical of these compounds. The difference in the stiffness affected the
isolation period and the response of the system. The characteristics should be carefully
considered at the design stage of the isolation system with high-damping rubber bearings.
0 5 10 15 20 25 300
5
10
15
20
25
30
35
40
Frequency (Hz)
A(b.top) / A(ground)
Transfer Function of Bushing with RP
Figure 4-5 Dynamic Identification Test Results of Bushing with/without Flexible
Rubber Ring
Bushing with Rubber Ring

113
0 10 20 30 40 50 60-1
-0.5
0
0.5
1
m ax= 0.41119
AX1 : ground m otion
Tim e (sec)
Acceleration (g)
0 10 20 30 40 50 60-1
-0.5
0
0.5
1
m ax= 0.33597
AX2 : bottom of transform er
Tim e (sec)
Acceleration (g)
0 10 20 30 40 50 60-1
-0.5
0
0.5
1
m ax= 0.3465
AX3 : top of transform er
Tim e (sec)
Acceleration (g)
0 10 20 30 40 50 60-1
-0.5
0
0.5
1
m ax= 0.48156
ABX4 : top of transform er
Tim e (sec)
Acceleration (g)
Figure 4-6 Time Histories of Response Acceleration in RB/Art-693/x375
bushing

114
0 5 10 15 20 25 30 35 40-1
-0.5
0
0.5
1
m ax= 0.61577
AX1 : ground m otion
Tim e (sec)
Acceleration (g)
0 5 10 15 20 25 30 35 40-1
-0.5
0
0.5
1
m ax= 0.18931
AX2 : bottom of transform er
Tim e (sec)
Acceleration (g)
0 5 10 15 20 25 30 35 40-1
-0.5
0
0.5
1
m ax= 0.39625
AX1 : ground m otion
Tim e (sec)
Acceleration (g)
0 5 10 15 20 25 30 35 40-1
-0.5
0
0.5
1
m ax= 0.47578
AX2 : bottom of transform er
Tim e (sec)
Acceleration (g)
0 5 10 15 20 25 30 35 40-1
-0.5
0
0.5
1
m ax= 0.39625
AX1 : ground m otion
Tim e (sec)
Acceleration (g)
0 5 10 15 20 25 30 35 40-1
-0.5
0
0.5
1
m ax= 0.47578
AX2 : bottom of transform er
Tim e (sec)
Acceleration (g)
0 10 20 30 40 50 60
-1
0
1m ax= 0.81474
AX3 : top of transform er
Tim e (sec)
Acceleration (g)
0 10 20 30 40 50 60
-1
0
1m ax= 1.3163
ABX4 : top of transform er
Tim e (sec)
Acceleration (g)
Figure 4-7 Time Histories of Response Acceleration in RF/Art-693/x375
bushing

115
0 5 10 15 20 250
0.5
11.8271
Frequency (Hz)
Norm
alized F. Amp.(-) G round M otion
0 5 10 15 20 250
0.5
11.1971
Frequency (Hz)
Norm
alized F. Amp.(-) Transform er-bottom
0 5 10 15 20 250
0.5
11.1971
Frequency (Hz)
Norm
alized F. Amp.(-) Transform er-top
0 5 10 15 20 250
0.5
11.1971
Frequency (Hz)
Norm
alized F. Amp.(-) B ushing-top
Figure 4-8 Normalized Fourier Amplitude of RB/Art-693 /x375

116
0 5 10 15 20 250
0.5
11.8271
Frequency (Hz)
Norm
alized F. Amp.(-) G round M otion
0 5 10 15 20 250
0.5
11.8271
Frequency (Hz)
Norm
alized F. Amp.(-) Transform er-bottom
0 5 10 15 20 250
0.5
116.8851
Frequency (Hz)
Norm
alized F. Amp.(-) Transform er-top
0 5 10 15 20 250
0.5
13.7802
Frequency (Hz)
Norm
alized F. Amp.(-) B ushing-top
Figure 4-9 Normalized Fourier Amplitude of RF/Art-693 /x375

117
0 5 10 15 20 250
0.5
11.8271
Frequency (Hz)
Norm
alized F. Amp.(-) G round M otion
0 5 10 15 20 250
0.5
10.69304
Frequency (Hz)
Norm
alized F. Amp.(-) Transform er-bottom
0 5 10 15 20 250
0.5
10.69304
Frequency (Hz)
Norm
alized F. Amp.(-) Transform er-top
0 5 10 15 20 250
0.5
10.69304
Frequency (Hz)
Norm
alized F. Amp.(-) B ushing-top
Figure 4-10 Normalized Fourier Amplitude of FB/Art-693 /x375

118
0 5 10 15 20 250
0.5
11.8271
Frequency (Hz)
Norm
alized F. Amp.(-) G round M otion
0 5 10 15 20 250
0.5
11.8271
Frequency (Hz)
Norm
alized F. Amp.(-) Transform er-bottom
0 5 10 15 20 250
0.5
116.129
Frequency (Hz)
Norm
alized F. Amp.(-) Transform er-top
0 5 10 15 20 250
0.5
111.2147
Frequency (Hz)
Norm
alized F. Amp.(-) B ushing-top
Figure 4-11 Normalized Fourier Amplitude of FF/Art-693 /x375

119
0 0.1 0.2 0.3 0.4 0.50
0.5
1
1.5
2
2.5
3
P eak G round A cceleration (g)
Respose
Acceleration (g)
A rt 693
FB :Trans.FB :B ush. FF:Trans.FF:B ush. R B :Trans.R B :B ush. R F:Trans.R F:B ush.
0 0.1 0.2 0.3 0.4 0.50
0.5
1
1.5
2
2.5
3
P eak G round A cceleration (g)
Respose
Acceleration (g)
Kobe (Takatori)
FB :Trans.FB :B ush. FF:Trans.FF:Bush. RB :Trans.RB :Bush. RF:Trans.RF:B ush.
Figure 4-12 Maximum Response Acceleration in Art-693 and Kobe

120
0 1 2 3 4G round
Trans.Bottom
Trans.Top
Bushing Top
M axim um Response Acceleration (g)
FFRFFBRB
0 50 100 150G round
Trans.Bottom
Trans.Top
Bushing Top
M axim um Response Displacem ent (m m )
FFRFFBRB
Figure 4-13 Maximum Response Acceleration and Displacement at each
Measurement Point:Chi-Chi/x375

121
0 1 2 3 4G round
Trans.Bottom
Trans.Top
Bushing Top
M axim um Response Acceleration (g)
FFRFFBRB
0 50 100 150G round
Trans.Bottom
Trans.Top
Bushing Top
M axim um Response Displacem ent (m m )
FFRFFBRB
Figure 4-14 Maximum Response Acceleration and Displacement at each
Measurement Point: Art-693/x375

122
0 1 2 3 4G round
Trans.Bottom
Trans.Top
Bushing Top
M axim um Response Acceleration (g)
FFRFFBRB
0 50 100 150G round
Trans.Bottom
Trans.Top
Bushing Top
M axim um Response Displacem ent (m m )
FFRFFBRB
Figure 4-15 Maximum Response Acceleration and Displacement at each
Measurement Point: Kobe/x375

123
-30 -20 -10 0 10 20 30-1.5
-1
-0.5
0
0.5
1
1.5Perform ance C urve of Bushing
Displacem ent(m m )
Shear force (kN
)
xm ax= 23.8052
Q m ax= 1.4532
Figure 4-16 Shear Force-Horizontal Displacement Relationship of Bushing with
Rubber Ring: RB/Kobe/x375

124
-100 -50 0 50 100-60
-40
-20
0
20
40
60
Displacem ent(m m )
Shear force (kN
)
Figure 4-17 Force-Displacement Curve of Isolation System in RB/Art-693/x375
-150 -100 -50 0 50 100 150-60
-40
-20
0
20
40
60
Displacem ent(m m )
Shear force (kN
)
Figure 4-18 Force-Displacement Curve of Isolation System in RB/Kobe/x375
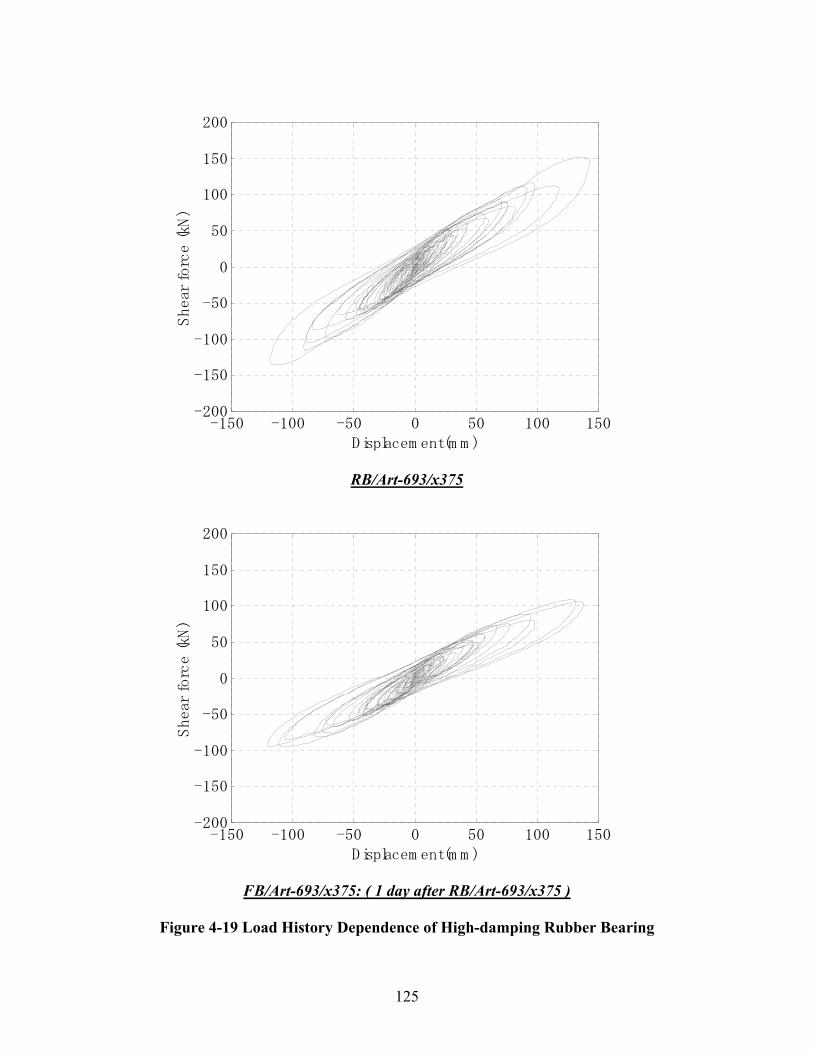
125
-150 -100 -50 0 50 100 150-200
-150
-100
-50
0
50
100
150
200
Displacem ent(m m )
Shear force (kN
)
RB/Art-693/x375
-150 -100 -50 0 50 100 150-200
-150
-100
-50
0
50
100
150
200
Displacem ent(m m )
Shear force (kN
)
FB/Art-693/x375: ( 1 day after RB/Art-693/x375 )
Figure 4-19 Load History Dependence of High-damping Rubber Bearing

126
-2 -1 0 1 2-1.5
-1
-0.5
0
0.5
1
1.5
Shear Strain (-)
Shear Stress (N/mm2)
Figure 4-20 Force-Displacement Curve of SHRB in RB/Kobe/x375

127
0 5 10 15 20 25 30 35 40
-20
0
20m ax= 19.778
EN : Vertical Load C hange
Tim e (sec)
Vert. Load (kN
)
0 5 10 15 20 25 30 35 40
-20
0
20m ax= 19.5269
ES : Vertical Load C hange
Tim e (sec)
Vert. Load (kN
)
0 5 10 15 20 25 30 35 40-50
0
50
m ax= 19.1109
W N : Vertical Load C hange
Tim e (sec)
Vert. Load (kN
)
0 5 10 15 20 25 30 35 40-50
0
50
m ax= 23.249
W S : Vertical Load C hange
Tim e (sec)
Vert. Load (kN
)
0 5 10 15 20 25 30 35 40-50
0
50
m ax= 19.1109
W N : Vertical Load C hange
Tim e (sec)
Vert. Load (kN
)
0 5 10 15 20 25 30 35 40-50
0
50
m ax= 23.249
W S : Vertical Load C hange
Tim e (sec)
Vert. Load (kN
)
0 5 10 15 20 25 30 35 40
-20
0
20m ax= 19.1109
W N : Vertical Load C hange
Tim e (sec)
Vert. Load (kN
)
0 5 10 15 20 25 30 35 40
-20
0
20m ax= 23.249
W S : Vertical Load C hange
Tim e (sec)
Vert. Load (kN
)
Figure 4-21 Vertical Load Change of each SHRB in FB/Kobe/x375

128
0 0.2 0.4 0.6 0.8 1G round
Trans.Bottom
Trans.Top
Bushing Top
M axim um Response Acceleration (g)
x375 xy375 xyz375
0 0.2 0.4 0.6 0.8 1G round
Trans.Bottom
Trans.Top
Bushing Top
M axim um Response Acceleration (g)
x375 xy375 xyz375
Figure 4-22 Comparison of Maximum Response Acceleration in Uni-, Bi-, and
Tri-Axial Shaking : RB/Art-693, and RB/Chi-Chi
Art-693
Chi-Chi

129
-1.5 -1 -0.5 0 0.5 1 1.5-0.8
-0.6
-0.4
-0.2
0
0.2
0.4
0.6
0.8
Shear Strain (-)
Shear Stress (N/mm2)
RB/Kobe/x375
-1.5 -1 -0.5 0 0.5 1 1.5-0.8
-0.6
-0.4
-0.2
0
0.2
0.4
0.6
0.8
Shear Strain (-)
Shear Stress (N/mm2)
RB/Kobe/xz375
Figure 4-23 Comparison of Force-Displacement Curve under x-, and xz-Shaking

130
-300 -200 -100 0 100 200 300-0.5
-0.4
-0.3
-0.2
-0.1
0
0.1
0.2
0.3
0.4
0.5
Displacem ent(m m )
Shear force/Structure weight (-)
Corrected Force-Displacement Curve at Phase-1: Kobe/FB/x500
-300 -200 -100 0 100 200 300-0.5
-0.4
-0.3
-0.2
-0.1
0
0.1
0.2
0.3
0.4
0.5
Displacem ent(m m )
Shear force/ Structure weight (-)
Corrected Force-Displacement Curve at Phase-2: Kobe/FB/x375
Figure 4-24 Comparison of Force-Displacement Curve of Slider System (Phase-1)
and SHRB System (Phase-2)

131
SECTION 5 NUMERICAL ANALYSIS
5.1 Overview
In this chapter, the numerical analysis of the base-isolated transformer/bushing system is studied
and discussed. The simulation was carried out with a commercial program called SAP2000
Nonlinear. With this tool we can develop a numerical model of the test set-up in Phase-1 and –2
to verify the test results, especially focusing on the response of the bushing and the performance
of the isolator system. The main focus of the analytical study is the problem of interaction with
vertical motion and bushing response, which was observed in Phase-1 testing with hybrid
isolation system.
5.2 Mathematical Model of the System
The mathematical model of the transformer/bushing systems tested in Phase-1 and Phase-2 was
basically defined as shown in Figure 5-1. The transformer was considered as a single mass
supported by a linear spring in the shear direction. In other directions, the model was considered
rigid. The bottom of the transformer was modeled as a rigid beam/shell, and isolators were
installed beneath the corners. The bushing was modeled as a rigid beam with several lumped
masses and was supported by a linear-rotation spring attached to the transformer. The stiffness
for the other directions was considered rigid.
According to the analysis of the test data, the movement of the porcelain bushing during shaking
was dominated by the rotation at the mounting flanges connected to the turret of the transformer.
The rotational flexibility of the bushing is determined by the rubber-gasket installed at the
interface of mounting face, which is usually installed for the prevention of oil spills. The results
of dynamic identification of the bushing revealed that the 2nd mode frequency is over 25 Hz and
its contribution to the entire response was considered very low. Therefore, in this simulation, the
bushing was simply modeled as a rigid beam supported by rotational spring at the interface of the
transformer top and the bushing flange.

132
X
Z
z
x Phase-1 Test Model
z
Rigid Shell
Rigid Frame
z
x
z
mb
m1
c1, k1
cr
kr
m2
m1
m2
cr
kr
c1, k1
Rigid Frame
mb
Rigid Shell
Phase-2 Test Model
Figure 5-1 Numerical Model of Transformer/Bushing System
in Phase-1 and –2

133
The equations of motion governing the test system in the x-direction are defined below (the
rotational motion of the transformer and the shear motion of the bushing are neglected in these
equations):
The equation of motion in the z-direction was simplified by assuming the stiffness of bushing
and transformer in the z-direction is rigid:
( ) ( )( )Gzmmmzkzczmmm gbvvb +++−=++++ 2111121
where,
bb x,m is mass and absolute displacement of basement, expressed as a rigid beam/shell
11 , xm is mass and relative displacement of upper part of transformer
22 , xm is representative mass and relative displacement of bushing
iR is the horizontal reaction force of ith isolator, which is expressed as a function of the
deflection iδ and the deflection rate iδ as ( )iii fR δδ ,=
1,1 ck is the shear stiffness and damping coefficient of the transformer,
rr ck , is the rotation stiffness and damping coefficient of the bushing,
h is the representative height of bushing = height from end to gravity center of the bushing
G is gravity
Furthermore, the rotation angle of the bushing is assumed small enough to have a linear
relationship with the displacement in the x-direction as follows:
( ) ( )( ) ( ) ( )( ) ( )
grr
gbb
gbbbibb
xmh
xxkh
xxcxm
xmxxkxxkxxcxm
xmxxcxxkRxm
2212
212
22
1122111111
1111
−=−
+−
+
−=−+−+−+
−=−+−+Σ+
212 θ⋅=− hxx
(5-1)
(5-3)
(5-2)

134
where,
2θ is the rotation angle of the bushing from vertical axis.
5.3 Numerical Expression of Isolator Characteristics
The characteristics of isolators are dependent on deflection (or strain rate of deflection) and
compressive force. Many analytical models have been developed and proposed by researchers.
The nonlinear element for isolators used in this analysis was based on the research of
Nagarajaiah for the development of the computer code 3D-BASIS. The isolator devices in that
report were classified into elastic element, hysteretic element, frictional element, and viscous
element. The elastic element is generally called the bi-linear model, and is determined with the
parameters of initial stiffness, ratio of post-yield stiffness to initial stiffness, and yield load. The
hysteretic element is the model for high-damping rubber bearings and lead-rubber bearings,
while the frictional element is for sliders. A viscous damper is the model for energy dissipation
in visco-elastic dampers and hydraulic dampers. In this study, the sliders for Phase-1 were
modeled with a frictional element.
5.3.1 Friction Force of Sliding Bearing
The friction force characteristics of sliding bearings are expressed in the following equation:
vds PF ⋅= µ
where, sF is the friction force generated along the locus of bearings in x-y plane, dµ is the
dynamic-friction coefficient during sliding motion. Static-friction ( sµ ), generally called “break-
away” coefficient, is the friction at the start of sliding. vP is the compressive force on the
bearings.
As many experimental data have shown, dµ is dependent on compressive stress σ and sliding
rate v . It is also sometimes defined by the following function:
(5-4)

135
( ) ( ) 0µσµ ⋅⋅= gvfd
where, functions of ( )vf and ( )σg are empirically derived from test data which was introduced
in Chapter 3, and 0µ is the base friction coefficient at a very low sliding rate. Among many
expressions proposed for ( )vf and ( )σg in the literature, the author chose the following
expression:
( ) ( ) ( )vavf ⋅−⋅−−= exp1ψψ
where, maxµ is the maximum friction at large rate of sliding, a is a constant.
where, 0σ is the nominal compressive stress and b is a constant.
In this simulation, to make the model simple, the effect of the change of compressive stress to
the friction coefficient, the function of ( )σg in (5-7), was neglected.
In bi-lateral shaking, the friction forces in the x- and y-directions, xF and yF , are expressed with
sF as follows:
where, xΓ and yΓ are the direction factor and are expressed as follows:
0
max
µµ
ψ =
( )b
g ⎟⎟⎠
⎞⎜⎜⎝
⎛=
0σσσ
syy
sxx
FF
FF
⋅Γ=
⋅Γ=
22
sin
cos
yxs
s
yy
s
xx
uuu
uu
uu
+=
==Γ
==Γ
φ
φ
(5-5)
(5-6)
(5-7)
(5-8)
(5-9)

136
5.3.2 Restoring Force Characteristics of High-Damping Rubber Bearings
High-damping rubber bearing was treated as hysteretic model in this analysis. The governing
equation for load-deflection is expressed by the following equation developed by Wen 1976:
( ) Ω⋅⋅−+⋅= Ycuc QKQ αα 1
where,
is the initial stiffness , YQ is the yield strength and Yu is yield displacement.
cα is the ratio of post-yield stiffness to initial stiffness, and Ω is a hysteretic dimensionless
quantity which is governed by the following equation:
( )( ) uuSignCu cn
Y ⋅+Ω⋅⋅Ω−=⋅Ω ητ
where, τ , cη , C , and n are dimensionless quantities that control the shape of the force-
displacement curve.
The bi-axial model of the hysteretic element was developed by Park (1986), which was derived
from the extension of the uni-axial equation as follows:
where, xα and yα are the ratio of post-yield stiffness to initial stiffness in the x, and y directions,
YxQ and YyQ are the yield strength, are the initial stiffness for x, and y
directions, respectively. xΩ and yΩ , the hysteretic dimensionless quantities, are governed by the
following coupled differential equations:
Y
Yu u
QK =
( )( ) ⎭
⎬⎫
⎩⎨⎧
⎟⎟⎠
⎞⎜⎜⎝
⎛⋅−
⋅−+
⎭⎬⎫
⎩⎨⎧
⋅⎟⎟⎠
⎞⎜⎜⎝
⎛⋅
⋅=
⎭⎬⎫
⎩⎨⎧
y
x
Yyy
Yxx
y
x
uyy
xux
y
x .Q
Quu
KK
ΩΩ
αα
αα
1001
00
Yy
Yyuy
Yx
Yxux u
QK,
uQ
K ==
( )( ) ( )( )( )( ) ( )( ) ⎭
⎬⎫
⎩⎨⎧
⋅⎟⎟
⎠
⎞
⎜⎜
⎝
⎛
+Ω⋅⋅Ω+Ω⋅⋅ΩΩ
+Ω⋅⋅Ω⋅Ω+Ω⋅⋅Ω−
⎭⎬⎫
⎩⎨⎧
⋅⋅=⎪⎭
⎪⎬⎫
⎪⎩
⎪⎨⎧
⋅Ω
⋅Ω
y
x
yyyxxyx
yyyxxxx
y
x
Yyy
Yxx
uu
uSignuSign
uSignuSignuu
Cu
u
ηεηε
ηεηε2
2
I
(5-10)
(5-11)
(5-12)
(5-13)

137
where, I is unit matrix , and C and η is dimensionless quantities that control the shape of the
hysteresis loop.
5.4 Comparison with Phase-1 Test Results
Numerical simulation was conducted for several selected cases in Phase-1 and Phase-2 in order
to calibrate the numerical model by the test results, especially focusing on the phenomenon in tri-
axial shaking observed in Phase-1.
At first, simulation of a fixed-base system under uni-axial shaking was carried out to calibrate
the model of the transformer/bushing system. The stiffness’ for both the transformer and bushing
were chosen according to the results of the dynamic characterization test described in Chapter 4.
Each element was modeled to match the fundamental frequency of the 1st mode obtained in the
tests. The damping ratio was defined as modal damping of 2% for all modes. The ground
motion measured on the shake table, AX1 in Figure 3-3 Chapter 3, was applied as the input data
for the simulation.
The selected cases used for the simulations were, Northridge/x375, Kobe/x375, and El
Centro/x375. The comparison of test results and numerical simulation in time histories of
response acceleration at transformer bottom, transformer top, and bushing top, are shown in
Figures 5-2, 5-3, and 5-4.
The maximum values of response acceleration in each case are summarized in Table 5-1.
Although the results of the numerical simulation and the test have some degree of difference in
maximum response acceleration, the time history data show good agreement in the shape of the
envelope.

138
Table 5-1 Comparison of Test Results and Numerical Simulation of Fixed-Base
System in Uni-Axial Shaking
El Centro/x375 Northridge/x375 Kobe/x375 Unit: g Test Simulation Test Simulation Test Simulation
Tr. Bottom 0.351 0.347 0.416 0.376 0.361 0.372 Tr. Top 0.747 0.476 0.646 0.431 0.569 0.709 Bush. Top 3.66 3.21 2.75 2.65 2.90 3.74
The simulation results of the base-isolated system under uni-axial shaking are shown in Figures
5-5, 5-6, and 5-7. Basically, the results show good agreement at all measurement points,
although there were some differences at the transformer top. The response of the test results
includes the high-frequency mode in its wave-configuration, which was not observed in the
results of the numerical simulation because the higher mode was neglected in this simplified
model. Performance curves of the isolation system in the test results and the numerical
simulation are compared in Figures 5-8 and 5-9. The simulation results agree with the test
results and prove that the bilinear model was adequate enough to express the properties of sliders.
The maximum response acceleration is shown in Table 5-2.
Table 5-2 Maximum Response Acceleration of Test Results and Numerical
Simulation of Base-Isolated System in Uni-Axial Shaking : Phase-1
El Centro Northridge Kobe Unit: g Test Simulation Test Simulation Test Simulation
Tr. Bottom 0.197 0.187 0.182 0.181 0.270 0.212 Tr. Top 0.217 0.188 0.195 0.184 0.283 0.214 Bush. Top 0.352 0.391 0.326 0.361 0.344 0.337
Next, the response acceleration under bi-axial shaking in the base-isolated system was simulated
and compared with the test results. Figures 5-10 and 5-11 show the comparison of the Kobe and
Northridge test results and simulation results. The simulation results of acceleration at each
measurement point basically show good agreement with the test results. There remained some
degree of difference in peak response acceleration at the bushing-top. Figure 5-12 shows the
comparison of the performance curves between the test and the simulation. The result shows that
the numerical model adequately expresses bilateral performance of sliders. The maximum
response acceleration at each component is shown in Table 5-3.

139
Table 5-3 Maximum Response Acceleration of Test Results and Numerical
Simulation of Base-Isolated System in Bi-Axial Shaking : Phase-1
El Centro Northridge Kobe Unit: g Test Simulation Test Simulation Test Simulation
Tr. Bottom 0.184 0.184 0.179 0.167 0.227 0.202 Tr. Top 0.197 0.185 0.179 0.170 0.262 0.203 Bush. Top 0.416 0.345 0.279 0.257 0.257 0.307
Figures 5-13 and 5-14 show the comparison of acceleration in tri-axial shaking. The simulation
results also show good agreement. The maximum acceleration is shown in Table 5-4. In Figure
5-15, the force-displacement curves of the isolation system in tri-axial shaking, Kobe/xyz375,
were compared. Although there are some differences in maximum displacement, overall
agreement is seen.
Table 5-4 Maximum Response Acceleration of Test Results and Numerical
Simulation of Base-Isolated System in Tri-Axial Shaking : Phase-1
El Centro Northridge Kobe Unit: g Test Simulation Test Simulation Test Simulation
Tr. Bottom 0.198 0.181 0.270 0.178 0.241 0.213 Tr. Top 0.319 0.190 0.558 0.186 0.353 0.246 Bush. Top 0.471 0.442 1.012 0.869 1.100 0.898
In summary, the numerical simulation with the proposed model compared well to the test results.
5.5 Study on Amplification in Bushing under Phase-1 Tri-Axial Shaking
In order to study the amplification phenomenon of the bushing response in tri-axial shaking with
the hybrid system in Phase-1, a parametric simulation was conducted.
5.5.1 Response under Sinusoidal Wave Input
At first, to simplify the problem, the response to the sinusoidal wave was evaluated. The
transformer was considered a rigid body. The natural period of the bushing in rotation was fixed
as 15 Hz. Assumptions for the isolation system were as follows:

140
1) Friction coefficient = 0.12 at maximum velocity
2) Linear restoring element with fundamental period of 2.0 sec. in x-direction
3) Compressive stiffness was assumed rigid
The numerical model of the system is shown in Figure 5-16.
The input motions were applied to the x- and z-directions. These inputs were 0.5g of amplitude
with a frequency of 2 Hz in the x-direction, and 0.4g with 15 Hz in the z-direction. They are
expressed as follows:
x-direction: ( ) Hzftfgxg 2,2sin5.0 11 == π , z-direction: ( ) Hzftfgz g 15,2sin4.0 22 == π
The simulations were conducted for xz-shaking and x-shaking. The maximum response
accelerations are summarized in Table 5-5. In the case of xz-shaking, the maximum acceleration
at the bushing was amplified 1.98 times the acceleration at the transformer, whereas it was
amplified 1.25 times in the case of x-shaking.
Table 5-5 Maximum Response Acceleration under Sinusoidal Wave Input
Unit: g x0.5gz0.4g x0.5g Transformer 0.198 0.151 Bushing Top 0.392 0.189
Figures 5-17 and 5-18 show the time history of the input and the response for both cases. The
response acceleration at the transformer under xz-shaking shows high-mode vibration
corresponding to the vertical motion of the ground. This component was transmitted from the
vibration of the slider frictional force. The response at the bushing-top shows a complicated
form--the motion with its natural period stimulated by inertia force at the change of direction of
the sliding force, and the motion influenced by the high-mode vibration transmitted from the
transformer. This is considered the mechanism of amplification of the bushing response with the
sliding bearing system.

141
5.5.2 Response under Earthquake Input
Next, the response to earthquake inputs with various combinations of frequency characteristics
of the components was investigated. The bushing natural frequency and vertical natural
frequency of the isolation system were considered as variable parameters of the system to be
investigated. The structure of the numerical model was the same as that used in the former
sinusoidal input investigation. The following parameters were fixed:
1) Ground motion:
a) x-direction=Northridge (Sylmar) N11E 0.5g
b) z-direction= Northridge (Sylmar) UD 0.4g (or 0 for reference)
2) Mass of bushing: 0.5% of transformer-mass
3) Sliding isolation system properties:
a) Friction coefficient = 0.12 at maximum velocity
b) Linear restoring element with fundamental period of 2.0 sec. in x-direction
The variable parameters were as follows:
Natural frequency of bushing, fb: 5 to 40 Hz.
Natural frequency of isolation system in vertical dir. fsv: 3 to 30 Hz, and rigid.
The simulation cases are summarized in Table 5-6.
Table 5-6 Cases of Parametric Study
10 15 20 25 30 ∞
3 5 10 15 20 25 30 40
Note: = to be conducted
fb (Hz) fsv (Hz)

142
The simplified governing equation of motion in the x-z plane is shown below:
( ) gv xmPxSignxkxm 11111 −=⋅++ µ
( ) ( ) grr xmxx
Lkxx
Lcxm 2122
2122
222 −=−+−+
( ) ( )( )Gzmmzkzczmm gvv ++−=+++ 2111121
11 zkzcP vvv +=
where,
The equations indicate that there is a coupling term in the motions of the x- and z-directions
through the friction force of the sliders, expressed as:
( ) ( ) ( )11 zkzcxSignPxSign vvv +⋅=⋅ µµ
Figure 5-19 shows the relationship of the maximum response acceleration at the bushing-top and
at the transformer, versus the natural frequency of the bushing in the x- and in the xz-shaking. In
the x-shaking, the response acceleration of the bushing shows peak-values at 3 Hz and at 25 Hz.
The peak at 3 Hz is considered as the frequency close to the resonance of the dominant
frequency of ground motion in the x-direction, and is regardless of the ground motion in the z-
direction. On the other hand, the peak at 25 Hz indicates the influence of the vertical motion.
The second mode frequency of the system is around 20 Hz with a bushing frequency of 25 Hz,
and corresponds to the natural frequency of the system in the z-direction. Figure 5-20 shows the
relationship of the maximum response acceleration at the bushing-top and at the transformer,
versus the natural frequency of the system in the z-direction. The peak at 20 Hz indicates the
resonance to the 2nd mode frequency of the system. These results clearly explain the
phenomenon of amplification of the bushing top with the sliding bearing system, observed in
Phase-1 testing.
Finally, the effect of the friction coefficient to the response of each component was investigated.
The friction coefficient of the sliding bearing varied from 0.04 to 0.16. The bushing natural
frequency and the vertical natural frequency of the total system were 25 Hz and 20 Hz,
(5-15)
(5-16)

143
respectively. The simulation results are plotted in Figure 5-21. The maximum response
acceleration of the bushing top increases as the friction coefficient increases, whereas the
response of the transformer increases slightly. The maximum response displacement increases as
the friction coefficient decreases. The results indicate that the friction coefficient has a
significant influence on the amplification of the bushing, and reasonable design of the friction
coefficient in the balance of the displacement will mitigate this problem by using sliding
bearings. Recently, many types of sliding bearings with different friction coefficients have been
developed. The low-friction type bearings are also available.
This problem of amplification of the response acceleration in the superstructure component is not
only present in the transformer/bushing system, but also in other similar equipment in substations
on which relatively small mass components are mounted. According to the results of the
parametric study, the following conclusions are made:
1) When the natural frequency of the bushing is close to the natural frequency of the system
in the vertical direction, amplification occurs.
2) Designing sliding bearings with lower frictions coefficients may control the amplification.

144
0 10 20 30 40 50 60-1
-0.5
0
0.5
1
m ax= 0.7467
Test Results (transform er top)
Tim e (sec)
Acceleration (g)
0 10 20 30 40 50 60-1
-0.5
0
0.5
1
m ax= 0.47601
Num erical Sim ulation (transform er top)
Tim e (sec)
Acceleration (g)
0 10 20 30 40 50 60-1
-0.5
0
0.5
1
m ax= 0.7467
Test Results (transform er top)
Tim e (sec)
Acceleration (g)
0 10 20 30 40 50 60-1
-0.5
0
0.5
1
m ax= 0.47601
Num erical Sim ulation (transform er top)
Tim e (sec)
Acceleration (g)
0 10 20 30 40 50 60-4
-2
0
2
4
m ax= 3.6617
Test Results (bushing top)
Tim e (sec)
Acceleration (g)
0 10 20 30 40 50 60-4
-2
0
2
4
m ax= 3.2132
Num erical Sim ulation (bushing top)
Tim e (sec)
Acceleration (g)
Figure 5-2 Comparison of Test Results and Numerical Simulation:
161kV/F/El Centro/x375, Fixed-Base System

145
0 5 10 15 20 25 30-1
-0.5
0
0.5
1
m ax= 0.56862
Test Results (transform er top)
Tim e (sec)
Acceleration (g)
0 5 10 15 20 25 30-1
-0.5
0
0.5
1
m ax= 0.70915
Num erical Sim ulation (transform er top)
Tim e (sec)
Acceleration (g)
0 5 10 15 20 25 30-4
-2
0
2
4
m ax= 2.902
Test Results (bushing top)
Tim e (sec)
Acceleration (g)
0 5 10 15 20 25 30-4
-2
0
2
4
m ax= 3.7404
Num erical Sim ulation (bushing top)
Tim e (sec)
Acceleration (g)
Figure 5-3 Comparison of Test Results and Numerical Simulation:
161kV/F/Kobe/x375, Fixed-Base System

146
0 5 10 15 20 25 30-1
-0.5
0
0.5
1
m ax= 0.64577
Test Results (transform er top)
Tim e (sec)
Acceleration (g)
0 5 10 15 20 25 30-1
-0.5
0
0.5
1
m ax= 0.43133
Num erical Sim ulation (transform er top)
Tim e (sec)
Acceleration (g)
0 5 10 15 20 25 30-4
-2
0
2
4
m ax= 2.7522
Test Results (bushing top)
Tim e (sec)
Acceleration (g)
0 5 10 15 20 25 30-4
-2
0
2
4
m ax= 2.6528
Num erical Sim ulation (bushing top)
Tim e (sec)
Acceleration (g)
Figure 5-4 Comparison of Test Results and Numerical Simulation:
161kV/F/Northridge/x375, Fixed-Base System

147
0 5 10 15 20 25 30 35 40 45 50-1
-0.5
0
0.5
1
m ax= 0.21681
Test Results (transform er top)
Tim e (sec)
Acceleration (g)
0 5 10 15 20 25 30 35 40 45 50-1
-0.5
0
0.5
1
m ax= 0.18812
Num erical Sim ulation (transform er top)
Tim e (sec)
Acceleration (g)
0 5 10 15 20 25 30 35 40 45 50
-1
-0.5
0
0.5
1
m ax= 0.35169
Test Results (bushing top)
Tim e (sec)
Acceleration (g)
0 5 10 15 20 25 30 35 40 45 50
-1
-0.5
0
0.5
1
m ax= 0.39116
Num erical Sim ulation (bushing top)
Tim e (sec)
Acceleration (g)
Figure 5-5 Comparison of Test Results and Numerical Simulation:
161kV/B/El Centro/x375, Base-Isolated System

148
0 5 10 15 20 25 30-1
-0.5
0
0.5
1
m ax= 0.2825
Test Results (transform er top)
Tim e (sec)
Acceleration (g)
0 5 10 15 20 25 30-1
-0.5
0
0.5
1
m ax= 0.21354
Num erical Sim ulation (transform er top)
Tim e (sec)
Acceleration (g)
0 5 10 15 20 25 30
-1
-0.5
0
0.5
1
m ax= 0.34395
Test Results (bushing top)
Tim e (sec)
Acceleration (g)
0 5 10 15 20 25 30
-1
-0.5
0
0.5
1
m ax= 0.3365
Num erical Sim ulation (bushing top)
Tim e (sec)
Acceleration (g)
Figure 5-6 Comparison of Test Results and Numerical Simulation:
161kV/B/Kobe/x375, Base-Isolated System

149
0 5 10 15 20 25 30-1
-0.5
0
0.5
1
m ax= 0.19529
Test Results (transform er top)
Tim e (sec)
Acceleration (g)
0 5 10 15 20 25 30-1
-0.5
0
0.5
1
m ax= 0.18374
Num erical Sim ulation (transform er top)
Tim e (sec)
Acceleration (g)
0 5 10 15 20 25 30
-1
-0.5
0
0.5
1
m ax= 0.32638
Test Results (bushing top)
Tim e (sec)
Acceleration (g)
0 5 10 15 20 25 30
-1
-0.5
0
0.5
1
m ax= 0.36139
Num erical Sim ulation (bushing top)
Tim e (sec)
Acceleration (g)
Figure 5-7 Comparison of Test Results and Numerical Simulation:
161kV/B/Northridge/x375, Base-Isolated System

150
-150 -100 -50 0 50 100 150-150
-100
-50
0
50
100
150Test Results 1999
Displacem ent(m m )
Shear force (kN
)
xm ax= 56.3005
Q m ax= 51.0815
-150 -100 -50 0 50 100 150-150
-100
-50
0
50
100
150
Displacem ent (m m )
Shear Force (kN
)
S im ulation
xm ax= 55.7354
Q m ax= 47.9578
Figure 5-8 Force-Displacement Curve of Isolation System :
161kV/B/El Centro/x375

151
-150 -100 -50 0 50 100 150-150
-100
-50
0
50
100
150Test Results 1999
Displacem ent(m m )
Shear force (kN
)
xm ax= 129.0506
Q m ax= 72.5026
-150 -100 -50 0 50 100 150-150
-100
-50
0
50
100
150
Displacem ent (m m )
Shear Force (kN
)
S im ulation
xm ax= 116.5722
Q m ax= 69.6319
Figure 5-9 Force-Displacement Curve of Isolation System : 161kV/B/Kobe/x375

152
0 5 10 15 20 25 30-1
-0.5
0
0.5
1
m ax= 0.26219
Test Results (transform er top)
Tim e (sec)
Acceleration (g)
0 5 10 15 20 25 30-1
-0.5
0
0.5
1
m ax= 0.20274
Num erical Sim ulation (transform er top)
Tim e (sec)
Acceleration (g)
0 5 10 15 20 25 30
-1
-0.5
0
0.5
1
m ax= 0.25565
Test Results (bushing top)
Tim e (sec)
Acceleration (g)
0 5 10 15 20 25 30
-1
-0.5
0
0.5
1
m ax= 0.3065
Num erical Sim ulation (bushing top)
Tim e (sec)
Acceleration (g)
Figure 5-10 Comparison of Test Results and Numerical Simulation:
161kV/B/Kobe/xy375, Base-Isolated System

153
0 5 10 15 20 25 30-1
-0.5
0
0.5
1
m ax= 0.55834
Test Results (transform er top)
Tim e (sec)
Acceleration (g)
0 5 10 15 20 25 30-1
-0.5
0
0.5
1
m ax= 0.1861
Num erical Sim ulation (transform er top)
Tim e (sec)
Acceleration (g)
0 5 10 15 20 25 30-1
-0.5
0
0.5
1
m ax= 0.17937
Test Results (transform er top)
Tim e (sec)
Acceleration (g)
0 5 10 15 20 25 30-1
-0.5
0
0.5
1
m ax= 0.16988
Num erical Sim ulation (transform er top)
Tim e (sec)
Acceleration (g)
0 5 10 15 20 25 30
-1
-0.5
0
0.5
1
m ax= 0.27852
Test Results (bushing top)
Tim e (sec)
Acceleration (g)
0 5 10 15 20 25 30
-1
-0.5
0
0.5
1
m ax= 0.25733
Num erical Sim ulation (bushing top)
Tim e (sec)
Acceleration (g)
Figure 5-11 Comparison of Test Results and Numerical Simulation:
161kV/B/Northridge/xy375, Base-Isolated System

154
-100 -50 0 50 100-60
-40
-20
0
20
40
60Test Results
Displacem ent(m m )
Shear force (kN
)
xm ax= 53.3189
Q m ax= 44.2483
-100 -50 0 50 100-60
-40
-20
0
20
40
60
Displacem ent (m m )
Shear Force (kN
)
N um erical Sim ulation
xm ax= 49.6428
Q m ax= 45.4144
Figure 5-12 Force-Displacement Curve of Isolation System:
161kV/B/Northridge/xy375

155
0 5 10 15 20 25 30-1
-0.5
0
0.5
1
m ax= 0.35258
Test Results (transform er top)
Tim e (sec)
Acceleration (g)
0 5 10 15 20 25 30-1
-0.5
0
0.5
1
m ax= 0.24625
Num erical Sim ulation (transform er top)
Tim e (sec)
Acceleration (g)
0 5 10 15 20 25 30
-1
-0.5
0
0.5
1
m ax= 1.0995
Test Results (bushing top)
Tim e (sec)
Acceleration (g)
0 5 10 15 20 25 30
-1
-0.5
0
0.5
1
m ax= 0.89804
Num erical Sim ulation (bushing top)
Tim e (sec)
Acceleration (g)
Figure 5-13 Comparison of Test Results and Numerical Simulation:
161kV/B/Kobe/xyz375, Base-Isolated System

156
0 5 10 15 20 25 30-1
-0.5
0
0.5
1
m ax= 0.55834
Test Results (transform er top)
Tim e (sec)
Acceleration (g)
0 5 10 15 20 25 30-1
-0.5
0
0.5
1
m ax= 0.1861
Num erical Sim ulation (transform er top)
Tim e (sec)
Acceleration (g)
0 5 10 15 20 25 30
-1
-0.5
0
0.5
1
m ax= 1.0116
Test Results (bushing top)
Tim e (sec)
Acceleration (g)
0 5 10 15 20 25 30
-1
-0.5
0
0.5
1
m ax= 0.86889
Num erical Sim ulation (bushing top)
Tim e (sec)
Acceleration (g)
Figure 5-14 Comparison of Test Results and Numerical Simulation:
161kV/B/Northridge/xyz375, Base-Isolated System

157
-150 -100 -50 0 50 100 150-80
-60
-40
-20
0
20
40
60
80Test Results
Displacem ent(m m )
Shear force (kN
)
xm ax= 136.5581
Q m ax= 63.3679
-150 -100 -50 0 50 100 150-80
-60
-40
-20
0
20
40
60
80
Displacem ent (m m )
Shear Force (kN
)
N um erical Sim ulation
xm ax= 92.8014
Q m ax= 54.3465
Figure 5-15 Force-Displacement Curve of Isolation System:
161kV/B/Kobe/xyz375

158
Figure 5-16 Simplified Model for Parametric Study
10 10.2 10.4 10.6 10.8 11 11.2 11.4 11.6 11.8 12-1
-0.5
0
0.5
1
Tim e (sec)
Acceleration (g)
10 10.2 10.4 10.6 10.8 11 11.2 11.4 11.6 11.8 12-1
-0.5
0
0.5
1
Tim e (sec)
Acceleration (g)
Figure 5-17 Sinusoidal Wave Input in Horizontal and Vertical Direction
Horizontal Input
Vertical Input
m2
kr
m1
L
( ) vPxSign ⋅⋅µk1
cr
z
x

159
10 10.2 10.4 10.6 10.8 11 11.2 11.4 11.6 11.8 12-1
-0.5
0
0.5
1
Tim e (sec)
Acceleration (g)
10 10.2 10.4 10.6 10.8 11 11.2 11.4 11.6 11.8 12-1
-0.5
0
0.5
1
Tim e (sec)
Acceleration (g)
Uni-Axial Shaking: x0.5g
10 10.2 10.4 10.6 10.8 11 11.2 11.4 11.6 11.8 12-1
-0.5
0
0.5
1
Tim e (sec)
Acceleration (g)
10 10.2 10.4 10.6 10.8 11 11.2 11.4 11.6 11.8 12-1
-0.5
0
0.5
1
Tim e (sec)
Acceleration (g)
Bi-Axial Shaking: x0.5g-z0.4g
Figure 5-18 Comparison of Response Acceleration under x-, and xz-Shaking
Transformer (m1)
Bushing-Top(m2)
Transformer (m1)
Bushing-Top(m2)

160
00.10.20.30.40.50.60.70.80.9
1
0 10 20 30 40 50Bushing N.Frequency fb (Hz)
Max
. Res
pons
e Ac
c. (g
) BushingTopTransformerBottom
Figure 5-19 Relationship of Bushing Natural Frequency in Horizontal Direction
and Maximum Response Acceleration in x-direction
00.10.20.30.40.50.60.70.80.9
1
0 10 20 30 40System Vertical N.Frequency fsv(Hz)
Max
. Res
pons
e Ac
c. (g
)
Bushing Top
TransformerBottom
Figure 5-20 Relationship of System Natural Frequency in Vertical Direction and
Maximum Response Acceleration in x-direction

161
0
0.2
0.4
0.6
0.8
1
1.2
1.4
0 0.05 0.1 0.15 0.2
Friction C oefficient (-)
Max. Response Accelerati
(g)
0
50
100
150
200
250
Max Reponse Disp. (mm
B ushing Top
Trans. Bottom /Acc.
Trans. Bottom /D isp
Figure 5-21 Relationship of Friction Coefficient versus Maximum Response
Acceleration and Maximum Response Displacement

162
5.6 Comparison with Phase-2 Test Results
Since the load-deflection curve of Segmented High-Damping Rubber Bearing (SHRB) shows
non-linear and visco-elastic behavior, the bi-linear model is not a precise model to express the
shear characteristics. However, considering the practical use of a commercial program for
dynamics structures, a normal bilinear model was applied for simulation in this study. The
bilinear model was defined to nearly match the actual curve chosen from the data obtained
during earthquake simulator test in Phase-2. Figure 5-22 shows the definition of the bilinear
model overlaid on the force-displacement curve in the test case FB/Kobe/x375, which was
selected as the master curve for modeling. The parameter of the bilinear model was set as
follows:
1. Post-yield Stiffness: 0.4 (kN/mm)
2. Characteristic Strength: 8.0 (kN)
3. Initial Stiffness: 1.6 (kN/mm)
The same numerical model for the transformer/bushing in calibration of Phase-1 was applied.
The mass and stiffness of each element was defined so that the fundamental frequency matches
the results of the dynamic identification tests in Chapter 4. At first, the simulation of the fixed-
base system was conducted. Figure 5-23 shows the comparison of both results in the Rubber
Ring / Fixed-Base RF-system for Art-693/x375, which has a rubber ring installed between the
bushing end and the turret mounting face, and also shows good agreement with the test results.
The other fixed-base cases overall agree with these test results.
Next, the simulation of base-isolated cases was conducted. Figures 5-24 to 5-27 show the
comparison of the results in the test and simulation in Rubber Ring / Base-Isolated RB-system/
Art-693/x375 and Kobe/x375, and without Rubber Ring Base-Isolated FB-system/ Art-693/x375
and Kobe/x375. All of the results show good agreement. In Figures 5-28 and 5-29, the
performance curve in tests and simulation was compared. The behavior for small displacement
levels, as shown in Figure 5-28, shows good traceability whereas for large displacement levels,
as shown in Figure 5-29, some differences are seen in the skeletons of the curve. The SHRB

163
shows high non-linearity in its load-deflection relationships. The peak response acceleration
value of the uni-axial shaking is summarized in Table 5-7.
Table 5-7 Maximum Response Acceleration of Test Results and Numerical
Simulation in Uni-Axial Shaking : Phase-2
a) Without rubber ring system;
FB/Art-693/x375 FB/Kobe/x375 Unit: g Test Simulation Test Simulation
Tr. Bottom 0.266 0.246 0.401 0.463 Tr. Top 0.277 0.229 0.430 0.464 Bush. Top 0.181 0.240 0.444 0.494
b) With rubber ring system;
RB/Art-693/x375 RB/Kobe/x375 Unit: g Test Simulation Test Simulation
Tr. Bottom 0.336 0.265 0.320 0.282 Tr. Top 0.347 0.249 0.328 0.277 Bush. Top 0.482 0.454 0.392 0.446
Figures 5-30 and 5-31 show the comparison between the response acceleration and the
performance curves in simulation and the test results in the cases of RB/Art-693/xy250. In this
case, the simulation result agreed sufficiently. However, in the case of RB/Kobe/xy375 as
shown in Figure 5-32, the locus of the force-displacement curve shows some difference from the
test results. In bi-axial and tri-axial shaking, the numerical model of SHRB was insufficient to
express the multi-directional performance. More accurate modeling of high-damping rubber
bearings in multi-direction loading is still under development by many researchers.
5.7 Case Study of Existing Transformer/Bushing System
Through the comparison with test results, the accuracy of numerical simulation method was
basically proven. Using the same concept of modeling, numerical simulation of real
transformer/bushing system in the field was carried out and the seismic response was examined.
The selected system was in the Tottori-prefecture, Japan, damaged in the 2000 Tottori-ken Seibu
Earthquake, as introduced by Constantinou (1990). The transformer system was a 500 kV/220

164
kV size installed in an ultra-high voltage substation, located about 5 km to the northeast of the
epicenter. The secondary-bushings (220 kV) of three similar transformer systems were all
fractured at the fixed end. The model of the system is shown in Figure 5-33. The bushings had
lengths of 5.788 m and a total weight of 5.99 kN. These bushings were modeled as a lumped-
mass beam, and the sleeve and turret were modeled as a beam element. Rotation-springs were
connected between the bushing-end and the sleeve, the sleeve-end and turret, and the turret-end
and the transformer-top. The weight of the transformer body was 1784.7 kN. Modal damping of
5 % was considered for all modes. The material constants and geometric constants of the
bushing-element and each rotation-spring constant, are listed in Tables 5-8, 5-9, and 5-10.
Table 5-8 Material Constants of Beam Element
Young's Modulus
(MPa)
Poison's Ratio
Damping Ratio
Bushing 5.88E+04 0.23 0.05 Sleeve 7.06E+04 0.28 0.05 Turret 2.06E+05 0.33 0.05
Table 5-9 Geometric Properties of Beam Element
Element Cross-sectional Area (m2)
Moment of Inertia (m4)
Bushing-1 1.17E-02 8.62E-05 Bushing-2 2.44E-02 1.35E-04 Bushing-3 3.21E-02 2.68E-04 Bushing-4 4.10E-02 4.81E-04 Bushing-5 4.83E-02 7.57E-04 Bushing-6 4.83E-02 9.06E-04 Sleeve-1 2.34E-02 2.54E-04 Sleeve-2 2.34E-02 2.54E-04 Turret-1 1.52E-02 1.08E-03 Turret-2 1.52E-02 1.08E-03 Turret-3 1.52E-02 1.08E-03

165
Table 5-10 Stiffness of Rotation Spring
Position of Spring Stiffness (N*m/rad) Bushing-Sleeve 2.42E+07 Sleeve-Turret 4.90E+07
Turret-Transformer 4.90E+07
Segmented high-damping rubber bearings were designed for the isolator system. A sliding
bearing system was also designed, modeled and simulated for comparison. The design
parameters for the high-damping rubber bearings are listed in Table 5-11.
Table 5-11 Characteristics of Element Bearing of SHRB
Diameter 225 (mm) Effective Area 39760.782 (mm2) Rubber Height 45 (mm) Shear Modulus 0.61 (MPa) Equivalent Damping Ratio 0.168 (-) Characteristic Strength 8.16 (kN) Post-Yield Stiffness 0.359 (kN/mm) Initial Stiffness 2.87 (kN/mm)
One SHRB consists of 4 pieces of element bearings per one layer by 3 layers. Therefore, the
properties of the assembled SHRB was calculated as follows;
1) Post yield stiffness K2 = 0.479 kN/mm
2) Initial stiffness K1 = 3.83 kN/mm
3) Characteristic Strength Qd = 32.6 kN
Four SHRBs were installed beneath the corner of the transformer. Therefore, the total
performance of the isolation system is as follows;
1) K2-total = 1.92 kN/mm
2) K1-total = 15.3 kN/mm
3) Qd-total = 130.4 kN
The natural period of the system at displacement of 135 mm, which agree with shear strain of
100% of the rubber bearing, was computed as 1.60 seconds. The compressive stress on each
element bearing was 2.86 MPa.

166
The period of each mode for fixed-base and base-isolated systems was calculated as follows:
(Fixed-base)
1st mode: 0.126 sec, 2nd mode: 0.0550 sec, 3rd mode: 0.0290 sec
(Base-isolated with SHRB)
1st mode: 1.59 sec, 2nd mode: 0.126 sec, 3rd mode: 0.0630 sec
Next, the sliding bearing system was designed as follows. The friction coefficient was designed
as 0.073 and the stiffness of low-damping rubber bearing was set as 0.958 kN/mm so as to have
same bi-linear model of SHRB system. The vertical stiffness was designed as 458 kN/mm,
corresponding to a vertical frequency of 7.94 Hz, which is the 1st mode frequency of the system
in the horizontal direction.
Time-history analysis was conducted under the following ground motions:
1) Art-693: NS in x-direction | UD in z-direction (used in Phase-2 test)
2) El Centro: NS in x-direction | UD in z-direction
3) Kobe (Takatori): EW in x-direction | UD in z-direction
Acceleration and displacement at the bushing-top, the transformer-top, and the transformer-
bottom (just above isolation system) under Art-693 in SHRB system, for a PGA of 0.25g, 0.5g,
0.75g, and 1.0g are shown in Table 5-12, and time histories of the response acceleration in Art-
693/x0.5gz0.4g for both fixed-base and base-isolated systems are shown in Figures 5-34 and 5-
35.

167
Table 5-12 Summary of Time History Analysis :
Art-693:PGA x0.5g + z0.4g
PGA(g) Node Acceleration (g) Displacement (mm) Bushing-top 0.192 104
x0.25 Transformer-top 0.184 103 Transformer-bottom 0.182 103 Bushing-top 0.361 254
x0.5 Transformer-top 0.339 252 Transformer-bottom 0.339 251 Bushing-top 0.533 416
x0.75 Transformer-top 0.511 413 Transformer-bottom 0.508 411 Bushing-top 0.705 579
x1.0 Transformer-top 0.684 575 Transformer-bottom 0.680 573 Bushing-top 0.362 254
x0.5z0.4 Transformer-top 0.342 252 Transformer-bottom 0.339 251
Fixed-base Bushing-top 2.55 10.6 x0.5 Transformer-top 0.837 2.87
Transformer-bottom 0.677 0.810
The results under uni-axial shaking x0.5g and tri-axial shaking x0.5gz0.4g show no significant
difference. For the SHRB system, the z-motion does not affect the response in the x-direction.
In the fixed-base system, the amplification of the bushing-top exceeded 5.0. This level of
acceleration will cause damage on the connection of the bushing to the sleeve. With the base-
isolation system, the amplification was about 0.65. The displacement of the isolator was 250 mm
at a PGA=0.5g, and 411 mm at a PGA=0.75g. The total rubber height of the SHRB is 45x3=135
mm. Therefore, at a PGA=0.75g, the rubber shear strain is around 300%. At a PGA=1.0g, the
displacement of the isolator was 573 mm, a shear strain of 424 %, which exceeded the ultimate
strain of the bearings. If a conventional bearing, either circular or square in shape, is applied, the
minimum diameter, or length of a side, must be 600 mm to have enough stability for a 411 mm
displacement under a PGA=0.75g. A diameter of 600 mm will result in a higher stiffness and
will increase the response acceleration. In Table 5-13, results of three different earthquakes for
fixed-base, SHRB, and slider systems under x0.5g z0.4g shaking are compared.

168
Table 5-13 Summary of Time History Analysis in Fixed-Based, SHRB System,
and Sliding Bearing System: x0.5g z0.4g Shaking
Fixed-Base System
Input Node Acceleration (g) Displacement (mm) Bushing-Top 2.55 10.6
Art-693 Transformer-Top 0.837 2.87 Transformer-Bottom 0.677 0.810 Bushing-Top 2.79 10.2
El Centro Transformer-Top 1.02 2.49 Transformer-Bottom 0.833 7.86 Bushing-Top 1.82 9.15
Kobe Transformer-Top 0.794 2.64 Transformer-Bottom 0.637 0.80
Base-Isolated with SHRB System
Input Node Acceleration (g) Displacement (mm) Bushing-Top 0.362 254
Art-693 Transformer-Top 0.342 252 Transformer-Bottom 0.339 251 Bushing-Top 0.201 93.6
El Centro Transformer-Top 0.176 92.6 Transformer-Bottom 0.171 92.0 Bushing-Top 0.502 385
Kobe Transformer-Top 0.485 383 Transformer-Bottom 0.479 382
Base-Isolated with Sliding Bearing System
Input Node Acceleration (g) Displacement (mm) Bushing-Top 1.17 234
Art-693 Transformer-Top 0.413 231 Transformer-Bottom 0.328 229 Bushing-Top 1.12 95.5
El Centro Transformer-Top 0.371 92.4 Transformer-Bottom 0.272 90.6 Bushing-Top 2.40 323
Kobe Transformer-Top 0.883 315 Transformer-Bottom 0.648 311

169
Table 5-14 Comparison of Results of Slider System under x-, and xz- Shaking:
Art-693
PGA(g) Node Acceleration (g) Displacement (mm) Bushing-Top 0.375 234
x0.5 Transformer-Top 0.334 231 Transformer-Bottom 0.321 229 Bushing-Top 1.17 230
x0.5z0.4 Transformer-Top 0.413 226 Transformer-Bottom 0.328 223
Compared with the results of the SHRB system, the results for x0.5g were almost the same
because their bilinear models were the same. However, in the xz-shaking (x0.5z0.4), as shown
in Table 5-14, the response at the bushing-top was stimulated up to 1.17 g, which was already
indicated in the Phase-1 test and the prescribed parametric study in this chapter. In Figure 5-36,
the response acceleration under tri-axial shaking x0.5gz0.4g in the fixed-base, SHRB, and sliding
bearing systems at each node is plotted and the distribution along the z-coordinate is presented.
The amplification of the bushing response in sliding bearing system is clearly observed.
The effect of friction coefficient of sliding bearing to the response of transformer/bushing system
was studied. The results are summarized in Table 5-15, and the time histories, force-
displacement curves are shown in Figures 5-37 and 5-38. It is interesting to note the response
amplification becomes smaller when the friction coefficient becomes smaller. Displacement
becomes larger as friction coefficient becomes smaller. However, the displacement with a
friction coefficient of 0.03 was 262mm, and is still acceptable for the isolation system. The
lower friction coefficient, such as 0.029, may be better for sliding bearing system for
transformer/bushing system.

170
Table 5-15 Effect of Friction Coefficient to Response of
Transformer/Bushing System
f.coef. μ Node Acceleration (g) Displacement (mm) Bushing-Top 0.560 267
0.03 Transformer-Top 0.343 264 Transformer-Bottom 0.315 262 Bushing-Top 1.17 230
0.073 Transformer-Top 0.413 226 Transformer-Bottom 0.328 223 Bushing-Top 1.82 199
0.12 Transformer-Top 0.502 196 Transformer-Bottom 0.376 194
Finally, an analysis was conducted for the system equipped with a rubber ring, as tested in
Phase-2 testing. The initial natural frequency of the bushing was 17 Hz. The rubber ring was
designed to shift the frequency to 2 Hz. The results are summarized in Table 5-16.
Table 5-16 Simulation Results with Rubber Ring / Fixed-Base : Tri-Axial Shaking
x0.5g z0.4g
Acceleration (g) Displacement (mm) Input Node without RR with RR without RR with RR
Bushing-Top 2.55 1.51 10.6 99.0 (0.036) Art-693 Transformer-Top 0.837 1.19 2.87 2.37
Transformer-Bottom 0.677 0.738 0.810 0.758 Bushing-Top 2.79 2.20 10.2 116.2 (0.042)
El Centro Transformer-Top 1.02 1.84 2.49 2.70 Transformer-Bottom 0.833 0.90 7.86 0.811 Bushing-Top 1.82 1.16 9.15 79.2 (0.029)
Kobe Transformer-Top 0.794 0.752 2.64 1.60 Transformer-Bottom 0.637 0.630 0.80 0.719
NOTE: ( ) in Bushing-Top with RR = Rotation Angle in radian

171
The reduction of acceleration compared to the bushing without the rubber ring was
approximately 40% in Art-693, 20% in El Centro, and 36% in Kobe. The purpose of the rubber
ring is to absorb energy by deformation of the flexible rubber ring inserted between the bushing
and the turret, and to protect the bushing from the damage of the mounting interface, where the
“weak link” of the system occurs. Even if there is no reduction of acceleration, the rubber ring
can be expected as an effective measure to protect the bushing by absorbing energy. The
rotation angle was 0.029 to 0.042 radian (1.7 to 2.4 degrees), as shown in Table 5-16, and was
small enough for the ring.
5.8 Summary
Through the study of numerical simulation of Phase-1 and Phase-2 testing, the applicability of
the proposed simplified analytical model, consisting of two masses for the transformer and
bushing and shear-rotation stiffness, was verified. The numerical model for the hybrid isolation
system in Phase-1 shows high similarity with the actual hysteretic behavior and proved the
reliability of the computation.
The amplification of the bushing response in the slider-isolation system observed in Phase-1 test
was simulated. The same phenomenon was reproduced by time-history analysis. The
relationship of the natural frequency of the bushing to the vertical natural frequency of the
system, and the response acceleration of the bushing was studied. It was concluded that the
amplification of the bushing was caused by the resonance of the vertical natural frequency of the
system and the horizontal bushing frequency. The vertical vibration of the system was linked to
the friction force of the sliders, which was in turn transmitted to the bushing.
A case study of an existing system was studied by a time-history analysis. Detailed information
of the transformer/bushing system was obtained from the literature, and an isolation system was
designed for this study. Artificial waves based on the response spectrum of IEEE-693, 1940 El
Centro, and 1995 Kobe (Takatori) were used as ground motions. In the base-isolated system
with segmented high-damping rubber bearings (SHRB), the peak response acceleration at the top
of bushing was 60% of PGA, whereas in the fixed-base system it was more than 5 times PGA.

172
However, as predicted in the sliding bearing system, the acceleration at the bushing top was
amplified and the peak acceleration was about 2 times PGA. The sliding systems with different
friction coefficients, 0.04 and 0.16, were subjected to simulation. The results show that the
lower friction coefficient will keep the amplification of the acceleration at the bushing low with
some increase in displacement. The low friction system may be an optimized solution of the
sliding system for protection of the transformer/bushing system. Finally, the applicability of a
rubber ring, developed in Phase-2 testing, was evaluated. The acceleration of the bushing was
reduced 20 to 40%, and the rotation angle of the rubber ring was 1.7 to 2.4 degrees--quite
acceptable for the design of this flexible joint.

173
-150 -100 -50 0 50 100 150-60
-40
-20
0
20
40
60
Displacem ent(m m )
Shear force (kN
)
Post-yield stiffness 4.02 =K (kN/mm), Characteristic strength 08.Qd = (kN), Initial stiffness 6.120.41 == KK (kN/mm)
Figure 5-22 Numerical Model (Bi-linear Model) of SHRB defined from Test
Results: FB/Kobe/x375
(0,8)
(100,48)

174
0 5 10 15 20 25 30 35 40 45 50
-2
0
2
m ax= 0.81474
Test Results (transform er top)
Tim e (sec)
Acceleration (g)
0 5 10 15 20 25 30 35 40 45 50-2
-1
0
1
2
m ax= 0.87256
Num erical Sim ulation (transform er top)
Tim e (sec)
Acceleration (g)
0 5 10 15 20 25 30 35 40 45 50-2
-1
0
1
2
m ax= 1.3163
Test Results (bushing top)
Tim e (sec)
Acceleration (g)
0 5 10 15 20 25 30 35 40 45 50-2
-1
0
1
2
m ax= 1.8061
Num erical Sim ulation (bushing top)
Tim e (sec)
Acceleration (g)
Figure 5-23 Comparison of Test Results and Numerical Simulation:
RF/Art-693/x375

175
0 5 10 15 20 25 30 35 40 45 50-1
-0.5
0
0.5
1
m ax= 0.27734
Test Results (transform er top)
Tim e (sec)
Acceleration (g)
0 5 10 15 20 25 30 35 40 45 50-1
-0.5
0
0.5
1
m ax= 0.22888
Num erical Sim ulation (transform er top)
Tim e (sec)
Acceleration (g)
0 5 10 15 20 25 30 35 40 45 50-1
-0.5
0
0.5
1
m ax= 0.18066
Test Results (bushing top)
Tim e (sec)
Acceleration (g)
0 5 10 15 20 25 30 35 40 45 50-1
-0.5
0
0.5
1
m ax= 0.23976
Num erical Sim ulation (bushing top)
Tim e (sec)
Acceleration (g)
Figure 5-24 Comparison of Test Results and Numerical Simulation:
FB/Art 693/x375

176
0 5 10 15 20 25 30 35 40 45 50-1
-0.5
0
0.5
1
m ax= 0.42997
Test Results (transform er top)
Tim e (sec)
Acceleration (g)
0 5 10 15 20 25 30 35 40 45 50-1
-0.5
0
0.5
1
m ax= 0.46448
Num erical Sim ulation (transform er top)
Tim e (sec)
Acceleration (g)
0 5 10 15 20 25 30 35 40 45 50-1
-0.5
0
0.5
1
m ax= 0.44392
Test Results (bushing top)
Tim e (sec)
Acceleration (g)
0 5 10 15 20 25 30 35 40 45 50-1
-0.5
0
0.5
1
m ax= 0.49358
Num erical Sim ulation (bushing top)
Tim e (sec)
Acceleration (g)
Figure 5-25 Comparison of Test Results and Numerical Simulation:
FB/Kobe/x375

177
0 5 10 15 20 25 30 35 40 45 50-1
-0.5
0
0.5
1
m ax= 0.3465
Test Results (transform er top)
Tim e (sec)
Acceleration (g)
0 5 10 15 20 25 30 35 40 45 50-1
-0.5
0
0.5
1
m ax= 0.24916
Num erical Sim ulation (transform er top)
Tim e (sec)
Acceleration (g)
0 5 10 15 20 25 30 35 40 45 50-1
-0.5
0
0.5
1
m ax= 0.48156
Test Results (bushing top)
Tim e (sec)
Acceleration (g)
0 5 10 15 20 25 30 35 40 45 50-1
-0.5
0
0.5
1
m ax= 0.45372
Num erical Sim ulation (bushing top)
Tim e (sec)
Acceleration (g)
Figure 5-26 Comparison of Test Results and Numerical Simulation:
RB/Art-693/x375

178
0 5 10 15 20 25 30 35 40 45 50-1
-0.5
0
0.5
1
m ax= 0.32772
Test Results (transform er top)
Tim e (sec)
Acceleration (g)
0 5 10 15 20 25 30 35 40 45 50-1
-0.5
0
0.5
1
m ax= 0.27731
Num erical Sim ulation (transform er top)
Tim e (sec)
Acceleration (g)
0 5 10 15 20 25 30 35 40 45 50-1
-0.5
0
0.5
1
m ax= 0.39231
Test Results (bushing top)
Tim e (sec)
Acceleration (g)
0 5 10 15 20 25 30 35 40 45 50-1
-0.5
0
0.5
1
m ax= 0.44577
Num erical Sim ulation (bushing top)
Tim e (sec)
Acceleration (g)
Figure 5-27 Comparison of Test Results and Numerical Simulation:
RB/Kobe/x375

179
-150 -100 -50 0 50 100 150-80
-60
-40
-20
0
20
40
60
80Test Results
Displacem ent(m m )
Shear force (kN
)
xm ax= 82.4882
Q m ax= 39.0379
-150 -100 -50 0 50 100 150-80
-60
-40
-20
0
20
40
60
80
Displacem ent (m m )
Shear Force (kN
)
N um erical Sim ulation
xm ax= 65.6102
Q m ax= 34.2502
Figure 5-28 Comparison of Force-Displacement Curves in Test Results and
Numerical Simulation: FB/Art-693/x375

180
-150 -100 -50 0 50 100 150-80
-60
-40
-20
0
20
40
60
80Test Results
Displacem ent(m m )
Shear force (kN
)
xm ax= 103.047
Q m ax= 51.9892
-150 -100 -50 0 50 100 150-80
-60
-40
-20
0
20
40
60
80
Displacem ent (m m )
Shear Force (kN
)
N um erical Sim ulation
xm ax= 84.6773
Q m ax= 41.8809
Figure 5-29 Comparison of Force-Displacement Curves in Test Results and
Numerical Simulation: RB/Kobe/x375

181
0 5 10 15 20 25 30 35 40 45 50-1
-0.5
0
0.5
1
m ax= 0.27971
Test Results (transform er top)
Tim e (sec)
Acceleration (g)
0 5 10 15 20 25 30 35 40 45 50-1
-0.5
0
0.5
1
m ax= 0.23306
Num erical Sim ulation (transform er top)
Tim e (sec)
Acceleration (g)
0 5 10 15 20 25 30 35 40 45 50-1
-0.5
0
0.5
1
m ax= 0.38014
Test Results (bushing top)
Tim e (sec)
Acceleration (g)
0 5 10 15 20 25 30 35 40 45 50-1
-0.5
0
0.5
1
m ax= 0.44645
Num erical Sim ulation (bushing top)
Tim e (sec)
Acceleration (g)
Figure 5-30 Comparison of Test Results and Numerical Simulation
in RB/Art-693/xy375, x-dir.

182
-150 -100 -50 0 50 100 150-80
-60
-40
-20
0
20
40
60
80Test Results
Displacem ent(m m )
Shear Force (kN
)
xm ax= 85.3127
Q m ax= 44.0202
-150 -100 -50 0 50 100 150-80
-60
-40
-20
0
20
40
60
80
Displacem ent (m m )
Shear Force (kN
)
N um erical Sim ulation
xm ax= 72.5617
Q m ax= 34.9966
Figure 5-31 Comparison of Force-Displacement Curves in Test Results and
Numerical Simulation: RB/Art-693/xy375, x-dir.

183
-150 -100 -50 0 50 100 150-80
-60
-40
-20
0
20
40
60
80Test Results
Displacem ent(m m )
Shear Force (kN
)
xm ax= 66.1633
Q m ax= 32.4574
-150 -100 -50 0 50 100 150-80
-60
-40
-20
0
20
40
60
80
Displacem ent (m m )
Shear Force (kN
)
N um erical Sim ulation
xm ax= 87.553
Q m ax= 35.988
Figure 5-32 Comparison of Force-Displacement Curves in Test Results and
Numerical Simulation: RB/Kobe/xy250, x-dir.

184
Transformer body weight: 1785(kN) Bushing weight (220kV) : 29.6(kN), weight (mass) ratio=0.0166
Node Z-cor.(mm) Mass (kg)
1 8345 96
2 9808 172
3 9316 55
4 8834 83
5 7852 128
6 6948 9
7 7336 155
8 7040 0
9 7048 9
10 6848 0
11 5434 2100
12 5349 0
14 6840 0
17 4020 182000
18 2200 0
19 0 0
LV:220kV Bushing
Turret
HV:500kV Bushing
5800
40
00
Sleeve
Bushing
Sleeve
Turret
Transformer

185
Figure 5-33 Case Study: 220kV/500kV Transformer and Numerical Model
0 5 10 15 20 25 30 35 40-1
-0.5
0
0.5
1
m ax= 0.5
G round M otion
Tim e (sec)
Acceleration (g)
0 5 10 15 20 25 30 35 40-1
-0.5
0
0.5
1
m ax= 0.6766
Transform er Top
Tim e (sec)
Acceleration (g)
0 5 10 15 20 25 30 35 40-1
-0.5
0
0.5
1
m ax= 0.83672
Turret
Tim e (sec)
Acceleration (g)
0 5 10 15 20 25 30 35 40
-2
0
2
m ax= 2.5533
Bushing Top
Tim e (sec)
Acceleration (g)
Figure 5-34 Time Histories of Fixed-Base System: Art-693 x0.5gz0.4g

186
0 5 10 15 20 25 30 35 40-1
-0.5
0
0.5
1
m ax= 0.5
G round M otion
Tim e (sec)
Acceleration (g)
0 5 10 15 20 25 30 35 40-1
-0.5
0
0.5
1
m ax= 0.33873
Transform er Bottom
Tim e (sec)
Acceleration (g)
0 5 10 15 20 25 30 35 40-1
-0.5
0
0.5
1
m ax= 0.33902
Transform er Top
Tim e (sec)
Acceleration (g)
0 5 10 15 20 25 30 35 40-1
-0.5
0
0.5
1
m ax= 0.36112
Bushing Top
Tim e (sec)
Acceleration (g)
Figure 5-35 Time Histories of Base-Isolated System/SHRB: Art-693 x0.5gz0.4g

187
0 0.5 1 1.5 2 2.5 30
1
2
3
4
5
6
7
8
9
10
M axim um Response Acc. (g)
Z-coordinate (m)
Fixed-Base Base-Isolated:SHRB Base-Isolated:Slider
Figure 5-36 Maximum Response Acceleration at each Node in Fixed-Base,
Base-Isolated-SHRB, and Base-Isolated-Slider System :
Art-693 x0.5g z0.4g

188
0 5 10 15 20 25 30 35 40-1
-0.5
0
0.5
1
m ax= 0.32753
Transform er Bottom : μ=0.10
Tim e (sec)
Acceleration (g)
0 5 10 15 20 25 30 35 40-1
-0.5
0
0.5
1
m ax= 0.31515
Transform er Bottom : μ=0.04
Tim e (sec)
Acceleration (g)
0 5 10 15 20 25 30 35 40
-1
0
1m ax= 1.1732
Bushing Top: μ=0.10
Tim e (sec)
Acceleration (g)
0 5 10 15 20 25 30 35 40
-1
0
1m ax= 0.6015
Bushing Top: μ=0.04
Tim e (sec)
Acceleration (g)
Figure 5-37 Comparison of Response Acceleration in Sliding System with
Friction Coef.=0.073 and 0.03: Art-693 x0.5gz0.4g
0.073
Transformer Top : μ=0.073
Transformer Top : μ=0.03
Bushing Top : μ=0.073
Bushing Top : μ=0.03

189
-300 -200 -100 0 100 200 300-600
-400
-200
0
200
400
600Hystersis C urve: μ=0.10
Displacem ent(m m )
Force (kN
)
-300 -200 -100 0 100 200 300-600
-400
-200
0
200
400
600Hystersis C urve: μ=0.04
Displacem ent(m m )
Force (kN
)
Figure 5-38 Comparison of Force-Displacement Curves in Sliding System
with Friction Coef. =0.073 and 0.03: Art-693 x0.5gz0.4g
0.073
0.03


191
SECTION 6 CONCLUSIONS
6.1 Background
This report presents a comprehensive study using a tri-axial earthquake simulator to analyze
applicability of base isolation technology for seismic protection of transformers. The testing was
carried out with a large-scale transformer model with a real porcelain bushing in two phases. In
Phase-1, the combination of sliding bearings and low-damping bearings for re-centering were
developed and applied as an isolation system. In Phase-2 testing, the segmented high-damping
rubber bearings were used. Analytical study by non-linear time history analysis was conducted
to verify the test results and further study the dynamic response of the base-isolated transformer
including the case study. Finally, the case study of a real transformer system was conducted by
non-linear time history analysis.
6.2 Conclusions
Many significant conclusions were made through this research. They are listed as follows.
1. This study represents the first effort in testing based-isolated large-scale
transformer/bushing systems using an earthquake simulator.
2. A base isolation system using conventional rubber bearings is not suitable for seismic
protection of a lightweight structure such as a transformer (most of which are less than 2
MN) because of its limited ability to lengthen the natural period of the entire isolated
system. This difficulty was alleviated in this study by: 1) combining sliding bearings
with rubber bearings; and 2) using segmented high-damping rubber bearings.
3. The effectiveness of the proposed base isolation system in reducing the response
acceleration of the transformer/bushing systems was demonstrated in the uni-axial and bi-
axial earthquake simulator tests.
4. The tri-axial earthquake simulator test with the sliding system provided highly valuable
information, which was not previously available. The response acceleration of the

192
bushing in the base-isolated system was sometimes larger than that of the fixed-based
system. This is believed to be due to the fact that the friction force of the sliding bearing
is affected by the vertical load change of the system involving high-frequency
components, stimulating the high-frequency mode of the bushing in the horizontal
direction. The vertical frequency characteristics are dependent on the compressive
stiffness of the isolators. Therefore, the compressive stiffness of the sliding system
should be carefully designed not to induce the high-mode vibration of the bushing.
5. On the other hand, no coupling effect was seen in the system of segmented high-damping
rubber bearings.
6. Rubber rings were developed for the purpose of adding flexibility at the fixed end joint
between the bushing and the transformer top. The rings worked well and the bushing
acceleration was reduced in the testing. The flexible ring absorbed energy by rotational
deformation without any failure or instability and reduced the transmission of force to the
bushing.
7. The simplified numerical model for the transformer/bushing system was proposed and
verified by comparing the results with the testing. The rotational movement around the
fixed end is dominant in bushings, whereas shear movement is dominant in transformers.
8. The amplification of the bushing response with a sliding bearing system was verified by
numerical simulation.
9. The friction coefficient of sliding bearings has a significant effect on the amplification of
the bushing in tri-axial shaking. Lower friction coefficients, such as 0.04, are desired for
application in the transformer system considering the bushing amplification.
10. The case study of real power transformer system strongly supported the efficacy of base
isolation.

193
SECTION 7 REFERENCES
Anon., Computers and Structures, Inc. (1996), SAP2000 Analysis Reference Manual, Version 6.13, Berkeley, CA
Anon., IEEE 1998. IEEE Std 693-1997, “Recommended practices for seismic design of substations”, Piscataway, N.J.: IEEE Standards Department Anon., International Conference of Building Officials (1997), “Earthquake Regulations for Seismic-Isolated Structures,” Uniform Building Code, Appendix Chapter 16, Whittier, CA Anon., JESC E0001 (1999), Japan Electric Association, Seismic Design Guideline of Electric Facilities in Substation (in Japanese) Anon., “www.ncree.gov.tw” Tri-Axial Seismic Simulator, National Center for Research on Earthquake Engineering, web site
Anon., The Power System Seismic Program Management Committee of the City of Los Angeles Department of Water and Power, (1995), “Intermediate Term Plan For Seismically Hardening the Los Angeles Transmission-Level Power Facilities,” Bonacina, G & Bonetti, P.et al. (1995), “Seismic Base Isolation of Gas Insulated Electrical Substations: Design, Experimental and Numerical Activities, Evaluation of the Applicability,” 10th European Conference on Earthquake Engineering, Duma (ed.) Buckle, I.G., and Liu, H.(1994).”Stability of Elastomeric Seismic Isolation Systems,” Seminar on Seismic Isolation, Passive Energy Dissipation, and Control, Applied Technology Council, Redwood City, Calif., pp.293-305 Chopra, A. K., Dynamics of Structures: Theory and Applications to Earthquake Engineering, PRENCTICE HALL Clark, P.W., Aiken, I.D., and Kelly, J.M. (1997), “Experimental Studies of The Ultimate Behavior of Seismically-Isolated Structure,” Report No. UCB/EERC-97/18, Earthquake Engineering Research Center, College of Engineering, University of California, Berkeley
Constantinou, M.C., Mokha, A.S, and Reinhorn, A. M. (1990), “Experimental and Analytical

194
Study of a Combined Sliding Disc Bearing and Helical Steel Spring Isolation System,” Technical Report NCEER-90-0019, National Center for Earthquake Engineering Research, State University of New York at Buffalo Constantinou, M. C., Mokha, A.S, and Reinhorn, A. M. (1990) “ Teflon Bearings in Base Isolation II: Modeling”, J. Struct. Engrg. ASCE, 116(2), 455-474 Feng, M. Q. and Okamoto, S.(1994), “Shaking Table Tests on Base-Isolated Bridges with Flexible Piers,” Proceedings of Third US-Japan Workshop of Protective Systems for Bridges, Berkeley, CA. Fujita, T., Fujita, S., and Yoshizawa, T. (1984), “Base Isolation Support of Heavy Equipment with Laminated Rubber Bearings –1,” The Japan Society of Mechanical Engineers, 50-454, 1984-6, (in Japanese)
Fujita, T., Fujita, S., Yoshizawa, T., and Suzuki, S. (1985), “Base Isolation Support of Heavy Equipment with Laminated Rubber Bearings –2,” The Japan Society of Mechanical Engineers, 51-461, 1985-1, (in Japanese) Gent, A.N. and Lindley, P.B. (1959), “The Compression of Bonded Rubber Blocks,” Proceedings of Institution of Mechanical Engineers, London, Vol.173, No.3, pp.111-122 Gilani, A.S., Chavez, J.W., Fenves, G.L. and Whittaker, A.S. (1998), “Seismic Evaluation of 196kV Porcelain Transformer Bushings”, Report No.PEER-98-02, Pacific Earthquake Engineering Research Center, University of California, Berkeley Gilani, A.S., Chavez, J.W., Fenves, G.L. and Whittaker, A.S. (1999), “ Seismic Evaluation of 550kV Porcelain Transformer Bushings,” PEER 1999/05 October 1999
Gilani, A.S., Chavez, J.W., Fenves, G.L. and Whittaker, A.S. (1999), “Seismic Evaluation and Retrofit of 230-kV Porcelain Transformer Bushings,” PEER 1999/14 Dec.1999 Iizuka M., Takaoka E., Takenaka, Y. and Yoshikawa, K. (1998), “Shaking Table Tests of Base Isolation Systems Consisting of Rubber Bearings and Sliding Bearings,” Proceedings of The 10th Earthquake Engineering Symposium, Yokohama, Japan Ishizuka, H., Murota, N., and Fukumori, T. (1995), “Dynamic and Failure Properties of High Damping Rubber Bearing under High Axial Stress,” PVP-Vol.319, Seismic Shock and

195
Vibration Isolation ASME Kelly, J.M. (1993), Earthquake-Resistant Design with Rubber, 2nd ed., Springer-Verlag, London Koh, C.G. and Kelly, J.M. (1988), “A Simple Mechanical Model for Elastomeric Bearings Used in Base Isolation,” International Journal on Mechanical Science, 30, pp.933-943 Masaki, N. (1999), “Study of Multistage Rubber Bearings for Seismic Isolation and Vibration Control System,” Dissertation for Doctor of Engineering from The University of Tokyo Mullins, L., “Softening of Rubber by Deformation,” Rubber Chemistry and Technology, 42(1): pp.339-362, 1962 Murota, N., Goda, K., Suzuki, S., Sudo, C., and Suizu, Y., “Recovery Characteristics of Dynamic Properties of High Damping Rubber Bearings,” Proceedings of the Third U.S.-Japan Workshop on Protective Systems for Bridges, pp.2-63 – 2-76, Berkeley, California, 1994 Nagarajaiah, S., Reinhorn, A.M., and Constantinou, M.C., “3D-BASIS Nonlinear Dynamic Analysis of Three-Dimensional Base Isolated Structures: Part II,” Technical Report NCEER-91-0005, National Center for Earthquake Engineering Research, State University of New York at Buffalo Pansini, J.A. (1988), Electrical Transformers and Power Equipment, by Prentice Hall Park, Y. J., Wen, Y. K. and Ang, A. H. S., (1986), “Random Vibration of Hysteretic System under Bi-Directional Ground Motions” Earthquake Eng. Struct. Dyn., 14(4), 543-557 Sato, H., Sato, K., Tohma, J., and Higashi, S., (2002) “Estimation of Strong Ground Motion Using KIK-NET Records and Its Application for Investigation of The Cause of Structure Damage – A Case Study of Electrical Substation Structure Damage during the 2000 Tottori-ken-Seibu Earthquake,” AIJ J.Technol.Des, No.15, p93-98, Jun. Serino, G., Bonacina, G. and Bettinali, F. (1995), “Passive Protection Devices for High-Voltage Equipment: Design Procedures and Performance Evaluation,” Proceedings of the Fourth U.S.Conference Sponsored by the Technical Council on Lifeline Earthquake Engineering/ASCE

196
Shinozuka, M., Rose, A., and Eguchi R.T., ed. Engineering and Socioeconomic Impacts of
Earthquakes, Monograph Series 2, Multidisciplinary Center for Earthquake Engineering Research, State University of New York at Buffalo
Shinozuka, M.,ed. (1995), “The Hanshin-Awaji Earthquake of January 17:1995 Performance
of Lifelines,” Technical Report NCEER-95-0015, Buffalo, N.Y.: National Center for Earthquake Engineering Research, State University of New York
Skinner I.R., Robinson H.W., and McVerry H.G. (1993), An Introduction to Seismic Isolation, John Wiley & Sons Ltd
Thomas, A.G. (1982), “The Design of Laminated Bearings I,” Proceedings of the
International Conference on Natural Rubber for Earthquake Protection of Building and Vibration Isolation, Kuala Lumpur, Malaysia, February, pp.229-246 Villaverde, R., Pardoen, G., (1999), “Ground Motion Amplification at Base of Bushings Mounted on Electric Substation Transformer,” A Technical Report of Research Supported by PEER/PG&E Under Award No. PGE-09566, Department of Civil Engineering, University of California, Irvine Wen, Y. K. (1976) “Method of Random Vibration of Hysteretic Systems” J. of Engrg. Mech. Div. ASCE, 102(EM2), 249-263
Wilcoski, J. (1997), “Demonstration of CERL Equipment Fragility and Protection Procedure by Fragility Testing of a Power Transformer Bushing,” ATC-29-1, Seminar Technical Papers, p.349

197
APPENDIX A
ADDITIONAL TEST RESULTS
Transformers are cable-connected to equipment in substations. The seismic interaction between
base-isolated transformers and other equipment is an important factor to be considered in the
design of the system. As a preliminary study of the interaction problem, the transformer/bushing
system in Phase-2 was cable-connected to a pole, fixed on the platform of the simulator, and then
subjected to uni-axial shaking. An aluminum strand cable, which had been previously used in a
substation, was connected from the top of the bushing to the pole top.
A.1 Experimental Setup
Figures A-1 and A-2 show the experimental setup. The purpose of the testing was to investigate
the influence of the cable-connection to the response of the transformer model and the bushing.
The specification of the cable was “954MCM AAC” (code word “Magnolia” in the ASTM
B231) and its material was pure aluminum of “E. C. Grade.” The diameter was 28.55 mm and
the tensile strength was 7420 kg. The stranding was of Class AA and 37×4.079 mm diameter,
Figure A-3. As shown in Figure A-2, the length of the cable was 2660 mm and the horizontal
distance from the pole to the bushing was 1880 mm. The horizontal displacement of the
transformer to where the cable would start to harden and pull the pole was calculated from the
geometry of Figure A-2 as 493.9 mm. The maximum displacement of the base-isolated
transformer/bushing system was assumed as less than 200 mm according to the results in the
Phase-2 testing. Therefore, the cable had enough length to accommodate the movement of the
base-isolated transformer model without hardening.
An H-beam measuring 200 mm x 200 mm x 16 mm was used as the pole fixed to the platform of
the simulator. The natural frequencies of the pole with a clamped-free condition were calculated
as 9.18 Hz in the 1st mode and 57.5 Hz in the 2nd mode.

198
A.2 Testing Program
The earthquake records and the PGA are summarized in Table A-1. The 161-kV bushing was
installed on to the transformer model without the use of a rubber ring. The transformer with and
without an SHRB base isolation system was subjected to the uni-axial shaking.
Table A-1 Program of Additional Testing
Earthquake Record PGA in x-direction Art-693 0.25 g, 0.375 g Kobe (Takatori) 0.25 g, 0.375 g Chi-Chi 0.25 g, 0.375 g
A.3 Test Results
The maximum response acceleration at each measurement point in the fixed-base and
base-isolated system is shown in Figure A-4. The effect of base isolation is very obvious. In
Figures A-5 and A-6, the results of the response acceleration and displacement in the
base-isolated system (with and without cable-connection), are compared. The results of the
system without cable-connection were picked up from Phase-2 test results. A significant
difference is observed in response acceleration at the top of the bushing for the with/without
conditions of cable-connection. The response acceleration of the bushing top with
cable-connection was amplified 1.5 to 2.0 times the acceleration at the transformer top.
Figure A-7 shows the normalized Fourier amplitude of response acceleration at the bushing- top
and the pole-top. According to the results, the pole has its dominant frequency at around 14.6 Hz.
The Fourier amplitude at the bushing top also has a second peak around 14 Hz corresponding to
the dominant frequency of the pole. This indicates an interaction between the cable-connected
bushing and pole.

199
A.4 Summary
The base-isolated transformer/bushing system with cable-connection was subjected to a uni-axial
shaking test to investigate the interaction between the bushing and the ground-fixed pole.
Although the results show some effectiveness of the base isolation in comparison with fixed-base
system, an interaction exists between the bushing and the pole. Enough attention should be paid
to the relationship between the transformer and other connected facilities in the design of base
isolation systems. The test results prompt further study on this problem.

200
Figure A-1 Cable-Connected Base-Isolated Transformer Model
Figure A-2 Geometry of the Test Setup
2500mm
430mm
2260mm
1880mm
3990mm
H Beam: 200×200×8×12 49.9 kg/m
Aluminum Cable 2660mm
SHRB
Load

201
Figure A-3 An Aluminum Strand Cable: Class AA / 37×4.079 mm dia.
0 1 2 3 4G round
Trans.Bottom
Trans.Top
Bushing Top
M axim um Response Acceleration (g)
A rt-FFArt-FBKo-FF Ko-FB C h-FF C h-FB
Figure A-4 Maximum Response Acceleration at each Measurement Point in the
Fixed-Base and the Base-Isolated System

202
0 0.2 0.4 0.6 0.8 1G round
Trans.Bottom
Trans.Top
Bushing Top
M axim um Response Acceleration (g)
A rt-W ith C ableArt Ko-W ith C able Ko C h-W ith C able C h
Figure A-5 Maximum Response Acceleration at each Measurement Point in the
Base-Isolated System
0 50 100 150G round
Trans.Bottom
Trans.Top
Bushing Top
M axim um Response Displacem ent (m m )
A rt-693Kobe C hi-C hi
Figure A-6 Maximum Response Displacement at each Measurement Point in the
Base-Isolated System

203
0 5 10 15 20 250
0.5
10.91356
Frequency (Hz)
Norm
alized F. Amp.(-) B ushing Top
0 5 10 15 20 250
0.5
114.5539
Frequency (Hz)
Norm
alized F. Amp.(-) P ole Top
Figure A-7 Normalized Fourier Amplitude at Bushing Top and Pole Top in
Base-Isolated System under Art/x375


Formerly the National Center for Earthquake Engineering Research
205
Multidisciplinary Center for Earthquake Engineering Research List of Technical Reports
The Multidisciplinary Center for Earthquake Engineering Research (MCEER) publishes technical reports on a variety of subjects related to earthquake engineering written by authors funded through MCEER. These reports are available from both MCEER Publications and the National Technical Information Service (NTIS). Requests for reports should be directed to MCEER Publications, Multidisciplinary Center for Earthquake Engineering Research, State University of New York at Buffalo, Red Jacket Quadrangle, Buffalo, New York 14261. Reports can also be requested through NTIS, 5285 Port Royal Road, Springfield, Virginia 22161. NTIS accession numbers are shown in parenthesis, if available. NCEER-87-0001 "First-Year Program in Research, Education and Technology Transfer," 3/5/87, (PB88-134275, A04, MF-
A01). NCEER-87-0002 "Experimental Evaluation of Instantaneous Optimal Algorithms for Structural Control," by R.C. Lin, T.T.
Soong and A.M. Reinhorn, 4/20/87, (PB88-134341, A04, MF-A01). NCEER-87-0003 "Experimentation Using the Earthquake Simulation Facilities at University at Buffalo," by A.M. Reinhorn
and R.L. Ketter, to be published. NCEER-87-0004 "The System Characteristics and Performance of a Shaking Table," by J.S. Hwang, K.C. Chang and G.C.
Lee, 6/1/87, (PB88-134259, A03, MF-A01). This report is available only through NTIS (see address given above).
NCEER-87-0005 "A Finite Element Formulation for Nonlinear Viscoplastic Material Using a Q Model," by O. Gyebi and G.
Dasgupta, 11/2/87, (PB88-213764, A08, MF-A01). NCEER-87-0006 "Symbolic Manipulation Program (SMP) - Algebraic Codes for Two and Three Dimensional Finite Element
Formulations," by X. Lee and G. Dasgupta, 11/9/87, (PB88-218522, A05, MF-A01). NCEER-87-0007 "Instantaneous Optimal Control Laws for Tall Buildings Under Seismic Excitations," by J.N. Yang, A.
Akbarpour and P. Ghaemmaghami, 6/10/87, (PB88-134333, A06, MF-A01). This report is only available through NTIS (see address given above).
NCEER-87-0008 "IDARC: Inelastic Damage Analysis of Reinforced Concrete Frame - Shear-Wall Structures," by Y.J. Park,
A.M. Reinhorn and S.K. Kunnath, 7/20/87, (PB88-134325, A09, MF-A01). This report is only available through NTIS (see address given above).
NCEER-87-0009 "Liquefaction Potential for New York State: A Preliminary Report on Sites in Manhattan and Buffalo," by
M. Budhu, V. Vijayakumar, R.F. Giese and L. Baumgras, 8/31/87, (PB88-163704, A03, MF-A01). This report is available only through NTIS (see address given above).
NCEER-87-0010 "Vertical and Torsional Vibration of Foundations in Inhomogeneous Media," by A.S. Veletsos and K.W.
Dotson, 6/1/87, (PB88-134291, A03, MF-A01). This report is only available through NTIS (see address given above).
NCEER-87-0011 "Seismic Probabilistic Risk Assessment and Seismic Margins Studies for Nuclear Power Plants," by Howard
H.M. Hwang, 6/15/87, (PB88-134267, A03, MF-A01). This report is only available through NTIS (see address given above).
NCEER-87-0012 "Parametric Studies of Frequency Response of Secondary Systems Under Ground-Acceleration Excitations,"
by Y. Yong and Y.K. Lin, 6/10/87, (PB88-134309, A03, MF-A01). This report is only available through NTIS (see address given above).
NCEER-87-0013 "Frequency Response of Secondary Systems Under Seismic Excitation," by J.A. HoLung, J. Cai and Y.K.
Lin, 7/31/87, (PB88-134317, A05, MF-A01). This report is only available through NTIS (see address given above).
NCEER-87-0014 "Modelling Earthquake Ground Motions in Seismically Active Regions Using Parametric Time Series
Methods," by G.W. Ellis and A.S. Cakmak, 8/25/87, (PB88-134283, A08, MF-A01). This report is only available through NTIS (see address given above).
Formerly the National Center for Earthquake Engineering Research
206
NCEER-87-0015 "Detection and Assessment of Seismic Structural Damage," by E. DiPasquale and A.S. Cakmak, 8/25/87,
(PB88-163712, A05, MF-A01). This report is only available through NTIS (see address given above). NCEER-87-0016 "Pipeline Experiment at Parkfield, California," by J. Isenberg and E. Richardson, 9/15/87, (PB88-163720,
A03, MF-A01). This report is available only through NTIS (see address given above). NCEER-87-0017 "Digital Simulation of Seismic Ground Motion," by M. Shinozuka, G. Deodatis and T. Harada, 8/31/87,
(PB88-155197, A04, MF-A01). This report is available only through NTIS (see address given above). NCEER-87-0018 "Practical Considerations for Structural Control: System Uncertainty, System Time Delay and Truncation of
Small Control Forces," J.N. Yang and A. Akbarpour, 8/10/87, (PB88-163738, A08, MF-A01). This report is only available through NTIS (see address given above).
NCEER-87-0019 "Modal Analysis of Nonclassically Damped Structural Systems Using Canonical Transformation," by J.N.
Yang, S. Sarkani and F.X. Long, 9/27/87, (PB88-187851, A04, MF-A01). NCEER-87-0020 "A Nonstationary Solution in Random Vibration Theory," by J.R. Red-Horse and P.D. Spanos, 11/3/87,
(PB88-163746, A03, MF-A01). NCEER-87-0021 "Horizontal Impedances for Radially Inhomogeneous Viscoelastic Soil Layers," by A.S. Veletsos and K.W.
Dotson, 10/15/87, (PB88-150859, A04, MF-A01). NCEER-87-0022 "Seismic Damage Assessment of Reinforced Concrete Members," by Y.S. Chung, C. Meyer and M.
Shinozuka, 10/9/87, (PB88-150867, A05, MF-A01). This report is available only through NTIS (see address given above).
NCEER-87-0023 "Active Structural Control in Civil Engineering," by T.T. Soong, 11/11/87, (PB88-187778, A03, MF-A01). NCEER-87-0024 "Vertical and Torsional Impedances for Radially Inhomogeneous Viscoelastic Soil Layers," by K.W. Dotson
and A.S. Veletsos, 12/87, (PB88-187786, A03, MF-A01). NCEER-87-0025 "Proceedings from the Symposium on Seismic Hazards, Ground Motions, Soil-Liquefaction and Engineering
Practice in Eastern North America," October 20-22, 1987, edited by K.H. Jacob, 12/87, (PB88-188115, A23, MF-A01). This report is available only through NTIS (see address given above).
NCEER-87-0026 "Report on the Whittier-Narrows, California, Earthquake of October 1, 1987," by J. Pantelic and A.
Reinhorn, 11/87, (PB88-187752, A03, MF-A01). This report is available only through NTIS (see address given above).
NCEER-87-0027 "Design of a Modular Program for Transient Nonlinear Analysis of Large 3-D Building Structures," by S.
Srivastav and J.F. Abel, 12/30/87, (PB88-187950, A05, MF-A01). This report is only available through NTIS (see address given above).
NCEER-87-0028 "Second-Year Program in Research, Education and Technology Transfer," 3/8/88, (PB88-219480, A04, MF-
A01). NCEER-88-0001 "Workshop on Seismic Computer Analysis and Design of Buildings With Interactive Graphics," by W.
McGuire, J.F. Abel and C.H. Conley, 1/18/88, (PB88-187760, A03, MF-A01). This report is only available through NTIS (see address given above).
NCEER-88-0002 "Optimal Control of Nonlinear Flexible Structures," by J.N. Yang, F.X. Long and D. Wong, 1/22/88, (PB88-
213772, A06, MF-A01). NCEER-88-0003 "Substructuring Techniques in the Time Domain for Primary-Secondary Structural Systems," by G.D.
Manolis and G. Juhn, 2/10/88, (PB88-213780, A04, MF-A01). NCEER-88-0004 "Iterative Seismic Analysis of Primary-Secondary Systems," by A. Singhal, L.D. Lutes and P.D. Spanos,
2/23/88, (PB88-213798, A04, MF-A01).

Formerly the National Center for Earthquake Engineering Research
207
NCEER-88-0005 "Stochastic Finite Element Expansion for Random Media," by P.D. Spanos and R. Ghanem, 3/14/88, (PB88-213806, A03, MF-A01).
NCEER-88-0006 "Combining Structural Optimization and Structural Control," by F.Y. Cheng and C.P. Pantelides, 1/10/88,
(PB88-213814, A05, MF-A01). NCEER-88-0007 "Seismic Performance Assessment of Code-Designed Structures," by H.H-M. Hwang, J-W. Jaw and H-J.
Shau, 3/20/88, (PB88-219423, A04, MF-A01). This report is only available through NTIS (see address given above).
NCEER-88-0008 "Reliability Analysis of Code-Designed Structures Under Natural Hazards," by H.H-M. Hwang, H. Ushiba
and M. Shinozuka, 2/29/88, (PB88-229471, A07, MF-A01). This report is only available through NTIS (see address given above).
NCEER-88-0009 "Seismic Fragility Analysis of Shear Wall Structures," by J-W Jaw and H.H-M. Hwang, 4/30/88, (PB89-
102867, A04, MF-A01). NCEER-88-0010 "Base Isolation of a Multi-Story Building Under a Harmonic Ground Motion - A Comparison of
Performances of Various Systems," by F-G Fan, G. Ahmadi and I.G. Tadjbakhsh, 5/18/88, (PB89-122238, A06, MF-A01). This report is only available through NTIS (see address given above).
NCEER-88-0011 "Seismic Floor Response Spectra for a Combined System by Green's Functions," by F.M. Lavelle, L.A.
Bergman and P.D. Spanos, 5/1/88, (PB89-102875, A03, MF-A01). NCEER-88-0012 "A New Solution Technique for Randomly Excited Hysteretic Structures," by G.Q. Cai and Y.K. Lin,
5/16/88, (PB89-102883, A03, MF-A01). NCEER-88-0013 "A Study of Radiation Damping and Soil-Structure Interaction Effects in the Centrifuge," by K. Weissman,
supervised by J.H. Prevost, 5/24/88, (PB89-144703, A06, MF-A01). NCEER-88-0014 "Parameter Identification and Implementation of a Kinematic Plasticity Model for Frictional Soils," by J.H.
Prevost and D.V. Griffiths, to be published. NCEER-88-0015 "Two- and Three- Dimensional Dynamic Finite Element Analyses of the Long Valley Dam," by D.V.
Griffiths and J.H. Prevost, 6/17/88, (PB89-144711, A04, MF-A01). NCEER-88-0016 "Damage Assessment of Reinforced Concrete Structures in Eastern United States," by A.M. Reinhorn, M.J.
Seidel, S.K. Kunnath and Y.J. Park, 6/15/88, (PB89-122220, A04, MF-A01). This report is only available through NTIS (see address given above).
NCEER-88-0017 "Dynamic Compliance of Vertically Loaded Strip Foundations in Multilayered Viscoelastic Soils," by S.
Ahmad and A.S.M. Israil, 6/17/88, (PB89-102891, A04, MF-A01). NCEER-88-0018 "An Experimental Study of Seismic Structural Response With Added Viscoelastic Dampers," by R.C. Lin, Z.
Liang, T.T. Soong and R.H. Zhang, 6/30/88, (PB89-122212, A05, MF-A01). This report is available only through NTIS (see address given above).
NCEER-88-0019 "Experimental Investigation of Primary - Secondary System Interaction," by G.D. Manolis, G. Juhn and
A.M. Reinhorn, 5/27/88, (PB89-122204, A04, MF-A01). NCEER-88-0020 "A Response Spectrum Approach For Analysis of Nonclassically Damped Structures," by J.N. Yang, S.
Sarkani and F.X. Long, 4/22/88, (PB89-102909, A04, MF-A01). NCEER-88-0021 "Seismic Interaction of Structures and Soils: Stochastic Approach," by A.S. Veletsos and A.M. Prasad,
7/21/88, (PB89-122196, A04, MF-A01). This report is only available through NTIS (see address given above).
NCEER-88-0022 "Identification of the Serviceability Limit State and Detection of Seismic Structural Damage," by E.
DiPasquale and A.S. Cakmak, 6/15/88, (PB89-122188, A05, MF-A01). This report is available only through NTIS (see address given above).

Formerly the National Center for Earthquake Engineering Research
208
NCEER-88-0023 "Multi-Hazard Risk Analysis: Case of a Simple Offshore Structure," by B.K. Bhartia and E.H. Vanmarcke, 7/21/88, (PB89-145213, A05, MF-A01).
NCEER-88-0024 "Automated Seismic Design of Reinforced Concrete Buildings," by Y.S. Chung, C. Meyer and M.
Shinozuka, 7/5/88, (PB89-122170, A06, MF-A01). This report is available only through NTIS (see address given above).
NCEER-88-0025 "Experimental Study of Active Control of MDOF Structures Under Seismic Excitations," by L.L. Chung,
R.C. Lin, T.T. Soong and A.M. Reinhorn, 7/10/88, (PB89-122600, A04, MF-A01). NCEER-88-0026 "Earthquake Simulation Tests of a Low-Rise Metal Structure," by J.S. Hwang, K.C. Chang, G.C. Lee and
R.L. Ketter, 8/1/88, (PB89-102917, A04, MF-A01). NCEER-88-0027 "Systems Study of Urban Response and Reconstruction Due to Catastrophic Earthquakes," by F. Kozin and
H.K. Zhou, 9/22/88, (PB90-162348, A04, MF-A01). NCEER-88-0028 "Seismic Fragility Analysis of Plane Frame Structures," by H.H-M. Hwang and Y.K. Low, 7/31/88, (PB89-
131445, A06, MF-A01). NCEER-88-0029 "Response Analysis of Stochastic Structures," by A. Kardara, C. Bucher and M. Shinozuka, 9/22/88, (PB89-
174429, A04, MF-A01). NCEER-88-0030 "Nonnormal Accelerations Due to Yielding in a Primary Structure," by D.C.K. Chen and L.D. Lutes,
9/19/88, (PB89-131437, A04, MF-A01). NCEER-88-0031 "Design Approaches for Soil-Structure Interaction," by A.S. Veletsos, A.M. Prasad and Y. Tang, 12/30/88,
(PB89-174437, A03, MF-A01). This report is available only through NTIS (see address given above). NCEER-88-0032 "A Re-evaluation of Design Spectra for Seismic Damage Control," by C.J. Turkstra and A.G. Tallin, 11/7/88,
(PB89-145221, A05, MF-A01). NCEER-88-0033 "The Behavior and Design of Noncontact Lap Splices Subjected to Repeated Inelastic Tensile Loading," by
V.E. Sagan, P. Gergely and R.N. White, 12/8/88, (PB89-163737, A08, MF-A01). NCEER-88-0034 "Seismic Response of Pile Foundations," by S.M. Mamoon, P.K. Banerjee and S. Ahmad, 11/1/88, (PB89-
145239, A04, MF-A01). NCEER-88-0035 "Modeling of R/C Building Structures With Flexible Floor Diaphragms (IDARC2)," by A.M. Reinhorn, S.K.
Kunnath and N. Panahshahi, 9/7/88, (PB89-207153, A07, MF-A01). NCEER-88-0036 "Solution of the Dam-Reservoir Interaction Problem Using a Combination of FEM, BEM with Particular
Integrals, Modal Analysis, and Substructuring," by C-S. Tsai, G.C. Lee and R.L. Ketter, 12/31/88, (PB89-207146, A04, MF-A01).
NCEER-88-0037 "Optimal Placement of Actuators for Structural Control," by F.Y. Cheng and C.P. Pantelides, 8/15/88,
(PB89-162846, A05, MF-A01). NCEER-88-0038 "Teflon Bearings in Aseismic Base Isolation: Experimental Studies and Mathematical Modeling," by A.
Mokha, M.C. Constantinou and A.M. Reinhorn, 12/5/88, (PB89-218457, A10, MF-A01). This report is available only through NTIS (see address given above).
NCEER-88-0039 "Seismic Behavior of Flat Slab High-Rise Buildings in the New York City Area," by P. Weidlinger and M.
Ettouney, 10/15/88, (PB90-145681, A04, MF-A01). NCEER-88-0040 "Evaluation of the Earthquake Resistance of Existing Buildings in New York City," by P. Weidlinger and M.
Ettouney, 10/15/88, to be published. NCEER-88-0041 "Small-Scale Modeling Techniques for Reinforced Concrete Structures Subjected to Seismic Loads," by W.
Kim, A. El-Attar and R.N. White, 11/22/88, (PB89-189625, A05, MF-A01).
Formerly the National Center for Earthquake Engineering Research
209
NCEER-88-0042 "Modeling Strong Ground Motion from Multiple Event Earthquakes," by G.W. Ellis and A.S. Cakmak, 10/15/88, (PB89-174445, A03, MF-A01).
NCEER-88-0043 "Nonstationary Models of Seismic Ground Acceleration," by M. Grigoriu, S.E. Ruiz and E. Rosenblueth,
7/15/88, (PB89-189617, A04, MF-A01). NCEER-88-0044 "SARCF User's Guide: Seismic Analysis of Reinforced Concrete Frames," by Y.S. Chung, C. Meyer and M.
Shinozuka, 11/9/88, (PB89-174452, A08, MF-A01). NCEER-88-0045 "First Expert Panel Meeting on Disaster Research and Planning," edited by J. Pantelic and J. Stoyle, 9/15/88,
(PB89-174460, A05, MF-A01). NCEER-88-0046 "Preliminary Studies of the Effect of Degrading Infill Walls on the Nonlinear Seismic Response of Steel
Frames," by C.Z. Chrysostomou, P. Gergely and J.F. Abel, 12/19/88, (PB89-208383, A05, MF-A01). NCEER-88-0047 "Reinforced Concrete Frame Component Testing Facility - Design, Construction, Instrumentation and
Operation," by S.P. Pessiki, C. Conley, T. Bond, P. Gergely and R.N. White, 12/16/88, (PB89-174478, A04, MF-A01).
NCEER-89-0001 "Effects of Protective Cushion and Soil Compliancy on the Response of Equipment Within a Seismically
Excited Building," by J.A. HoLung, 2/16/89, (PB89-207179, A04, MF-A01). NCEER-89-0002 "Statistical Evaluation of Response Modification Factors for Reinforced Concrete Structures," by H.H-M.
Hwang and J-W. Jaw, 2/17/89, (PB89-207187, A05, MF-A01). NCEER-89-0003 "Hysteretic Columns Under Random Excitation," by G-Q. Cai and Y.K. Lin, 1/9/89, (PB89-196513, A03,
MF-A01). NCEER-89-0004 "Experimental Study of `Elephant Foot Bulge' Instability of Thin-Walled Metal Tanks," by Z-H. Jia and R.L.
Ketter, 2/22/89, (PB89-207195, A03, MF-A01). NCEER-89-0005 "Experiment on Performance of Buried Pipelines Across San Andreas Fault," by J. Isenberg, E. Richardson
and T.D. O'Rourke, 3/10/89, (PB89-218440, A04, MF-A01). This report is available only through NTIS (see address given above).
NCEER-89-0006 "A Knowledge-Based Approach to Structural Design of Earthquake-Resistant Buildings," by M. Subramani,
P. Gergely, C.H. Conley, J.F. Abel and A.H. Zaghw, 1/15/89, (PB89-218465, A06, MF-A01). NCEER-89-0007 "Liquefaction Hazards and Their Effects on Buried Pipelines," by T.D. O'Rourke and P.A. Lane, 2/1/89,
(PB89-218481, A09, MF-A01). NCEER-89-0008 "Fundamentals of System Identification in Structural Dynamics," by H. Imai, C-B. Yun, O. Maruyama and
M. Shinozuka, 1/26/89, (PB89-207211, A04, MF-A01). NCEER-89-0009 "Effects of the 1985 Michoacan Earthquake on Water Systems and Other Buried Lifelines in Mexico," by
A.G. Ayala and M.J. O'Rourke, 3/8/89, (PB89-207229, A06, MF-A01). NCEER-89-R010 "NCEER Bibliography of Earthquake Education Materials," by K.E.K. Ross, Second Revision, 9/1/89,
(PB90-125352, A05, MF-A01). This report is replaced by NCEER-92-0018. NCEER-89-0011 "Inelastic Three-Dimensional Response Analysis of Reinforced Concrete Building Structures (IDARC-3D),
Part I - Modeling," by S.K. Kunnath and A.M. Reinhorn, 4/17/89, (PB90-114612, A07, MF-A01). This report is available only through NTIS (see address given above).
NCEER-89-0012 "Recommended Modifications to ATC-14," by C.D. Poland and J.O. Malley, 4/12/89, (PB90-108648, A15,
MF-A01). NCEER-89-0013 "Repair and Strengthening of Beam-to-Column Connections Subjected to Earthquake Loading," by M.
Corazao and A.J. Durrani, 2/28/89, (PB90-109885, A06, MF-A01).

Formerly the National Center for Earthquake Engineering Research
210
NCEER-89-0014 "Program EXKAL2 for Identification of Structural Dynamic Systems," by O. Maruyama, C-B. Yun, M. Hoshiya and M. Shinozuka, 5/19/89, (PB90-109877, A09, MF-A01).
NCEER-89-0015 "Response of Frames With Bolted Semi-Rigid Connections, Part I - Experimental Study and Analytical
Predictions," by P.J. DiCorso, A.M. Reinhorn, J.R. Dickerson, J.B. Radziminski and W.L. Harper, 6/1/89, to be published.
NCEER-89-0016 "ARMA Monte Carlo Simulation in Probabilistic Structural Analysis," by P.D. Spanos and M.P. Mignolet,
7/10/89, (PB90-109893, A03, MF-A01). NCEER-89-P017 "Preliminary Proceedings from the Conference on Disaster Preparedness - The Place of Earthquake
Education in Our Schools," Edited by K.E.K. Ross, 6/23/89, (PB90-108606, A03, MF-A01). NCEER-89-0017 "Proceedings from the Conference on Disaster Preparedness - The Place of Earthquake Education in Our
Schools," Edited by K.E.K. Ross, 12/31/89, (PB90-207895, A012, MF-A02). This report is available only through NTIS (see address given above).
NCEER-89-0018 "Multidimensional Models of Hysteretic Material Behavior for Vibration Analysis of Shape Memory Energy
Absorbing Devices, by E.J. Graesser and F.A. Cozzarelli, 6/7/89, (PB90-164146, A04, MF-A01). NCEER-89-0019 "Nonlinear Dynamic Analysis of Three-Dimensional Base Isolated Structures (3D-BASIS)," by S.
Nagarajaiah, A.M. Reinhorn and M.C. Constantinou, 8/3/89, (PB90-161936, A06, MF-A01). This report has been replaced by NCEER-93-0011.
NCEER-89-0020 "Structural Control Considering Time-Rate of Control Forces and Control Rate Constraints," by F.Y. Cheng
and C.P. Pantelides, 8/3/89, (PB90-120445, A04, MF-A01). NCEER-89-0021 "Subsurface Conditions of Memphis and Shelby County," by K.W. Ng, T-S. Chang and H-H.M. Hwang,
7/26/89, (PB90-120437, A03, MF-A01). NCEER-89-0022 "Seismic Wave Propagation Effects on Straight Jointed Buried Pipelines," by K. Elhmadi and M.J. O'Rourke,
8/24/89, (PB90-162322, A10, MF-A02). NCEER-89-0023 "Workshop on Serviceability Analysis of Water Delivery Systems," edited by M. Grigoriu, 3/6/89, (PB90-
127424, A03, MF-A01). NCEER-89-0024 "Shaking Table Study of a 1/5 Scale Steel Frame Composed of Tapered Members," by K.C. Chang, J.S.
Hwang and G.C. Lee, 9/18/89, (PB90-160169, A04, MF-A01). NCEER-89-0025 "DYNA1D: A Computer Program for Nonlinear Seismic Site Response Analysis - Technical
Documentation," by Jean H. Prevost, 9/14/89, (PB90-161944, A07, MF-A01). This report is available only through NTIS (see address given above).
NCEER-89-0026 "1:4 Scale Model Studies of Active Tendon Systems and Active Mass Dampers for Aseismic Protection," by
A.M. Reinhorn, T.T. Soong, R.C. Lin, Y.P. Yang, Y. Fukao, H. Abe and M. Nakai, 9/15/89, (PB90-173246, A10, MF-A02). This report is available only through NTIS (see address given above).
NCEER-89-0027 "Scattering of Waves by Inclusions in a Nonhomogeneous Elastic Half Space Solved by Boundary Element
Methods," by P.K. Hadley, A. Askar and A.S. Cakmak, 6/15/89, (PB90-145699, A07, MF-A01). NCEER-89-0028 "Statistical Evaluation of Deflection Amplification Factors for Reinforced Concrete Structures," by H.H.M.
Hwang, J-W. Jaw and A.L. Ch'ng, 8/31/89, (PB90-164633, A05, MF-A01). NCEER-89-0029 "Bedrock Accelerations in Memphis Area Due to Large New Madrid Earthquakes," by H.H.M. Hwang,
C.H.S. Chen and G. Yu, 11/7/89, (PB90-162330, A04, MF-A01). NCEER-89-0030 "Seismic Behavior and Response Sensitivity of Secondary Structural Systems," by Y.Q. Chen and T.T.
Soong, 10/23/89, (PB90-164658, A08, MF-A01). NCEER-89-0031 "Random Vibration and Reliability Analysis of Primary-Secondary Structural Systems," by Y. Ibrahim, M.
Grigoriu and T.T. Soong, 11/10/89, (PB90-161951, A04, MF-A01).

Formerly the National Center for Earthquake Engineering Research
211
NCEER-89-0032 "Proceedings from the Second U.S. - Japan Workshop on Liquefaction, Large Ground Deformation and
Their Effects on Lifelines, September 26-29, 1989," Edited by T.D. O'Rourke and M. Hamada, 12/1/89, (PB90-209388, A22, MF-A03).
NCEER-89-0033 "Deterministic Model for Seismic Damage Evaluation of Reinforced Concrete Structures," by J.M. Bracci,
A.M. Reinhorn, J.B. Mander and S.K. Kunnath, 9/27/89, (PB91-108803, A06, MF-A01). NCEER-89-0034 "On the Relation Between Local and Global Damage Indices," by E. DiPasquale and A.S. Cakmak, 8/15/89,
(PB90-173865, A05, MF-A01). NCEER-89-0035 "Cyclic Undrained Behavior of Nonplastic and Low Plasticity Silts," by A.J. Walker and H.E. Stewart,
7/26/89, (PB90-183518, A10, MF-A01). NCEER-89-0036 "Liquefaction Potential of Surficial Deposits in the City of Buffalo, New York," by M. Budhu, R. Giese and
L. Baumgrass, 1/17/89, (PB90-208455, A04, MF-A01). NCEER-89-0037 "A Deterministic Assessment of Effects of Ground Motion Incoherence," by A.S. Veletsos and Y. Tang,
7/15/89, (PB90-164294, A03, MF-A01). NCEER-89-0038 "Workshop on Ground Motion Parameters for Seismic Hazard Mapping," July 17-18, 1989, edited by R.V.
Whitman, 12/1/89, (PB90-173923, A04, MF-A01). NCEER-89-0039 "Seismic Effects on Elevated Transit Lines of the New York City Transit Authority," by C.J. Costantino,
C.A. Miller and E. Heymsfield, 12/26/89, (PB90-207887, A06, MF-A01). NCEER-89-0040 "Centrifugal Modeling of Dynamic Soil-Structure Interaction," by K. Weissman, Supervised by J.H. Prevost,
5/10/89, (PB90-207879, A07, MF-A01). NCEER-89-0041 "Linearized Identification of Buildings With Cores for Seismic Vulnerability Assessment," by I-K. Ho and
A.E. Aktan, 11/1/89, (PB90-251943, A07, MF-A01). NCEER-90-0001 "Geotechnical and Lifeline Aspects of the October 17, 1989 Loma Prieta Earthquake in San Francisco," by
T.D. O'Rourke, H.E. Stewart, F.T. Blackburn and T.S. Dickerman, 1/90, (PB90-208596, A05, MF-A01). NCEER-90-0002 "Nonnormal Secondary Response Due to Yielding in a Primary Structure," by D.C.K. Chen and L.D. Lutes,
2/28/90, (PB90-251976, A07, MF-A01). NCEER-90-0003 "Earthquake Education Materials for Grades K-12," by K.E.K. Ross, 4/16/90, (PB91-251984, A05, MF-
A05). This report has been replaced by NCEER-92-0018. NCEER-90-0004 "Catalog of Strong Motion Stations in Eastern North America," by R.W. Busby, 4/3/90, (PB90-251984, A05,
MF-A01). NCEER-90-0005 "NCEER Strong-Motion Data Base: A User Manual for the GeoBase Release (Version 1.0 for the Sun3)," by
P. Friberg and K. Jacob, 3/31/90 (PB90-258062, A04, MF-A01). NCEER-90-0006 "Seismic Hazard Along a Crude Oil Pipeline in the Event of an 1811-1812 Type New Madrid Earthquake,"
by H.H.M. Hwang and C-H.S. Chen, 4/16/90, (PB90-258054, A04, MF-A01). NCEER-90-0007 "Site-Specific Response Spectra for Memphis Sheahan Pumping Station," by H.H.M. Hwang and C.S. Lee,
5/15/90, (PB91-108811, A05, MF-A01). NCEER-90-0008 "Pilot Study on Seismic Vulnerability of Crude Oil Transmission Systems," by T. Ariman, R. Dobry, M.
Grigoriu, F. Kozin, M. O'Rourke, T. O'Rourke and M. Shinozuka, 5/25/90, (PB91-108837, A06, MF-A01). NCEER-90-0009 "A Program to Generate Site Dependent Time Histories: EQGEN," by G.W. Ellis, M. Srinivasan and A.S.
Cakmak, 1/30/90, (PB91-108829, A04, MF-A01). NCEER-90-0010 "Active Isolation for Seismic Protection of Operating Rooms," by M.E. Talbott, Supervised by M.
Shinozuka, 6/8/9, (PB91-110205, A05, MF-A01).

Formerly the National Center for Earthquake Engineering Research
212
NCEER-90-0011 "Program LINEARID for Identification of Linear Structural Dynamic Systems," by C-B. Yun and M.
Shinozuka, 6/25/90, (PB91-110312, A08, MF-A01). NCEER-90-0012 "Two-Dimensional Two-Phase Elasto-Plastic Seismic Response of Earth Dams," by A.N. Yiagos, Supervised
by J.H. Prevost, 6/20/90, (PB91-110197, A13, MF-A02). NCEER-90-0013 "Secondary Systems in Base-Isolated Structures: Experimental Investigation, Stochastic Response and
Stochastic Sensitivity," by G.D. Manolis, G. Juhn, M.C. Constantinou and A.M. Reinhorn, 7/1/90, (PB91-110320, A08, MF-A01).
NCEER-90-0014 "Seismic Behavior of Lightly-Reinforced Concrete Column and Beam-Column Joint Details," by S.P.
Pessiki, C.H. Conley, P. Gergely and R.N. White, 8/22/90, (PB91-108795, A11, MF-A02). NCEER-90-0015 "Two Hybrid Control Systems for Building Structures Under Strong Earthquakes," by J.N. Yang and A.
Danielians, 6/29/90, (PB91-125393, A04, MF-A01). NCEER-90-0016 "Instantaneous Optimal Control with Acceleration and Velocity Feedback," by J.N. Yang and Z. Li, 6/29/90,
(PB91-125401, A03, MF-A01). NCEER-90-0017 "Reconnaissance Report on the Northern Iran Earthquake of June 21, 1990," by M. Mehrain, 10/4/90, (PB91-
125377, A03, MF-A01). NCEER-90-0018 "Evaluation of Liquefaction Potential in Memphis and Shelby County," by T.S. Chang, P.S. Tang, C.S. Lee
and H. Hwang, 8/10/90, (PB91-125427, A09, MF-A01). NCEER-90-0019 "Experimental and Analytical Study of a Combined Sliding Disc Bearing and Helical Steel Spring Isolation
System," by M.C. Constantinou, A.S. Mokha and A.M. Reinhorn, 10/4/90, (PB91-125385, A06, MF-A01). This report is available only through NTIS (see address given above).
NCEER-90-0020 "Experimental Study and Analytical Prediction of Earthquake Response of a Sliding Isolation System with a
Spherical Surface," by A.S. Mokha, M.C. Constantinou and A.M. Reinhorn, 10/11/90, (PB91-125419, A05, MF-A01).
NCEER-90-0021 "Dynamic Interaction Factors for Floating Pile Groups," by G. Gazetas, K. Fan, A. Kaynia and E. Kausel,
9/10/90, (PB91-170381, A05, MF-A01). NCEER-90-0022 "Evaluation of Seismic Damage Indices for Reinforced Concrete Structures," by S. Rodriguez-Gomez and
A.S. Cakmak, 9/30/90, PB91-171322, A06, MF-A01). NCEER-90-0023 "Study of Site Response at a Selected Memphis Site," by H. Desai, S. Ahmad, E.S. Gazetas and M.R. Oh,
10/11/90, (PB91-196857, A03, MF-A01). NCEER-90-0024 "A User's Guide to Strongmo: Version 1.0 of NCEER's Strong-Motion Data Access Tool for PCs and
Terminals," by P.A. Friberg and C.A.T. Susch, 11/15/90, (PB91-171272, A03, MF-A01). NCEER-90-0025 "A Three-Dimensional Analytical Study of Spatial Variability of Seismic Ground Motions," by L-L. Hong
and A.H.-S. Ang, 10/30/90, (PB91-170399, A09, MF-A01). NCEER-90-0026 "MUMOID User's Guide - A Program for the Identification of Modal Parameters," by S. Rodriguez-Gomez
and E. DiPasquale, 9/30/90, (PB91-171298, A04, MF-A01). NCEER-90-0027 "SARCF-II User's Guide - Seismic Analysis of Reinforced Concrete Frames," by S. Rodriguez-Gomez, Y.S.
Chung and C. Meyer, 9/30/90, (PB91-171280, A05, MF-A01). NCEER-90-0028 "Viscous Dampers: Testing, Modeling and Application in Vibration and Seismic Isolation," by N. Makris
and M.C. Constantinou, 12/20/90 (PB91-190561, A06, MF-A01). NCEER-90-0029 "Soil Effects on Earthquake Ground Motions in the Memphis Area," by H. Hwang, C.S. Lee, K.W. Ng and
T.S. Chang, 8/2/90, (PB91-190751, A05, MF-A01).

Formerly the National Center for Earthquake Engineering Research
213
NCEER-91-0001 "Proceedings from the Third Japan-U.S. Workshop on Earthquake Resistant Design of Lifeline Facilities and Countermeasures for Soil Liquefaction, December 17-19, 1990," edited by T.D. O'Rourke and M. Hamada, 2/1/91, (PB91-179259, A99, MF-A04).
NCEER-91-0002 "Physical Space Solutions of Non-Proportionally Damped Systems," by M. Tong, Z. Liang and G.C. Lee,
1/15/91, (PB91-179242, A04, MF-A01). NCEER-91-0003 "Seismic Response of Single Piles and Pile Groups," by K. Fan and G. Gazetas, 1/10/91, (PB92-174994,
A04, MF-A01). NCEER-91-0004 "Damping of Structures: Part 1 - Theory of Complex Damping," by Z. Liang and G. Lee, 10/10/91, (PB92-
197235, A12, MF-A03). NCEER-91-0005 "3D-BASIS - Nonlinear Dynamic Analysis of Three Dimensional Base Isolated Structures: Part II," by S.
Nagarajaiah, A.M. Reinhorn and M.C. Constantinou, 2/28/91, (PB91-190553, A07, MF-A01). This report has been replaced by NCEER-93-0011.
NCEER-91-0006 "A Multidimensional Hysteretic Model for Plasticity Deforming Metals in Energy Absorbing Devices," by
E.J. Graesser and F.A. Cozzarelli, 4/9/91, (PB92-108364, A04, MF-A01). NCEER-91-0007 "A Framework for Customizable Knowledge-Based Expert Systems with an Application to a KBES for
Evaluating the Seismic Resistance of Existing Buildings," by E.G. Ibarra-Anaya and S.J. Fenves, 4/9/91, (PB91-210930, A08, MF-A01).
NCEER-91-0008 "Nonlinear Analysis of Steel Frames with Semi-Rigid Connections Using the Capacity Spectrum Method,"
by G.G. Deierlein, S-H. Hsieh, Y-J. Shen and J.F. Abel, 7/2/91, (PB92-113828, A05, MF-A01). NCEER-91-0009 "Earthquake Education Materials for Grades K-12," by K.E.K. Ross, 4/30/91, (PB91-212142, A06, MF-
A01). This report has been replaced by NCEER-92-0018. NCEER-91-0010 "Phase Wave Velocities and Displacement Phase Differences in a Harmonically Oscillating Pile," by N.
Makris and G. Gazetas, 7/8/91, (PB92-108356, A04, MF-A01). NCEER-91-0011 "Dynamic Characteristics of a Full-Size Five-Story Steel Structure and a 2/5 Scale Model," by K.C. Chang,
G.C. Yao, G.C. Lee, D.S. Hao and Y.C. Yeh," 7/2/91, (PB93-116648, A06, MF-A02). NCEER-91-0012 "Seismic Response of a 2/5 Scale Steel Structure with Added Viscoelastic Dampers," by K.C. Chang, T.T.
Soong, S-T. Oh and M.L. Lai, 5/17/91, (PB92-110816, A05, MF-A01). NCEER-91-0013 "Earthquake Response of Retaining Walls; Full-Scale Testing and Computational Modeling," by S.
Alampalli and A-W.M. Elgamal, 6/20/91, to be published. NCEER-91-0014 "3D-BASIS-M: Nonlinear Dynamic Analysis of Multiple Building Base Isolated Structures," by P.C.
Tsopelas, S. Nagarajaiah, M.C. Constantinou and A.M. Reinhorn, 5/28/91, (PB92-113885, A09, MF-A02). NCEER-91-0015 "Evaluation of SEAOC Design Requirements for Sliding Isolated Structures," by D. Theodossiou and M.C.
Constantinou, 6/10/91, (PB92-114602, A11, MF-A03). NCEER-91-0016 "Closed-Loop Modal Testing of a 27-Story Reinforced Concrete Flat Plate-Core Building," by H.R.
Somaprasad, T. Toksoy, H. Yoshiyuki and A.E. Aktan, 7/15/91, (PB92-129980, A07, MF-A02). NCEER-91-0017 "Shake Table Test of a 1/6 Scale Two-Story Lightly Reinforced Concrete Building," by A.G. El-Attar, R.N.
White and P. Gergely, 2/28/91, (PB92-222447, A06, MF-A02). NCEER-91-0018 "Shake Table Test of a 1/8 Scale Three-Story Lightly Reinforced Concrete Building," by A.G. El-Attar, R.N.
White and P. Gergely, 2/28/91, (PB93-116630, A08, MF-A02). NCEER-91-0019 "Transfer Functions for Rigid Rectangular Foundations," by A.S. Veletsos, A.M. Prasad and W.H. Wu,
7/31/91, to be published.

Formerly the National Center for Earthquake Engineering Research
214
NCEER-91-0020 "Hybrid Control of Seismic-Excited Nonlinear and Inelastic Structural Systems," by J.N. Yang, Z. Li and A. Danielians, 8/1/91, (PB92-143171, A06, MF-A02).
NCEER-91-0021 "The NCEER-91 Earthquake Catalog: Improved Intensity-Based Magnitudes and Recurrence Relations for
U.S. Earthquakes East of New Madrid," by L. Seeber and J.G. Armbruster, 8/28/91, (PB92-176742, A06, MF-A02).
NCEER-91-0022 "Proceedings from the Implementation of Earthquake Planning and Education in Schools: The Need for
Change - The Roles of the Changemakers," by K.E.K. Ross and F. Winslow, 7/23/91, (PB92-129998, A12, MF-A03).
NCEER-91-0023 "A Study of Reliability-Based Criteria for Seismic Design of Reinforced Concrete Frame Buildings," by
H.H.M. Hwang and H-M. Hsu, 8/10/91, (PB92-140235, A09, MF-A02). NCEER-91-0024 "Experimental Verification of a Number of Structural System Identification Algorithms," by R.G. Ghanem,
H. Gavin and M. Shinozuka, 9/18/91, (PB92-176577, A18, MF-A04). NCEER-91-0025 "Probabilistic Evaluation of Liquefaction Potential," by H.H.M. Hwang and C.S. Lee," 11/25/91, (PB92-
143429, A05, MF-A01). NCEER-91-0026 "Instantaneous Optimal Control for Linear, Nonlinear and Hysteretic Structures - Stable Controllers," by J.N.
Yang and Z. Li, 11/15/91, (PB92-163807, A04, MF-A01). NCEER-91-0027 "Experimental and Theoretical Study of a Sliding Isolation System for Bridges," by M.C. Constantinou, A.
Kartoum, A.M. Reinhorn and P. Bradford, 11/15/91, (PB92-176973, A10, MF-A03). NCEER-92-0001 "Case Studies of Liquefaction and Lifeline Performance During Past Earthquakes, Volume 1: Japanese Case
Studies," Edited by M. Hamada and T. O'Rourke, 2/17/92, (PB92-197243, A18, MF-A04). NCEER-92-0002 "Case Studies of Liquefaction and Lifeline Performance During Past Earthquakes, Volume 2: United States
Case Studies," Edited by T. O'Rourke and M. Hamada, 2/17/92, (PB92-197250, A20, MF-A04). NCEER-92-0003 "Issues in Earthquake Education," Edited by K. Ross, 2/3/92, (PB92-222389, A07, MF-A02). NCEER-92-0004 "Proceedings from the First U.S. - Japan Workshop on Earthquake Protective Systems for Bridges," Edited
by I.G. Buckle, 2/4/92, (PB94-142239, A99, MF-A06). NCEER-92-0005 "Seismic Ground Motion from a Haskell-Type Source in a Multiple-Layered Half-Space," A.P. Theoharis, G.
Deodatis and M. Shinozuka, 1/2/92, to be published. NCEER-92-0006 "Proceedings from the Site Effects Workshop," Edited by R. Whitman, 2/29/92, (PB92-197201, A04, MF-
A01). NCEER-92-0007 "Engineering Evaluation of Permanent Ground Deformations Due to Seismically-Induced Liquefaction," by
M.H. Baziar, R. Dobry and A-W.M. Elgamal, 3/24/92, (PB92-222421, A13, MF-A03). NCEER-92-0008 "A Procedure for the Seismic Evaluation of Buildings in the Central and Eastern United States," by C.D.
Poland and J.O. Malley, 4/2/92, (PB92-222439, A20, MF-A04). NCEER-92-0009 "Experimental and Analytical Study of a Hybrid Isolation System Using Friction Controllable Sliding
Bearings," by M.Q. Feng, S. Fujii and M. Shinozuka, 5/15/92, (PB93-150282, A06, MF-A02). NCEER-92-0010 "Seismic Resistance of Slab-Column Connections in Existing Non-Ductile Flat-Plate Buildings," by A.J.
Durrani and Y. Du, 5/18/92, (PB93-116812, A06, MF-A02). NCEER-92-0011 "The Hysteretic and Dynamic Behavior of Brick Masonry Walls Upgraded by Ferrocement Coatings Under
Cyclic Loading and Strong Simulated Ground Motion," by H. Lee and S.P. Prawel, 5/11/92, to be published. NCEER-92-0012 "Study of Wire Rope Systems for Seismic Protection of Equipment in Buildings," by G.F. Demetriades,
M.C. Constantinou and A.M. Reinhorn, 5/20/92, (PB93-116655, A08, MF-A02).

Formerly the National Center for Earthquake Engineering Research
215
NCEER-92-0013 "Shape Memory Structural Dampers: Material Properties, Design and Seismic Testing," by P.R. Witting and F.A. Cozzarelli, 5/26/92, (PB93-116663, A05, MF-A01).
NCEER-92-0014 "Longitudinal Permanent Ground Deformation Effects on Buried Continuous Pipelines," by M.J. O'Rourke,
and C. Nordberg, 6/15/92, (PB93-116671, A08, MF-A02). NCEER-92-0015 "A Simulation Method for Stationary Gaussian Random Functions Based on the Sampling Theorem," by M.
Grigoriu and S. Balopoulou, 6/11/92, (PB93-127496, A05, MF-A01). NCEER-92-0016 "Gravity-Load-Designed Reinforced Concrete Buildings: Seismic Evaluation of Existing Construction and
Detailing Strategies for Improved Seismic Resistance," by G.W. Hoffmann, S.K. Kunnath, A.M. Reinhorn and J.B. Mander, 7/15/92, (PB94-142007, A08, MF-A02).
NCEER-92-0017 "Observations on Water System and Pipeline Performance in the Limón Area of Costa Rica Due to the April
22, 1991 Earthquake," by M. O'Rourke and D. Ballantyne, 6/30/92, (PB93-126811, A06, MF-A02). NCEER-92-0018 "Fourth Edition of Earthquake Education Materials for Grades K-12," Edited by K.E.K. Ross, 8/10/92,
(PB93-114023, A07, MF-A02). NCEER-92-0019 "Proceedings from the Fourth Japan-U.S. Workshop on Earthquake Resistant Design of Lifeline Facilities
and Countermeasures for Soil Liquefaction," Edited by M. Hamada and T.D. O'Rourke, 8/12/92, (PB93-163939, A99, MF-E11).
NCEER-92-0020 "Active Bracing System: A Full Scale Implementation of Active Control," by A.M. Reinhorn, T.T. Soong,
R.C. Lin, M.A. Riley, Y.P. Wang, S. Aizawa and M. Higashino, 8/14/92, (PB93-127512, A06, MF-A02). NCEER-92-0021 "Empirical Analysis of Horizontal Ground Displacement Generated by Liquefaction-Induced Lateral
Spreads," by S.F. Bartlett and T.L. Youd, 8/17/92, (PB93-188241, A06, MF-A02). NCEER-92-0022 "IDARC Version 3.0: Inelastic Damage Analysis of Reinforced Concrete Structures," by S.K. Kunnath, A.M.
Reinhorn and R.F. Lobo, 8/31/92, (PB93-227502, A07, MF-A02). NCEER-92-0023 "A Semi-Empirical Analysis of Strong-Motion Peaks in Terms of Seismic Source, Propagation Path and
Local Site Conditions, by M. Kamiyama, M.J. O'Rourke and R. Flores-Berrones, 9/9/92, (PB93-150266, A08, MF-A02).
NCEER-92-0024 "Seismic Behavior of Reinforced Concrete Frame Structures with Nonductile Details, Part I: Summary of
Experimental Findings of Full Scale Beam-Column Joint Tests," by A. Beres, R.N. White and P. Gergely, 9/30/92, (PB93-227783, A05, MF-A01).
NCEER-92-0025 "Experimental Results of Repaired and Retrofitted Beam-Column Joint Tests in Lightly Reinforced Concrete
Frame Buildings," by A. Beres, S. El-Borgi, R.N. White and P. Gergely, 10/29/92, (PB93-227791, A05, MF-A01).
NCEER-92-0026 "A Generalization of Optimal Control Theory: Linear and Nonlinear Structures," by J.N. Yang, Z. Li and S.
Vongchavalitkul, 11/2/92, (PB93-188621, A05, MF-A01). NCEER-92-0027 "Seismic Resistance of Reinforced Concrete Frame Structures Designed Only for Gravity Loads: Part I -
Design and Properties of a One-Third Scale Model Structure," by J.M. Bracci, A.M. Reinhorn and J.B. Mander, 12/1/92, (PB94-104502, A08, MF-A02).
NCEER-92-0028 "Seismic Resistance of Reinforced Concrete Frame Structures Designed Only for Gravity Loads: Part II -
Experimental Performance of Subassemblages," by L.E. Aycardi, J.B. Mander and A.M. Reinhorn, 12/1/92, (PB94-104510, A08, MF-A02).
NCEER-92-0029 "Seismic Resistance of Reinforced Concrete Frame Structures Designed Only for Gravity Loads: Part III -
Experimental Performance and Analytical Study of a Structural Model," by J.M. Bracci, A.M. Reinhorn and J.B. Mander, 12/1/92, (PB93-227528, A09, MF-A01).

Formerly the National Center for Earthquake Engineering Research
216
NCEER-92-0030 "Evaluation of Seismic Retrofit of Reinforced Concrete Frame Structures: Part I - Experimental Performance of Retrofitted Subassemblages," by D. Choudhuri, J.B. Mander and A.M. Reinhorn, 12/8/92, (PB93-198307, A07, MF-A02).
NCEER-92-0031 "Evaluation of Seismic Retrofit of Reinforced Concrete Frame Structures: Part II - Experimental
Performance and Analytical Study of a Retrofitted Structural Model," by J.M. Bracci, A.M. Reinhorn and J.B. Mander, 12/8/92, (PB93-198315, A09, MF-A03).
NCEER-92-0032 "Experimental and Analytical Investigation of Seismic Response of Structures with Supplemental Fluid
Viscous Dampers," by M.C. Constantinou and M.D. Symans, 12/21/92, (PB93-191435, A10, MF-A03). This report is available only through NTIS (see address given above).
NCEER-92-0033 "Reconnaissance Report on the Cairo, Egypt Earthquake of October 12, 1992," by M. Khater, 12/23/92,
(PB93-188621, A03, MF-A01). NCEER-92-0034 "Low-Level Dynamic Characteristics of Four Tall Flat-Plate Buildings in New York City," by H. Gavin, S.
Yuan, J. Grossman, E. Pekelis and K. Jacob, 12/28/92, (PB93-188217, A07, MF-A02). NCEER-93-0001 "An Experimental Study on the Seismic Performance of Brick-Infilled Steel Frames With and Without
Retrofit," by J.B. Mander, B. Nair, K. Wojtkowski and J. Ma, 1/29/93, (PB93-227510, A07, MF-A02). NCEER-93-0002 "Social Accounting for Disaster Preparedness and Recovery Planning," by S. Cole, E. Pantoja and V. Razak,
2/22/93, (PB94-142114, A12, MF-A03). NCEER-93-0003 "Assessment of 1991 NEHRP Provisions for Nonstructural Components and Recommended Revisions," by
T.T. Soong, G. Chen, Z. Wu, R-H. Zhang and M. Grigoriu, 3/1/93, (PB93-188639, A06, MF-A02). NCEER-93-0004 "Evaluation of Static and Response Spectrum Analysis Procedures of SEAOC/UBC for Seismic Isolated
Structures," by C.W. Winters and M.C. Constantinou, 3/23/93, (PB93-198299, A10, MF-A03). NCEER-93-0005 "Earthquakes in the Northeast - Are We Ignoring the Hazard? A Workshop on Earthquake Science and
Safety for Educators," edited by K.E.K. Ross, 4/2/93, (PB94-103066, A09, MF-A02). NCEER-93-0006 "Inelastic Response of Reinforced Concrete Structures with Viscoelastic Braces," by R.F. Lobo, J.M. Bracci,
K.L. Shen, A.M. Reinhorn and T.T. Soong, 4/5/93, (PB93-227486, A05, MF-A02). NCEER-93-0007 "Seismic Testing of Installation Methods for Computers and Data Processing Equipment," by K. Kosar, T.T.
Soong, K.L. Shen, J.A. HoLung and Y.K. Lin, 4/12/93, (PB93-198299, A07, MF-A02). NCEER-93-0008 "Retrofit of Reinforced Concrete Frames Using Added Dampers," by A. Reinhorn, M. Constantinou and C.
Li, to be published. NCEER-93-0009 "Seismic Behavior and Design Guidelines for Steel Frame Structures with Added Viscoelastic Dampers," by
K.C. Chang, M.L. Lai, T.T. Soong, D.S. Hao and Y.C. Yeh, 5/1/93, (PB94-141959, A07, MF-A02). NCEER-93-0010 "Seismic Performance of Shear-Critical Reinforced Concrete Bridge Piers," by J.B. Mander, S.M. Waheed,
M.T.A. Chaudhary and S.S. Chen, 5/12/93, (PB93-227494, A08, MF-A02). NCEER-93-0011 "3D-BASIS-TABS: Computer Program for Nonlinear Dynamic Analysis of Three Dimensional Base Isolated
Structures," by S. Nagarajaiah, C. Li, A.M. Reinhorn and M.C. Constantinou, 8/2/93, (PB94-141819, A09, MF-A02).
NCEER-93-0012 "Effects of Hydrocarbon Spills from an Oil Pipeline Break on Ground Water," by O.J. Helweg and H.H.M.
Hwang, 8/3/93, (PB94-141942, A06, MF-A02). NCEER-93-0013 "Simplified Procedures for Seismic Design of Nonstructural Components and Assessment of Current Code
Provisions," by M.P. Singh, L.E. Suarez, E.E. Matheu and G.O. Maldonado, 8/4/93, (PB94-141827, A09, MF-A02).
NCEER-93-0014 "An Energy Approach to Seismic Analysis and Design of Secondary Systems," by G. Chen and T.T. Soong,
8/6/93, (PB94-142767, A11, MF-A03).

Formerly the National Center for Earthquake Engineering Research
217
NCEER-93-0015 "Proceedings from School Sites: Becoming Prepared for Earthquakes - Commemorating the Third
Anniversary of the Loma Prieta Earthquake," Edited by F.E. Winslow and K.E.K. Ross, 8/16/93, (PB94-154275, A16, MF-A02).
NCEER-93-0016 "Reconnaissance Report of Damage to Historic Monuments in Cairo, Egypt Following the October 12, 1992
Dahshur Earthquake," by D. Sykora, D. Look, G. Croci, E. Karaesmen and E. Karaesmen, 8/19/93, (PB94-142221, A08, MF-A02).
NCEER-93-0017 "The Island of Guam Earthquake of August 8, 1993," by S.W. Swan and S.K. Harris, 9/30/93, (PB94-
141843, A04, MF-A01). NCEER-93-0018 "Engineering Aspects of the October 12, 1992 Egyptian Earthquake," by A.W. Elgamal, M. Amer, K.
Adalier and A. Abul-Fadl, 10/7/93, (PB94-141983, A05, MF-A01). NCEER-93-0019 "Development of an Earthquake Motion Simulator and its Application in Dynamic Centrifuge Testing," by I.
Krstelj, Supervised by J.H. Prevost, 10/23/93, (PB94-181773, A-10, MF-A03). NCEER-93-0020 "NCEER-Taisei Corporation Research Program on Sliding Seismic Isolation Systems for Bridges:
Experimental and Analytical Study of a Friction Pendulum System (FPS)," by M.C. Constantinou, P. Tsopelas, Y-S. Kim and S. Okamoto, 11/1/93, (PB94-142775, A08, MF-A02).
NCEER-93-0021 "Finite Element Modeling of Elastomeric Seismic Isolation Bearings," by L.J. Billings, Supervised by R.
Shepherd, 11/8/93, to be published. NCEER-93-0022 "Seismic Vulnerability of Equipment in Critical Facilities: Life-Safety and Operational Consequences," by
K. Porter, G.S. Johnson, M.M. Zadeh, C. Scawthorn and S. Eder, 11/24/93, (PB94-181765, A16, MF-A03). NCEER-93-0023 "Hokkaido Nansei-oki, Japan Earthquake of July 12, 1993, by P.I. Yanev and C.R. Scawthorn, 12/23/93,
(PB94-181500, A07, MF-A01). NCEER-94-0001 "An Evaluation of Seismic Serviceability of Water Supply Networks with Application to the San Francisco
Auxiliary Water Supply System," by I. Markov, Supervised by M. Grigoriu and T. O'Rourke, 1/21/94, (PB94-204013, A07, MF-A02).
NCEER-94-0002 "NCEER-Taisei Corporation Research Program on Sliding Seismic Isolation Systems for Bridges:
Experimental and Analytical Study of Systems Consisting of Sliding Bearings, Rubber Restoring Force Devices and Fluid Dampers," Volumes I and II, by P. Tsopelas, S. Okamoto, M.C. Constantinou, D. Ozaki and S. Fujii, 2/4/94, (PB94-181740, A09, MF-A02 and PB94-181757, A12, MF-A03).
NCEER-94-0003 "A Markov Model for Local and Global Damage Indices in Seismic Analysis," by S. Rahman and M.
Grigoriu, 2/18/94, (PB94-206000, A12, MF-A03). NCEER-94-0004 "Proceedings from the NCEER Workshop on Seismic Response of Masonry Infills," edited by D.P. Abrams,
3/1/94, (PB94-180783, A07, MF-A02). NCEER-94-0005 "The Northridge, California Earthquake of January 17, 1994: General Reconnaissance Report," edited by
J.D. Goltz, 3/11/94, (PB94-193943, A10, MF-A03). NCEER-94-0006 "Seismic Energy Based Fatigue Damage Analysis of Bridge Columns: Part I - Evaluation of Seismic
Capacity," by G.A. Chang and J.B. Mander, 3/14/94, (PB94-219185, A11, MF-A03). NCEER-94-0007 "Seismic Isolation of Multi-Story Frame Structures Using Spherical Sliding Isolation Systems," by T.M. Al-
Hussaini, V.A. Zayas and M.C. Constantinou, 3/17/94, (PB94-193745, A09, MF-A02). NCEER-94-0008 "The Northridge, California Earthquake of January 17, 1994: Performance of Highway Bridges," edited by
I.G. Buckle, 3/24/94, (PB94-193851, A06, MF-A02). NCEER-94-0009 "Proceedings of the Third U.S.-Japan Workshop on Earthquake Protective Systems for Bridges," edited by
I.G. Buckle and I. Friedland, 3/31/94, (PB94-195815, A99, MF-A06).

Formerly the National Center for Earthquake Engineering Research
218
NCEER-94-0010 "3D-BASIS-ME: Computer Program for Nonlinear Dynamic Analysis of Seismically Isolated Single and Multiple Structures and Liquid Storage Tanks," by P.C. Tsopelas, M.C. Constantinou and A.M. Reinhorn, 4/12/94, (PB94-204922, A09, MF-A02).
NCEER-94-0011 "The Northridge, California Earthquake of January 17, 1994: Performance of Gas Transmission Pipelines,"
by T.D. O'Rourke and M.C. Palmer, 5/16/94, (PB94-204989, A05, MF-A01). NCEER-94-0012 "Feasibility Study of Replacement Procedures and Earthquake Performance Related to Gas Transmission
Pipelines," by T.D. O'Rourke and M.C. Palmer, 5/25/94, (PB94-206638, A09, MF-A02). NCEER-94-0013 "Seismic Energy Based Fatigue Damage Analysis of Bridge Columns: Part II - Evaluation of Seismic
Demand," by G.A. Chang and J.B. Mander, 6/1/94, (PB95-18106, A08, MF-A02). NCEER-94-0014 "NCEER-Taisei Corporation Research Program on Sliding Seismic Isolation Systems for Bridges:
Experimental and Analytical Study of a System Consisting of Sliding Bearings and Fluid Restoring Force/Damping Devices," by P. Tsopelas and M.C. Constantinou, 6/13/94, (PB94-219144, A10, MF-A03).
NCEER-94-0015 "Generation of Hazard-Consistent Fragility Curves for Seismic Loss Estimation Studies," by H. Hwang and
J-R. Huo, 6/14/94, (PB95-181996, A09, MF-A02). NCEER-94-0016 "Seismic Study of Building Frames with Added Energy-Absorbing Devices," by W.S. Pong, C.S. Tsai and
G.C. Lee, 6/20/94, (PB94-219136, A10, A03). NCEER-94-0017 "Sliding Mode Control for Seismic-Excited Linear and Nonlinear Civil Engineering Structures," by J. Yang,
J. Wu, A. Agrawal and Z. Li, 6/21/94, (PB95-138483, A06, MF-A02). NCEER-94-0018 "3D-BASIS-TABS Version 2.0: Computer Program for Nonlinear Dynamic Analysis of Three Dimensional
Base Isolated Structures," by A.M. Reinhorn, S. Nagarajaiah, M.C. Constantinou, P. Tsopelas and R. Li, 6/22/94, (PB95-182176, A08, MF-A02).
NCEER-94-0019 "Proceedings of the International Workshop on Civil Infrastructure Systems: Application of Intelligent
Systems and Advanced Materials on Bridge Systems," Edited by G.C. Lee and K.C. Chang, 7/18/94, (PB95-252474, A20, MF-A04).
NCEER-94-0020 "Study of Seismic Isolation Systems for Computer Floors," by V. Lambrou and M.C. Constantinou, 7/19/94,
(PB95-138533, A10, MF-A03). NCEER-94-0021 "Proceedings of the U.S.-Italian Workshop on Guidelines for Seismic Evaluation and Rehabilitation of
Unreinforced Masonry Buildings," Edited by D.P. Abrams and G.M. Calvi, 7/20/94, (PB95-138749, A13, MF-A03).
NCEER-94-0022 "NCEER-Taisei Corporation Research Program on Sliding Seismic Isolation Systems for Bridges:
Experimental and Analytical Study of a System Consisting of Lubricated PTFE Sliding Bearings and Mild Steel Dampers," by P. Tsopelas and M.C. Constantinou, 7/22/94, (PB95-182184, A08, MF-A02).
NCEER-94-0023 “Development of Reliability-Based Design Criteria for Buildings Under Seismic Load,” by Y.K. Wen, H.
Hwang and M. Shinozuka, 8/1/94, (PB95-211934, A08, MF-A02). NCEER-94-0024 “Experimental Verification of Acceleration Feedback Control Strategies for an Active Tendon System,” by
S.J. Dyke, B.F. Spencer, Jr., P. Quast, M.K. Sain, D.C. Kaspari, Jr. and T.T. Soong, 8/29/94, (PB95-212320, A05, MF-A01).
NCEER-94-0025 “Seismic Retrofitting Manual for Highway Bridges,” Edited by I.G. Buckle and I.F. Friedland, published by
the Federal Highway Administration (PB95-212676, A15, MF-A03). NCEER-94-0026 “Proceedings from the Fifth U.S.-Japan Workshop on Earthquake Resistant Design of Lifeline Facilities and
Countermeasures Against Soil Liquefaction,” Edited by T.D. O’Rourke and M. Hamada, 11/7/94, (PB95-220802, A99, MF-E08).

Formerly the National Center for Earthquake Engineering Research
219
NCEER-95-0001 “Experimental and Analytical Investigation of Seismic Retrofit of Structures with Supplemental Damping: Part 1 - Fluid Viscous Damping Devices,” by A.M. Reinhorn, C. Li and M.C. Constantinou, 1/3/95, (PB95-266599, A09, MF-A02).
NCEER-95-0002 “Experimental and Analytical Study of Low-Cycle Fatigue Behavior of Semi-Rigid Top-And-Seat Angle
Connections,” by G. Pekcan, J.B. Mander and S.S. Chen, 1/5/95, (PB95-220042, A07, MF-A02). NCEER-95-0003 “NCEER-ATC Joint Study on Fragility of Buildings,” by T. Anagnos, C. Rojahn and A.S. Kiremidjian,
1/20/95, (PB95-220026, A06, MF-A02). NCEER-95-0004 “Nonlinear Control Algorithms for Peak Response Reduction,” by Z. Wu, T.T. Soong, V. Gattulli and R.C.
Lin, 2/16/95, (PB95-220349, A05, MF-A01). NCEER-95-0005 “Pipeline Replacement Feasibility Study: A Methodology for Minimizing Seismic and Corrosion Risks to
Underground Natural Gas Pipelines,” by R.T. Eguchi, H.A. Seligson and D.G. Honegger, 3/2/95, (PB95-252326, A06, MF-A02).
NCEER-95-0006 “Evaluation of Seismic Performance of an 11-Story Frame Building During the 1994 Northridge
Earthquake,” by F. Naeim, R. DiSulio, K. Benuska, A. Reinhorn and C. Li, to be published. NCEER-95-0007 “Prioritization of Bridges for Seismic Retrofitting,” by N. Basöz and A.S. Kiremidjian, 4/24/95, (PB95-
252300, A08, MF-A02). NCEER-95-0008 “Method for Developing Motion Damage Relationships for Reinforced Concrete Frames,” by A. Singhal and
A.S. Kiremidjian, 5/11/95, (PB95-266607, A06, MF-A02). NCEER-95-0009 “Experimental and Analytical Investigation of Seismic Retrofit of Structures with Supplemental Damping:
Part II - Friction Devices,” by C. Li and A.M. Reinhorn, 7/6/95, (PB96-128087, A11, MF-A03). NCEER-95-0010 “Experimental Performance and Analytical Study of a Non-Ductile Reinforced Concrete Frame Structure
Retrofitted with Elastomeric Spring Dampers,” by G. Pekcan, J.B. Mander and S.S. Chen, 7/14/95, (PB96-137161, A08, MF-A02).
NCEER-95-0011 “Development and Experimental Study of Semi-Active Fluid Damping Devices for Seismic Protection of
Structures,” by M.D. Symans and M.C. Constantinou, 8/3/95, (PB96-136940, A23, MF-A04). NCEER-95-0012 “Real-Time Structural Parameter Modification (RSPM): Development of Innervated Structures,” by Z.
Liang, M. Tong and G.C. Lee, 4/11/95, (PB96-137153, A06, MF-A01). NCEER-95-0013 “Experimental and Analytical Investigation of Seismic Retrofit of Structures with Supplemental Damping:
Part III - Viscous Damping Walls,” by A.M. Reinhorn and C. Li, 10/1/95, (PB96-176409, A11, MF-A03). NCEER-95-0014 “Seismic Fragility Analysis of Equipment and Structures in a Memphis Electric Substation,” by J-R. Huo and
H.H.M. Hwang, 8/10/95, (PB96-128087, A09, MF-A02). NCEER-95-0015 “The Hanshin-Awaji Earthquake of January 17, 1995: Performance of Lifelines,” Edited by M. Shinozuka,
11/3/95, (PB96-176383, A15, MF-A03). NCEER-95-0016 “Highway Culvert Performance During Earthquakes,” by T.L. Youd and C.J. Beckman, available as
NCEER-96-0015. NCEER-95-0017 “The Hanshin-Awaji Earthquake of January 17, 1995: Performance of Highway Bridges,” Edited by I.G.
Buckle, 12/1/95, to be published. NCEER-95-0018 “Modeling of Masonry Infill Panels for Structural Analysis,” by A.M. Reinhorn, A. Madan, R.E. Valles, Y.
Reichmann and J.B. Mander, 12/8/95, (PB97-110886, MF-A01, A06). NCEER-95-0019 “Optimal Polynomial Control for Linear and Nonlinear Structures,” by A.K. Agrawal and J.N. Yang,
12/11/95, (PB96-168737, A07, MF-A02).

Formerly the National Center for Earthquake Engineering Research
220
NCEER-95-0020 “Retrofit of Non-Ductile Reinforced Concrete Frames Using Friction Dampers,” by R.S. Rao, P. Gergely and R.N. White, 12/22/95, (PB97-133508, A10, MF-A02).
NCEER-95-0021 “Parametric Results for Seismic Response of Pile-Supported Bridge Bents,” by G. Mylonakis, A. Nikolaou
and G. Gazetas, 12/22/95, (PB97-100242, A12, MF-A03). NCEER-95-0022 “Kinematic Bending Moments in Seismically Stressed Piles,” by A. Nikolaou, G. Mylonakis and G. Gazetas,
12/23/95, (PB97-113914, MF-A03, A13). NCEER-96-0001 “Dynamic Response of Unreinforced Masonry Buildings with Flexible Diaphragms,” by A.C. Costley and
D.P. Abrams,” 10/10/96, (PB97-133573, MF-A03, A15). NCEER-96-0002 “State of the Art Review: Foundations and Retaining Structures,” by I. Po Lam, to be published. NCEER-96-0003 “Ductility of Rectangular Reinforced Concrete Bridge Columns with Moderate Confinement,” by N. Wehbe,
M. Saiidi, D. Sanders and B. Douglas, 11/7/96, (PB97-133557, A06, MF-A02). NCEER-96-0004 “Proceedings of the Long-Span Bridge Seismic Research Workshop,” edited by I.G. Buckle and I.M.
Friedland, to be published. NCEER-96-0005 “Establish Representative Pier Types for Comprehensive Study: Eastern United States,” by J. Kulicki and Z.
Prucz, 5/28/96, (PB98-119217, A07, MF-A02). NCEER-96-0006 “Establish Representative Pier Types for Comprehensive Study: Western United States,” by R. Imbsen, R.A.
Schamber and T.A. Osterkamp, 5/28/96, (PB98-118607, A07, MF-A02). NCEER-96-0007 “Nonlinear Control Techniques for Dynamical Systems with Uncertain Parameters,” by R.G. Ghanem and
M.I. Bujakov, 5/27/96, (PB97-100259, A17, MF-A03). NCEER-96-0008 “Seismic Evaluation of a 30-Year Old Non-Ductile Highway Bridge Pier and Its Retrofit,” by J.B. Mander,
B. Mahmoodzadegan, S. Bhadra and S.S. Chen, 5/31/96, (PB97-110902, MF-A03, A10). NCEER-96-0009 “Seismic Performance of a Model Reinforced Concrete Bridge Pier Before and After Retrofit,” by J.B.
Mander, J.H. Kim and C.A. Ligozio, 5/31/96, (PB97-110910, MF-A02, A10). NCEER-96-0010 “IDARC2D Version 4.0: A Computer Program for the Inelastic Damage Analysis of Buildings,” by R.E.
Valles, A.M. Reinhorn, S.K. Kunnath, C. Li and A. Madan, 6/3/96, (PB97-100234, A17, MF-A03). NCEER-96-0011 “Estimation of the Economic Impact of Multiple Lifeline Disruption: Memphis Light, Gas and Water
Division Case Study,” by S.E. Chang, H.A. Seligson and R.T. Eguchi, 8/16/96, (PB97-133490, A11, MF-A03).
NCEER-96-0012 “Proceedings from the Sixth Japan-U.S. Workshop on Earthquake Resistant Design of Lifeline Facilities and
Countermeasures Against Soil Liquefaction, Edited by M. Hamada and T. O’Rourke, 9/11/96, (PB97-133581, A99, MF-A06).
NCEER-96-0013 “Chemical Hazards, Mitigation and Preparedness in Areas of High Seismic Risk: A Methodology for
Estimating the Risk of Post-Earthquake Hazardous Materials Release,” by H.A. Seligson, R.T. Eguchi, K.J. Tierney and K. Richmond, 11/7/96, (PB97-133565, MF-A02, A08).
NCEER-96-0014 “Response of Steel Bridge Bearings to Reversed Cyclic Loading,” by J.B. Mander, D-K. Kim, S.S. Chen and
G.J. Premus, 11/13/96, (PB97-140735, A12, MF-A03). NCEER-96-0015 “Highway Culvert Performance During Past Earthquakes,” by T.L. Youd and C.J. Beckman, 11/25/96,
(PB97-133532, A06, MF-A01). NCEER-97-0001 “Evaluation, Prevention and Mitigation of Pounding Effects in Building Structures,” by R.E. Valles and
A.M. Reinhorn, 2/20/97, (PB97-159552, A14, MF-A03). NCEER-97-0002 “Seismic Design Criteria for Bridges and Other Highway Structures,” by C. Rojahn, R. Mayes, D.G.
Anderson, J. Clark, J.H. Hom, R.V. Nutt and M.J. O’Rourke, 4/30/97, (PB97-194658, A06, MF-A03).

Formerly the National Center for Earthquake Engineering Research
221
NCEER-97-0003 “Proceedings of the U.S.-Italian Workshop on Seismic Evaluation and Retrofit,” Edited by D.P. Abrams and
G.M. Calvi, 3/19/97, (PB97-194666, A13, MF-A03). NCEER-97-0004 "Investigation of Seismic Response of Buildings with Linear and Nonlinear Fluid Viscous Dampers," by
A.A. Seleemah and M.C. Constantinou, 5/21/97, (PB98-109002, A15, MF-A03). NCEER-97-0005 "Proceedings of the Workshop on Earthquake Engineering Frontiers in Transportation Facilities," edited by
G.C. Lee and I.M. Friedland, 8/29/97, (PB98-128911, A25, MR-A04). NCEER-97-0006 "Cumulative Seismic Damage of Reinforced Concrete Bridge Piers," by S.K. Kunnath, A. El-Bahy, A.
Taylor and W. Stone, 9/2/97, (PB98-108814, A11, MF-A03). NCEER-97-0007 "Structural Details to Accommodate Seismic Movements of Highway Bridges and Retaining Walls," by R.A.
Imbsen, R.A. Schamber, E. Thorkildsen, A. Kartoum, B.T. Martin, T.N. Rosser and J.M. Kulicki, 9/3/97, (PB98-108996, A09, MF-A02).
NCEER-97-0008 "A Method for Earthquake Motion-Damage Relationships with Application to Reinforced Concrete Frames,"
by A. Singhal and A.S. Kiremidjian, 9/10/97, (PB98-108988, A13, MF-A03). NCEER-97-0009 "Seismic Analysis and Design of Bridge Abutments Considering Sliding and Rotation," by K. Fishman and
R. Richards, Jr., 9/15/97, (PB98-108897, A06, MF-A02). NCEER-97-0010 "Proceedings of the FHWA/NCEER Workshop on the National Representation of Seismic Ground Motion
for New and Existing Highway Facilities," edited by I.M. Friedland, M.S. Power and R.L. Mayes, 9/22/97, (PB98-128903, A21, MF-A04).
NCEER-97-0011 "Seismic Analysis for Design or Retrofit of Gravity Bridge Abutments," by K.L. Fishman, R. Richards, Jr.
and R.C. Divito, 10/2/97, (PB98-128937, A08, MF-A02). NCEER-97-0012 "Evaluation of Simplified Methods of Analysis for Yielding Structures," by P. Tsopelas, M.C. Constantinou,
C.A. Kircher and A.S. Whittaker, 10/31/97, (PB98-128929, A10, MF-A03). NCEER-97-0013 "Seismic Design of Bridge Columns Based on Control and Repairability of Damage," by C-T. Cheng and
J.B. Mander, 12/8/97, (PB98-144249, A11, MF-A03). NCEER-97-0014 "Seismic Resistance of Bridge Piers Based on Damage Avoidance Design," by J.B. Mander and C-T. Cheng,
12/10/97, (PB98-144223, A09, MF-A02). NCEER-97-0015 “Seismic Response of Nominally Symmetric Systems with Strength Uncertainty,” by S. Balopoulou and M.
Grigoriu, 12/23/97, (PB98-153422, A11, MF-A03). NCEER-97-0016 “Evaluation of Seismic Retrofit Methods for Reinforced Concrete Bridge Columns,” by T.J. Wipf, F.W.
Klaiber and F.M. Russo, 12/28/97, (PB98-144215, A12, MF-A03). NCEER-97-0017 “Seismic Fragility of Existing Conventional Reinforced Concrete Highway Bridges,” by C.L. Mullen and
A.S. Cakmak, 12/30/97, (PB98-153406, A08, MF-A02). NCEER-97-0018 “Loss Asssessment of Memphis Buildings,” edited by D.P. Abrams and M. Shinozuka, 12/31/97, (PB98-
144231, A13, MF-A03). NCEER-97-0019 “Seismic Evaluation of Frames with Infill Walls Using Quasi-static Experiments,” by K.M. Mosalam, R.N.
White and P. Gergely, 12/31/97, (PB98-153455, A07, MF-A02). NCEER-97-0020 “Seismic Evaluation of Frames with Infill Walls Using Pseudo-dynamic Experiments,” by K.M. Mosalam,
R.N. White and P. Gergely, 12/31/97, (PB98-153430, A07, MF-A02). NCEER-97-0021 “Computational Strategies for Frames with Infill Walls: Discrete and Smeared Crack Analyses and Seismic
Fragility,” by K.M. Mosalam, R.N. White and P. Gergely, 12/31/97, (PB98-153414, A10, MF-A02).

Formerly the National Center for Earthquake Engineering Research
222
NCEER-97-0022 “Proceedings of the NCEER Workshop on Evaluation of Liquefaction Resistance of Soils,” edited by T.L. Youd and I.M. Idriss, 12/31/97, (PB98-155617, A15, MF-A03).
MCEER-98-0001 “Extraction of Nonlinear Hysteretic Properties of Seismically Isolated Bridges from Quick-Release Field
Tests,” by Q. Chen, B.M. Douglas, E.M. Maragakis and I.G. Buckle, 5/26/98, (PB99-118838, A06, MF- A01).
MCEER-98-0002 “Methodologies for Evaluating the Importance of Highway Bridges,” by A. Thomas, S. Eshenaur and J.
Kulicki, 5/29/98, (PB99-118846, A10, MF-A02). MCEER-98-0003 “Capacity Design of Bridge Piers and the Analysis of Overstrength,” by J.B. Mander, A. Dutta and P. Goel,
6/1/98, (PB99-118853, A09, MF-A02). MCEER-98-0004 “Evaluation of Bridge Damage Data from the Loma Prieta and Northridge, California Earthquakes,” by N.
Basoz and A. Kiremidjian, 6/2/98, (PB99-118861, A15, MF-A03). MCEER-98-0005 “Screening Guide for Rapid Assessment of Liquefaction Hazard at Highway Bridge Sites,” by T. L. Youd,
6/16/98, (PB99-118879, A06, not available on microfiche). MCEER-98-0006 “Structural Steel and Steel/Concrete Interface Details for Bridges,” by P. Ritchie, N. Kauhl and J. Kulicki,
7/13/98, (PB99-118945, A06, MF-A01). MCEER-98-0007 “Capacity Design and Fatigue Analysis of Confined Concrete Columns,” by A. Dutta and J.B. Mander,
7/14/98, (PB99-118960, A14, MF-A03). MCEER-98-0008 “Proceedings of the Workshop on Performance Criteria for Telecommunication Services Under Earthquake
Conditions,” edited by A.J. Schiff, 7/15/98, (PB99-118952, A08, MF-A02). MCEER-98-0009 “Fatigue Analysis of Unconfined Concrete Columns,” by J.B. Mander, A. Dutta and J.H. Kim, 9/12/98,
(PB99-123655, A10, MF-A02). MCEER-98-0010 “Centrifuge Modeling of Cyclic Lateral Response of Pile-Cap Systems and Seat-Type Abutments in Dry
Sands,” by A.D. Gadre and R. Dobry, 10/2/98, (PB99-123606, A13, MF-A03). MCEER-98-0011 “IDARC-BRIDGE: A Computational Platform for Seismic Damage Assessment of Bridge Structures,” by
A.M. Reinhorn, V. Simeonov, G. Mylonakis and Y. Reichman, 10/2/98, (PB99-162919, A15, MF-A03). MCEER-98-0012 “Experimental Investigation of the Dynamic Response of Two Bridges Before and After Retrofitting with
Elastomeric Bearings,” by D.A. Wendichansky, S.S. Chen and J.B. Mander, 10/2/98, (PB99-162927, A15, MF-A03).
MCEER-98-0013 “Design Procedures for Hinge Restrainers and Hinge Sear Width for Multiple-Frame Bridges,” by R. Des
Roches and G.L. Fenves, 11/3/98, (PB99-140477, A13, MF-A03). MCEER-98-0014 “Response Modification Factors for Seismically Isolated Bridges,” by M.C. Constantinou and J.K. Quarshie,
11/3/98, (PB99-140485, A14, MF-A03). MCEER-98-0015 “Proceedings of the U.S.-Italy Workshop on Seismic Protective Systems for Bridges,” edited by I.M. Friedland
and M.C. Constantinou, 11/3/98, (PB2000-101711, A22, MF-A04). MCEER-98-0016 “Appropriate Seismic Reliability for Critical Equipment Systems: Recommendations Based on Regional
Analysis of Financial and Life Loss,” by K. Porter, C. Scawthorn, C. Taylor and N. Blais, 11/10/98, (PB99-157265, A08, MF-A02).
MCEER-98-0017 “Proceedings of the U.S. Japan Joint Seminar on Civil Infrastructure Systems Research,” edited by M.
Shinozuka and A. Rose, 11/12/98, (PB99-156713, A16, MF-A03). MCEER-98-0018 “Modeling of Pile Footings and Drilled Shafts for Seismic Design,” by I. PoLam, M. Kapuskar and D.
Chaudhuri, 12/21/98, (PB99-157257, A09, MF-A02).
Formerly the National Center for Earthquake Engineering Research
223
MCEER-99-0001 "Seismic Evaluation of a Masonry Infilled Reinforced Concrete Frame by Pseudodynamic Testing," by S.G. Buonopane and R.N. White, 2/16/99, (PB99-162851, A09, MF-A02).
MCEER-99-0002 "Response History Analysis of Structures with Seismic Isolation and Energy Dissipation Systems:
Verification Examples for Program SAP2000," by J. Scheller and M.C. Constantinou, 2/22/99, (PB99-162869, A08, MF-A02).
MCEER-99-0003 "Experimental Study on the Seismic Design and Retrofit of Bridge Columns Including Axial Load Effects,"
by A. Dutta, T. Kokorina and J.B. Mander, 2/22/99, (PB99-162877, A09, MF-A02). MCEER-99-0004 "Experimental Study of Bridge Elastomeric and Other Isolation and Energy Dissipation Systems with
Emphasis on Uplift Prevention and High Velocity Near-source Seismic Excitation," by A. Kasalanati and M. C. Constantinou, 2/26/99, (PB99-162885, A12, MF-A03).
MCEER-99-0005 "Truss Modeling of Reinforced Concrete Shear-flexure Behavior," by J.H. Kim and J.B. Mander, 3/8/99,
(PB99-163693, A12, MF-A03). MCEER-99-0006 "Experimental Investigation and Computational Modeling of Seismic Response of a 1:4 Scale Model Steel
Structure with a Load Balancing Supplemental Damping System," by G. Pekcan, J.B. Mander and S.S. Chen, 4/2/99, (PB99-162893, A11, MF-A03).
MCEER-99-0007 "Effect of Vertical Ground Motions on the Structural Response of Highway Bridges," by M.R. Button, C.J.
Cronin and R.L. Mayes, 4/10/99, (PB2000-101411, A10, MF-A03). MCEER-99-0008 "Seismic Reliability Assessment of Critical Facilities: A Handbook, Supporting Documentation, and Model
Code Provisions," by G.S. Johnson, R.E. Sheppard, M.D. Quilici, S.J. Eder and C.R. Scawthorn, 4/12/99, (PB2000-101701, A18, MF-A04).
MCEER-99-0009 "Impact Assessment of Selected MCEER Highway Project Research on the Seismic Design of Highway
Structures," by C. Rojahn, R. Mayes, D.G. Anderson, J.H. Clark, D'Appolonia Engineering, S. Gloyd and R.V. Nutt, 4/14/99, (PB99-162901, A10, MF-A02).
MCEER-99-0010 "Site Factors and Site Categories in Seismic Codes," by R. Dobry, R. Ramos and M.S. Power, 7/19/99,
(PB2000-101705, A08, MF-A02). MCEER-99-0011 "Restrainer Design Procedures for Multi-Span Simply-Supported Bridges," by M.J. Randall, M. Saiidi, E.
Maragakis and T. Isakovic, 7/20/99, (PB2000-101702, A10, MF-A02). MCEER-99-0012 "Property Modification Factors for Seismic Isolation Bearings," by M.C. Constantinou, P. Tsopelas, A.
Kasalanati and E. Wolff, 7/20/99, (PB2000-103387, A11, MF-A03). MCEER-99-0013 "Critical Seismic Issues for Existing Steel Bridges," by P. Ritchie, N. Kauhl and J. Kulicki, 7/20/99,
(PB2000-101697, A09, MF-A02). MCEER-99-0014 "Nonstructural Damage Database," by A. Kao, T.T. Soong and A. Vender, 7/24/99, (PB2000-101407, A06,
MF-A01). MCEER-99-0015 "Guide to Remedial Measures for Liquefaction Mitigation at Existing Highway Bridge Sites," by H.G.
Cooke and J. K. Mitchell, 7/26/99, (PB2000-101703, A11, MF-A03). MCEER-99-0016 "Proceedings of the MCEER Workshop on Ground Motion Methodologies for the Eastern United States,"
edited by N. Abrahamson and A. Becker, 8/11/99, (PB2000-103385, A07, MF-A02). MCEER-99-0017 "Quindío, Colombia Earthquake of January 25, 1999: Reconnaissance Report," by A.P. Asfura and P.J.
Flores, 10/4/99, (PB2000-106893, A06, MF-A01). MCEER-99-0018 "Hysteretic Models for Cyclic Behavior of Deteriorating Inelastic Structures," by M.V. Sivaselvan and A.M.
Reinhorn, 11/5/99, (PB2000-103386, A08, MF-A02).
Formerly the National Center for Earthquake Engineering Research
224
MCEER-99-0019 "Proceedings of the 7th U.S.- Japan Workshop on Earthquake Resistant Design of Lifeline Facilities and Countermeasures Against Soil Liquefaction," edited by T.D. O'Rourke, J.P. Bardet and M. Hamada, 11/19/99, (PB2000-103354, A99, MF-A06).
MCEER-99-0020 "Development of Measurement Capability for Micro-Vibration Evaluations with Application to Chip
Fabrication Facilities," by G.C. Lee, Z. Liang, J.W. Song, J.D. Shen and W.C. Liu, 12/1/99, (PB2000-105993, A08, MF-A02).
MCEER-99-0021 "Design and Retrofit Methodology for Building Structures with Supplemental Energy Dissipating Systems,"
by G. Pekcan, J.B. Mander and S.S. Chen, 12/31/99, (PB2000-105994, A11, MF-A03). MCEER-00-0001 "The Marmara, Turkey Earthquake of August 17, 1999: Reconnaissance Report," edited by C. Scawthorn;
with major contributions by M. Bruneau, R. Eguchi, T. Holzer, G. Johnson, J. Mander, J. Mitchell, W. Mitchell, A. Papageorgiou, C. Scaethorn, and G. Webb, 3/23/00, (PB2000-106200, A11, MF-A03).
MCEER-00-0002 "Proceedings of the MCEER Workshop for Seismic Hazard Mitigation of Health Care Facilities," edited by
G.C. Lee, M. Ettouney, M. Grigoriu, J. Hauer and J. Nigg, 3/29/00, (PB2000-106892, A08, MF-A02). MCEER-00-0003 "The Chi-Chi, Taiwan Earthquake of September 21, 1999: Reconnaissance Report," edited by G.C. Lee and
C.H. Loh, with major contributions by G.C. Lee, M. Bruneau, I.G. Buckle, S.E. Chang, P.J. Flores, T.D. O'Rourke, M. Shinozuka, T.T. Soong, C-H. Loh, K-C. Chang, Z-J. Chen, J-S. Hwang, M-L. Lin, G-Y. Liu, K-C. Tsai, G.C. Yao and C-L. Yen, 4/30/00, (PB2001-100980, A10, MF-A02).
MCEER-00-0004 "Seismic Retrofit of End-Sway Frames of Steel Deck-Truss Bridges with a Supplemental Tendon System:
Experimental and Analytical Investigation," by G. Pekcan, J.B. Mander and S.S. Chen, 7/1/00, (PB2001-100982, A10, MF-A02).
MCEER-00-0005 "Sliding Fragility of Unrestrained Equipment in Critical Facilities," by W.H. Chong and T.T. Soong, 7/5/00,
(PB2001-100983, A08, MF-A02). MCEER-00-0006 "Seismic Response of Reinforced Concrete Bridge Pier Walls in the Weak Direction," by N. Abo-Shadi, M.
Saiidi and D. Sanders, 7/17/00, (PB2001-100981, A17, MF-A03). MCEER-00-0007 "Low-Cycle Fatigue Behavior of Longitudinal Reinforcement in Reinforced Concrete Bridge Columns," by
J. Brown and S.K. Kunnath, 7/23/00, (PB2001-104392, A08, MF-A02). MCEER-00-0008 "Soil Structure Interaction of Bridges for Seismic Analysis," I. PoLam and H. Law, 9/25/00, (PB2001-
105397, A08, MF-A02). MCEER-00-0009 "Proceedings of the First MCEER Workshop on Mitigation of Earthquake Disaster by Advanced
Technologies (MEDAT-1), edited by M. Shinozuka, D.J. Inman and T.D. O'Rourke, 11/10/00, (PB2001-105399, A14, MF-A03).
MCEER-00-0010 "Development and Evaluation of Simplified Procedures for Analysis and Design of Buildings with Passive
Energy Dissipation Systems," by O.M. Ramirez, M.C. Constantinou, C.A. Kircher, A.S. Whittaker, M.W. Johnson, J.D. Gomez and C. Chrysostomou, 11/16/01, (PB2001-105523, A23, MF-A04).
MCEER-00-0011 "Dynamic Soil-Foundation-Structure Interaction Analyses of Large Caissons," by C-Y. Chang, C-M. Mok,
Z-L. Wang, R. Settgast, F. Waggoner, M.A. Ketchum, H.M. Gonnermann and C-C. Chin, 12/30/00, (PB2001-104373, A07, MF-A02).
MCEER-00-0012 "Experimental Evaluation of Seismic Performance of Bridge Restrainers," by A.G. Vlassis, E.M. Maragakis
and M. Saiid Saiidi, 12/30/00, (PB2001-104354, A09, MF-A02). MCEER-00-0013 "Effect of Spatial Variation of Ground Motion on Highway Structures," by M. Shinozuka, V. Saxena and G.
Deodatis, 12/31/00, (PB2001-108755, A13, MF-A03). MCEER-00-0014 "A Risk-Based Methodology for Assessing the Seismic Performance of Highway Systems," by S.D. Werner,
C.E. Taylor, J.E. Moore, II, J.S. Walton and S. Cho, 12/31/00, (PB2001-108756, A14, MF-A03).

Formerly the National Center for Earthquake Engineering Research
225
MCEER-01-0001 “Experimental Investigation of P-Delta Effects to Collapse During Earthquakes,” by D. Vian and M. Bruneau, 6/25/01, (PB2002-100534, A17, MF-A03).
MCEER-01-0002 “Proceedings of the Second MCEER Workshop on Mitigation of Earthquake Disaster by Advanced
Technologies (MEDAT-2),” edited by M. Bruneau and D.J. Inman, 7/23/01, (PB2002-100434, A16, MF-A03).
MCEER-01-0003 “Sensitivity Analysis of Dynamic Systems Subjected to Seismic Loads,” by C. Roth and M. Grigoriu,
9/18/01, (PB2003-100884, A12, MF-A03). MCEER-01-0004 “Overcoming Obstacles to Implementing Earthquake Hazard Mitigation Policies: Stage 1 Report,” by D.J.
Alesch and W.J. Petak, 12/17/01, (PB2002-107949, A07, MF-A02). MCEER-01-0005 “Updating Real-Time Earthquake Loss Estimates: Methods, Problems and Insights,” by C.E. Taylor, S.E.
Chang and R.T. Eguchi, 12/17/01, (PB2002-107948, A05, MF-A01). MCEER-01-0006 “Experimental Investigation and Retrofit of Steel Pile Foundations and Pile Bents Under Cyclic Lateral
Loadings,” by A. Shama, J. Mander, B. Blabac and S. Chen, 12/31/01, (PB2002-107950, A13, MF-A03). MCEER-02-0001 “Assessment of Performance of Bolu Viaduct in the 1999 Duzce Earthquake in Turkey” by P.C. Roussis,
M.C. Constantinou, M. Erdik, E. Durukal and M. Dicleli, 5/8/02, (PB2003-100883, A08, MF-A02). MCEER-02-0002 “Seismic Behavior of Rail Counterweight Systems of Elevators in Buildings,” by M.P. Singh, Rildova and
L.E. Suarez, 5/27/02. (PB2003-100882, A11, MF-A03). MCEER-02-0003 “Development of Analysis and Design Procedures for Spread Footings,” by G. Mylonakis, G. Gazetas, S.
Nikolaou and A. Chauncey, 10/02/02, (PB2004-101636, A13, MF-A03, CD-A13). MCEER-02-0004 “Bare-Earth Algorithms for Use with SAR and LIDAR Digital Elevation Models,” by C.K. Huyck, R.T.
Eguchi and B. Houshmand, 10/16/02, (PB2004-101637, A07, CD-A07). MCEER-02-0005 “Review of Energy Dissipation of Compression Members in Concentrically Braced Frames,” by K.Lee and
M. Bruneau, 10/18/02, (PB2004-101638, A10, CD-A10). MCEER-03-0001 “Experimental Investigation of Light-Gauge Steel Plate Shear Walls for the Seismic Retrofit of Buildings”
by J. Berman and M. Bruneau, 5/2/03, (PB2004-101622, A10, MF-A03, CD-A10).
MCEER-03-0002 “Statistical Analysis of Fragility Curves,” by M. Shinozuka, M.Q. Feng, H. Kim, T. Uzawa and T. Ueda, 6/16/03, (PB2004-101849, A09, CD-A09).
MCEER-03-0003 “Proceedings of the Eighth U.S.-Japan Workshop on Earthquake Resistant Design f Lifeline Facilities and
Countermeasures Against Liquefaction,” edited by M. Hamada, J.P. Bardet and T.D. O’Rourke, 6/30/03, (PB2004-104386, A99, CD-A99).
MCEER-03-0004 “Proceedings of the PRC-US Workshop on Seismic Analysis and Design of Special Bridges,” edited by L.C.
Fan and G.C. Lee, 7/15/03, (PB2004-104387, A14, CD-A14). MCEER-03-0005 “Urban Disaster Recovery: A Framework and Simulation Model,” by S.B. Miles and S.E. Chang, 7/25/03,
(PB2004-104388, A07, CD-A07). MCEER-03-0006 “Behavior of Underground Piping Joints Due to Static and Dynamic Loading,” by R.D. Meis, M. Maragakis
and R. Siddharthan, 11/17/03, (PB2005-102194, A13, MF-A03, CD-A00). MCEER-03-0007 “Seismic Vulnerability of Timber Bridges and Timber Substructures,” by A.A. Shama, J.B. Mander, I.M.
Friedland and D.R. Allicock, 12/15/03. MCEER-04-0001 “Experimental Study of Seismic Isolation Systems with Emphasis on Secondary System Response and
Verification of Accuracy of Dynamic Response History Analysis Methods,” by E. Wolff and M. Constantinou, 1/16/04 (PB2005-102195, A99, MF-E08, CD-A00).

Formerly the National Center for Earthquake Engineering Research
226
MCEER-04-0002 “Tension, Compression and Cyclic Testing of Engineered Cementitious Composite Materials,” by K. Kesner and S.L. Billington, 3/1/04, (PB2005-102196, A08, CD-A08).
MCEER-04-0003 “Cyclic Testing of Braces Laterally Restrained by Steel Studs to Enhance Performance During Earthquakes,”
by O.C. Celik, J.W. Berman and M. Bruneau, 3/16/04, (PB2005-102197, A13, MF-A03, CD-A00). MCEER-04-0004 “Methodologies for Post Earthquake Building Damage Detection Using SAR and Optical Remote Sensing:
Application to the August 17, 1999 Marmara, Turkey Earthquake,” by C.K. Huyck, B.J. Adams, S. Cho, R.T. Eguchi, B. Mansouri and B. Houshmand, 6/15/04, (PB2005-104888, A10, CD-A00).
MCEER-04-0005 “Nonlinear Structural Analysis Towards Collapse Simulation: A Dynamical Systems Approach,” by M.V.
Sivaselvan and A.M. Reinhorn, 6/16/04, (PB2005-104889, A11, MF-A03, CD-A00). MCEER-04-0006 “Proceedings of the Second PRC-US Workshop on Seismic Analysis and Design of Special Bridges,” edited
by G.C. Lee and L.C. Fan, 6/25/04, (PB2005-104890, A16, CD-A00). MCEER-04-0007 “Seismic Vulnerability Evaluation of Axially Loaded Steel Built-up Laced Members,” by K. Lee and M.
Bruneau, 6/30/04, (PB2005-104891, A16, CD-A00). MCEER-04-0008 “Evaluation of Accuracy of Simplified Methods of Analysis and Design of Buildings with Damping Systems
for Near-Fault and for Soft-Soil Seismic Motions,” by E.A. Pavlou and M.C. Constantinou, 8/16/04, (PB2005-104892, A08, MF-A02, CD-A00).
MCEER-04-0009 “Assessment of Geotechnical Issues in Acute Care Facilities in California,” by M. Lew, T.D. O’Rourke, R.
Dobry and M. Koch, 9/15/04, (PB2005-104893, A08, CD-A00). MCEER-04-0010 “Scissor-Jack-Damper Energy Dissipation System,” by A.N. Sigaher-Boyle and M.C. Constantinou, 12/1/04. MCEER-04-0011 “Seismic Retrofit of Bridge Steel Truss Piers Using a Controlled Rocking Approach,” by M. Pollino and M.
Bruneau, 12/20/04. MCEER-05-0001 “Experimental and Analytical Studies of Structures Seismically Isolated with an Uplift-Restraint Isolation
System,” by P.C. Roussis and M.C. Constantinou, 1/10/05. MCEER-05-0002 “A Versatile Experimentation Model for Study of Structures Near Collapse Applied to Seismic Evaluation of
Irregular Structures,” by D. Kusumastuti, A.M. Reinhorn and A. Rutenberg, 3/31/05. MCEER-05-0003 “Proceedings of the Third PRC-US Workshop on Seismic Analysis and Design of Special Bridges,” edited
by L.C. Fan and G.C. Lee, 4/20/05. MCEER-05-0004 “Approaches for the Seismic Retrofit of Braced Steel Bridge Piers and Proof-of-Concept Testing of an
Eccentrically Braced Frame with Tubular Link,” by J.W. Berman and M. Bruneau, 4/21/05. MCEER-05-0005 “Simulation of Strong Ground Motions for Seismic Fragility Evaluation of Nonstructural Components in
Hospitals,” by A. Wanitkorkul and A. Filiatrault, 5/26/05. MCEER-05-0006 “Seismic Safety in California Hospitals: Assessing an Attempt to Accelerate the Replacement or Seismic
Retrofit of Older Hospital Facilities,” by D.J. Alesch, L.A. Arendt and W.J. Petak, 6/6/05. MCEER-05-0007 “Development of Seismic Strengthening and Retrofit Strategies for Critical Facilities Using Engineered
Cementitious Composite Materials,” by K. Kesner and S.L. Billington, 8/29/05. MCEER-05-0008 “Experimental and Analytical Studies of Base Isolation Systems for Seismic Protection of Power
Transformers,” by N. Murota, M.Q. Feng and G-Y. Liu, 9/30/05.


University at Buffalo The State University of New York
University at Buffalo, State University of New York
Red Jacket Quadrangle Buffalo, New York 14261
Phone: (716) 645-3391 Fax: (716) 645-3399
E-mail: [email protected] WWW Site http://mceer.buffalo.edu
ISSN 1520-295X