Embed Size (px)
Citation preview

Journal of Geoscience and Environment Protection, 2015, *, ** Published Online **** 2015 in SciRes. http://www.scirp.org/journal/gep http://dx.doi.org/10.4236/gep.2015.*****
How to cite this paper: Wongsa, S. (2015) Experiment and Simulation 0n Embankment Breach. Journal of Geoscience and Environment, *, **-**. http://dx.doi.org/10.4236/gep.2015.*****
Experiment and Simulation 0n Earthen Em-bankment Breach
Sanit Wongsa1* 1Department of Civil Technology Education, King Mongkut’s University of Technology Thonburi (KMUTT),
Bangkok, Thailand
Email: *[email protected]
Received **** 2015
Abstract
Many studies of earthen embankment failure from overtopping flow have been conducted in var-
ious aspects. Most of them focused on the mechanism of breach, depth and width of erosion, and
breach hydrograph. The studied results as obtained either from both physical and numerical
modelling and/or coupling techniques. The aim of this research is to study the effect of breach
mechanism a physical hydraulic model under three types (overtopping, beneath structure and
piping hole). Fixed embankment slopes, with scale 1:8.5 were employed in this study. It was found
that the piping hole case at the toe of embankment was the most severe damage. The iRIC Nays2D
numerical model shows a performance of simulated results in both water flow and breach mor-
phological characteristics, therefore, indicating that the model simulation is reasonable
Keywords
Embankment breach; Characteristics of Failure; Overtopping; Beneath Structure; Piping Hole
1. Introduction
Earthen embankments, including dikes and dams, are of large benefit to people all over the world. Most of the
earthen embankments were built up of cohesive soil and/or impervious soil. In the case of flood protection, per-
manent or temporality embankments were often used for protecting restricted area from a flood water level of
some magnitude. However, as flood disaster is a natural phenomenon which is unpredictable, sometime, the
flood level might be higher than the embankment height and overtopping flow would then occur. However, em-
bankments could also give human lives and properties high risks to some extend for their failures due to over-
topping, piping and other factors. The result of overtopping flow is the erosion on the embankment surface and
the scour at the toe. No matter how the embankment was compacted well at the construction phase, gradual de-
creases in its strength due to weathering effects and negligence of proper maintenance and increase in soil
moisture during flood event were unavoidable. These two effects became the prominent causes of the embank-
ment failure.
*Corresponding author.

S. Wongsa
2
Physical model is a useful and popular tool to investigate the breaching process in the embankment and has been
applied by the former researchers ([1], [2]) in the laboratory, however, the scale limitations increase the uncer-
tainty of the breaching development and the result distortions have been generated. In the meantime, researchers
use prototype data analyses and conduct the real embankment breach tests in the field to get insights into the
mechanism of breach development. But the data collected from prototype are usually not complete.
Severity of the embankment breach depended also on the overtopping flow discharge. In the study of cohesive
embankment breach by many researchers ([3], [4], [5]), it was indicated that breach mechanism consists of 2
processes, the surface erosion and the headcut erosion. The width of the breach was assumed to be dynamically
controlled by two parameters; the critical depth at the entrance to the breach channel and the stability slope of
the embankment materials. The breach width, as expanding on both sides, would form a trapezoidal section.
This concept of breach channel development has been adopted for formulating most of numerical models avail-
able presently. Even though inconsistency with real events when applied to the cases where breach location oc-
curred near uneroded wall of a hydraulic structure. Examples of such embankment breach included the failure
Bang Chom Sri regulator in Thailand [6]. Many comparative studies on the embankment failure which occurred
in laboratory and real embankment scale breach by numerical model [7], [8]. It was found that under the same
overtopping flow conditions, the embankment erosion which occurred near the regulator was compared well.
Hence, it is the purpose of this study to investigate the embankment breach beneath hydraulic structures from a
physical model in which the breaching under three different condition. The results may be used for developing
the guidelines for protecting hydraulic structures from failures due to embankment breaching and flood protec-
tion. The observed data can also be analyzed for using in the development and validation of a numerical model
for simulating the embankment breaching process.
2. Material and Methods
2.1. Experiment Setup
Figure 1. Experiments setup flume, embankment and instruments.
Table 1. Properties soil mixture used for the Experiment.
Soil Properties
Items Values Items Values
Specific Gravity, Gs 2.87 Friction Angle, 17
Liquid Limit, LL% 51 Cohesion, c 17
Plastic Limit, PL% 24 Total Weight of Soil 14.7
Plastic Index, PI 27 Initial Void Ratio 0.89
Cc 29.7 Initial Coeff. of Permeability 5.1x10⁻⁶
Cu 2.6 Type SW-SC
The re-circulating flow basin, as shown in Figure 1, 3 types of experiments, (overtopping, beneath structure and
piping hole)were conducted in the flume of 15.50 m x 1.50 m x 1.50m of King Mongkut’s University of Tech-
nology Thonburi (KMUTT), Thailand. The discharge that can be supplied at 4 constant discharges of 4.14, 7.78,
Concrete
Embankment
Regulator
Tank
Test basin
S. Wongsa
3
11.59 and 16.48 l/s, control flow discharge by using 4 pumps. Two sidewall of the flume were made up of con-
crete block, and the transit zone was built with gravel and measured flow discharge by V-notch weir.
The embankments are built on non-erodible flume bed, 0.48m thick of soil mixture (SW-SC). In order to know
the material properties, several standard geotechnical tests were performed on the soils and on the mixtures (Ta-
ble 1), with the average grain size and density were 1.70 mm, and 14.70 kN/m3, respectively. Before the start of
each experiment, the earthen embankment will be soaked for 2 hours. The surface erosion began immediately
after the embankment overtopped. Two video cameras were used for recording the breaching process.
2.2. iRIC Model
The iRIC Nay2D model has been used for simulate earthen embankment breach and its morphology. The shal-
low water equation of 2-D unsteady flow and sediment transport to calculate for water flow and morpodynamics
of embankment breach, respectively [9].
3. Results and Discussion
3.1. Overtopping Case
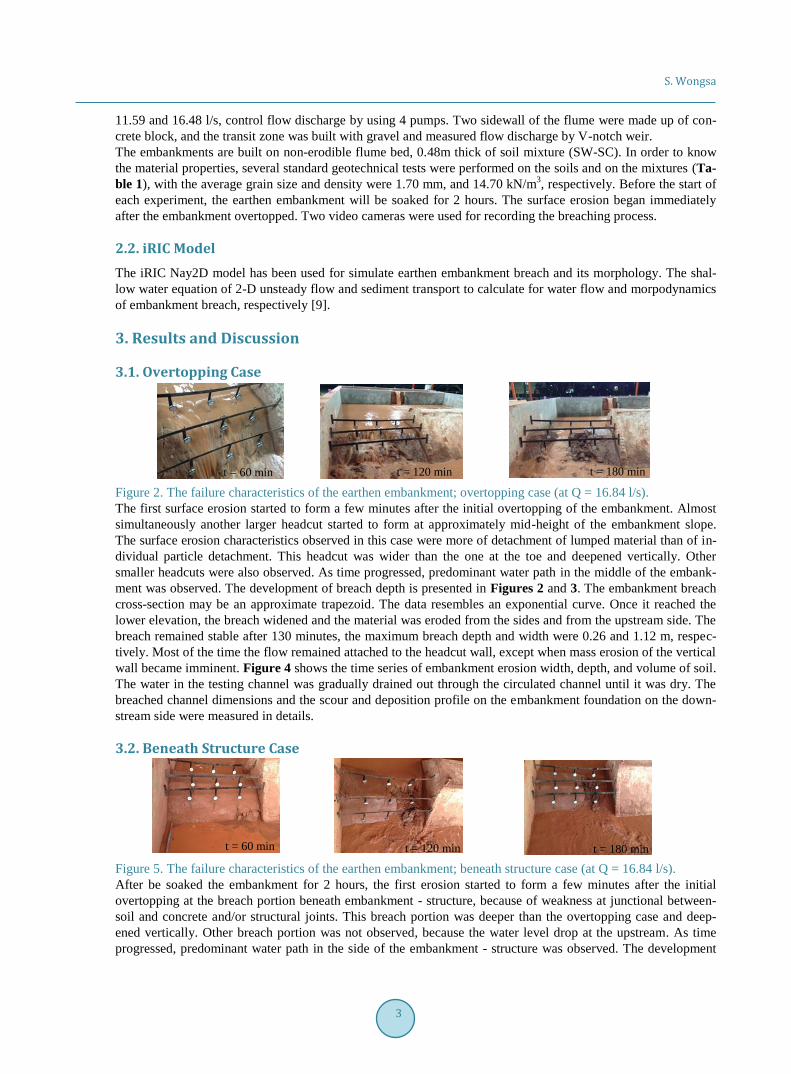
Figure 2. The failure characteristics of the earthen embankment; overtopping case (at Q = 16.84 l/s).
The first surface erosion started to form a few minutes after the initial overtopping of the embankment. Almost
simultaneously another larger headcut started to form at approximately mid-height of the embankment slope.
The surface erosion characteristics observed in this case were more of detachment of lumped material than of in-
dividual particle detachment. This headcut was wider than the one at the toe and deepened vertically. Other
smaller headcuts were also observed. As time progressed, predominant water path in the middle of the embank-
ment was observed. The development of breach depth is presented in Figures 2 and 3. The embankment breach
cross-section may be an approximate trapezoid. The data resembles an exponential curve. Once it reached the
lower elevation, the breach widened and the material was eroded from the sides and from the upstream side. The
breach remained stable after 130 minutes, the maximum breach depth and width were 0.26 and 1.12 m, respec-
tively. Most of the time the flow remained attached to the headcut wall, except when mass erosion of the vertical
wall became imminent. Figure 4 shows the time series of embankment erosion width, depth, and volume of soil.
The water in the testing channel was gradually drained out through the circulated channel until it was dry. The
breached channel dimensions and the scour and deposition profile on the embankment foundation on the down-
stream side were measured in details.
3.2. Beneath Structure Case
Figure 5. The failure characteristics of the earthen embankment; beneath structure case (at Q = 16.84 l/s).
After be soaked the embankment for 2 hours, the first erosion started to form a few minutes after the initial
overtopping at the breach portion beneath embankment - structure, because of weakness at junctional between-
soil and concrete and/or structural joints. This breach portion was deeper than the overtopping case and deep-
ened vertically. Other breach portion was not observed, because the water level drop at the upstream. As time
progressed, predominant water path in the side of the embankment - structure was observed. The development
t = 60 min t = 120 min
t = 60 min t = 120 min t = 180 min
t = 180 min
S. Wongsa
4
of breach depth is presented in Figures 5 and 6. The embankment breach cross-section may be an approximate
rectangular. Once it reached the lower elevation, the breach widened and the material was eroded from the sides
and from the upstream side. The breach remained stable after 120 minutes, the maximum breach depth and
width were 0.36 and 0.57 m, respectively. Most of the time the flow remained attached to the headcut wall, ex-
cept when mass erosion of the vertical wall became imminent. Figure 7 shows the time series of embankment
erosion width, depth, and volume of soil. The water in the testing channel was gradually drained out through the
circulated channel until it was dry. The breached sediment deposition with a fan shaped was observed.
3.3. Piping Hole Case
Figure 8. The failure charcteristics of the earthen embankment; piping hole case (at Q = 16.84 l/s).
Piping and liquefaction may occur because of seepage or leakage flow through weak layers, structural joints,
dead tree roots, and animal burrows in the embankment, without the necessity for the water level to have
reached the full height of the embankment. As time progressed, predominant water path in the middle of the
embankment was observed. The piping hole became widen faster than previous cases and the advance process
took faster to reach the embankment crest. The lumped material simultaneously dropped, another larger headcut
started to form at approximately mid-height of the embankment slope. The surface erosion characteristics ob-
served in this case were observed. The development of breach depth is presented in Figures 8 - 10. The breach
remained stable after 130 minutes, the maximum breach depth and width were 1.34 and 0.26 m, respectively.
Excessive foundation seepage through permeable substrata is often accompanied by the formation of sand boils,
which often look like miniature volcanoes ejecting water and sediment, and may result in piping failure if not
controlled. High uplift pressure and saturation of foundation materials may give rise to slope instability and
sliding failure. The piping failures caused by foundation defects are similar to those described in the preceding
subsection, but the initial breaches may involve the whole height of the embankment. Sliding failures can form a
large rupture much more rapidly than piping failures.
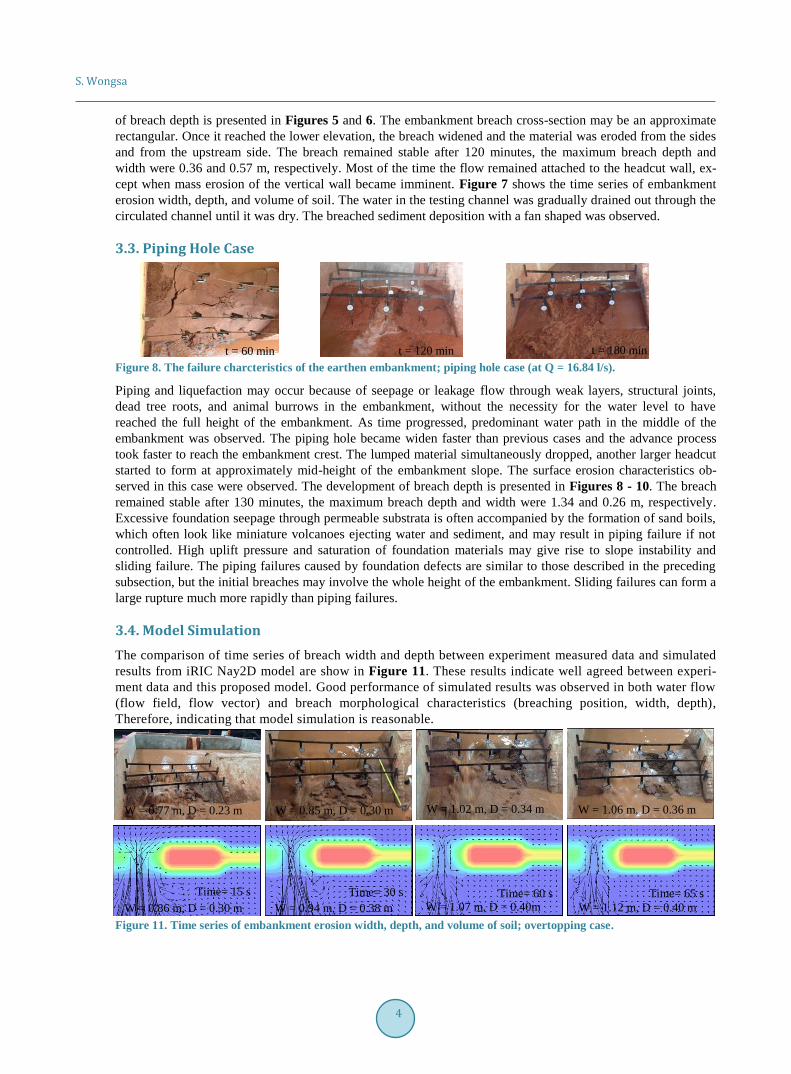
3.4. Model Simulation
The comparison of time series of breach width and depth between experiment measured data and simulated
results from iRIC Nay2D model are show in Figure 11. These results indicate well agreed between experi-
ment data and this proposed model. Good performance of simulated results was observed in both water flow
(flow field, flow vector) and breach morphological characteristics (breaching position, width, depth),
Therefore, indicating that model simulation is reasonable.
Figure 11. Time series of embankment erosion width, depth, and volume of soil; overtopping case.
W = 0.77 m, D = 0.23 m
W = 0.86 m, D = 0.30 m
W = 0.85 m, D = 0.30 m
W = 0.94 m, D = 0.38 m
W = 1.02 m, D = 0.34 m
W = 1.07 m, D = 0.40m
W = 1.06 m, D = 0.36 m
W = 1.12 m, D = 0.40 m
t = 60 min t = 120 min t = 180 min
Time= 15 s Time= 30 s Time= 60 s Time= 65 s

S. Wongsa
5
Figure 3. The vertical displacement of embankment;overtopping Case
Figure 4. Time series of embankment erosion width, depth, and volume of soil of;overtopping case.
Figure 6. The vertical displacement of embankment; beneath structure Case
(a) Q = 4.14 l/s (b) Q = 7.78 l/s
(d) Q = 16.84 l/s (c) Q = 11.59 l/s
t = 180 min
(a) Q = 4.14 l/s (b) Q = 7.78 l/s
(d) Q = 16.84 l/s (c) Q = 11.59 l/s

S. Wongsa
6
Figure 7. Time series of embankment erosion width, depth, and volume of soil of; beneath structure case.
Figure 9. The vertical displacement of embankment; piping hole case
Figure 10. Time series of embankment erosion width, depth, and volume of soil; piping hole case.
4. Conclusion
The embankment breach and failure characteristic were studied by using physical and numerical simulation,
uder 3 types of experiments, (overtopping, beneath structure and piping hole). The discharge that can be sup-
plied at 4 constant discharges of 4.14, 7.78, 11.59 and 16.48 l/s. The results indicate that the breach types have
an effect on the maximum breach width, depth and volume of eroded soil. It was found that the piping hole at
the toe of embankment was the most severe damage. The iRIC Nays2D numerical model shows a performance
of simulated results in both water flow and breach morphological characteristics, therefore, indicating that
the model simulation is reasonable. The results can be used for developing the guidelines for protecting hy-
(a) Q = 4.14 l/s (b) Q = 7.78 l/s
(d) Q = 16.84 l/s (c) Q = 11.59 l/s

S. Wongsa
7
draulic structures from failures due to embankment breaching and flood protection. However, it is important to
conduct more large-scale laboratory experiments and field case studies to improve existing embankment breach
models or develop new ones.
Acknowledgements
The authors would like to thank NRU - National Research University, Hydro and Agro Informatics Institute
(HAII), PERDO and King Mongkut’s University of Technology Thonburi (KMUTT) for financial support in
this study. I am also indebted to master and graduated students who involved the experiments.
References
[1] Visser P.J. (1998) Breach growth in sand-dikes. PhD thesis, Delft University of Technology, Delft, the Netherlands.
[2] Zhu Y.H. (2006). Breach growth in clay-dikes. PhD thesis, Delft University of Technology, Delft, the Netherlands.
[3] Stein O. R. and Julien P.Y. (1993). Criterion delineating the mode of headcut migration. Journal of Hydraulic engi-
neering,119(1), 37-50.
[4] Hahn W., Hanson G., and Cook K. (2000). Breach Morphology Observations of Embankment Overtopping Tests. Joint
Conference on Water Resource Engineering and Water Resources Planning and Management, Building Partnerships:
1-10.
[5] Zhang J., Li Y., Xuan G., Wang X., and Li J. (2009). Overtopping breaching of cohesive homogeneous earth dam with
different cohesive strength. Science in China Series E: Technological Sciences, 52(10), 3024-3029.
[6] Wongsa, S. (2014) Simulation of Thailand Flood 2011, IACSIT International Journal of Engineering and Technology,
6,( 6), 452-458.
[7] Tamoon, R., Wongsa, S. (2015) The study of behavior of failure earthen dike due to flow overtopping, Proceedings of
NCCE2011, Chonburi, Thailand.
[8] Yuangyai, C., Wongsa, S. (2015) Simulation of failure earthen dike by using iRIC Nays2D program Case Study: Bang
Chom Sri Regulator, The Journal of Industrial Technology, 11(2).
[9] http://i-ric.org/en/introduction