Embed Size (px)
Citation preview
This article was downloaded by: [UQ Library]On: 24 November 2014, At: 09:37Publisher: RoutledgeInforma Ltd Registered in England and Wales Registered Number: 1072954 Registeredoffice: Mortimer House, 37-41 Mortimer Street, London W1T 3JH, UK
International Journal of ScienceEducationPublication details, including instructions for authors andsubscription information:http://www.tandfonline.com/loi/tsed20
Experienced and Novice Teachers’Concepts of Spatial ScaleM. Gail Jones a , Thomas Tretter b , Amy Taylor a & Tom Oppewal aa North Carolina State University , USAb University of Louisville , USAPublished online: 28 Nov 2007.
To cite this article: M. Gail Jones , Thomas Tretter , Amy Taylor & Tom Oppewal (2008)Experienced and Novice Teachers’ Concepts of Spatial Scale, International Journal of ScienceEducation, 30:3, 409-429, DOI: 10.1080/09500690701416624
To link to this article: http://dx.doi.org/10.1080/09500690701416624
PLEASE SCROLL DOWN FOR ARTICLE
Taylor & Francis makes every effort to ensure the accuracy of all the information (the“Content”) contained in the publications on our platform. However, Taylor & Francis,our agents, and our licensors make no representations or warranties whatsoever as tothe accuracy, completeness, or suitability for any purpose of the Content. Any opinionsand views expressed in this publication are the opinions and views of the authors,and are not the views of or endorsed by Taylor & Francis. The accuracy of the Contentshould not be relied upon and should be independently verified with primary sourcesof information. Taylor and Francis shall not be liable for any losses, actions, claims,proceedings, demands, costs, expenses, damages, and other liabilities whatsoeveror howsoever caused arising directly or indirectly in connection with, in relation to orarising out of the use of the Content.
This article may be used for research, teaching, and private study purposes. Anysubstantial or systematic reproduction, redistribution, reselling, loan, sub-licensing,systematic supply, or distribution in any form to anyone is expressly forbidden. Terms &Conditions of access and use can be found at http://www.tandfonline.com/page/terms-and-conditions
International Journal of Science EducationVol. 30, No. 3, 26 February 2008, pp. 409–429
ISSN 0950-0693 (print)/ISSN 1464-5289 (online)/08/030409–21© 2008 Taylor & Francis DOI: 10.1080/09500690701416624
RESEARCH REPORT
Experienced and Novice Teachers’ Concepts of Spatial Scale
M. Gail Jonesa*, Thomas Tretterb, Amy Taylora and Tom OppewalaaNorth Carolina State University, USA; bUniversity of Louisville, USATaylor and Francis LtdTSED_A_241546.sgm10.1080/09500690701416624International Journal of Science Education0950-0693 (print)/1464-5289 (online)Original Article2007Taylor & Francis0000000002007M.Gail [email protected]
Scale is one of the thematic threads that runs through nearly all of the sciences and is consideredone of the major prevailing ideas of science. This study explored novice and experienced teachers’concepts of spatial scale with a focus on linear sizes from very small (nanoscale) to very large(cosmic scale). Novice teachers included undergraduates in science teacher education andstudents enrolled in a Masters of Arts in Science Teaching Program. Experienced teachersincluded students enrolled in a Master of Science Program. Participants’ knowledge of conceptualcategories of size, scale accuracy, and experiences learning scale were assessed. Results showedboth experienced and novice teachers were most accurate in their knowledge of human scale (1 mor body length) and both groups were more accurate with large scale than small scale. Experiencedteachers held more accurate concepts of small-scale measurements such as the nanometre thannovice teachers. There was evidence that being able to directly experience objects and distancesinfluenced concepts of size and scale. The role of in-school and out-of-school experiences indeveloping concepts of scale is discussed.
Introduction
There are powerful ideas that stretch across all the science domains, and these ideas‘transcend disciplinary boundaries and prove fruitful in explanation, in theory, inobservation and in design’ (American Association for the Advancement of Science,1989, p. 261). One of these prevailing ideas is scale. Scale encompasses not onlyvariables such as size and distance but also includes other variables such as time,weight, and temperature. Scale is very important in science because the properties ofmaterials change as the magnitude of scale increases or decreases. For example,materials at the nanoscale are barely affected by gravity but intermolecular forces,
*Corresponding author. Department of Mathematics, Science, and Technology Education, Box7801, North Carolina State University, Raleigh, NC 27695–7801, USA. Email:[email protected]
Dow
nloa
ded
by [
UQ
Lib
rary
] at
09:
37 2
4 N
ovem
ber
2014
410 M. G. Jones et al.
thermal energy, and quantum effects are significant. For living systems, the ratio ofscales such as surface area to volume is a major limiting factor. The ratio of surfacearea to volume may predict the upper limit for the size of an egg or the lower limitfor the size of a salamander. As the American Association for the Advancement ofScience has pointed out, it is crucial for students to develop an understanding of the‘immense size of the cosmos, the minute size of molecules, and the enormous age ofthe earth (and the life on it)’ (1989, p. 276). The present study examined teachers’concepts of scale and scaling. This study limited the investigation to conceptions oflinear spatial scale in order to maintain a manageable scope of this particular piece ofresearch. Both novice and experienced teachers’ concepts are examined in order toexplore how conceptual ecologies of scale may evolve.
Previous Research on Scale
There are only a few studies that examine how students learn about the sizes ofthings and scaling effects. Previously we examined the concepts held by students(Grades 5, 7, 9, and 12) and graduate students for size and scale (Tretter, Jones,Andre, Negishi & Minogue; Tretter, Jones & Minogue, 2006). The data showed thatindividuals tend to hold distinct categories of size that are distinguishable from othercategories. Relative size was more easily understood than absolute size. Further-more, we found that the range of sizes and scales that can be experienced kinestheti-cally were predictive of more accurate conceptualizations.
Divisions of scale. Several researchers have suggested that people tend to dividescale into three or four divisions that extend smaller and larger than human scale.Trend (2001) examined teachers’ conceptions of deep geological time and hassuggested that people’s conceptions tended to be more finely divided nearer tohuman time scales and less so at more distant scales. Trend reported that geologicevents are conceived of as having three distinct clusters that include extremelyancient, moderately ancient, and less ancient.
Hegarty, Montello, Richardson, Ishikawa, and Lovelace (2006) suggested thatpeople view scale within three types of spaces: figural, vista, and environmental. Smallscale is figural space and is relative to the body and external to the individual.Figural space is viewed from a single vantage point. Vista space is larger than thebody and can be seen from a single vantage point without movement (such as view-ing a horizon or a valley.) According to Hegarty et al., the largest of scales involvesenvironmental space that is large relative to the body and contains the body. Exam-ples of environmental space would be buildings, neighborhoods, and cities. Thislarge scale involves locomotion for an individual to perceive the space.
There is some evidence that this process of dividing space into segments occurs aschildren develop number sense. Siegler and Opfer (2003) found that when childrenare given large ranges of numbers, as on a number line, they tend to divide thenumber line into quarters. Seigler and Opfer also reported that as the numbers getlarger, there is greater scalar variability.
Dow
nloa
ded
by [
UQ
Lib
rary
] at
09:
37 2
4 N
ovem
ber
2014
Teachers’ Concepts of Spatial Scale 411
Tversky, Morrison, Franklin, and Bryant (1999) suggested that it is not space thatindividuals conceptualize, but instead it is the objects in space that define our under-standings. Tversky et al. argued that individuals form schematized concepts of spacethat are devoid of detail and form a framework of elements and the relationships ofelements within this space.
The divisions of scale that an individual holds have been associated with corticalnetworks in the brain (Previc, 1998). According to Previc, there are four realms ofspatial behaviors: peripersonal (near-body space), focal extrapersonal (visual searchand object recognition), action extrapersonal (orienting in a defined space), andambient extrapersonal (orienting in Earth fixed space). Most of the science learningtasks that students are given in school settings require them to think about scale froma peripersonal realm. Only when asked to consider very small (nanoscale and micros-cale) and very large (cosmic scale) do students have to move into these other realmsof perspective.
Langston, Kramer, and Glenberg (1998) have argued that people build mentalmodels of distances in a three-dimensional space medium. The distance betweentwo events or objects is translated in a proportional distance within mental represen-tation of these events or objects. These researchers speculate that this last distance ismeasured by the time that the subjects expend in accessing the second event orobject in their memory, once the memory of the first event has been retrieved. Theauthors suggested that an individual’s concepts of the spatial dimension of the worldare represented naturally in the medium where mental models are built.
Teaching scale. Although scale is a significant theme that cuts across the sciencedomains, there are few tools available for teachers to use to teach students about scale.One of the most commonly used instructional tools is the video Powers of Ten (http://powersof10.com). The impact of this film on middle school students’ concepts wasstudied, and results showed that the film had a positive influence on students’ under-standings of powers of 10 and scale (Jones et al., 2007). Students reported that theyhad more difficulty with sizes outside the human scale and found small scales moredifficult to conceptualize than large scales. Students’ concepts of relative size as wellas their ability to accurately match metric sizes in scientific notation to metric scaleincreased from pre-viewing to post-viewing of the film. A small sample of teacherswho were experienced in using the film was surveyed to determine the teachers’ viewsof the efficacy of the film. Teachers reported that the film was an effective tool thatallowed students to move slowly from the human scale to the large and small scalesand then quickly back again. Teachers indicated that this zooming strategy waseffective in laying the foundation for understanding the different scales.
Development of Expertise
One of the ways that educational researchers have approached studying conceptualdevelopment is to examine experts in a domain and then work backwards from
Dow
nloa
ded
by [
UQ
Lib
rary
] at
09:
37 2
4 N
ovem
ber
2014
412 M. G. Jones et al.
experts to novices to see how concepts develop over time. An examination of expertsreveals how they think about tasks and problems, and how they use domain-specificknowledge to solve problems. Furthermore, experts provide clues about how effec-tive thinkers organize and use information related to expertise (cf., Chi, 1978; Chi,Feltovich, & Glaser, 1981; Chi, Glaser, & Rees, 1982). One of the earliest studies ofexperts and novices was conducted by Chase and Simon (1973). These researchersexamined chess players and found that expert chess players had superior memory forchess games when compared with novice chess players, but this cognitive expertisedid not transfer to other contexts. One reason given for experts’ enhanced ability torecognize and remember patterns in problem-solving is their ability to chunk infor-mation into manageable bits of information (Chi, 1978; Schneider, Gruber, Gold, &Opivis, 1993). Experts tend to use broad, general principles to organize problems inphysics whereas novices used superficial surface features (Chi et al., 1981). Thesecognitive skills that allow an individual to chunk and organize information may alsobe of use to individuals as they conceptualize large spans of size from very tiny toinfinitely large.
Research Questions
This research seeks to examine teachers’ concepts of scale. In particular, thisresearch seeks to answer the following questions:
1. How accurate are teachers’ conceptualizations of spatial size of objects anddistances over many orders of magnitude?
2. Do novice and experienced science teachers’ accuracy of scale concepts differ?3. What prior in-school and out-of-school experiences shaped experienced teachers’
concepts of scale?4. What scale boundary distinctions do novice and experienced teachers hold?
Methodology
Participants
Participants in this research were drawn from three different groups: undergraduatepreservice teachers, Master of Arts in Teaching (MAT) preservice teachers, andgraduate experienced teachers enrolled in a graduate Masters of Science Program(MS). The preservice teachers (both undergraduate and MAT) included individualsthat are seeking initial licensure and are referred to in this study as ‘novice teachers.’The MS teachers have at least three years of experience and are referred to as ‘expe-rienced teachers.’
Teachers were all recruited as volunteers to be in this study through contactsmade in teacher education classes from two research-intensive universities in twodifferent states in eastern USA. There were 16 experienced science teachers whoparticipated in the study. These experienced teachers included two universityinstructors, two middle school teachers, 11 high school science teachers, and one
Dow
nloa
ded
by [
UQ
Lib
rary
] at
09:
37 2
4 N
ovem
ber
2014
Teachers’ Concepts of Spatial Scale 413
science museum educator. Fifty novice teachers (34 preservice undergraduates and16 MAT teachers) participated in the study. These included 16 middle school and34 high school science teachers. The experienced teachers had a mean of 4.7 yearsof experience and all of the novice teachers were seniors or MAT students who hadnot completed student teaching. The teachers in the study were all prepared to teachcomprehensive science and had broad science preparation (including coursework inbiology, chemistry, physics, and earth/space science).
Assessments
Participants completed a series of four assessments designed to examine conceptualcategories of size, scale accuracy, and experiences with learning scale. These assess-ments included the Scale Anchoring Objects (SAO), the Scale of Objects Question-naire (SOQ), and the Scale Card Sort task (SCS). Experienced teachers alsocompleted the Scale in the Curriculum Questionnaire (SCQ). These assessmentshave been used in previous studies (see Jones et al., 2007; Tretter et al., 2006; Tret-ter, Jones & Minogue, 2006) and are briefly described below.
The SAO was designed to assess representative objects participants use forconceptual understanding at a variety of scales from 1 nm to a billion metres. Theinstrument asks participants to generate objects representative of different size scalesfrom 1 mm to 1 km in increments of multiples of 10. At scales larger and smallerthan that range, the incremental jump to the next scale size is by a factor of 1,000.The SAO reflects a number line of sizes (a ‘size line’) that participants mentallyhold; the objects listed by participants might then be considered exemplars represen-tative of specific locations on that mental size line.
The second half of the SAO used a person’s height (or body length) as opposed toa standard measurement unit such as a metre to elicit representative sizes. The twoparts of the assessment instrument allow for the examination of the accuracy ofconceptual representatives of scale at both an actual and relative scale.
The SOQ assessed the perceived sizes of a variety of objects, such as the width of ahair or the distance from the Earth to the Moon. From a list of options spanning lessthan 1 nm to over a billion metres, participants indicated within which scale rangeeach object fell. This instrument was used to assess which scale sizes are well distin-guished from each other and to determine where in the size continuum individualsconceptualize distinctly different categories of scale.
The SCS involved participants in sorting a series of cards into groups according tohow the participant conceptualizes the size of the object on the card. The 31 cardobjects ranged from atoms to galaxies. Participants were instructed to look at eachcard and to sort it into piles by size, using as many or as few piles as they desired,and as many or few cards in a pile as they wished.
The SCQ surveyed teachers to elicit in-school and out-of-school experiences thatcontributed to teachers’ knowledge of scale. The SCQ asked teachers how theylearned about ideas related to scale. The questionnaire asked them to report whatthey were doing or studying when they learned about scale. The SCQ asked teachers
Dow
nloa
ded
by [
UQ
Lib
rary
] at
09:
37 2
4 N
ovem
ber
2014

414 M. G. Jones et al.
to describe where in their curriculum they taught about scale. Finally, the SCQasked teachers which aspects of scale were easy and difficult for their students tounderstand.
Analyses
Scale Anchoring Objects. The SAO was analysed by determining the accuracy of thesize of each object listed by each participant. This scoring protocol was developed byTretter, Jones & Minogue (2006). The SAO scoring includes the following codingscheme:
● 1/1,000—Object listed was too small by at least a factor of 1,000.● 1/100—Object listed was too small by at least a factor of 100 (but not by 1,000).● 1/10—Object listed was too small by at least a factor of 10 (but not by 100).● Accurate—Object listed was within a factor of 10 (larger or smaller) of the
requested size.● 10—Object listed was too big by at least a factor of 10 (but not by 100).● 100—Object listed was too big by at least a factor of 100 (but not by 1,000).● 1,000—Object listed was too big by at least a factor of 1,000.
Some responses were coded as uninterpretable, such as ‘tree’ for a 100-m objectsince a tree could be within an order of magnitude of 100 m or it could be smallerthan 10 m. Participants’ blank or uninterpretable responses were removed fromfurther analysis.
Scale of Objects Questionnaire. The SOQ was developed by Tretter et al. (2006)based on an instrument used by Trend (2001) to investigate conceptions of geologictime. For each of 26 objects, participants selected one box indicating their concep-tion of the scale range in which the dominant linear dimension of that object fell.Scale range options extended from less than 1 nm for the smallest scale to over abillion metres for the largest scale. Between 1 mm and 1 km, scale ranges spannedone order of magnitude (factor of 10); outside that range, the scale range optionsspanned three orders of magnitude.
Card sort/multidimensional scaling. The card sort was analysed with multidimen-sional scaling, which uses the proximities of objects as an indication of ‘how differenttwo objects are perceived to be’ (Kruskal & Wish, 1978, p. 7). The output of thedata is a spatial representation of points in a multidimensional space. Each pointcorresponds to a card in the card sort task. The cluster of points is examined qualita-tively to determine the underlying structure of the data that can indicate the relation-ships used to sort the cards. Data from each individual card sort are entered into amatrix, and the aggregate matrix of all members of a group is analysed with statisti-cal algorithms that determine the configuration that best matches the distancesbetween cards (much like highway mileage charts that show the miles between any
Dow
nloa
ded
by [
UQ
Lib
rary
] at
09:
37 2
4 N
ovem
ber
2014
Teachers’ Concepts of Spatial Scale 415
two cities could be used to generate a configuration of city locations relative to eachother) (Kruskal & Wish, 1978). To determine the optimal trade-off between thenumber of dimensions and the goodness of fit of the solution to the target data, thevalue of r2 as a function of the number of solution dimensions was investigated.The analyses showed that two dimensions were sufficient to account for the bulk ofthe variance in the sorting patterns used by the participants (r2 = 0.8 for experiencedteachers; r2 = 0.9 for novice teachers). As a result, the subsequent analysis was notextended to more than two dimensions. Separate two-dimensional plots were madefor the card sorting solutions generated during the multidimensional scaling analysisfor the experienced teachers and for the novice teachers.
Scale in the Curriculum Questionnaire. The SCQ was analysed qualitatively. Allresponses were entered into a spreadsheet by item and frequencies of responses wereobtained. Responses were categorized based on response characteristics. For exam-ple, teachers were asked to report how they learned about scale, and responses werefirst classified as in-school or out-of-school experiences. These were then enteredinto a table and examined again for evidence of common subject matters or types ofexperiences (e.g., athletic or task-related).
Results
Scale Accuracy Profiles
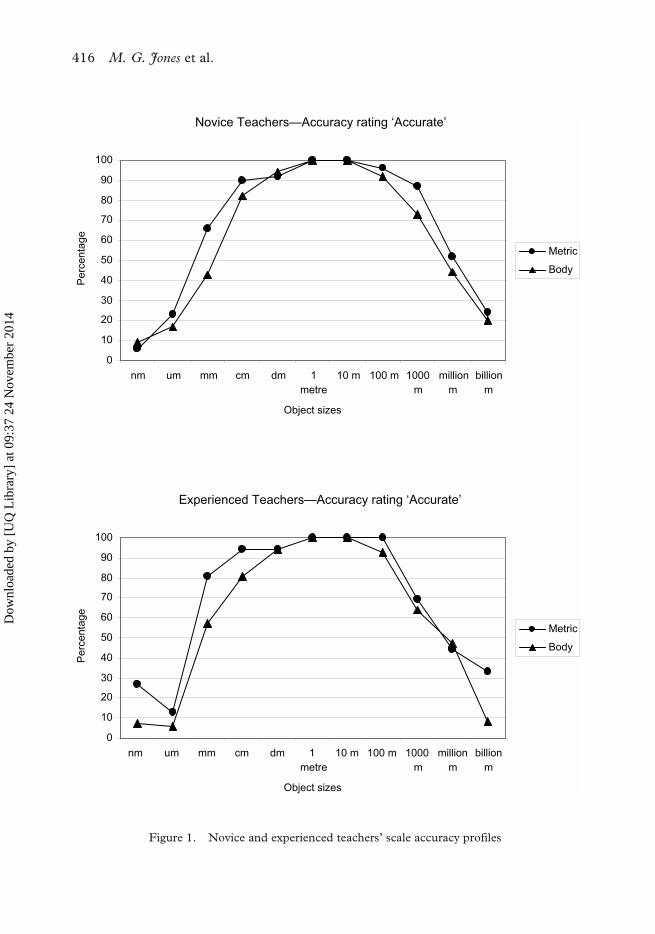
The results of the SAO analysis showed that at the human scale (1 m or one bodylength) 100% of both the novice and experienced teachers were accurate (seeFigure 1). For both groups of teachers, accuracy decreased in both directions(smaller scale and larger scale) the farther the scale was removed from human scale.Across the spectrum of scales analysed (10−9 m to 109 m), both groups of teacherstended to be more accurate overall when using metric measurements than bodymeasurements. In both groups, there tended to be a precipitous drop in accuracy atthe micrometre scale—the scale that surpasses the limits of visibility with theunaided eye. This steep drop in accuracy for teachers at the limits of visibility wassimilar to that found across a spectrum of students from Grade 5 to doctoralstudents (Tretter, Jones & Minogue, 2006).Figure 1. Novice and experienced teachers’ scale accuracy profilesIn spite of the overall similarity between the accuracy profiles of the two teachergroups, there were a few differences in accuracy profiles between them, particularlyat the extremes of scale. The experienced teacher group’s profile noticeably divergedfrom the overall pattern of the novice group at two points. At the small end of thescale, the experienced teachers had higher nanometre scale accuracy (27%) than didthe novice teachers (6%). At the large end of the scale, the experienced teacher grouphad higher billion metre accuracy (33%) than did the novice group (24%). However,this higher accuracy for the experienced teachers did not exist for the non-standardbody length unit, but only for metric units. Taken together, these differences suggestedthat experienced teachers may have more accurate conceptions at extremes of spatial
Dow
nloa
ded
by [
UQ
Lib
rary
] at
09:
37 2
4 N
ovem
ber
2014
416 M. G. Jones et al.
������ ������� ������ ����� � �������
�
��
��
��
��
��
��
��
��
��
���
�� �� �� �� � �
����
�� � ��� � ����
�
��!!���
�
"�!!���
�
#"$��� ��%��
&��������
'����
(� �
)*+������ ������� ������ ����� � �������
�
��
��
��
��
��
��
��
��
��
���
�� �� �� �� � �
����
�� � ��� � ����
�
��!!���
�
"�!!���
�
#"$��� ��%��
&��������
'����
(� �
Figure 1. Novice and experienced teachers’ scale accuracy profiles
Dow
nloa
ded
by [
UQ
Lib
rary
] at
09:
37 2
4 N
ovem
ber
2014
Teachers’ Concepts of Spatial Scale 417
scale than novice teachers, but that this improvement in accuracy is dependent on theuse of standard science units. The subsequent results presented below from these datawill therefore focus on the metric data rather than the body-length data.
Because it was possible for teachers to be inaccurate either in the direction oflisting objects too big for a given scale size or an object too small, the directions ofthe inaccuracies for both groups were analysed. There were differences in accuracyof scale concepts for both large and small scales by teacher experience.
The results showed that teachers tended to overestimate the sizes of objects at thesmall scale more often than they overestimated the large scale. Conversely, theytended to underestimate the sizes of objects at the large scale in comparison with thesmall scale.
For inaccuracies in the direction of ‘too big’, the largest difference between thetwo groups of teachers was at the nanometre scale. Whereas 47% of the experiencedteachers listed objects too big at the nanometre scale, a total of 73% of the noviceteachers listed objects too big at that scale. This suggests that the higher accuracy forexperienced teachers at the nanometre scale noted in Figure 1 seemed to be largelydue to experienced teachers not overestimating the nanometre scale objects asfrequently as the novice teachers did.
Inaccuracies in the direction of ‘too small’ showed the biggest difference betweenthe two teacher groups to be at large scale. A total of 40% of experienced teachersunderestimated the size of objects for a billion metres, whereas 60% of novice teach-ers did the same. Summarizing the results for both directions of inaccuracies, in eachcase the enhanced performance of the experienced group of teachers seemed to bedue to that group avoiding the most common errors: overestimating small objectsand underestimating large objects. This suggests that novice teachers may have amore difficult task in stretching their conceptions of scale beyond the human realm,and as a result their chosen objects at extremes of scale tended to regress toward thehuman scale mean more than was true for experienced teachers.
Size Boundaries
Absolute and relative rankings. Teachers’ categories of scale were examined for abso-lute and relative scale. The SOQ asked teachers to place a check under a range ofmetric sizes that best represented the appropriate size of a series of 26 objects (suchas the diameter of an atom or the distance from the Earth to the Sun). Thisassessment allowed us to examine how teachers’ conceptualized the relative scale ofthese objects in comparison with each other as well as their absolute metric size.This also provided data to explore teachers’ conceptions of distinct size categoriesand the boundaries between those categories.
The data from the SOQ permit three types of rankings to be determined (seeTable 1). The first is the actual absolute rank for the 26 objects listed on the SOQ(see first rank column in Table 1). The second ranking is the absolute rank of eachobject as computed from the aggregate participant responses. Absolute ranks aredetermined from the particular numerical size participants assigned to each object.
Dow
nloa
ded
by [
UQ
Lib
rary
] at
09:
37 2
4 N
ovem
ber
2014

418 M. G. Jones et al.
Since each object was marked as belonging in a range of sizes rather than one partic-ular size, the geometric mean of the selected range was chosen to be a reasonablerepresentative for participants’ conceptualizations of the absolute sizes of theobjects. After each object was assigned a numerical size value (the geometric meanof the size range) for each participant, the mean numerical size value for an objectwas computed across all members of a group (novice or experienced teachers).These mean numerical size values for all the objects were ranked to determine theabsolute ranks in Table 1 (see the second and third rank columns).
The third ranking computed from the SOQ instrument is the relative ranking of eachobject. The relative rank is determined by first computing the size rank of each of the26 objects compared with the remaining 25 objects for each individual participant’sresponses. Thus objects are ranked relative to each other for an individual participant
Table 1. Three approaches to ranking sizes of Objects on SOQ
Absolute rank Relative rank
ObjectActual rank
Experienced teachers
Novice teachers
Experienced teachers
Novice teachers
Atomic nucleus 26 26 26 26 26Atom 25 21 25 25 25Virus 24 22 24 23 23Bacterium 23 25 23 24 24Cell 22 23 21 22 22Hair width 21 24 22 21 21Ant 20 17 19 19 19Rice grain 19 19 20 20 20Postage stamp 18 16 18 18 18Finger 17 20 17 17 17Pencil 16 18 16 16 16Textbook 15 15 15 15 15Adult height 14 14 14 14 14Elephant height 13 13 13 13 13School bus 12 12 12 12 12Semi truck 11 10 11 10 11Pine tree 10 11 10 11 10Football field 9 9 9 9 9Shopping mall 8 8 8 8 8Tallest building 7 7 7 7 7State width 6 6 6 6 6Space station altitude 5 3 4 4 4New York to Los Angeles 4 5 5 5 5Earth diameter 3 4 3 3 3Earth to Moon 2 2 2 2 2Earth to Sun 1 1 1 1 1
Dow
nloa
ded
by [
UQ
Lib
rary
] at
09:
37 2
4 N
ovem
ber
2014
Teachers’ Concepts of Spatial Scale 419
regardless of the particular size range selected. This differs from the absolute rankingbecause the particular numerical size of the range selected is not the focus for thisranking. For example, the size range ‘10–100 m’ would be assigned the same numericalvalue for absolute rankings for all participants. However, it might represent the thirdlargest selected for one participant (and hence have relative ranking 3 for that partic-ipant) and the same size range might represent the eighth largest size range selectedby another participant (and hence have relative ranking 8 for that participant). Aftereach object is assigned a relative ranking for each participant, the mean of the relativerankings for every object is computed for each group (novice and experienced teachers)and reported in the ‘relative rank’ columns of Table 1.
Relative rankings. Relative rankings overall tended to be more accurate than abso-lute rankings. In the relative ranks, the novice group transposed three sets of objects(4/5, 19/20, and 23/24) compared with actual ranks, resulting in a total of six relativerankings of objects that did not match the actual ranks. The experienced grouptransposed exactly these same three sets of objects and, in addition, transposed oneother (10/11), for a total of eight relative rankings of objects not matching the actualranks. In the absolute rankings, the novice group absolute rankings for six objectsdid not match the actual ranks, whereas for the experienced teachers a total of 14absolute rankings of objects did not match the actual ranks.
The transpositions for the relative rankings of selected objects for both groupswere remarkably congruent across groups, and each transposition provides clues toexplain the mismatch with the actual ranks. The transposition 23/24 indicated thatparticipants in both groups conceptualized the size of a virus as bigger than abacterium. Rua & Jones (1999) found that the perception that viruses are biggerthan bacteria was due to the stronger virulence of viruses, a possible explanation forthis transposition. The transposition 19/20 (size of ant compared with a grain ofrice) is probably be an artificial artifact of the coding scheme used for these data.Depending on the particular ant, some are larger than a typical grain of rice andsome are smaller. These data were coded with the ant as the smaller of the two, butthe stimuli provided to participants did not specify which ant species to consider.Hence this particular transposition does not necessarily suggest an incorrectunderlying scale conceptualization for these two objects. The transposition of 10/11(semi-truck versus pine tree) for the experienced group relative ranking likewise maynot necessarily be inaccurate. Although the majority of pine trees are taller than asemi-truck is long, there are some species of pine trees that are shorter (see http://hgic.clemson.edu/factsheets/HGIC1020.htm).
The final transposition (4/5) was the altitude of a space-station being conceived asgreater than the distance from New York to Los Angeles. This overestimation of thespace-station altitude may be due to several possible reasons. It may be that manyparticipants are simply unaware of the altitude at which the space-station orbits andwere guessing. For those who were not simply guessing, most people have probablybeen exposed to images of the Earth taken from the space-station, which may have
Dow
nloa
ded
by [
UQ
Lib
rary
] at
09:
37 2
4 N
ovem
ber
2014
420 M. G. Jones et al.
served as a primary stimulus for their estimation. Since the vertical direction is prior-itized by the perceptual system over the horizontal (Bryant, 1998; Tversky, 1991),this vertically oriented image of the Earth below may have been perceived as agreater distance than would have been the case if the same distance had beenoriented horizontally. For example, the perception of the length of a football (soccer)field (approximately 100–110 m) from the viewing stands and the experience ofwalking this length is quite different from the perception of distance when standingon the second platform of the Eiffel Tower (115 m) and looking down after havingwalked up the 700 steps to reach the platform. A third possibility may be that someparticipants confused the low Earth orbit altitude of the space-station with thealtitude of geosynchronous communication satellites, which are approximately 90times higher than the space-station and hence are at a greater altitude than thedistance across the continental USA.
Absolute rankings. Absolute rankings were generally not as accurate as the relativerankings. This was particularly true for the experienced group of teachers, who didworse in absolute rankings than the novice group. The experienced groupconfounded the size rankings of four of the five microscopic objects, and five of thesix small visible objects from the size of a pencil down to the width of a hair. Theother absolute rankings for the experienced group that did not match the actualrankings fell at some of the same places as the experienced group relative rankingsmismatch (pine tree/semi-truck and space-station altitude/continental distances)already discussed above. These last mismatches probably have the sameexplanations as those already proposed for the relative rankings.
The large number of microscopic objects misjudged on absolute size suggests thatthe experienced teacher group did not have a firm grasp of the numerical scale ofmicroscopic phenomena. This may be due to lack of experience working with thescales of these objects. Even when instructing middle or high school students in thiscontent, it may be that the scale of the microscopic phenomena did not tend to playa significant part of the instruction. Another explanation is that novice teachers mayhave had more recent and extended experiences with small-scale science in theirteacher education programs than their experienced peers.
The misalignment of small but visible objects (pencil to hair width) for the experi-enced teacher group cannot be explained by the same lack of experience as with themicroscopic objects. By contrast, objects larger than a person that were also within ascale range of common, direct experience tended to be accurately ranked for the abso-lute rank of both groups. This suggests that conceptions of scale smaller than a personmay be more problematic than scales larger than a person. The reason for this asym-metry between smaller than a person and larger than a person is not yet clear.
Size boundary profiles. Because the relative rankings were more accurate thanabsolute rankings, the relative rankings were used to further analyse participants’conceptions of the boundaries between distinct categories of scale. Rather than put
Dow
nloa
ded
by [
UQ
Lib
rary
] at
09:
37 2
4 N
ovem
ber
2014
Teachers’ Concepts of Spatial Scale 421
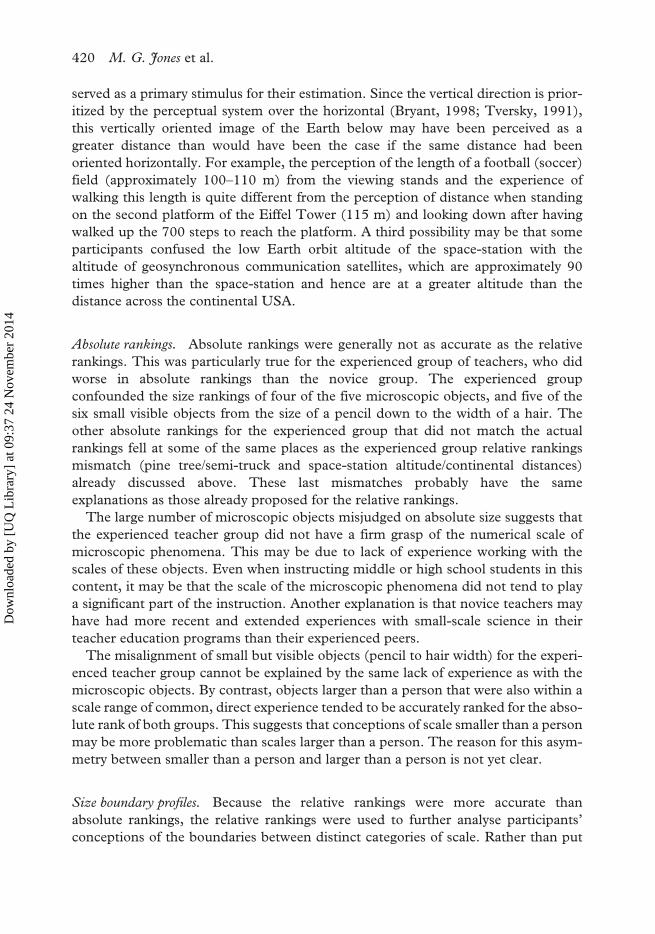
the relative rankings in actual ordinal sequence as was done in Table 1, the means ofthe relative rankings for each object by group are presented in Table 2 with theobjects arranged according to the mean relative rank for each group. These data inTable 2 are presented as the foundation for Figure 2.Figure 2.Distinctions of size boundaries for novice and experienced teachers
Where large differences in relative rankings between one object and its neighbourexist, this can be interpreted to suggest that, collectively in the minds of the partici-pants, these two objects are conceptualized as being in distinctly different size cate-gories, with one clearly larger than the other. Where small differences in relativerankings exist between adjacent objects, this suggests that as a group the participantsdid not clearly conceptualize these objects as being very different from each other interms of size. Figure 2 presents the differences in relative rankings between adjacentobjects for the experienced teacher group and the novice teacher group respectively.
Table 2. Relative rankings between adjacent objects
Experienced teachers Novice teachers
ObjectMean relative
rankAdjusted mean
differenceMean relative
rankAdjusted mean
difference
Sun 1.00 N/A 1.07 N/AMoon 1.56 0.56 1.39 0.32Earth 2.40 0.84 2.90 1.51Space Station 3.00 0.6 3.39 0.49New York to Los Angeles 3.33 0.33 3.53 0.14State width 4.31 0.98 5.00 1.47Tallest building 5.93 1.62 6.14 1.14Mall length 6.27 0.34 6.15 0.01Football field 7.56 1.29 7.8 1.65Truck 9.21 1.65 9.52 0.54Pine tree 9.4 0.19 8.98 1.18Bus 9.8 0.4 9.90 0.38Elephant 11.07 1.27 11.06 1.16Adult 11.47 0.4 11.56 0.50Textbook 14.27 2.8 14.45 2.89Pencil 14.38 0.11 14.83 0.38Finger 15.67 1.29 15.63 0.80Stamp 15.93 0.26 16.29 0.66Ant 17.57 1.64 17.91 1.62Rice 18.29 0.72 18.19 0.28Hair 19.36 1.07 20.00 1.81Cell 19.93 0.57 20.70 0.70Virus 21.25 1.32 20.94 0.24Bacterium 21.58 0.33 21.25 0.31Atom 22.67 1.09 22.06 0.81Nucleus 23.85 1.18 22.27 0.2
Dow
nloa
ded
by [
UQ
Lib
rary
] at
09:
37 2
4 N
ovem
ber
2014
422 M. G. Jones et al.
Figure 2. Distinctions of size boundaries for novice and experienced teachers
Dow
nloa
ded
by [
UQ
Lib
rary
] at
09:
37 2
4 N
ovem
ber
2014
Teachers’ Concepts of Spatial Scale 423
Where the differences are large in Figure 2 (the bars are tall), this represents aconceptually distinct boundary between one size and the next. Although there is noobjective criterion by which to determine what difference is large enough to qualify asa boundary, earlier research (Tretter et al., 2006) identified categorical boundarieswith descriptive labels for each size category, and those categories were used as thebasis for identifying and labeling the emergent teacher scale categories in Figure 2.
Differences between the two groups of teachers in the categories of size thatemerged in Figure 2 are especially noteworthy at a small scale. Novice teachers indi-cated holding conceptions of only three size categories smaller than a person, andonly one category of size smaller than the limits of visibility (labeled ‘microscopic’ inFigure 2). However, the experienced teachers conceptualized a total of fivecategories smaller than a person, including distinction of two different levels of smallwhen thinking about sizes below the visible limit. The small-scale distinctionsevident from the experienced teachers’ group were very similar to the same distinc-tions made by experts in the field, whereas the novice teachers’ distinctions weremore similar to those of gifted high school seniors rather than experts (Tretter et al.,2006). This suggests that the process of teaching science can lead to a maturingsense of small scale, which presumably indicates that a sense of scale is beneficial forteachers (and their students).
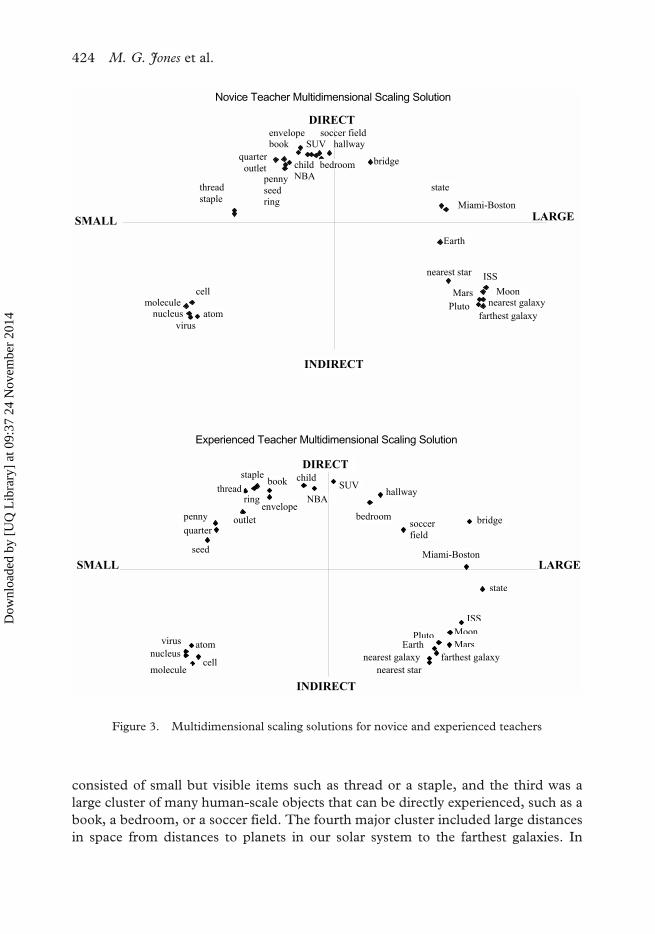
Conceptual Groupings of Objects
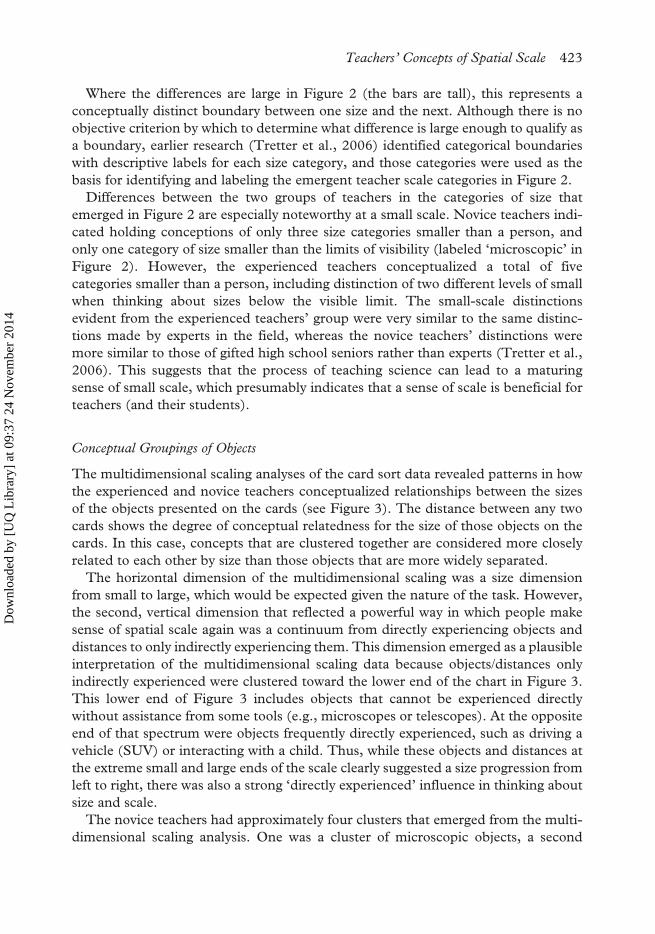
The multidimensional scaling analyses of the card sort data revealed patterns in howthe experienced and novice teachers conceptualized relationships between the sizesof the objects presented on the cards (see Figure 3). The distance between any twocards shows the degree of conceptual relatedness for the size of those objects on thecards. In this case, concepts that are clustered together are considered more closelyrelated to each other by size than those objects that are more widely separated.Figure 3. Multidimensional scaling solutions for novice and experienced teachersThe horizontal dimension of the multidimensional scaling was a size dimensionfrom small to large, which would be expected given the nature of the task. However,the second, vertical dimension that reflected a powerful way in which people makesense of spatial scale again was a continuum from directly experiencing objects anddistances to only indirectly experiencing them. This dimension emerged as a plausibleinterpretation of the multidimensional scaling data because objects/distances onlyindirectly experienced were clustered toward the lower end of the chart in Figure 3.This lower end of Figure 3 includes objects that cannot be experienced directlywithout assistance from some tools (e.g., microscopes or telescopes). At the oppositeend of that spectrum were objects frequently directly experienced, such as driving avehicle (SUV) or interacting with a child. Thus, while these objects and distances atthe extreme small and large ends of the scale clearly suggested a size progression fromleft to right, there was also a strong ‘directly experienced’ influence in thinking aboutsize and scale.
The novice teachers had approximately four clusters that emerged from the multi-dimensional scaling analysis. One was a cluster of microscopic objects, a second
Dow
nloa
ded
by [
UQ
Lib
rary
] at
09:
37 2
4 N
ovem
ber
2014
424 M. G. Jones et al.
consisted of small but visible items such as thread or a staple, and the third was alarge cluster of many human-scale objects that can be directly experienced, such as abook, a bedroom, or a soccer field. The fourth major cluster included large distancesin space from distances to planets in our solar system to the farthest galaxies. In
soccer fieldbook
Novice Teacher Multidimensional Scaling Solution
INDIRECT
DIRECT
LARGESMALL
nucleus atom
cell molecule
virus
ISS
Moonnearest galaxy
farthest galaxyPlutoMars
nearest star
Earth
Miami-Boston
state
bridge
hallway
bedroom
SUV
childNBA
envelope
quarter outlet
pennyseed ring
thread staple
Experienced Teacher Multidimensional Scaling Solution
molecule
atom
cell
virus nucleus
nearest star nearest galaxy farthest galaxy
Earth Pluto
MarsMoonISS
state
Miami-BostonSMALL LARGE
bridge soccer field
hallway
bedroom
SUV
INDIRECT
DIRECT
NBA
childbook
envelope
staple
ringthread
outletpenny quarter
seed
Figure 3. Multidimensional scaling solutions for novice and experienced teachers
Dow
nloa
ded
by [
UQ
Lib
rary
] at
09:
37 2
4 N
ovem
ber
2014
Teachers’ Concepts of Spatial Scale 425
addition to these major clusters, there were a few other items that tended to not fallinto a cluster but rather were between clusters.
The experienced teachers’ card sort strategy revealed fewer distinct clusters ofobjects than did the novice teachers; instead, objects tended to be spread out over thechart rather than tightly clustered. This group did exhibit a well-defined cluster ofmicroscopic objects (similar to the novice teachers) and a cluster of large, planetary,and galactic distances (again similar to the novice teacher group). The main differ-ence for this group in comparison with the novice teacher group was the distributionof the human-scale objects (from thickness of thread to length of a soccer field) ratherthan these being clustered. This suggests that, as a group, the experienced teachersmade size distinctions more readily among these objects rather than conceptualizingthem within one size range. This pattern was also seen in the results shown inFigure 2, which showed experienced teachers make more distinctions of the smallscale than novice teachers.
Experienced Teachers’ Prior Experiences Learning Scale
Experienced teachers were asked how they learned about ideas related to scale in theSCQ. Both in-school and out-of-school experiences were cited as significant eventsthat shaped teachers’ concepts (see Table 3). Out-of-school experiences that wererepeatedly cited included swimming, running track, driving, map-reading, andbuilding things. Within-school experiences related to learning scales that were citedmultiple times included measuring, watching the Powers of Ten video, using micro-scopes, and references to specific analogies that teachers taught to remember metricsizes (such as an outstretched arm is a metre). Although there were a few examplesof learning through seeing and hearing such as watching the Powers of Ten video orreading a textbook, the majority of the examples involved kinesthetic experiencessuch as quilting, building, measuring, or running track. The use of the body as acentral reference point for scale was seen in the results of the SAO where teachers’accuracy of scale concepts declined for both large scale and small scale the furtherthe scale was from the human scale that can be experienced directly. Evidence forthe use of one’s own body size as a dominant reference scale was also providedby the size boundaries results from the SOQ, which showed that the clearest sizeboundary distinction (as shown by the tallest bars in Figure 2) was at the size of anadult’s body.
Teaching Scale
Experienced teacher participants were asked to give examples from their sciencecurriculum where they teach scale and scaling. The majority of the teachers inter-preted the question to refer only to the linear sizes or distances of things. Sixty-ninepercent of the teachers reported teaching their students about small sizes of objectssuch as protons, atoms, bacteria, cells, and light rays. Teaching about large-sizedobjects and distances was reported by 53% of the teachers. Examples of large sizes
Dow
nloa
ded
by [
UQ
Lib
rary
] at
09:
37 2
4 N
ovem
ber
2014
426 M. G. Jones et al.
included teaching students about the solar system, sizes of dinosaurs, light years,volcanoes, and depths of oceans. Only four teachers cited examples of scale thatreferred to non-linear sizes, and these included population growth, measuring
Table 3. In-school and out-of-school experiences learning scale responses
Out-of-school experiences In-school experiences
Working in a tyre shop learning about diameters and widths of tyres and how this can affect a car’s efficiency
Learning a cell is as big as a needle tip in science class
Planetarium with scaled drawings of the planets and the sun
Learning a yard is an outstretched arm
Cells Alive website Comparing objects under the microscope
Swimming competitively Textbooks
Army map reading Learning the prefixes for the metric system in earth science
Reading maps while travelling on vacation as a child
Learning in junior high that the thickness of a dime is 1/1,000 m
Driving Measuring in mathematics class
Going to the top of a volcano in Hawaii and the top of high buildings
Research with electron and optical microscopy
Tracking my height on the refrigerator In chemistry class, learning nano/micro/pico in reference to atoms
Running track and learning a mile from laps In biology, where the teacher would relate the unknown to the known—like the heart is the size of your fist
Watching science programs on television Powers of Ten video in chemistry class
Working in a jewellery store measuring rings In chemistry, learning the metric system
Helping my dad measure and build cabinets In drafting class I had to make things smaller than they were
Quilting, sewing and making decorations In environmental science, using a scale to determine how much water is available for us to drink
Playing with scale drawings to make a landscape plan
Learning to measure in elementary school
A field trip to the zoo where we considered how many of ourselves were the weight of other animals
In forestry, measuring trees
Cooking and using ingredients The breakdown of metres in college physics
Football games In physics, learning wavelengths, radiation, sound waves, and comparing distances
Dow
nloa
ded
by [
UQ
Lib
rary
] at
09:
37 2
4 N
ovem
ber
2014
Teachers’ Concepts of Spatial Scale 427
gravity, time scales, and teaching the concept of forever. General measurement skillswere cited by 22% of the teachers as scale examples from their curriculum. Measure-ment skills included teaching the metric scale, techniques for measuring mass andvolume, and general use of measuring tools.
When asked to give examples of aspects of scale and scaling that are problematic aswell as others that are easy for students to learn, teachers (25%) indicated dimensionsof scale that students could see were easier to learn than those that are not visible. Forexample, one of the teachers noted ‘It’s hard to picture how things behave and lookwhen they can’t be seen.’ Lack of visibility was also noted as problematic whenlearning scale by 34% of the teachers. Small scales were singled out more frequently(18.8%) than large scales (6.3%) as being difficult for students. Examples of difficultconcepts included understanding the size of an atom, conceptualizing cell size, andthe size of DNA. Almost one-third of the teachers noted that the metric system andconversions from the English to the metric system were problematic for students.
Teachers noted that students had an easier time learning scale when they couldexperience it though measuring, touching, and manipulating objects. Everydayexperiences were cited as crucial for students to develop scale concepts. One teachernoted that ‘anything they can relate to body size’ is easier for students.
Discussion
The results showed that both experienced and novice teachers hold more accurateconcepts of large scale than small scale. Large scale can often be experienced tosome degree visually whereas micrometre-sized and nanometre-sized objects are notvisible without technology. An individual can view a distant horizon, planets, andstars with the naked eye although accurate distances are difficult to discern. It ispossible that this continuous perception of large distances allows the perceiver tocreate more accurate mental frameworks for large distances than is possible withsmall objects that cannot be seen. Another explanation is that science teachers mayspend more time explicitly teaching students about large astronomical distances butnot explicitly address micrometre-sized and nanometre-sized scale; for example, in abiology classroom. A common scale instructional activity that teachers use is to takestudents outside the school to create a scaled model of the solar system. But is therean equivalent activity that teachers use to teach about small scale?
The magnitude of errors that both experienced and novice teachers had for bothsmall and large scales is noteworthy. If a teacher cannot accurately describe thedistance to the Sun or Moon, no one would take much notice. But when teachersare off by a factor of a 1,000, it suggests that the underlying framework forunderstanding scale is missing or distorted. It is important for individuals to havereasonably accurate number sense and a broad framework for making estimations.How inaccurate can an individual be in their understandings of numeracy before weare concerned? If an individual is off by a factor of 100 in balancing a bank state-ment, he or she would be concerned. If estimating how much gas is needed for atrip, more precise estimation skills are needed. Which aspects of scale in science
Dow
nloa
ded
by [
UQ
Lib
rary
] at
09:
37 2
4 N
ovem
ber
2014
428 M. G. Jones et al.
require accurate conceptual categories? Do teachers need more accurate concepts ofscale for different levels and domains of science?
The multidimensional scaling results showed that both groups of teachersemployed similar means to make sense of scale, subconsciously encoding spatialscale conceptions by relying on the nature of experiencing objects directly (with theirfive senses) or indirectly (with the aid of equipment). Our earlier work found theseresults with teachers to be a consistent result across a spectrum of students fromGrade 5 to doctoral students (Tretter et al., 2006).
Experienced teachers reported learning about scale both in school and out ofschool in a variety of ways. Teachers noted that building things, driving, measuringobjects, and athletics all contributed to their understandings of scale. Within school,teachers reported learning about scale when they had to make measurements inclasses like forestry, chemistry, and mathematics. The majority of the instances thatteachers noted for in-school and out-of-school learning experiences involved activeengagement with a task or problem. But, in contrast, many of the areas whereteachers noted that they teach scale were more abstract and less experiential, such asteaching about volcanoes, light years, and the depths of oceans.
These results suggest that greater emphasis needs to be placed on teaching andlearning about scale in general, and small scale below the limits of visibility inparticular. Students need a conceptual framework that they can use as theyencounter new advancements in small-scale science. What does it mean to saysomething is ‘nano’ sized? Just how small is a nanometre? Furthermore, studentsneed better rough estimation skills to know when they are completely outsideaccurate scales. One strategy would be to give all students a set of scale referencesthat they could use as they think about sizes and distances at the very large andvery small scales. If students knew viruses were nanometre-sized (10−9) and thatthe Sun was over 1011 m from Earth, would they be better at estimating sizes anddistances? It is not obvious that we have the instructional tools that are needed toteach students about very large and very small scales. Are there effective ways thattechnology can be harnessed to immerse students in experiences with large andsmall scales and build better conceptual frameworks?
Acknowledgement
This material is based upon work supported by the National Science Foundationunder Grants 0411656, 0634222, and 0507151.
References
American Association for the Advancement of Science. (1989). Science for all Americans. Washington,DC: Author.
Bryant, D. J. (1998). Human spatial concepts reflect regularities of the physical world and humanbody. In P. Olivier & K.-P. Gapp (Eds.), Representation and processing of spatial expressions(pp. 215–230). Mahwah, NJ: Lawrence Erlbaum Associates, Inc.
Chase, W. G., & Simon, H. A. (1973a). Perception in chess. Cognitive Psychology, 4, 55–81.
Dow
nloa
ded
by [
UQ
Lib
rary
] at
09:
37 2
4 N
ovem
ber
2014
Teachers’ Concepts of Spatial Scale 429
Chi, M. T. H. (1978). Knowledge structures and memory development. In R. Siegler (Ed.),Children’s thinking: What develops (pp. 73–96). Hillsdale, NJ: Erlbaum.
Chi, M. T. H., Feltovich, P. J., & Glaser, R. (1981). Categorization and representation of physicsproblems by experts and novices. Cognitive Science, 5, 121–152.
Chi, M. T. H., Glaser, R., & Rees, E. (1982). Expertise in problem solving. In R. J. Sternberg(Ed.), Advances in the psychology of human intelligence (vol. 1). Hillsdale, NJ: Erlbaum.
Hegarty, M., Montello, D., Richardson, A., Ishikawa, T., & Lovelace, K. (2006). Spatial abilitiesat different scales: Individual differences in aptitude-test performance and spatial-layoutlearning. Intelligence, 34, 151–176.
Jones, M. G., Taylor, A., Minogue, J., Broadwell, B., Wiebe, E., & Carter, G. (2007). Under-standing scale: Powers of ten. Journal of Science Education and Technology, 16(2), 191–202.
Kruskal. J., & Wish, M. (1978). Multidimensional scaling. Beverly Hills, CA: Sage.Langston, W., Krammer, D., & Glenberg, A. (1998). The representation of space in mental
models derived from text. Memory and Cognition, 26, 247–262.Previc, F. (1998). The neuropsychology of 3-D space. Psychological Bulletin, 124(2), 123–164.Rua, M., & Jones, M. G. (1999, April). Pieces of the story: Students’, teachers’, and medical profession-
als’ beliefs about bacteria and viruses. Paper presented at the American Educational ResearchAssociation Annual Meeting, Montreal, Canada.
Schneider, W., Gruber, H., Gold, A., & Opivis, K. (1993). Chess expertise and memory for chesspositions in children and adults. Journal of Experimental Child Psychology, 56, 323–349.
Siegler, R., & Opfer, J. (2003). The development of numerical estimation: Evidence for multiplerepresentations of numerical quantity, Psychological Science, 14(3), 237–243.
Trend, R. D. (2001). Deep time framework: A preliminary study of U. K. primary teachers’conceptions of geological time and perceptions of geoscience. Journal of Research in ScienceTeaching, 38(2), 191–221.
Tretter, T., Jones, G., Andre, T., Negishi, A., & Minogue, J. (2006). Conceptual boundaries anddistances: Students’ and experts’ concepts of the scale of scientific phenomena. Journal ofResearch in Science Teaching, 43(3), 282–319.
Tretter, T. R., Jones, M. G., & Minogue, J. (2006). Accuracy of scale conceptions in science:Mental maneuverings across many orders of spatial magnitude. Journal of Research in ScienceTeaching, 43(10), 1061–1085.
Tversky, B. (1991). Spatial mental models. In The psychology of learning and motivation (vol. 27,pp. 109–145). New York: Academic Press.
Tversky, B., Morrison, J., Franklin, N., & Bryant, D. (1999). Three spaces of spatial cognition.The Professional Geographer, 51(4), 516–524.
Dow
nloa
ded
by [
UQ
Lib
rary
] at
09:
37 2
4 N
ovem
ber
2014