Embed Size (px)
Citation preview

The UK’s Construction Price Indices
Experience and Perspectives.
Martina PortantiOffice for National Statistics, UK
Business Prices Production team

Outline
• Background
• History of the UK Construction Price indices
• The new UK Construction Output Price Index:
• Methods
• Implementation
• Future developments
• Lessons learnt

Background

What is construction?
• Includes a wide variety of activities:
o Construction of dwellings (houses, apartments,
etc)
o Construction of non-residential buildings
o Civil engineering works (roads, bridges, dams etc)
o Repair, maintenance and renovations
• In the UK, it accounts for around 6% of GDP
• Key short-term indicator feeding into GDP
calculations, alongside Index of Production
and Index of Services

Why are construction price indices
important?
• Price indices fundamental to assess real
change output
• Use for deflation of components of national
accounts (construction output and gross fixed
capital formation)
• Adjustment of constructions contracts
• Indexation for insurance purposes

Measuring construction prices is
tricky!
• Diverse sector and we need to measure
prices at constant quality – for construction is
virtually impossible, as very rare to have
same projects
• International and intranational comparisons
hard because of different construction
standards and requirements
• Data sources may be limited
• Require lot of technical knowledge

History of the UK Construction Price
indices

Construction Statistics in the UK
• ONS in charge of Construction statistics (output/volume) since
2010
• The Department for Business, Energy and Industrial Strategy
(BEIS) has historically been responsible for producing
Construction price indices
• Adjustment of constructions contracts
• Indexation for insurance purposes
• Use for deflation of components of national accounts
(construction output and gross fixed capital formation)

Construction Price and Cost Indices
(CPCI)• Suite of indices produced by BCIS (Building Cost Information Service) for
the Department for Business, Innovation and Skills (BIS)
• Produced by BCIS – Building Cost Information Service of the Royal
Institution of Chartered Surveyors
• RICS professional body that accredits professionals within the land,
property, construction, and infrastructure
• It included:
Output Price Indices (OPIs)
Tender Price Indices (TPIs)
Price Adjustment Formulae Indices (PAFI) /Resource Cost Indices (RCIs)
• Breakdowns available for:
• New construction
• Repair and maintenance
• Public
• Further breakdowns by housing vs non-housing (commercial, industrial
and infrastructure)

Bills of quantities & schedules of
prices
• Traditional construction procurement route for
UK public sector projects
• Project designed and detailed bills of
quantities (BoQ) prepared. These are
detailed list of all the materials, labour etc
required for the building projects
• Tenders invited based on BoQ. Bidders
provide a schedule of prices

PPP Bills of quantity - example
• Example?

Tender Price Indices (TPIs)
• Based on Tender prices receipted in a quarter
• Tenderers provide a schedule of prices based on
detailed Bills of Quantities produced by
commissioning body
• The schedule of prices are re-priced at base prices.
This allows to construct a Paasche price index
(quantities at time t)
• Main use in estimating, cost-checking and fee
negotiation on construction projects
• Basis for the Output Price Indices (OPI)

Output Price Indices (OPIs)
• Required as deflator in National Accounts
• Construction output in each quarter rarely
related to contracts awarded/receipted in that
quarter
• Use set of weights to combine previous
quarters’ TPIs by sector
• Sector OPIs combined to create higher level
aggregates
• Breakdowns published for new work, Repair
and Maintenance and all work

Sector OPI
Sector OPIs derived as an harmonic mean of TPIs
NO(n)=value of new orders at time n
TPI(n)=TPI at time n
W(n)= weigths

Price Adjustment Formulae Indices
(PAFI)
• Series of 42 input price indices including specific materials,
labour and plant indices
• Use of PPI, SPPI and Average weekly earnings
• The indices represent the underlying movement in factory gate
prices and nationally agreed wage awards. They are not
intended to represent the effect that national or local market
pressures have on prices from subcontractors, merchants and
so forth
• Main use for contract indexation

Resource Cost Indices (RCI)
• Weighted averages of PAFI indices
• Separate indices available for housing; non-housing;
infrastructure; and repair and maintenance (housing and non-
housing)
• Breakdowns by materials; labour; plant; electrical work;
mechanical work and building work also available
• Main use for contract indexation

Issues
• CPCI been subject of a number of reviews
over the last 10 years
• Langdon report in 2010 quote research by Yu
and Ive:
• Limited information on Mechanical and Electrical
service items, often lumped together in BoQ
• Use of base rates makes it difficult to capture new
elements and proprietary items
• BoQ procurement route diminishing in importance
• Limited coverage of private sector housing and
commercial

Construction Breakdown
Private Commercial
ONW
New Work 19%
Private Housing New Work 17%
Private Housing R&M 13%
Infrastructure New Work 11%
Private Other Work R&M 8%
Public ONW New Work 8%
Infrastructure R&M 6%
Public Housing R&M 6%
Public Housing New Work 4%
Public Other Work R&M 4%
Private Industrial ONW New Work 3%

Comparison of CPCI – all work
• Include some comparison of the 3 indices?
0.0
50.0
100.0
150.0
200.0
250.0
Q1 Q3 Q1 Q3 Q1 Q3 Q1 Q3 Q1 Q3 Q1 Q3 Q1 Q3 Q1 Q3 Q1 Q3 Q1 Q3 Q1 Q3 Q1 Q3 Q1 Q3 Q1 Q3 Q1 Q3 Q1 Q3 Q1 Q3 Q1
1995 1996 1997 1998 1999 2000 2001 2002 2003 2004 2005 2006 2007 2008 2009 2010 2011 2012
OPI TPI RCIS

New methodology and 2014
consultation• Consultation in 2014 on new methodology
o Proposal to move to a basket-type approach to
produce an input price index
o Use the new input indicator as a basis for an
output indicator
• Publication of indices on new methodology
due in December 2014 but issues with quality
o Construction output lost National Statistics status
due to deflators
• Transfer of responsibility to ONS in March
2015
Methodology development
• Interim solution while longer term
methodology developed
• Use of already existing ONS data sources
• Interim methodology very close to final
methodology
• Interim methodology used for 2015-2017
• Since Q3 2017, final methodology applied

The new UK Construction Output Price
Index

Project-cost approach
• A selection of types of construction projects has been chosen
• Input costs for each type of projects are obtained by weighting
together costs for materials, labour and plants
• A mark-up to account for profits is applied to the input cost
• The result is considered a proxy for output prices
Basic methodology:
𝑀𝑎𝑡𝑒𝑟𝑖𝑎𝑙 𝑐𝑜𝑠𝑡𝑠 (𝑃𝑃𝐼)
𝐿𝑎𝑏𝑜𝑢𝑟 𝑐𝑜𝑠𝑡𝑠 𝐴𝑊𝐸 × 𝑀𝑎𝑟𝑘 − 𝑢𝑝 𝑓𝑜𝑟 𝑝𝑟𝑜𝑓𝑖𝑡𝑃𝑙𝑎𝑛𝑡 𝑐𝑜𝑠𝑡𝑠 (𝑆𝑃𝑃𝐼)
𝑚𝑎𝑟𝑔𝑖𝑛 = 𝑂𝑢𝑡𝑝𝑢𝑡 𝑝𝑟𝑖𝑐𝑒
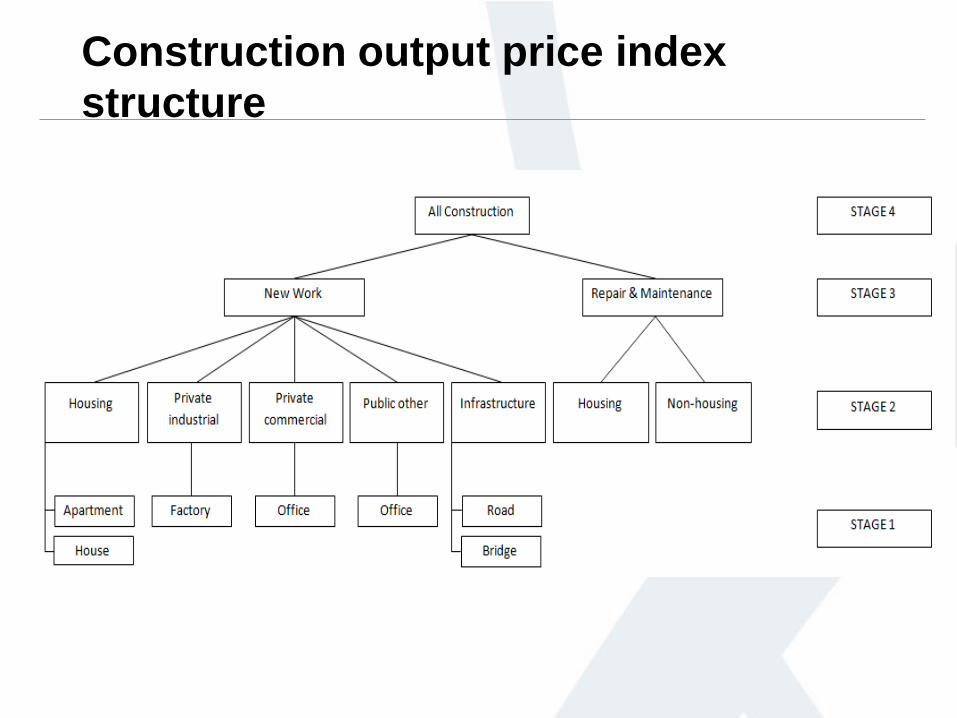
Construction output price index
structure

New work - projects
• Projects chosen from Purchasing Power
Parities standard construction projects as
representative of UK industry
Type of work Bill of quantity
Housing Detached house and apartment
Infrastructure Roads and bridges
Public Other New office building
Private Industrial Factory building
Private Commercial New office building

New work - Materials
• PPPs bills of quantities define the materials
and weights to use to create the materials
input costs
• Low-level producer Price Indices linked to
PPPs BoQ
• PPIs for single materials are weighted
together using PPPs BoQ
• Weights not updated on a regular basis
• Produce a materials index for each type of
project

Repair and maintenance - materials
• Not covered specifically in PPPs manual, no BoQ
available, no model projects available to price
• Materials selected using information from the Annual
Purchases survey
• Collects data on business’ expenditure on energy, services,
goods and materials
• Materials breakdown required
• Purchases returns linked to construction monthly
survey to identify sector (housing vs non-housing)
Labour
New work
• ONS Average Weekly Earnings for construction
excluding bonuses
• Average Weekly Earnings (AWE) measure of
average weekly earnings per employee.
• It is based on the Monthly Wages and Salaries
Survey (MWSS), which samples around 8,500
employers in Great Britain
Repair and Maintenance
• “Services for the regular repair of the dwelling” CPI –
combination of hourly rates for plumbers,
electricians, carpenters and decorators
• Use CPI weights to obtain a labour index

Plant
• SPPI for construction plant hire
• Change in price received by UK plant hire
companies when providing plant without an
operator to other UK companies and
government
• Quarterly figure
• Same SPPI index used throughout the index
structure

Index and weights structure
Stage 1Stage 2Stage 3Stage 4
All Construction
New Work
Housing
House
Apartment
Infrastructure
Road
Bridge
Private Industrial Factory
Private Commercial
Office
Public Other Office
Repair and Maintenance
Housing Repair and Maintenance
Non-Housing Repair and
Maintenance
Stage 0
Materials
Labour
Plant
Materials
Labour
Plant

Stage 1 weights
• Need to combine materials, labour and plant indices
• Data used to weight the individual labour, materials and plant
components for a construction business comes from the Annual
Business Survey (ABS) using 2015 data.
• Labour, material and plant ratios calculated for each business in
each sector
• Median ratios used

Stage 1 weights
• Housing weights used for both detached house and apartment block
• Infrastructure weight used for both road and bridge indices
• Other work weights used to price the factory and office project models

Stage 2 weights – new work only
• Two representative projects have been used for both housing
and infrastructure.
• The resulting indices having been weighted together using
weights estimated from data provided by Barbour ABI.
• The weights are fixed :
Housing – Detached house (65%) and Apartment building
(35%)
Infrastructure – Road (90%) and Bridge (10%)

Stage 3 weights
• Weights derived from ONS’s Output in the Construction Industry
release. Weights are updated annually as data becomes
available.
.
• 2017 weights were

Stage 4 weights
• Used to produced an overall Construction OPI
• Not directly used by National Accounts
• Weights obtained by ONS’s Output in the
Construction Industry release

Mark-up for profit margin/1
• Mark up represents difference between price
charged by company and its marginal cost
• Based on gross profit as focus on direct costs
of goods and not indirect fixed costs
• Data from 715 firms obtained from FAME
dataset from Bureau Van Dijk

Mark up for profit margin/2
• Annual mark up figures from FAME database
• Cubic spline applied to derive quarterly series
• Linear interpolation applied to obtain monthly
series

Main improvements between interim
and current methodology
• Mark up
• Plant element in the R&M sector
• Use of Purchases to design R&M materials
list
• Improved matching of PPIs to BoQ and R&M
materials list
• Improved method to derive stage 1 weights
• Changes to AWE to better account for small
businesses

OPI dissemination
• Monthly series are published on the quarterly
Construction Output Price Index (OPI)
statistical bulletin
• Reference tables with time series
• Quality and Methodology Information (QMI)
document
• Monthly deliveries to National Accounts
(Construction team)

Production systems
• Interim and final solution developed via a set of spreadsheets
• These use PPI, SPPI, AWE and CPI data
• They cover almost the whole OPI production, including:
AWE forecasting
SPPI monthly interpolation
Index weighting
Re-referencing
Markup monthly interpolation
Mark-up application
• They exclude:
SPPI forecast for latest quarter (in CSDB)
Annual mark-up calculation and quarterly interpolation
Weights calculations

Production system developments
• Between December 2017 and March 2018,
spreadsheets for NA deliveries redeveloped
in Python system
• Local system that will require migration to
new Data Access Platform
• Cut down production process to a few
minutes
• System currently being expanded to cover
OPI publication requirements

Future development
• Construction OPI methodology considered
now “final”
• Working alongside construction output team
to re-gain “National Statistics” status after de-
designation in 2014
• Some work around refinements in the mark
up calculation and data source
• Lot on development though on data sources,
particularly PPI and SPPI

Developments – sources
• Large programme of development on
Business Prices (PPI/SPPI). This includes:
o New classification (CPA 2.1)
o Introduction of chainlinking
o New sample designs
o New sampling frame and weights for SPPI
o SPPI move from B2B to B2All
o Services Export Price Index
o Improve SPPI timeliness
• Chainlinking expected to have the larger
impact on construction

Redevelopment: lessons learnt

Put users and experts at centre of
development• Absolutely key to involve users and technical
experts
• Understand requirements and use of the
indices
• Technical knowledge absolutely critical to
develop an indexo Range of construction activities
o Construction techniques
o Types of organisations involved in construction activities (e.g.
public vs private)
o Administrative arrangements for government authorisation of
construction projects (e.g. BOQ required?)

What ONS did…
• Decision to focus on deflator use of the index
Development work carried out very closely with
the Construction output team– new methodology
completely aligned with NA requirements
• Wider engagement outside ONS to get input into
the project
o Construction Statistics Steering Groupo Other government departments
o Industry experts
o Academics
o Consultative Committee for Construction Industry
Statistics
o Eurostat
Communicate change clearly and
timely
• Substantial methodological change
• Wider users need to be informed
• Widespread use in contract indexation –
users do not like to see change!

What ONS did…
• Updates on development at meetings with
various stakeholders
• Publication of detailed methodological papers
to communicate expected changes and
impact

Try to re-use existing data where
possible…
• New data collections are expensive
• New data collection represent an additional
burden to respondents and increase
compliance costs
• New methodology should look at maximising
secondary use of existing data sources

What ONS did…
• New methodology completely reliant on
existing and long established ONS data
sources
• Complemented by a small number of
privately owned datasets
• No increase in any compliance cost!

…but treat existing sources with
caution
• Different definitions
• Data originally collected for different purposes
and methods optimised accordingly
Sample designs are optimised for the primary use of
the data sources
Timeliness dictated by primary requirements

A couple of real examples/1…
• AWE data changed methodology to better capture small businesses.
This had a large impact on the construction earning index used for new
work
A couple of real examples/2…
• PPI sample allocated to minimise error around PPI
headline indicator
• PPI sample sizes for different products reflect weigth
(and variability) of that products category within
manufacturing output – not in terms of weigth as a
construction input!
• Small sample sizes for some of the PPI used for
construction materials
• Some PPI already had to be replaced

What ONS is doing now..
• Improve engagement with areas responsible
for different data sources, to ensure
Construction OPI requirements are
understood
• PPI and SPPI sample re-developed ensuring
construction needs can be met (e.g. minimum
sample sizes)

Contacts
Business Prices Production - [email protected]
Martina Portanti – [email protected]
Joshua Lloyd – [email protected]
Construction Statistics – [email protected]
John Allcoat– [email protected]
Ceri Lewis – [email protected]

Thank you
Obrigada
Gracias
Grazie

References
• Construction OPI publication
https://www.ons.gov.uk/businessindustryandtrade/constructionindustry/bulletins/constructionoutputpriceindicesopis/apriltoj
une2018
• Construction OPI QMI
https://www.ons.gov.uk/businessindustryandtrade/constructionindustry/methodologies/constructionoutputpriceindicesopisq
mi
• Construction development: Impact of improvements to construction statistics: September 2017
https://www.ons.gov.uk/businessindustryandtrade/constructionindustry/articles/constructiondevelopment/impactofimprove
mentstoconstructionstatistics
• Eurostat-OECD Methodological Manual on Purchasing Power Parities
https://www.oecd.org/sdd/prices-ppp/12-3012041ec014.pdf
• Construction OPI – BEIS new methodology
https://www.gov.uk/government/publications/construction-price-and-cost-indices-new-methodology
• Construction OPI – interim methodology
https://www.ons.gov.uk/businessindustryandtrade/constructionindustry/articles/interimsolutionforconstructionoutputpriceindi
ces/2015-06-12
• Uk Standard industrial classification
https://www.gov.uk/government/publications/standard-industrial-classification-of-economic-activities-sic
• EUROSTAT classfication of economic activity NACE
https://ec.europa.eu/eurostat/documents/3859598/5902521/KS-RA-07-015-EN.PDF
• Output in the construction industry – monthly publication
https://www.ons.gov.uk/businessindustryandtrade/constructionindustry/bulletins/constructionoutputingreatbritain/august201
8
• Construction new orders
https://www.ons.gov.uk/businessindustryandtrade/constructionindustry/datasets/newordersintheconstructionindustry
• Construction statistics, annual edition
https://www.ons.gov.uk/businessindustryandtrade/constructionindustry/articles/constructionstatistics/number192018edition

References(cont)
• Construction OPI reference tables
https://www.ons.gov.uk/businessindustryandtrade/constructionindustry/datasets/interimconstructionoutputpriceindices
• Construction QMI
https://www.ons.gov.uk/businessindustryandtrade/constructionindustry/methodologies/constructionoutputpriceindicesopisq
mi
• CPCI indices
https://www.gov.uk/government/statistics/bis-prices-and-cost-indices
• Langdon report on BIS construction indices
https://www.gov.uk/government/uploads/system/uploads/attachment_data/file/16480/Davis_Langdon_report_-
_BERR_final_revised_260310.doc
• Yu, M and Ive, G
“A review of construction cost and price indices in Britain”, in “ Measuring construction, Prices, Output and Productivity,
edited by Best, R and Meikle J, Routledge, 2015
• Average weekly earnings bullettin
https://www.ons.gov.uk/employmentandlabourmarket/peopleinwork/earningsandworkinghours/datasets/averageweeklyear
ningsbysectorearn02
• OECD and Eurostat, “Sources and methods of construction price indices”
http://www.oecd.org/industry/business-stats/2372435.pdf

UK construction industry
• Larger businesses (over 100 employees) account for
almost 40% of turnover and represent 0.3% of
businesses
• Relatively high contribution of small businesses (less
than 10 employees). Over 90% of businesses
accounting for around 32% of industry turnover
• Specific characteristic of the construction sector –
e.g. in Retail, small businesses represent only 13% of
turnover, with large businesses accounting for 74% of
industry turnover

Construction Breakdown
Public Housing Private
Housing
Infrastructure Other Work
•Local authority
housing
schemes
•Married quarters
for services and
police
•Old people’s
homes
•Orphanages
•Provision of
roads and
services within
housing sites
•Privately
owned buildings
for residential
use
oHouses
oFlats
oBungalows
oCottages
oVicarages
• Provision of
services to new
developments
•Water
•Sewerage
•Electricity
•Gas
•Communications
•Air Transport
•Railways
•Harbours
•Roads
Industrial
•Factories
•Warehouses
•Oil
•Steelworks
•Coal
Public Other / Private
Commercial
•Schools and colleges
•Universities
•Health
•Offices
•Entertainment
•Garages
•Shops
•Agriculture
•Everything else!

Monthly mark-up figure