Embed Size (px)
Citation preview

1
ESDS Government
Teaching DatasetExpenditure and Food
Survey 2005-6 Author: P.Walthery &
V.Higgins Version: 1.0 Date: October 2008
UK Data Archive Study Number 6117 - Expenditure and Food Survey, 2005-2006: Teaching Dataset

2
Contents Introduction to the Expenditure and Food Survey (EFS)……………..3 How to obtain the EFS Teaching Dataset……….………………………….5 Data and variables within the dataset………………………………………5 Weighting the dataset…………………………………………………………….5 List of variables in the Teaching Dataset..…………………………………7 Frequencies…………………………………………………………………………11

3
Introduction to the Expenditure and Food Survey
The Expenditure and Food Survey (EFS) is the result of more than two years' development work to bring together the Family Expenditure Survey and the National Food Survey. Both survey series were well established and important sources of information for government and the wider community, charting changes and patterns in Britain's spending and food consumption since the 1950s. From 2001-2002, both series are completely replaced by the EFS. The Office for National Statistics (ONS) has overall project management and financial responsibility for the EFS, whilst the Department for Environment, Food, and Rural Affairs (DEFRA) sponsors the food data. As with the FES and NFS, the EFS continues to be primarily used to provide information for the Retail Prices Index, National Accounts estimates of household expenditure, the analysis of the effect of taxes and benefits, and trends in nutrition. The results, however, are multi-purpose, providing an invaluable supply of economic and social data. The merger of the two surveys also brings benefits for users, as a single survey on food expenditure removes the difficulties of reconciling data from two sources. The EFS sample for Great Britain is a multi-stage stratified random sample with clustering. It is drawn from the Small Users file of the Postcode Address File (PAF)- the Post Office’s list of addresses. All Scottish offshore islands and the Isles of Scilly are excluded from the sample because of excessive interview travel costs. Postal sectors are the primary sample unit. Six hundred and seventy two postal sectors are randomly selected during the year after being arranged in strata defined by Government Office Regions (sub-divided into metropolitan and non-metropolitan areas) and two 2001 Census variables – socio-economic group and ownership of cars. The Northern Ireland sample is drawn as a random sample of addresses from the Valuation and Lands Agency list. The survey is continuous, interviews being spread evenly over the year to ensure that seasonal effects are covered.
The EFS is a voluntary sample survey of private households. The basic unit of the survey is the household. The definition of a household used by ONS is: “One person or a group of people who have the accommodation as their only or main residence AND (for a group) either share at least one meal a day or share the living accommodation, that is, a living room or sitting room”
Each individual aged 16 or over in the household visited is asked to keep diary records of daily expenditure for two weeks. Information about regular expenditure, such as rent and mortgage payments, is obtained from a household interview along with retrospective information on certain large, infrequent expenditures such as those on vehicles. Since 1998/99 the results have also included information from simplified diaries kept by children aged between 7 and 15.
4
Household level data gives information on the characteristics of entire households, and so this will be identical for every person in a given household. For example, information on utility bills will be the same for each person as this relates to the household. Household level data provide details on the entire expenditure on a certain type of item for households (E.g. how much the entire household spends on a type of milk, or on satellite television). This information is obtained through aggregating information contained in individual level diary files, or from the household or income questionnaires. Such data can be used for household level analysis or be linked to individual level data. The EFS is predominantly designed to be used as a household level survey both in its sample design and in the topics it seeks to address. Household level analysis can often be more suitable for analysing expenditure, particularly where items are shared between household members. For example, households often have a ‘primary shopper’ who shops for food on a regular basis. Although expenditure does not directly inform us about consumption, looking at household level expenditure on groceries can give a clearer picture of what people actually consume than individual level expenditure. If we alternatively examined individual expenditure, those who were not primary shoppers would look like they consumed very little whereas the primary shopper would look like they consumed a lot. A more sensible approach would be to share the overall household level of expenditure on food between household members in some way. The EFS uses the European Standard Classification of Individual Consumption by Purpose (COICOP) for coding expenditure items.
5
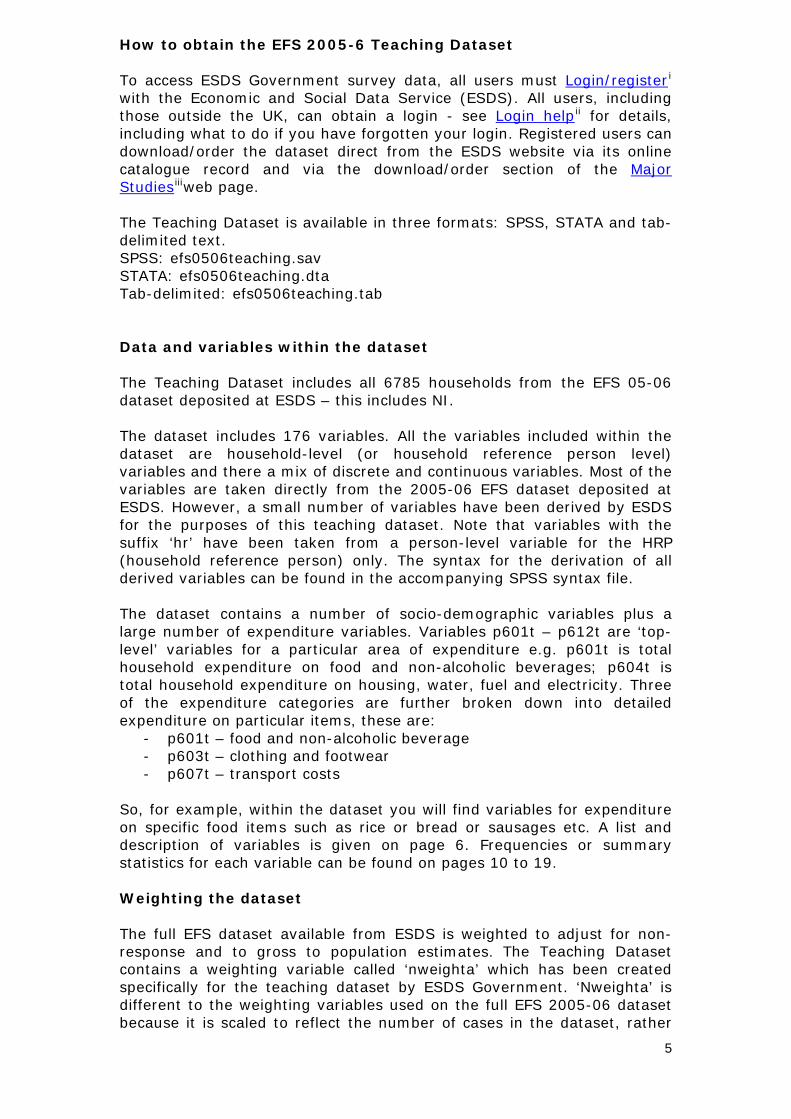
How to obtain the EFS 2005-6 Teaching Dataset To access ESDS Government survey data, all users must Login/registeri with the Economic and Social Data Service (ESDS). All users, including those outside the UK, can obtain a login - see Login helpii for details, including what to do if you have forgotten your login. Registered users can download/order the dataset direct from the ESDS website via its online catalogue record and via the download/order section of the Major Studiesiiiweb page. The Teaching Dataset is available in three formats: SPSS, STATA and tab-delimited text. SPSS: efs0506teaching.sav STATA: efs0506teaching.dta Tab-delimited: efs0506teaching.tab Data and variables within the dataset The Teaching Dataset includes all 6785 households from the EFS 05-06 dataset deposited at ESDS – this includes NI. The dataset includes 176 variables. All the variables included within the dataset are household-level (or household reference person level) variables and there a mix of discrete and continuous variables. Most of the variables are taken directly from the 2005-06 EFS dataset deposited at ESDS. However, a small number of variables have been derived by ESDS for the purposes of this teaching dataset. Note that variables with the suffix ‘hr’ have been taken from a person-level variable for the HRP (household reference person) only. The syntax for the derivation of all derived variables can be found in the accompanying SPSS syntax file. The dataset contains a number of socio-demographic variables plus a large number of expenditure variables. Variables p601t – p612t are ‘top-level’ variables for a particular area of expenditure e.g. p601t is total household expenditure on food and non-alcoholic beverages; p604t is total household expenditure on housing, water, fuel and electricity. Three of the expenditure categories are further broken down into detailed expenditure on particular items, these are:
- p601t – food and non-alcoholic beverage - p603t – clothing and footwear - p607t – transport costs
So, for example, within the dataset you will find variables for expenditure on specific food items such as rice or bread or sausages etc. A list and description of variables is given on page 6. Frequencies or summary statistics for each variable can be found on pages 10 to 19. Weighting the dataset The full EFS dataset available from ESDS is weighted to adjust for non-response and to gross to population estimates. The Teaching Dataset contains a weighting variable called ‘nweighta’ which has been created specifically for the teaching dataset by ESDS Government. ‘Nweighta’ is different to the weighting variables used on the full EFS 2005-06 dataset because it is scaled to reflect the number of cases in the dataset, rather

6
than the number in the population of England. The purpose of ‘nweighta’ is to adjust for non-response.

7
List of variables in the Teaching Dataset The following table lists the variables within the Teaching Dataset and gives a short description of each. A frequency count of each variable can be found in the next section of this guide. The Data Documents1 on the EFS 2005-6 pages of the UKDA website give more information about the derived variables used in the Teaching Dataset Name Description case Case number a040 Number of children in the household -age under 2 a041 Number of children in the household - age 2 and under 5 a042 Number of children in the household - age 5 and under 18 a049 Household size a062 Composition of household a094 NS-SEC 8 Class of Household Reference Person a122 Tenure type - harmonised a172 Internet connection in household p493p Wealthy household – anonymised p389 Normal weekly disposable household income incanon Household income + allowances - anonymised p396p Age of HRP - anonymised sexhrp Sex of household reference person gor GOR government office region a124 Cars and vans in household Eqincm Equivalised income (McClements scale) Eqinco Equivalised income (OECD scale) a003 Household Reference Person a012p Ethnic origin of HRP – anonymised hra010 Age completed continuous full time education hra201 Employment status - harmonised (ES2000) hra227 Incapacity benefit - receiving at present hra229 Income support - receiving at present hrwkgross Gross pay – amount hrb329 Usual net pay – employee nhhinwk No. in household in work
nweighta Annual weight rescaled
p601t Total food & non-alcoholic beverage C11111t Rice C11121t Bread C11122t Buns, crispbread and biscuits C11131t Pasta products C11141t Cake and puddings C11142t Pastry (savoury) C11151t Other breads and cereal C11211t Beef (fresh, chilled or frozen) C11221t Pork (fresh, chilled or frozen) C11231t Lamb (fresh, chilled or frozen) C11241t Poultry (fresh, chilled or frozen) C11251t Sausages
1 http://www.esds.ac.uk/findingData/snDescription.asp?sn=5688#doc

8
C11252t Bacon and Ham C11253t Offal, Pate etc C11261t Other preserved or processed meat C11271t Other fresh, chilled or frozen edible meat C11311t Fish (fresh, chilled or frozen) C11321t Seafood (fresh, chilled or frozen) C11331t Dried, smoked or salted fish and seafood C11341t Other preserved/processed fish/seafood, fish./seafood preparations C11411t Whole milk C11421t Low fat milk C11431t Preserved milk C11441t Yoghurt C11451t Cheese and curd C11461t Other milk products C11471t Eggs C11511t Butter C11521t Margarine and other vegetable fats C11522t Peanut butter C11531t Olive oil C11541t Edible oils C11551t Other edible animal fats C11611t Citrus fruits (fresh) C11621t Bananas (fresh) C11631t Apples (fresh) C11641t Pears (fresh) C11651t Stone fruits (fresh) C11661t Berries (fresh) C11671t Other fresh, chilled or frozen fruits C11681t Dried fruit and nuts C11691t Preserved fruit and fruit-based products C11711t Leaf and stem vegetables (fresh or chilled) C11721t Cabbages (fresh or chilled) C11731t Vegetables grown for their fruit (fresh, chilled or frozen) C11741t Root crops, non-starchy bulbs, mushrooms (fresh, chilled or frozen) C11751t Dried vegetables C11761t Other preserved or processed vegetables C11771t Potatoes C11781t Other tubers and products of tuber vegetables C11811t Sugar C11821t Jams, marmalades C11831t Chocolate C11841t Confectionery products C11851t Edible ices and ice creams C11861t Other sugar products C11911t Sauces, condiments C11921t Salt, spices and culinary herbs C11931t Bakers yeast, dessert preparations, soups C11941t Other food products C12111t Coffee C12121t Tea C12131t Cocoa and powdered chocolate C12211t Mineral or spring waters C12221t Soft drinks C12231t Fruit juices
9
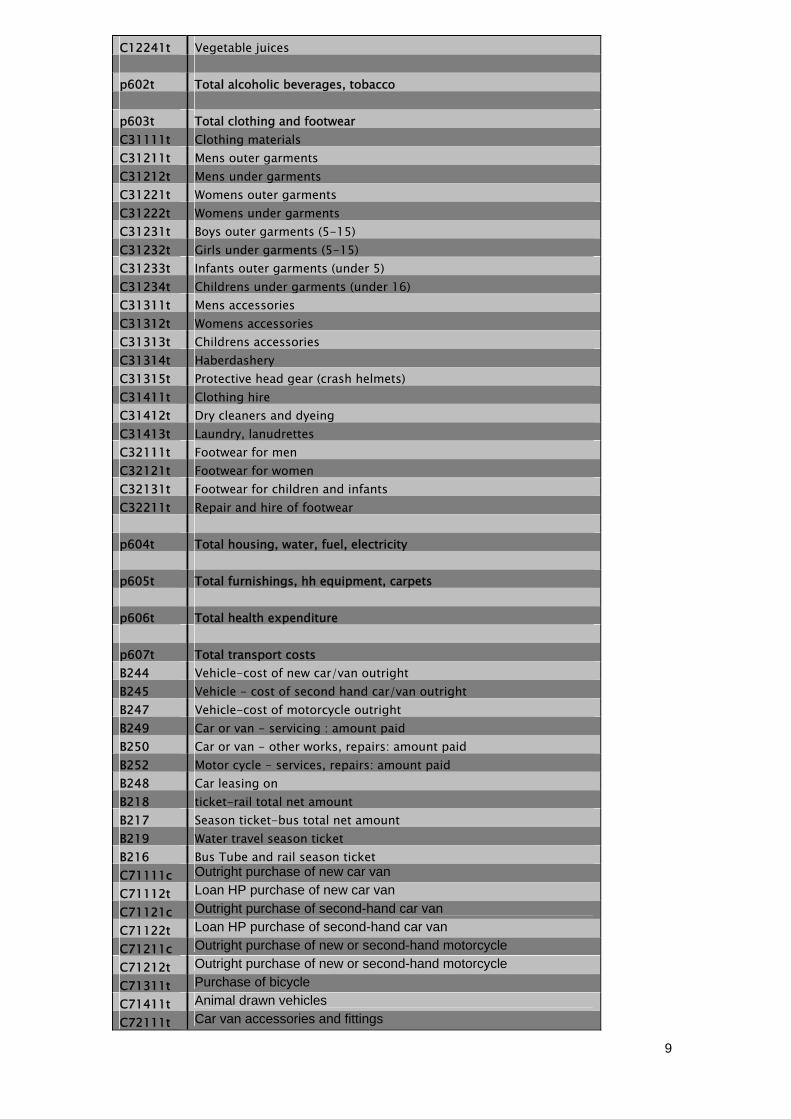
C12241t Vegetable juices p602t Total alcoholic beverages, tobacco p603t Total clothing and footwear C31111t Clothing materials C31211t Mens outer garments C31212t Mens under garments C31221t Womens outer garments C31222t Womens under garments C31231t Boys outer garments (5-15) C31232t Girls under garments (5-15) C31233t Infants outer garments (under 5) C31234t Childrens under garments (under 16) C31311t Mens accessories C31312t Womens accessories C31313t Childrens accessories C31314t Haberdashery C31315t Protective head gear (crash helmets) C31411t Clothing hire C31412t Dry cleaners and dyeing C31413t Laundry, lanudrettes C32111t Footwear for men C32121t Footwear for women C32131t Footwear for children and infants C32211t Repair and hire of footwear p604t Total housing, water, fuel, electricity p605t Total furnishings, hh equipment, carpets p606t Total health expenditure p607t Total transport costs B244 Vehicle-cost of new car/van outright B245 Vehicle - cost of second hand car/van outright B247 Vehicle-cost of motorcycle outright B249 Car or van - servicing : amount paid B250 Car or van - other works, repairs: amount paid B252 Motor cycle - services, repairs: amount paid B248 Car leasing on B218 ticket-rail total net amount B217 Season ticket-bus total net amount B219 Water travel season ticket B216 Bus Tube and rail season ticket C71111c Outright purchase of new car van C71112t Loan HP purchase of new car van C71121c Outright purchase of second-hand car van C71122t Loan HP purchase of second-hand car van C71211c Outright purchase of new or second-hand motorcycle C71212t Outright purchase of new or second-hand motorcycle C71311t Purchase of bicycle C71411t Animal drawn vehicles C72111t Car van accessories and fittings

10
C72112t Car van spare parts C72113t Motor cycle accessories and spare parts C72114t Anti-freeze, battery water, cleaning materials C72115t Bicycle accessories, repairs and other costs C72211t Petrol C72212t Diesel oil C72213t Other motor oils C72311c Car or van repairs and servicing C72312c Motor cycle repairs, service C72313t Motoring organisation subscription (eg AA and RAC)
C72314t Car washing and breakdown services C72411t Parking fees, tolls, and permits (excluding motoring fines) C72412t Garage rent, other costs (excluding fines) C72413t Driving lessons C72414t Hire of self-drive cars, vans, bicycles C73112t Railway and tube fares other than season C73212t Bus and coach fares other than season tickets C73213t Taxis and hired cars with drivers C73214t Other personal travel C73311t Air fares (within UK) C73312t Air fares (international) C73411t Water travel C73512t Combined fares other than season tickets C73513t School travel c73611t Delivery charges and other transport ser p608t Total communication p609t Total recreation p610t Total education p611t Total restaurants and hotels p612t Total miscellaneous goods and services p600t Total consumption expenditure p620tp Total non consumption expenditure (anonymised) p630tp Total expenditure (anonymised)

Frequencies The following frequencies (for categorical variables) and summary statistics (for continuous variables) come from the unweighted SPSS Teaching Dataset (EFS0506teaching.sav).
A040 Number of children children-age under 2
6414 94.5 94.5 94.5352 5.2 5.2 99.7
19 .3 .3 100.06785 100.0 100.0
012Total
ValidFrequency Percent Valid Percent
CumulativePercent
A041 Number of children - age 2 and under 5
6244 92.0 92.0 92.0472 7.0 7.0 99.0
68 1.0 1.0 100.01 .0 .0 100.0
6785 100.0 100.0
0126Total
ValidFrequency Percent Valid Percent
CumulativePercent
A042 Number of children - age 5 and under 18
5049 74.4 74.4 74.4882 13.0 13.0 87.4617 9.1 9.1 96.5177 2.6 2.6 99.1
45 .7 .7 99.810 .1 .1 99.9
5 .1 .1 100.06785 100.0 100.0
0123456Total
ValidFrequency Percent Valid Percent
CumulativePercent
A049 Household size
1906 28.1 28.1 28.12502 36.9 36.9 65.01034 15.2 15.2 80.2
890 13.1 13.1 93.3304 4.5 4.5 97.8
97 1.4 1.4 99.228 .4 .4 99.613 .2 .2 99.8
4 .1 .1 99.94 .1 .1 100.02 .0 .0 100.01 .0 .0 100.0
6785 100.0 100.0
123456789101113Total
ValidFrequency Percent Valid Percent
CumulativePercent
11

A062 Composition of Household
803 11.8 11.8 11.81103 16.3 16.3 28.1
35 .5 .5 28.6201 3.0 3.0 31.6
10 .1 .1 31.7230 3.4 3.4 35.1
2099 30.9 30.9 66.0
167 2.5 2.5 68.5
518 7.6 7.6 76.121 .3 .3 76.4
613 9.0 9.0 85.52 .0 .0 85.5
196 2.9 2.9 88.41 .0 .0 88.4
50 .7 .7 89.211 .2 .2 89.3
7 .1 .1 89.4335 4.9 4.9 94.4
99 1.5 1.5 95.848 .7 .7 96.518 .3 .3 96.811 .2 .2 96.9
121 1.8 1.8 98.728 .4 .4 99.121 .3 .3 99.511 .2 .2 99.611 .2 .2 99.8
8 .1 .1 99.97 .1 .1 100.0
6785 100.0 100.0
1 One man2 One woman3 One man; one child4 One woman; one child5 One man; 2 plus c6 One woman; 2 plus c7 One man and 1 woman8 Two men or twowomen9 1 man; 1 woman & 1c10 2 men or 2 women; 1c11 1 man; 1 woman; 2c12 2 men or 2 women; 2c13 1 man; 1 woman; 3c14 2 men or 2 women; 3c15 Two adults; 4c16 Two adults; 5c17 Two adults; 6+c18 Three adults19 Three adults; 1c20 Three adults; 2c21 Three adults; 3c22 Three adults; 4+c23 Four adults24 Four adults; 1c25 Four adults; 2+c26 Five adults27 Five adults; 1+c28 Six or more adults30 Other hholds with cTotal
ValidFrequency Percent Valid Percent
CumulativePercent
A094 NS-SEC 8 Class of Household Reference Person
Frequency Percent Valid Percent Cumulative
Percent 1 Large Employers & Higher Managerial 283 4.2 4.2 4.2
2 Higher Professionals 410 6.0 6.0 10.2 3 Lower Managerial & Professionals 1219 18.0 18.0 28.2
4 Intermediate 373 5.5 5.5 33.7 5 Small Employers and Own Account Workers 422 6.2 6.2 39.9
6 Lower Supervisory & Technical 434 6.4 6.4 46.3
7 Semi-Routine 498 7.3 7.3 53.6 8 Routine 436 6.4 6.4 60.1 9 Never Worked and Long-Term Unemployed 145 2.1 2.1 62.2
Valid
10 Students 90 1.3 1.3 63.5
12
11 Occupation not stated 56 .8 .8 64.3 12 Not classifiable for other reasons 2419 35.7 35.7 100.0
Total 6785 100.0 100.0
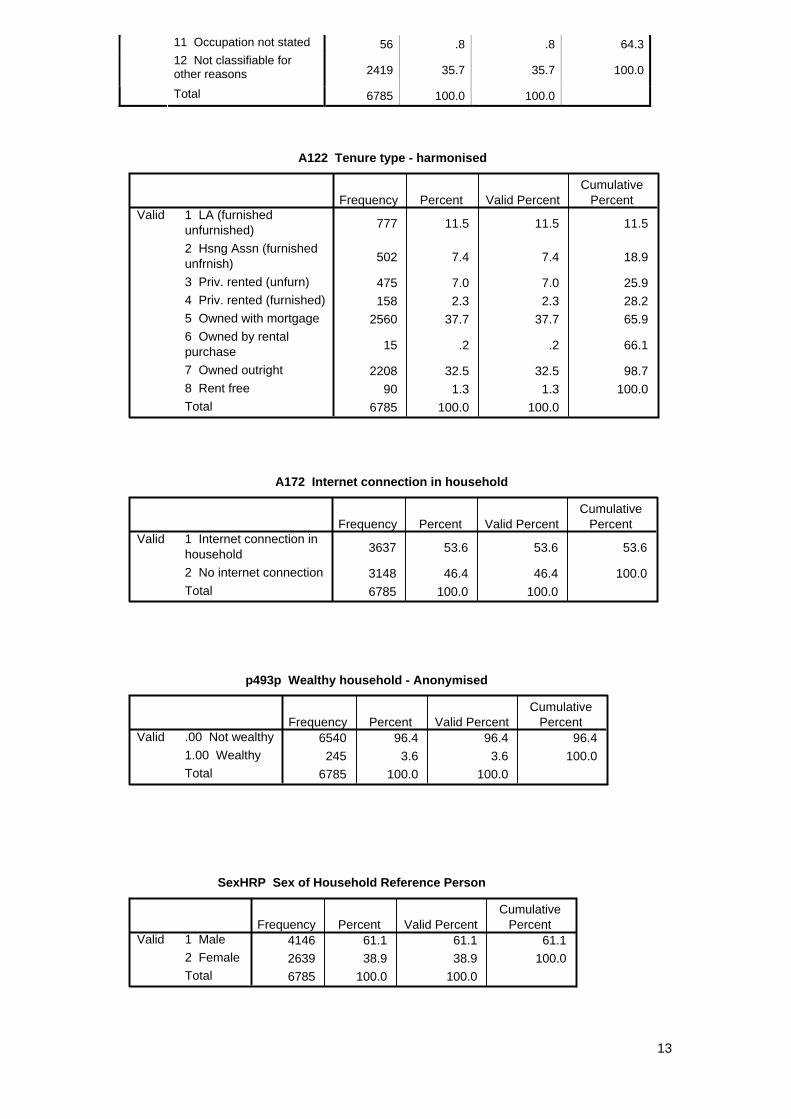
A122 Tenure type - harmonised
777 11.5 11.5 11.5
502 7.4 7.4 18.9
475 7.0 7.0 25.9158 2.3 2.3 28.2
2560 37.7 37.7 65.9
15 .2 .2 66.1
2208 32.5 32.5 98.790 1.3 1.3 100.0
6785 100.0 100.0
1 LA (furnishedunfurnished)2 Hsng Assn (furnishedunfrnish)3 Priv. rented (unfurn)4 Priv. rented (furnished)5 Owned with mortgage6 Owned by rentalpurchase7 Owned outright8 Rent freeTotal
ValidFrequency Percent Valid Percent
CumulativePercent
A172 Internet connection in household
3637 53.6 53.6 53.6
3148 46.4 46.4 100.06785 100.0 100.0
1 Internet connection inhousehold2 No internet connectionTotal
ValidFrequency Percent Valid Percent
CumulativePercent
p493p Wealthy household - Anonymised
6540 96.4 96.4 96.4245 3.6 3.6 100.0
6785 100.0 100.0
.00 Not wealthy1.00 WealthyTotal
ValidFrequency Percent Valid Percent
CumulativePercent
SexHRP Sex of Household Reference Person
4146 61.1 61.1 61.12639 38.9 38.9 100.06785 100.0 100.0
1 Male2 FemaleTotal
ValidFrequency Percent Valid Percent
CumulativePercent
13

Gor Government Office Region
280 4.1 4.1 4.1575 8.5 8.5 12.6147 2.2 2.2 14.8
582 8.6 8.6 23.3
508 7.5 7.5 30.8538 7.9 7.9 38.8577 8.5 8.5 47.3601 8.9 8.9 56.1937 13.8 13.8 69.9614 9.0 9.0 79.0332 4.9 4.9 83.9567 8.4 8.4 92.2527 7.8 7.8 100.0
6785 100.0 100.0
1 North East2 North West3 Merseyside4 Yorkshire and theHumber5 East Midlands6 West Midlands7 Eastern8 London9 South East10 South West11 Wales12 Scotland13 Northern IrelandTotal
ValidFrequency Percent Valid Percent
CumulativePercent
A124 Cars and vans in household
1760 25.9 25.9 25.93159 46.6 46.6 72.51557 22.9 22.9 95.4235 3.5 3.5 98.9
55 .8 .8 99.714 .2 .2 99.9
1 .0 .0 99.94 .1 .1 100.0
6785 100.0 100.0
01234567Total
ValidFrequency Percent Valid Percent
CumulativePercent
A003 Household Reference Person
Frequency Percent Valid Percent Cumulative
Percent Valid 1 HRP 6785 100.0 100.0 100.0
a012p Ethnic origin of HRP - anonymised
Frequency Percent Valid Percent Cumulative
Percent 1 White 6337 93.4 93.7 93.7 2 Mixed race 41 .6 .6 94.3 3 Asian 223 3.3 3.3 97.6 4 Black 112 1.7 1.7 99.2 5 Other 52 .8 .8 100.0
Valid
Total 6765 99.7 100.0 Missing System 20 .3 Total 6785 100.0
14

15
hra010 Age completed continuous full time education
Frequency Percent Valid Percent Cumulative
Percent 10 6 .1 .1 .1 11 7 .1 .1 .2 12 8 .1 .1 .3 13 34 .5 .5 .8 14 703 10.4 10.4 11.2 15 1408 20.8 20.9 32.1 16 1954 28.8 29.0 61.1 17 578 8.5 8.6 69.7 18 656 9.7 9.7 79.4 19 179 2.6 2.7 82.1 20 131 1.9 1.9 84.0 21 400 5.9 5.9 89.9 22 288 4.2 4.3 94.2 23 169 2.5 2.5 96.7 24 95 1.4 1.4 98.1 25 51 .8 .8 98.9 26 22 .3 .3 99.2 27 17 .3 .3 99.5 28 8 .1 .1 99.6 29 7 .1 .1 99.7 30 4 .1 .1 99.7 31 3 .0 .0 99.8 32 1 .0 .0 99.8 44 1 .0 .0 99.8 97 12 .2 .2 100.0
Valid
Total 6742 99.4 100.0 Missing System 43 .6 Total 6785 100.0
hra201 Employment status - harmonised (ES2000)
Frequency Percent Valid Percent Cumulative
Percent 0 Not recorded 2653 39.1 39.1 39.1 1 Self-employed : large establishment (25+ 8 .1 .1 39.2
2 Self-employed : small establishment (1-2 90 1.3 1.3 40.5
3 Self-employed : no employees 442 6.5 6.5 47.1
4 Manager : large establishment (25+ emplo 428 6.3 6.3 53.4
5 Manager : small establishment (1-24 empl 221 3.3 3.3 56.6
6 Foreman or supervisor 914 13.5 13.5 70.1 7 Employee (not elsewhere classified) 2029 29.9 29.9 100.0
Valid
Total 6785 100.0 100.0

16
hra229 Income support - receiving at present
Frequency Percent Valid Percent Cumulative
Percent 0 Not applicable 6350 93.6 93.6 93.6 1 Receiving at present 432 6.4 6.4 100.0 2 Not receiving at present 3 .0 .0 100.0
Valid
Total 6785 100.0 100.0 nhhinwk no. in household in work
Frequency Percent Valid Percent Cumulative
Percent .00 2333 34.4 34.4 34.41.00 1943 28.6 28.6 63.02.00 2048 30.2 30.2 93.23.00 327 4.8 4.8 98.04.00 112 1.7 1.7 99.75.00 19 .3 .3 100.06.00 2 .0 .0 100.09.00 1 .0 .0 100.0
Valid
Total 6785 100.0 100.0

17
Descriptive Statistics forf continuous variables N Minimum Maximum Mean p396p Age of HRP - anonymised 6785 10 80 51.80
P389 Normal weekly disposable hhld income 6785 -995.0 20736.5 488.920
incanon Anonymised hhold inc + allowances 6785 .00 27236.14 613.0242
EqIncM Equivalised income (McClements Scale) 6785 .00 15834.97 560.9682
EqIncO Equivalised income (OECD Scale) 6785 .00 10894.46 368.7135
Hrwkgross Gross pay – amount
6785 .00 10192.3 257.648
Hrb329 Usual net pay – employee
6785 .00 1364.2 10.196
Nweighta
6785 .00 3.24 1.0000
P601t EFS: Total Food & non-alcoholic beverage 6785 .0 329.2 45.559
P602t EFS: Total Alcoholic Beverages, Tobacco 6785 .0 267.0 10.889
P603t EFS: Total Clothing and Footwear 6785 .0 748.8 22.499
P604t EFS: Total Housing, Water, Electricity 6785 -.5 2596.2 42.900
P605t EFS: Total Furnishings, HH Equipment, Carpets 6785 .0 2034.0 30.118
P606t EFS: Total Health expenditure 6785 .0 1900.0 5.441
P607t EFS: Total Transport costs 6785 -286.7 2246.4 60.296
P608t EFS: Total Communication 6785 .0 232.6 11.698
P609t EFS: Total Recreation 6785 .0 1928.2 57.104
P610t EFS: Total Education 6785 .0 1846.2 6.416
P611t EFS: Total Restaurants and Hotels 6785 .0 636.3 35.707
P612t EFS: Total Miscellaneous Goods and Services 6785 .0 1175.1 34.262
P600t EFS: Total consumption expenditure 6785 2.4 5987.2 362.890
P620tp EFS: Total Non Consumption Expenditure (anonymised) 6785 .0 10243.1 95.006
P630tp EFS: Total Expenditure (anonymised) 6785 2.4 10884.0 457.896

18
C11111t Rice 6785 .000 25.000 .22501
C11121t Bread 6785 .000 27.945 2.17753
C11122t Buns, crispbread and biscuits 6785 .000 42.310 1.60471
N Minimum Maximum Mean C11131t Pasta products 6785 .000 6.650 .29857
C11141t Cakes and puddings 6785 .000 42.500 1.36942
C11142t Pastry (savoury) 6785 .000 28.095 .63996
C11151t Other breads and cereals 6785 .000 16.185 1.71705
C11211t Beef (fresh, chilled or frozen) 6785 .000 45.600 1.55204
C11221t Pork (fresh, chilled or frozen) 6785 .000 45.120 .54049
C11231t Lamb (fresh, chilled or frozen) 6785 .000 48.235 .64015
C11241t Poultry (fresh, chilled or frozen) 6785 .000 37.625 1.72165
C11251t Sausages 6785 .000 13.665 .61127
C11252t Bacon and ham 6785 .000 16.225 .86362
C11253t Offal, pâté etc 6785 .000 8.170 .09919
C11261t Other preserved or processed meat and meat preparations
6785 .000 57.430 4.11391
C11271t Other fresh, chilled or frozen edible meat 6785 .000 75.000 .02459
C11311t Fish (fresh, chilled or frozen) 6785 .000 46.875 .67820
C11321t Seafood (fresh, chilled or frozen) 6785 .000 20.905 .24142
C11331t Dried, smoked or salted fish and seafood 6785 .000 22.000 .19446
C11341t Other preserved/ processed fish/ seafood, fish/ seafood preparations 6785 .000 22.200 .90141
C11411t Whole milk 6785 .000 22.265 .62241
C11421t Low fat milk 6785 .000 21.005 1.53667
C11431t Preserved milk 6785 .000 15.780 .14435
C11441t Yoghurt 6785 .000 11.790 .87200
C11451t Cheese and curd 6785 .000 57.345 1.47076
C11461t Other milk products 6785 .000 13.375 .73636
6785 .000 6.785 .45136

19
C11471t Eggs
C11511t Butter 6785 .000 7.570 .28292
C11521t Margarine and other vegetable fats 6785 .000 7.860 .41171
C11522t Peanut butter 6785 .000 2.370 .01899
N Minimum Maximum Mean C11531t Olive oil 6785 .000 10.495 .10402
C11541t Edible oils 6785 .000 16.075 .08480
C11551t Other edible animal fats 6785 .000 3.570 .01936
C11611t Citrus fruits (fresh) 6785 .000 13.960 .44822
C11621t Bananas (fresh) 6785 .000 8.800 .50255
C11631t Apples (fresh) 6785 .000 10.750 .51204
C11641t Pears (fresh) 6785 .000 4.220 .14389
C11651t Stone fruits (fresh) 6785 .000 12.725 .39218
C11661t Berries (fresh) 6785 .000 23.400 .80452
C11671t Other fresh, chilled or frozen fruits 6785 .000 14.345 .27039
C11681t Dried fruit and nuts 6785 .000 18.680 .48353
C11691t Preserved fruit and fruit-based products 6785 .000 5.990 .13970
C11711t Leaf and stem vegetables (fresh or chilled) 6785 .000 23.245 .69875
C11721t Cabbages (fresh or chilled) 6785 .000 6.795 .40037
C11731t Vegetables grown for their fruit (fresh, chilled or frozen)
6785 .000 17.455 1.15377
C11741t Root crops, non-starchy bulbs, mushrooms (fresh/chilled/ frozen) 6785 .000 30.500 1.11068
C11751t Dried vegetables 6785 .000 7.685 .02757
C11761t Other preserved or processed vegetables 6785 .000 22.890 1.04054
C11771t Potatoes 6785 .000 27.835 .69956
C11781t Other tubers and products of tuber vegetables 6785 .000 19.295 1.17286
C11811t Sugar 6785 .000 5.375 .23179
C11821t Jams, marmalades 6785 .000 9.000 .23111
C11831t Chocolate 6785 .000 51.000 1.33309

20
C11841t Confectionery products 6785 .000 15.400 .54083
C11851t Edible ices and ice cream 6785 .000 18.180 .45892
C11861t Other sugar products 6785 .000 6.030 .06552
C11911t Sauces, condiments 6785 .000 16.250 .97080
N Minimum Maximum Mean C11921t Salt, spices and culinary herbs 6785 .000 24.000 .15016
C11931t Bakers yeast, dessert preparations, soups 6785 .000 37.000 .72840
C11941t Other food products 6785 .000 87.385 .09984
C12111t Coffee 6785 .000 27.350 .47774
C12121t Tea 6785 .000 16.770 .42162
C12131t Cocoa and powdered chocolate 6785 .000 6.890 .09693
C12211t Mineral or spring waters 6785 .000 17.505 .23551
C12221t Soft drinks 6785 .000 74.285 1.53441
C12231t Fruit juices 6785 .000 20.895 .99862
C12241t Vegetable juices 6785 .000 5.810 .01190
C31111t Clothing materials 6785 .000 59.500 .08434
C31211t Mens outer garments 6785 .000 349.000 4.08683
C31212t Mens under garments 6785 .000 52.000 .36755
C31221t Womens outer garments 6785 .000 473.750 8.11843
C31222t Womens under garments 6785 .000 67.490 1.20402
C31231t Boys outer garments (5-15) 6785 .000 91.400 .82020
C31232t Girls outer garments (5-15) 6785 .000 106.000 1.09271
C31233t Infants outer garments (under 5) 6785 .000 71.000 .73697
C31234t Childrens under garments (under 16) 6785 .000 35.500 .39831
C31311t Mens accessories 6785 .000 44.000 .25114
C31312t Womens accessories 6785 .000 75.495 .36753
C31313t Childrens accessories 6785 .000 14.995 .11292
C31314t Haberdashery 6785 .000 36.130 .11698
C31315t Protective head gear (crash helmets) 6785 .000 19.500 .01316

21
C31411t Clothing hire 6785 .000 29.750 .06081
C31412t Dry cleaners and dyeing 6785 .000 44.750 .21328
C31413t Laundry, laundrettes 6785 .000 15.100 .02900
C32111t Footwear for men 6785 .000 150.000 1.36278
N Minimum Maximum Mean C32121t Footwear for women 6785 .000 125.000 2.13964
C32131t Footwear for children and infants 6785 .000 87.995 .86813
C32211t Repair and hire of footwear 6785 .000 25.000 .05463
C71111c Outright purchase of new car van 6785 .000 .000 .00000
C71112t Loan HP purchase of new car van 6785 .000 807.311 3.39931
C71121c Outright purchase of second-hand car van 6785 .000 .000 .00000
C71122t Loan HP purchase of second-hand car van 6785 .000 1400.002 4.12090
C71211c Outright purchase of new or second-hand motorcycle
6785 .000 78.490 .01157
C71212t Outright purchase of new or second-hand motorcycle
6785 .000 47.462 .05336
C71311t Purchase of bicycle 6785 .000 119.232 .16221
C71411t Animal drawn vehicles 6785 .000 126.500 .01864
C72111t Car van accessories and fittings 6785 .000 247.495 .22136
C72112t Car van spare parts 6785 .000 875.000 1.46877
C72113t Motor cycle accessories and spare parts 6785 .000 126.900 .09317
C72114t Anti-freeze, battery water, cleaning materials 6785 .000 70.000 .11261
C72115t Bicycle accessories, repairs and other costs 6785 .000 218.720 .18229
C72211t Petrol 6785 .000 295.000 13.97323
C72212t Diesel oil 6785 .000 180.000 3.42253
C72213t Other motor oils 6785 .000 160.000 .07570
C72311c Car or van repairs and servicing 6785 .000 .000 .00000
C72312c Motor cycle repairs, service 6785 .000 .000 .00000

22
C72313t Motoring organisation subscription (eg AA and RAC)
6785 .000 86.500 .40450
C72314t Car washing and breakdown services 6785 .000 29.500 .13324
C72411t Parking fees, tolls, and permits (excluding motoring fines)
6785 .000 375.990 .74807
N Minimum Maximum Mean C72412t Garage rent, other costs (excluding fines) 6785 .000 125.830 .40964
C72413t Driving lessons 6785 .000 120.000 .42794
C72414t Hire of self-drive cars, vans, bicycles 6785 .000 178.500 .17304
C73112t Railway and tube fares other than season 6785 .000 204.000 1.27582
C73212t Bus and coach fares other than season tickets 6785 .000 74.775 1.02645
C73213t Taxis and hired cars with drivers 6785 .000 125.000 1.22008
C73214t Other personal travel 6785 .000 37.500 .12070
C73311t Air fares (within UK) 6785 .000 189.350 .22165
C73312t Air fares (international) 6785 .000 1497.500 2.07295
C73411t Water travel 6785 .000 155.305 .15062
C73512t Combined fares other than season tickets 6785 .000 55.450 .15250
C73513t School travel 6785 .000 35.000 .03026
C73611t Delivery charges and other transport ser 6785 .000 57.500 .06436
B216 Bus Tube and\or rail season ticket 6785 .0 180.0 .610
B217 Season ticket-bus\coach-total net amount 6785 .0 70.4 .341
B218 Season ticket-rail\tube-total net amount 6785 .0 230.5 .603
B219 Water travel season ticket 6785 .0 8.4 .001
B244 Vehicle-cost of new car|van outright 6785 -307.7 1708.3 6.219
B245 Vehicle - cost of second hand car/van outright 6785 -4.1 804.6 9.475
B247 Vehicle-cost of motorcycle outright 6785 .0 96.9 .101
B248 Car leasing on 6785 .0 222.3 1.070

23
B249 Car or van - servicing : amount paid 6785 .0 154.0 3.162
B250 Car or van - other works, repairs: amount paid 6785 .0 308.0 2.688
B252 Motor cycle - services, repairs: amount paid 6785 .0 54.0 .079
ESDS Government Economic and Social Data Service
Cathie Marsh Centre for Census and Survey Research University of Manchester
Manchester M13 9PL
Email: [email protected] Tel: +44 (0)161 275 1980
Fax: 0161 275 4722

24
www.esds.ac.uk/government
i http://www.esds.ac.uk/aandp/access/login.asp ii http://www.esds.ac.uk/aandp/access/athensh.asp iii http://www.esds.ac.uk/findingData/majorStudies.asp


![Stanford University · 3.1 Dataset SQuAD dataset is a machine comprehension dataset on Wikipedia articles with more than 100,000 questions [1]. The dataset is randomly partitioned](https://img.dokumen.tips/doc/110x75/602d75745c2a607275039f53/stanford-university-31-dataset-squad-dataset-is-a-machine-comprehension-dataset.jpg)