Embed Size (px)
Citation preview

Fulthorpe, C.S., Hoyanagi, K., Blum, P., and the Expedition 317 ScientistsProceedings of the Integrated Ocean Drilling Program, Volume 317
AbstractIntegrated Ocean Drilling Program (IODP) Expedition 317 was de-voted to understanding the relative importance of global sea level(eustasy) versus local tectonic and sedimentary processes in con-trolling continental margin sedimentary cycles. The expeditionrecovered sediments from the Eocene to recent period, with a par-ticular focus on the sequence stratigraphy of the late Miocene torecent, when global sea level change was dominated by gla-cioeustasy. Drilling in the Canterbury Basin, on the eastern mar-gin of the South Island of New Zealand, takes advantage of highrates of Neogene sediment supply, which preserves a high-fre-quency (0.1–0.5 m.y.) record of depositional cyclicity. Because ofits proximity to an uplifting mountain chain (the Southern Alps)and strong ocean currents, the Canterbury Basin provides an op-portunity to study the complex interactions between processes re-sponsible for the preserved sequence stratigraphic record. Cur-rents have locally built large, elongate sediment drifts within theprograding Neogene section. These elongate drifts were notdrilled during Expedition 317, but currents are inferred to havestrongly influenced deposition across the basin, including loca-tions lacking prominent mounded drifts.
Upper Miocene to recent sedimentary sequences were cored in atransect of three sites on the continental shelf (landward to basin-ward, Sites U1353, U1354, and U1351) and one on the continen-tal slope (Site U1352). The transect provides a stratigraphic recordof depositional cycles across the shallow-water environment mostdirectly affected by relative sea level change. Lithologic boundar-ies provisionally correlative with seismic sequence boundarieswere identified in cores from each site, providing insight into theorigins of seismically resolvable sequences. This record will beused to estimate the timing and amplitude of global sea levelchange and to document the sedimentary processes that operateduring sequence formation. Sites U1353 and U1354 provide sig-nificant double-cored, high-recovery sections through the Holo-cene, allowing for high-resolution study of recent glacial cycles ina continental shelf setting.
Continental slope Site U1352 represents a complete section frommodern slope terrigenous sediment to hard Eocene limestone,with all the associated lithologic, biostratigraphic, physical, geo-chemical, and microbiological transitions. This site also providesa record of ocean circulation and fronts during the last ~35 m.y.
Expedition 317 summary1
Expedition 317 Scientists2
Chapter contents
Abstract . . . . . . . . . . . . . . . . . . . . . . . . . . . . . . . 1
Introduction . . . . . . . . . . . . . . . . . . . . . . . . . . . 2
Geologic setting . . . . . . . . . . . . . . . . . . . . . . . . 3
Site survey data and interpretation . . . . . . . . . 4
Scientific objectives . . . . . . . . . . . . . . . . . . . . . . 6
Operational strategy . . . . . . . . . . . . . . . . . . . . . 8
Traveltime/depth conversion . . . . . . . . . . . . . . 9
Synopsis . . . . . . . . . . . . . . . . . . . . . . . . . . . . . . 10
Preliminary scientific assessment . . . . . . . . . . 24
Site summaries . . . . . . . . . . . . . . . . . . . . . . . . 25
References . . . . . . . . . . . . . . . . . . . . . . . . . . . . 39
Figures . . . . . . . . . . . . . . . . . . . . . . . . . . . . . . . 44
Tables. . . . . . . . . . . . . . . . . . . . . . . . . . . . . . . . 84
1Expedition 317 Scientists, 2011. Expedition 317 summary. In Fulthorpe, C.S., Hoyanagi, K., Blum, P., and the Expedition 317 Scientists, Proc. IODP, 317: Tokyo (Integrated Ocean Drilling Program Management International, Inc.). doi:10.2204/iodp.proc.317.101.20112Expedition 317 Scientists’ addresses.
doi:10.2204/iodp.proc.317.101.2011
Proc. IODP | Volume 317
Expedition 317 Scientists Expedition 317 summary
The early Oligocene (~30 Ma) Marshall Paraconfor-mity was the deepest drilling target of Expedition317 and was hypothesized to represent intensifiedcurrent erosion or nondeposition associated with theinitiation of thermohaline circulation following theseparation of Australia and Antarctica.
Expedition 317 set a number of scientific ocean drill-ing records: (1) deepest hole drilled in a single expe-dition and second deepest hole in the history of sci-entific ocean drilling (Hole U1352C, 1927 m); (2)deepest hole and second deepest hole drilled by theR/V JOIDES Resolution on a continental shelf (HoleU1351B, 1030 m; Hole U1353B, 614 m); (3) shallow-est water depth for a site drilled by the JOIDES Resolu-tion for scientific purposes (Site U1353, 84.7 m waterdepth); and (4) deepest sample taken during scien-tific ocean drilling for microbiological studies (SiteU1352, 1925 m).
Expedition 317 supplements previous drilling of sed-imentary successions for sequence stratigraphic andsea level objectives, particularly drilling on the NewJersey margin (Ocean Drilling Program [ODP] Legs150, 150X, 174A, and 174AX and IODP Expedition313) and in the Bahamas (ODP Leg 166), but in-cludes an expanded Pliocene section. Completion ofat least one transect across a geographically and tec-tonically distinct siliciclastic margin was the neces-sary next step in deciphering continental marginstratigraphy. Expedition 317 also complements ODPLeg 181, the focus of which was drift development inmore distal parts of the Eastern New Zealand Oce-anic Sedimentary System (ENZOSS).
IntroductionDefining the relative importance of global sea level(eustasy) versus local tectonic, sedimentary, andoceanographic processes in controlling continentalmargin depositional cyclicity is a fundamental prob-lem in sedimentary geology. A better understandingof how these processes interact to form preservedstratigraphy would greatly enhance our ability toread the record, covering many tens of millions ofyears, of Earth history contained within the thicksedimentary deposits beneath the world’s continen-tal shelves. This problem was addressed during Inte-grated Ocean Drilling Program (IODP) Expedition317 by drilling the Canterbury Basin on the easternmargin of the South Island of New Zealand (Figs. F1,F2, F3).
The geologic record provides an opportunity toquantify the timing, rate, amplitude, mechanisms/controls, and effects (stratigraphic response) of eu-static change, which in turn provides a baseline forpredicting future relative sea level changes and as-
Proc. IODP | Volume 317
sessing anthropogenic influences. However, eustaticeffects are complexly intertwined with processes ofbasin subsidence and sediment supply (e.g., Cloet-ingh et al., 1985; Karner, 1986; Posamentier et al.,1988; Christie-Blick et al., 1990; Reynolds et al.,1991; Christie-Blick and Driscoll, 1995; Kominz etal., 1998; Kominz and Pekar, 2001). Controversyarises from the application of the sequence strati-graphic model (Mitchum et al., 1977; Van Wagoneret al., 1988; Posamentier et al., 1988; Posamentierand Vail, 1988; Vail et al., 1991) to sea level studies.Sequence stratigraphy has highlighted the cyclicalnature of the continental margin stratigraphic recordand led to the theory of eustatic sequence control aswell as the resultant eustatic cycle chart (Haq et al.,1987). This global sea level model remains conten-tious (e.g., Cloetingh et al., 1985; Carter, 1985;Karner, 1986; Christie-Blick et al., 1990; Christie-Blick, 1991; Carter et al., 1991; Karner et al., 1993;Christie-Blick and Driscoll, 1995; Dewey and Pitman,1998; Miall and Miall, 2001).
High rates of Neogene sediment supply preserved ahigh-frequency (0.1–0.5 m.y.) seismically resolvablerecord of depositional cyclicity in the offshore Can-terbury Basin (Fulthorpe and Carter, 1989; Browneand Naish, 2003; Lu and Fulthorpe, 2004). Explora-tion wells indicate the presence of middle Mioceneto recent sedimentary sequences that are generallycorrelative in age with those drilled on the New Jer-sey margin by the Ocean Drilling Program (ODP).However, the Canterbury Basin differs in ways thatallow for expanded study of the complex processesof sequence formation in line with the global ap-proach to sea level change advocated by previousplanning groups:
1. The stratigraphy records the early developmentof the Antarctic circumpolar circulation and re-lated southern oceanographic fronts. Currentsstrongly influenced deposition, modifying se-quence architecture and locally leading to the de-position of large sediment drifts that aggraded toupper-slope depths within the prograding Neo-gene section.
2. Rifting is younger (Cretaceous) than the New Jer-sey margin (Jurassic), and from the earliest Mio-cene copious terrigenous sediment was suppliedfrom a rapidly uplifting nearby mountain range(the Southern Alps). Regional tectonic and geo-logic histories have been intensively studied, al-lowing evaluation of the influence of sedimentsupply on sequence formation and of the tec-tonic evolution of the Alpine Fault plate bound-ary.
The Canterbury Basin is part of the Eastern New Zea-land Oceanic Sedimentary System (ENZOSS) (Carter
2

Expedition 317 Scientists Expedition 317 summary
et al., 1996). The distal (up to 4460 m water depth)component of ENZOSS was targeted by ODP Leg 181,which focused on drift development in the south-west Pacific gateway, principally under the influenceof the evolving Antarctic Circumpolar Current andthe Deep Western Boundary Current (Shipboard Sci-entific Party, 1999a). Expedition 317 complementsLeg 181 drilling by focusing on the landward part ofENZOSS.
Geologic settingRegional geology
The eastern margin of the South Island of New Zea-land is part of a continental fragment, the New Zea-land Plateau, that rifted from Antarctica beginningat ~80 Ma (Anomaly 33). Rifting between the NewZealand Plateau and Antarctica–Australia was activealong a mid-ocean-ridge system passing through thesouthern Tasman Sea and Pacific basins until ~55 Ma(Anomaly 24). Linking of the Indian Ocean and Pa-cific spreading centers truncated the spreading ridgein the southern Tasman Sea in the late Eocene.Spreading rates on the Indian and Pacific segmentsof this now-continuous Southern Ocean ridge sys-tem resulted in the formation of the modern bound-ary between the Australian and Pacific plates com-posed of the Macquarie Ridge, the Alpine Fault, andthe Tonga–Kermadec subduction zone (Molnar et al.,1975).
The Canterbury Basin lies at the landward edge ofthe rifted continental fragment and underlies thepresent-day onshore Canterbury Plains and offshorecontinental shelf (Field and Browne, 1989). Banksand Otago peninsulas (Fig. F2) are mid–late Miocenevolcanic centers. Basin sediments thin toward thesefeatures as well as westward, where they onlap base-ment rocks onshore that are involved in uplift andfaulting linked to the latest Miocene (8–5 Ma) initia-tion of the current period of mountain buildingalong the Southern Alps (Adams, 1979; Tippett andKamp, 1993a; Batt et al., 2000).
The plate tectonic history of the New Zealand Pla-teau is recorded in the stratigraphy of the South Is-land. The postrift Cretaceous to recent sedimentaryhistory of the Canterbury Basin is composed of afirst-order (80 m.y.), tectonically controlled trans-gressive–regressive cycle (Carter and Norris, 1976;Field and Browne, 1989). The basin formed part of asimple passive margin from the Late Cretaceous tosome time in the late Eocene, when convergence be-tween the Australasian and Pacific plates began to in-fluence the region, eventually leading to the forma-tion of the Alpine Fault at ~23 Ma (Wellman, 1971;King, 2000). The Cretaceous–Tertiary sedimentary
Proc. IODP | Volume 317
section can be divided into three principal intervals,the Onekakara, Kekenodon, and Otakou groups(Carter, 1988), during which contrasting large-scalesedimentary processes operated (Fig. F4).
Cretaceous–Paleogene transgression and Oligocene highstandThe postrift transgressive phase (Onekakara Group)produced ramplike seismic geometries and termi-nated during the late Eocene, when flooding of thelandmass was at a maximum (Fleming, 1962). Re-duced terrigenous influx during the postrift phase ofsubsidence and transgression resulted in the deposi-tion of regionally widespread siliceous or calcareousbiopelagites (Amuri Limestone) as young as earlyOligocene (~33 Ma). This sequence is interrupted bya current-induced unconformity, the Marshall Para-conformity (Carter and Landis, 1972), which occursat the base of the mid–late Oligocene cross-beddedglauconitic sand (Concord Formation) and calcaren-ite limestone (Weka Pass Formation) that composethe Kekenodon Group (Fig. F4) (Carter, 1985, 1988).Exploration wells and Leg 181 drilling (ODP Sites1123 and 1124; Carter et al., 2004c) revealed that theparaconformity as well as the probable equivalentsof the Amuri Limestone and Weka Pass Formationexist offshore (Wilding and Sweetman, 1971; Milneet al., 1975; Hawkes and Mound, 1984; Wilson,1985). The paraconformity, the deepest drilling tar-get of Expedition 317, has also been recognized atdrill sites throughout the region east of the Tasma-nian gateway and is hypothesized to represent theinitiation of thermohaline circulation (Deep WesternBoundary Current) and shallower circulation uponthe opening of the seaway between Antarctica andAustralia (~33.7 Ma) prior to the opening of theDrake Passage (Carter et al., 2004c). New Zealand laydirectly in the path of this developing current sys-tem. The paraconformity has also been studied inonshore outcrops (e.g., Findlay, 1980; Field andBrowne, 1989; Carter and Landis, 1972; Lever, 2007)and dated by biostratigraphy and more recently bystrontium isotopes at a South Canterbury outcrop.The hiatus has been dated at 32.4–29 Ma (Fulthorpeet al., 1996). Its deepwater representation may havestarted to form 1–2 m.y. earlier (Carter et al., 2004c).
Miocene–recent regressionRegression commenced in the late Oligocene or earlyMiocene in response to an increase in sediment sup-ply provided by the initiation of Alpine Fault move-ment (Carter and Norris, 1976; Kamp, 1987). The Al-pine Fault formed as a dextral strike-slip zone, with500 km displacement since the earliest Miocene (~23Ma) (Kamp, 1987). In eastern South Island, this re-
3

Expedition 317 Scientists Expedition 317 summary
sulted in the deposition of a widespread shelf silt-stone (Bluecliffs Formation), starting in the latestOligocene or earliest Miocene. At abyssal depths inthe path of the Deep Western Boundary Current,fine-grained terrigenous–carbonate rhythms at 41k.y. Milankovitch frequency commenced at almostthe same time (~24–23 Ma) (Carter et al., 2004c).This early uplift is not recognized by fission trackdating (e.g., Batt et al., 2000) and is distinct from thelater pulse of uplift that culminated in the present-day Southern Alps. Uplift of the Southern Alps accel-erated at ~8–5 Ma (Tippett and Kamp, 1993a; Batt etal., 2000) or ~10–8 Ma (Carter and Norris, 1976; Nor-ris et al., 1978; Adams, 1979; Tippett and Kamp,1993b), indicating an increased component of con-vergence along the fault. Transpression led to an in-crease in the rate of sediment supply to the offshoreCanterbury Basin (Lu et al., 2005). As in New Jersey,this sediment influx was deposited as prograding cli-noforms (Otakou Group; Fig. F4). Currents contin-ued to influence deposition. At present, the core ofthe northward-flowing Southland Current, inboardof the Southland Front (part of the Subtropical Front[STF]), is near the ~300 m isobath (Chiswell, 1996).In deeper water of at least 900 m, a local gyre of theAntarctic Circumpolar Current circulates clockwisewithin the head of Bounty Trough parallel to theSouthland Current (Fig. F2) (Morris et al., 2001).Large sediment drifts within the prograding section(Fig. F4) show that similar currents existed through-out much of the Neogene (Fulthorpe and Carter,1991; Lu et al., 2003; Carter et al., 2004c). Carter(2007) has applied the term “Canterbury Drifts” todescribe the ensemble of shelf-slope sediments thathave been deposited under the influence of north-flowing currents since the latest Oligocene.
Subsidence historyBackstripping suggests an increase in tectonic subsid-ence in the central part of the offshore basin startingat ~8 Ma (Figs. F5, F6) (Browne and Field, 1988) orperhaps as early as 20 Ma (M. Kominz, pers. comm.,2009). This increased subsidence may be a responseto increasing convergence at the Alpine Fault (Lu etal., 2005). The transect approach of Expedition 317will help us to model the presumed two-dimensionalsubsidence effect of Alpine Fault convergence, allow-ing us to remove the tectonic portion of subsidenceand leave the eustatic signal. Figures F5 and F6 alsoshow evidence for uplift at ~50–35 Ma, which couldreflect the late Eocene reorganization of plate bound-aries.
Proc. IODP | Volume 317
Site survey data and interpretation
Data acquisitionA large amount of multichannel seismic (MCS) data,collected in 1982 for a petroleum exploration con-sortium (BP Shell Todd), is available for the offshoreCanterbury Basin (CB-82 profiles; e.g., Fulthorpe andCarter, 1989). Although the data cover an extensivearea, they exhibit relatively low vertical resolution(20 m). Therefore, this survey was augmented in2000 by two-dimensional high-resolution MCS pro-files (R/V Maurice Ewing Cruise EW00-01; Figs. F3, F7,F8, F9). The survey grid lies approximately midwaybetween the Banks and Otago peninsulas on thepresent-day middle to outer shelf and slope, abovethe late Miocene to recent depocenter and over thearea where the largest sediment drifts developed (Fig.F3). The seismic source consisted of two generator-injector (GI) air guns (45/45 in3), and the streamerwas deployed with 12.5 m groups in 96- and 120-channel configurations. A total of 57 profiles (~3750line-km) were collected, covering ~4840 km2. Linespacings are 0.7–3.0 km in the dip direction and 2.0–5.5 km in the strike direction. The penetration of1.7–2.0 s below seafloor is sufficient to image the en-tire Oligocene to recent section. Data processingused Focus software, and the data were loaded intothe GeoQuest interpretation system. High resolutionwas achieved by using reliable high-frequencysources (maximum frequency = 500 Hz), small sam-ple intervals (1 ms), and high fold (48–60). Verticalresolution (~5 m for two-way traveltime <1 s) is asmuch as 4–5 times better than that of existing com-mercial MCS data (Fig. F10). However, seafloor andpeg leg multiples are pronounced beneath the shelf.In order to deal with this problem, prestack decon-volution and FK-filtering were applied to critical sec-tions, yielding some improvements in quality.
Commercial low-resolution MCS grid data were usedto extend interpretations beyond the EW00-01 grid.CB-82 data were particularly useful for tying to ex-ploration wells, determining sediment drift distribu-tion, and locating clinoform rollovers, onlap, andcanyons associated with the oldest sequences. Thegrid consists of 81 profiles, representing ~6000 line-km (Fig. F3). The record length is 5 s, and the samplerate is 4 ms. Digital copies of all stacked profiles wereloaded into the GeoQuest system. Paper copies ofmigrated profiles were also available, and 20 of thedigital profiles were migrated as part of this project.
4

Expedition 317 Scientists Expedition 317 summary
Seismic stratigraphyThe EW00-01 MCS data were interpreted to providea high-frequency sequence stratigraphic frameworkfor the offshore Canterbury Basin (e.g., Fig. F7).Nineteen regional seismic sequence boundaries (U1–U19) were identified in the middle Miocene to re-cent shelf-slope sediment prism of the offshore Can-terbury Basin (Lu and Fulthorpe, 2004). Three largerseismic units were defined based on seismic architec-ture and facies (Fig. F7):
1. U1–U4 mostly lack distinct clinoform breakswithin the seismic coverage.
2. U5–U8 feature rounded breaks; internal reflec-tion geometries are predominantly sigmoid, andpaleoshelves are smooth and defined by onlapand truncation.
3. U9–U19 are downlapped on paleoshelves andtruncate underlying reflections near paleoshelfedges; internal reflection geometries are oblique,and U- and V-shaped channels incising paleo-shelves indicate exposure during sea level low-stands.
The predrilling ages of U3–U10 were initially basedon ties to the Clipper exploration well (Hawkes andMound, 1984), and the ages of U11–U19 were basedon ties to ODP Site 1119 (Fig. F11) (Shipboard Scien-tific Party, 1999b; R.M. Carter, pers. comm., 2002).The Endeavour (Wilding and Sweetman, 1971) andResolution (Milne et al., 1975) exploration wellswere tied to the EW00-01 survey using the commer-cial CB-82 MCS profiles to calibrate the lowermostseismic sequence boundaries (U1–U3) (Fig. F7). LatePliocene to recent age seismic sequence boundariesU11–U19 were considered the most reliable becausethey were derived from the continuously cored Site1119. The Site 1119 section is virtually complete;only one downlap unconformity (U18 at ~87 metersbelow seafloor [mbsf], representing the Stage 7/8boundary at ~252–277 k.y.) has a significant hiatus(~25 k.y.). U19 (~48 mbsf) corresponds to the Stage5/6 boundary (~113 ka) at Site 1119, and the age ofthe deepest sediment recovered at Site 1119 is ~3.9Ma (Carter et al., 2004a). The predrilling ages oflower Pliocene and Miocene unconformities wereless well constrained.
Expedition 317 drilling indicates that predrilling ageestimates for most seismic sequence boundariesagree reasonably well with drilling results (see “Syn-opsis”). Only U7 was off by a significant margin(4.3–5.3 Ma versus the predicted 9 Ma; see “Synop-sis”). A tentative correlation with oxygen isotopic re-cords based on predrilling age estimates suggests aeustatic origin for the seismic sequence boundaries.When cycles of comparable frequency are compared,the number of seismic sequences is similar to that of
Proc. IODP | Volume 317
coeval cycles on the Miocene to recent δ18O values ofseawater (δ18Osw) record of Billups and Schrag (2002)(Fig. F11). However, local processes also exerted fun-damental control on sequence architecture. Along-strike currents strongly influenced sequence devel-opment, and large sediment drifts dominate parts ofthe Neogene section.
Sediment drifts and paleoflowThe presence of long-lived drifts beneath the mod-ern shelf confirms that currents swept the New Zea-land plateau as early as 15 Ma (Fig. F12) (Lu and Fult-horpe, 2004), and onshore outcrops of KekenodonGroup Greensand and limestone indicate that thecurrent influence extends back to the late Oligocene(Ward and Lewis, 1975). The STF, Subantarctic Front(SAF), and associated currents may have existed closeto their present positions relative to New Zealand bythe middle or latest Miocene (Carter et al., 2004c;Nelson and Cooke, 2001). The STF is represented bythe Southland Front along the eastern South Island(Fig. F2). The δ13C record at Site 1119 is interpretedas reflecting glacial–interglacial alternations of sub-tropical and subantarctic water caused by movementof the STF across the site over at least the last twoglacial–interglacial cycles (Carter et al., 2004a,2004b). Falling sea level deflected the front basin-ward during glacial periods, with the counterintui-tive result that the site experienced a warmer water-mass during glacials; intervals of interbedded sandand mud mark the passage of the front basinwardand landward across the site (Carter et al., 2004b).Sand beds occurring near the peak of glaciation areinterpreted as representing the proximity of the STFand SAF, which may have coalesced near the site, in-tensifying current strength (Carter et al., 2004b).
Currents formed at least 11 large, elongate driftswithin the lower Miocene to recent section (e.g., Fig.F12) (Lu et al., 2003; note that timing is based onpredrilling ages). These drifts were initiated near theslope toe and aggraded to near-shelf water depths.Drift deposits are as thick as 1000 m and havemounded morphologies with channel-like moatsalong their landward flanks. Internal geometries de-fine two elongate drift end-members: simple andcomplex. Early (middle Miocene) simple drifts aresmall and are concentrated in the southern part ofthe survey area (Figs. F3, F7). Drift thickness and lon-gevity increased as the shelf aggraded, increasing ac-commodation space, while the locus of drift devel-opment migrated northeastward. Late (late Mioceneto recent) simple drifts are therefore larger and occurin the northeastern part of the survey area (Figs. F3,F8). Late simple drifts are divided into three parts(base, core, and crest) based on seismic facies. These
5

Expedition 317 Scientists Expedition 317 summary
facies form in response to progressive confinementof current flow within the moat. Complex drifts(multicrested and multistage; Fig. F3) may form ascurrent pathways migrate in response to sea levelchange, modulated by paleoslope inclination, and asa result of fluctuations in the rate of sediment sup-ply.
Current erosion in drift moats forms diachronousunconformities that cut across sequence boundaries.Several sequence boundaries pass through some ofthe larger drifts, indicating that they existedthroughout several cycles of relative sea level change(Figs. F7, F8). Drift deposition controls sequencethickness distributions: sequences are thickest atdrift mounds and thinnest within moats. In addi-tion, currents focus deposition on the slope, reduc-ing the rate of basinward movement of the shelfedge but increasing that of the slope toe. As a result,slope inclination is minimized (cf. Figs. F8, F9). Thecessation of drift development and the replacementof along-strike processes with downslope processesresult in increased rates of shelf-edge progradationand slope steepening as the accommodation spaceover the expanded slope is filled. Slope platforms canform above extinct drifts, reducing accommodationand locally accelerating shelf-edge progradation andslope steepening. The termination of large, elongatedrift development (~3.25 Ma at Site 1119; Carter etal., 2004a) may have resulted from the initiation oflate Pliocene to Pleistocene high-amplitude sea levelchange, which enhanced downslope processes by ex-posing the shelf edge. In spite of the demonstrablepresence of a current, seismic evidence for currentactivity is lacking and coeval strata are clinoformalalong strike from some large, elongate drifts (Fig. F9).Therefore, elongate drift formation is the product ofmultiple controls, including current intensity, sea-floor morphology, and sediment input.
Scientific objectivesPrimary objective
Date clinoform seismic sequence boundaries and sample-associated facies to estimate eustatic amplitudesFacies, paleoenvironments, and depositional pro-cesses associated with the sequence stratigraphicmodel on prograding continental margins, where se-quences are best resolved seismically, have yet to beadequately constrained by scientific ocean drilling.The prediction of sediment distribution within se-quences is highly model dependent (e.g., systemstract models of Posamentier et al., 1988; Vail et al.,1991). These models offer great potential for under-
Proc. IODP | Volume 317
standing oil and gas resources and for ground water/pollution remediation issues. However, the funda-mental assumptions and predictive capabilities ofthese models can only be tested by drilling on shal-low continental shelves. Drilling contrasts upperMiocene–lower Pliocene sequences with smooth, on-lapped paleoshelves and rounded breakpoints (seis-mic sequence boundary ~U10 and below) to upperPliocene–Pleistocene sequences with eroded and in-cised, downlapped paleoshelves and more pro-nounced breakpoints (above U10) (Fig. F7). This teststhe hypothesis that paleoshelves below ~U10 werenot subaerially exposed at sequence boundaries,whereas those above ~U10 were exposed.
Secondary objectives1. Drill the Marshall Paraconformity in the offshore basin
Drilling the Marshall Paraconformity offshore pro-vides information on its regional distribution, age,and origin (Figs. F4, F8, F9). The paraconformity hasbeen dated at its onshore type section using stron-tium isotopes and represents a ~3.4 m.y. hiatus(32.4–29 Ma; Fulthorpe et al., 1996). It is thereforecorrelative with the postulated early Oligocene eu-static lowstand (Haq et al., 1987). However, a eu-static lowstand is unlikely to have been the directcause of the paraconformity because correlative fea-tures have been inferred to form in water as deep as4000–5000 m throughout the southwest Pacific(Carter, 1985; Carter et al., 2004c). The limitedpaleoenvironmental data available suggest that, evenat current onshore locations, the Marshall Paracon-formity could not have been widely subaerially ex-posed, although such exposure may have occurred atlocalized highs (Lewis, 1992).
Instead, the paraconformity probably records inten-sified current erosion or nondeposition at all waterdepths, which was accompanied by the developmentof a current system following the opening of the sea-way south of Tasmania (Carter, 1985; Fulthorpe etal., 1996; Carter et al., 2004c). Seismic interpretationsupports a current-related origin by indicating thatthe paraconformity forms the base of the interval ofsediment drift deposition. Indeed, immediatelypost–Marshall Paraconformity, sedimentation in-volved sediment drift deposition in shallow (Wardand Lewis, 1975), intermediate (Fulthorpe andCarter, 1991; Lu et al., 2003), and deep (ShipboardScientific Party, 1999a; Carter et al., 2004c) water set-tings. Leg 181 drilling indicates that the paraconfor-mity developed in deep (bathyal) water ~1–2 m.y.earlier than in shallow water (McGonigal and Di Ste-
6

Expedition 317 Scientists Expedition 317 summary
fano, 2002). Dating this paraconformity in the off-shore Canterbury Basin at Site U1352 tested this hy-pothesis.
2. Constrain the erosion history of the Southern Alps
The late Oligocene to early Miocene increase in sedi-ment supply to the offshore basin apparently pre-dates the modern transpressional uplift of the South-ern Alps, whose main pulse began at ~8–5 Ma(Tippett and Kamp, 1993a; Batt et al., 2000) or ~10–8Ma (Carter and Norris, 1976; Norris et al., 1978; Ad-ams, 1979; Tippett and Kamp, 1993b). Such onshoreresults correlate with increases in subsidence rateand sediment supply in the offshore basin (Figs. F5,F6, F11) but may underestimate earlier, but signifi-cant, convergence and uplift (Walcott, 1998). Theoffshore sedimentary prism is the only record of ero-sion that precedes the current uplift phase, constitut-ing a record of age, volume, and facies of erosionproducts from the Oligocene to recent.
Sediment volumes within mapped seismic sequencesprovide a measure of onshore paleoerosion rates.Calculating such volumes involves integration ofboth industry and EW00-01 MCS data because thecommercial data have broader aerial coverage (Fig.F3). Sequence volumes were used to calculate sedi-mentation rates (Fig. F11) (Lu et al., 2005). Limitedavailable age control precluded estimation of mean-ingful sedimentation rates for individual sequencesbecause such rates are strongly influenced by se-quence duration. Therefore, sedimentation rates av-eraged over groups of sequences are presented in-stead. The resulting rates correlate well withestimates of the perpendicular component (conver-gence) of relative plate motion at the Alpine Fault:both increase during the last 5–8 m.y. (Fig. F11). Incontrast, high sedimentation rates from 14.5 to 11.5Ma occurred during a period of low convergence rateat the fault (Lu et al., 2005). However, these highrates correlate with similar peaks in sedimentationrates elsewhere, such as off New Jersey and West Af-rica (Steckler et al., 1999; Lavier et al., 2000, 2001),and occur during a period of falling global sea level(Fig. F11). They are probably, therefore, a response toglobal climatic trends. Drilling results will be used toverify the ages of the progradational units, whichwill be integrated with sediment volume results toprovide an enhanced, sequence-by-sequence recordof sedimentation rates for correlation with tectonicand climatic events. Provenance studies will furtheradd to our understanding of the early history of theplate boundary. Mineralogical and isotopic analysesof sand grains, along with Ar-Ar dating of thosegrains, will allow the matching of outcrop ages andsource areas to sequences offshore. Ideally, we would
Proc. IODP | Volume 317
have liked to calibrate sequences through the entireNeogene section, but penetration of the entire sec-tion at shelf water depths is technically difficult andtime consuming. As a compromise, Expedition 317sites targeted seismic sequence boundaries down toU4 (~12.4 Ma), although U5 was the oldest sequenceboundary actually penetrated.
3. Determine sediment drift depositional histories and paleoceanographic record
Elongate drifts parallel to the shelf edge are unusualfeatures in such an inboard continental margin set-ting, and their facies are largely unknown. They wereprobably deposited adjacent to a current flowingnorthward along the prograding clinoform slope;progradation in parts of the basin occurred by the ac-cretion of successive sediment drifts (Fulthorpe andCarter, 1991; Lu et al., 2003). The drifts can encom-pass several seismic sequences, and the erosional un-conformities in moats are diachronous (Figs. F7, F8,F12) (Lu et al., 2003). Drift formation is not, there-fore, linked directly to individual sea level cycles.Data from Site 1119 (Leg 181) confirmed the drift or-igin of these features; interglacial silty sand and gla-cial silty clay cycles were recognized in current-de-posited sediments (Shipboard Scientific Party,1999b). However, Site 1119 penetrated only to 494.8mbsf in 3.9 Ma sediments, which is insufficient tosample more than the upper few meters of the un-derlying large, elongate drift (D10 of Lu et al., 2003;Carter et al., 2004a). The earlier history of the frontalsystems is therefore poorly constrained. In addition,the climatic record of Site 1119 correlates well withthat from the Vostok ice core (Carter et al., 2004b),and drilling deeper could provide an extended proxyfor Antarctic continental air temperatures. Further-more, D11 can be considered the type example of alate, simple, elongate drift, and it displays all of thecomponent seismic facies (base, core, and crest) (Luet al., 2003). It is estimated to be of late Miocene(~11 Ma) to Pliocene (~3.6–3.25 Ma) age (Fig. F12)(Lu and Fulthorpe, 2004; Carter et al., 2004a) andmay be the longest lived sedimentary bedform onEarth. Drilling D11 would therefore be essential todetermine the lithologies that make up the large vol-umes of sediment within the elongate drifts and re-cover the paleoceanographic record containedwithin the drift deposit.
Because of time constraints imposed in part by the10 day transit from Townsville, Australia (which in-cluded a fuel stop in Wellington, New Zealand), drill-ing D11 became a secondary objective of Expedition317. Therefore, all sites originally proposed for drill-ing D11 (proposed Sites CB-05A through CB-05E) be-came contingency sites to be drilled only if drilling
7

Expedition 317 Scientists Expedition 317 summary
at shallower slope and shelf sites was not possible.However, insights into sediment drift deposition andpaleoceanography were expected from drilling atshelf Site U1351 (which penetrated the paleoslopesof U6 and U7) and slope Site U1352. Drift geometriesbecome gradually less pronounced along strike to-ward the southwest (from proposed CB-05 sites tothe drilling transect sites), and pronouncedmounded drift geometries are absent beneath theslope at Site U1352 (Lu and Fulthorpe, 2004). How-ever, the generation of mounded drifts requires spe-cific conditions that are not well understood; a slopecontour current alone is insufficient, as indicated bythe fact that such drifts are not being formed underthe present current regime. It is therefore possiblethat currents have reworked the sediments at SitesU1351 and U1352 and left a paleoceanographic re-cord of glacial–interglacial cycles, as at Site 1119(Carter et al., 2004c), without producing distinctivedrift geometries.
Operational strategyDrilling transect strategy
To understand the history of eustasy versus subsid-ence/sediment supply changes, borehole transectsacross passive continental margins are required (CO-SOD II, 1987). The long-term strategy developed byODP-related planning groups (Watkins and Moun-tain, 1990; Loutit, 1992; Fulthorpe et al., 2008) in-volves drilling margins worldwide to evaluate globalsynchroneity through correlation among multiplebasins and with the oxygen isotopic record and todocument stratigraphic responses in diverse tectonicand depositional settings, including carbonate, silici-clastic, and mixed siliciclastic–carbonate sedimen-tary systems on both continental and oceanic crust.Initial investigation was to focus on the Neogene“Icehouse” period (Miller et al., 1991), for whichhigh-resolution chronological control is availableand for which glacial cycles provide a well-under-stood mechanism for eustatic change, calibrated bythe deep-ocean oxygen isotope record. This ap-proach has guided ODP efforts off New Jersey (Leg150: Mountain, Miller, Blum, et al., 1994; Miller andMountain, 1994; Leg 174A: Austin, Christie-Blick,Malone, et al., 1998; Legs 150X and 174AX: Miller, etal., 1994; Miller, Sugarman, Browning, et al., 1998)and the Bahamas (Leg 166: Eberli et al., 1997). IODPExpedition 317 represents the latest application ofthis global strategy.
The passive margin approach integrates seismic pro-files and a drilling transect to calibrate the sequencestratigraphic model and test the global sea level
Proc. IODP | Volume 317
model, including investigation of local controls onsequence formation. Seismic profiles provide identi-fication of sequence boundaries, sequence architec-ture, seismic facies, and morphologic constraints ondepositional processes and tectonism. A drillingtransect is required to document (1) ages of sequencestratigraphic surfaces, including sequence-boundingunconformities (or their correlative conformities)and maximum flooding surfaces; (2) facies and li-thologies composing each sequence (stratigraphic re-sponse to sea level oscillations); (3) porosity, cemen-tation, and diagenesis; and (4) paleowater depthsfrom benthic biofacies. Such paleowater depth esti-mates are essential for determination of eustatic am-plitudes. Two-dimensional modeling of these datawithin the sequence stratigraphic framework allowsestimation of eustatic amplitudes when the form ofthe tectonic component of subsidence is known(Kominz and Pekar, 2001).
The ideal approach involves drilling target sequencesin at least two locations. First, drilling landward ofclinoform rollovers or breaks, presumed to representpaleoshelf edges, provides information on facies andwater depths where paleodepth indicators are mostreliable. For example, ODP Leg 174A drilling recov-ered valuable paleoenvironmental information diag-nostic of a shallow-water lagoonal environmentlandward of a rollover (Austin, Christie-Blick, Ma-lone, et al., 1998). Two-dimensional backstrippingwill enable the use of data from inboard sites to con-strain water depths at more basinward locations. Sec-ond, drilling on the slope, where pelagic microfossilsare more abundant, provides sequence boundaryages. Ideally, such sites would also provide the paleo-environment and facies of the lowstand systemstract. This is also essential for eustatic amplitude esti-mation in the event that sea level fell below the pre-ceding rollover. The ideal location for both datingand lowstand facies is near the clinoform toe to min-imize the hiatus at the sequence boundary (Christie-Blick et al., 1998), but locations higher on the slopeare necessary to reduce drilling depths (e.g., the loca-tion of New Jersey margin Site 1072 [Leg 174A] rela-tive to sequence boundary m1[s]) (Austin, Christie-Blick, Malone, et al., 1998). In addition, locations onthe slope will provide better constrained paleowaterdepths than those at clinoform toes, which are likelyto involve greater uncertainty (as is the case at theClipper well). A further reason for drilling higher onthe slope is that seismic correlation from clinoformtoes landward to the clinoform front and paleoshelfis difficult on all margins because the section basin-ward of the clinoform toe is condensed and land-ward divergence of reflections contributes to mis-ties.
8

Expedition 317 Scientists Expedition 317 summary
General operations planThe transect approach requires drilling operations tobe conducted on the modern shelf to reach sequencepaleoshelves landward of their rollovers, as well asthe upper paleoslopes of the oldest sequences. ODPLeg 174A drilling on the New Jersey shelf illustratedthe difficulty of shelf drilling with a dynamically po-sitioned drilling vessel (Austin, Christie-Blick, Ma-lone, et al., 1998). The main problem was the col-lapse of loose sands, which trapped the drill string,although station keeping in shallow water was alsooccasionally difficult. The proposed drilling strategyfor Expedition 317 was influenced by the Leg 174Aexperience, which relied heavily on rotary core bar-rel (RCB) drilling, particularly at shelf Site 1072. As aresult, the Expedition 317 precruise operations sum-mary presumed extended core barrel (XCB) refusal at~350 mbsf, with RCB coring in a separate hole to to-tal depth.
In practice, it was possible to use the XCB to core to~1000 m at shelf Site U1351 before significant diffi-culty was encountered. RCB drilling was thereforeunnecessary at Expedition 317 shelf sites. In con-trast, the greater penetration depth required at SiteU1352, on the upper slope, necessitated the use ofRCB coring in a separate hole.
Favorable weather conditions on arrival allowed usto follow the original drilling strategy by drilling firstat shelf Site U1351 at the deepwater end (121 m) ofthe shelf transect (Fig. F7; Table T1). This providedus with experience in shelf-sediment drilling beforewe moved to sites in even shallower water. Althoughthe target depth at Site U1351 was 1249 mbsf, actualpenetration of 1030 m nevertheless exceeded expec-tations in view of the difficulties encountered duringLeg 174A. Unless otherwise noted, all depth refer-ences in this chapter refer to the core depth belowseafloor computed by conventional method A(CSF-A) depth scale (see “IODP depth scales termi-nology” at www.iodp.org/program-policies/). Onlythe two deepest seismic sequence boundaries tar-geted (U4 and U5) were not reached, although recov-ery was limited, averaging ~30% and generally de-creasing with depth.
The ship then moved ~15 km to slope Site U1352,which was selected to provide good age control forsequences drilled on the shelf at Site U1351 (Fig. F3).An additional objective at this site was penetrationand recovery of the Marshall Paraconformity (Fig.F9).
On completion of slope drilling, we moved back tothe shelf to drill the two additional shelf Sites U1353and U1354 (Fig. F7) to provide spatial control of fa-
Proc. IODP | Volume 317
cies within sequences and to recover the lowermostunconformities landward of their rollovers.
Traveltime/depth conversionRelating seismic sequence boundaries to features ob-served in cores is critical to any test of continentalmargin sequence stratigraphy. Sequence boundarieswere originally assigned predicted depths based onsynthetic seismograms created using sonic and den-sity logs from Site 1119 and commercial explorationwell Clipper. Ages were also assigned to the sequenceboundaries using ties to Site 1119 and the explora-tion wells, principally Clipper (Lu and Fulthorpe,2004).
During safety reviews by the Environmental Protec-tion and Safety Panel (EPSP), predicted sequenceboundary depths were modified using a new analysisof check shot and sonic log information from theClipper well and Site 1119. Seismic stacking veloci-ties were not used for traveltime/depth conversionbecause they were substantially higher than thosederived from Site 1119 and the Clipper well, whichare in general agreement. The final traveltime/depthconversion function used to estimate sequenceboundary depths prior to Expedition 317 was
Y = 317X2 + 758.3X,
where
Y = depth below seafloor in meters and X = two-way traveltime in seconds.
Pending postcruise analysis, depths quoted for seis-mic sequence boundaries in this report are derivedfrom this predicted function. A sonic log was ob-tained from Hole U1351B to ~490 m wireline logdepth below seafloor (WSF), but this log requirespostcruise processing before it can be used to providean alternative traveltime/depth conversion. A soniclog was also obtained from Hole U1352B to ~420 mWSF, and a synthetic seismogram was generated toprovide an alternative traveltime/depth conversion.However, the resultant velocities proved to be anom-alously lower than the predicted function, which isitself evidently too slow, at least for traveltimes cor-responding to the deepest penetrations. For exam-ple, if the Marshall Paraconformity correlates, asseems likely, with seismic horizon “Green,” the pre-cruise predicted function underestimates its depthby ~30–35 m.
Results from Hole U1353C may be more representa-tive. A sonic log to ~230 m WSF yielded an excellentsynthetic seismogram match to the seismic data andestimated depths to seismic sequence boundaries
9
Expedition 317 Scientists Expedition 317 summary
within the logged interval (U13–U10) that were 5–10 m deeper than predicted precruise. This may rep-resent an improved traveltime/depth conversion forthis interval, although the difference may be withinthe margin of error for both sets of traveltime/depthestimates. A sonic log was also obtained from HoleU1354C to ~380 m WSF at the end of the cruise; re-sults have not yet been assessed.
In summary, the precruise predicted function con-tinues to be used for core-log-seismic correlations inthis report. However, postcruise analysis may lead tomodifications of this function based on further eval-uation of Expedition 317 wireline logging and physi-cal property data.
SynopsisThe fundamental objective of Expedition 317 was totest the concepts of sequence stratigraphy by docu-menting the lithologies, ages, and depositional envi-ronments within sequences in order to determinethe sedimentary processes active during sequencedevelopment and to constrain the underlying con-trols (both global and local) responsible for thoseprocesses. This involves testing sequence strati-graphic model (e.g., Van Wagoner et al., 1988; Vail etal., 1991) predictions of facies and lithologies associ-ated with the development of prograding, clinofor-mal, continental margin sequences that are well de-fined by seismic interpretations. It also necessitatestesting the presumption that global sea level is theprimary control on sequence boundary formation(Haq et al., 1987). Other goals were coring the earlyOligocene Marshall Paraconformity, constrainingthe early uplift and erosion history of the SouthernAlps, and documenting the evolution of contouritedeposition on this current-influenced margin.
Nineteen middle Miocene to Pleistocene seismic se-quence boundaries (U1–U19) were defined by se-quence stratigraphic interpretation of EW00-01 seis-mic data (Lu and Fulthorpe, 2004). Expedition 317was designed to provide ground truth for sequencesabove U4 (~U5 in practice) and also to core throughthe Marshall Paraconformity. Prior to Expedition317, only Leg 174A (Austin, Christie-Blick, Malone,et al., 1998) and IODP Expedition 313 (Expedition313 Scientists, 2010) had drilled on a continentalshelf for sequence stratigraphic and sea level objec-tives. Expedition 317, therefore, provided a rare op-portunity to investigate the facies, paleoenviron-ments, and depositional processes associated withthe sequence stratigraphic model on a progradingcontinental margin where large-scale depositionalgeometries and sequence architectures are well con-strained by seismic data.
Proc. IODP | Volume 317
Core-seismic correlationThe Canterbury Basin formed along a passive conti-nental margin where large volumes of sediment werederived from a tectonically and climatically evolvinghinterland. Seismic sequence boundaries provide alarge-scale understanding of the subsurface architec-ture of the margin necessary for drill site selectionand for placing drilling results within a broader two-dimensional and three-dimensional context. U19–U6 were penetrated at outer shelf Site U1351 andmid-shelf Site U1353, the most landward site. U5may also have been reached at Site U1353. U19–U8were cored at intermediate shelf Site U1354. Theslope facies of most seismic sequence boundaries(U19–U13, U11, and U9–U6), as well as the MarshallParaconformity, were penetrated at Slope Site U1352with the particular goal of providing age control forsequence boundaries. The slope facies of U6–U7 werealso sampled at shelf Site U1351 (Figs. F13, F14).
Upper Miocene–lower Pliocene seismic sequenceboundaries (~U10 and below) feature smooth, on-lapped paleoshelves and rounded rollovers, or clino-form breaks, with sigmoid internal reflection geome-tries. In contrast, middle Pliocene to Pleistocenesequence boundaries (above U10) display eroded andincised downlapped paleoshelves and more pro-nounced rollovers with oblique reflection geome-tries. This transition reflects a background of chang-ing paleoenvironmental conditions, against whichthe cored sediments can be interpreted downhole.
Similarly, the character of sequences changes hori-zontally landward to basinward across the transect.Sequences are not represented by a single pattern oflithofacies across the shelf and onto the slope. Shelfsuccessions are dominated by periodic facies changesthat reflect fluctuating sea level, whereas depositionof slope sediments was also influenced by north-traveling Subantarctic Mode Water (SAMW), Antarc-tic Intermediate Water (AAIW), and their predecessorcurrent systems (e.g., Carter and Gammon, 2004).
Correlating seismic sequence boundaries with litho-logic facies and features found in the cores will be afocus of postcruise research. However, preliminaryrelationships can be defined at two scales.
Lithologic unitsAt the largest scale, the preferred boundaries be-tween lithologic Units I and II at outer shelf SiteU1351, mid-shelf Site U1354, and inboard shelf SiteU1353 are lithologic boundaries that separate theoverlying heterolithic facies of Unit I from more uni-form facies below in Unit II (Figs. F13, F14, F15). Theunit definitions for each Expedition 317 site arebased on observed variations in lithology in the
10

Expedition 317 Scientists Expedition 317 summary
cores, particularly in the occurrence and frequencyof calcareous units (generally green, shelly, andsandy). In general, Unit I is heterogeneous, contain-ing a wide variety of facies, including interbeddedterrigenous lithologies and many green marl or cal-careous beds with sharp (or bioturbated) bases (Fig.F15). Conversely, Unit II is more homogeneous. Onthe shelf, Unit II is dominated by mud or muddysand, with lower percentages of carbonate compo-nents and less frequent greenish calcareous beds,whereas on the slope this unit is represented by ho-mogeneous sandy marlstone (Figs. F15, F16). How-ever, at each site the location of the unit boundary isdifficult to identify precisely because the transitionbetween units of this type is inevitably gradationaland also because of low recovery near some unitboundaries (Fig. F17). At slope Site U1352, the ho-mogeneous sandy marlstone of Unit II changesabruptly into foraminifer-bearing nannofossil lime-stone of early Oligocene to late Eocene age. Thishemipelagic to pelagic unit is correlative with theonshore Amuri Limestone.
The Unit I/II boundary generally conforms to thepredicted depths of seismic sequence boundaries be-tween U9 and U12 (late Pliocene) in a zone betweenhigh-amplitude seismic reflections related to clino-forms with sharp shelf-slope transitions above andclinoforms with rounded shelf-slope transitions be-low. The exact location is not identical at each site,in part because of the gradational nature of the tran-sition noted above.
At Site U1353, Unit I is thought to correspond tostrata between U12 and the seafloor (Fig. F13); how-ever, a transition zone was identified between theheterolithic Unit I and the more homogeneous UnitII, reflecting the gradational evolution of the sedi-mentary margin. This transition zone extends be-tween ~137 and 178 m or between U12 and U11 ofLu and Fulthorpe (2004) (Fig. F13). Heterogeneity inlithology and composition continues to ~260 m,where an abrupt change in mineralogy was observed.The uppermost transitional part of Unit II corre-sponds to the sequences between U9 and U12. Below260 m, the homogeneous muddy sediments identi-fied as Unit II correlate to strata between U9 and U5(Fig. F13).
At Site U1354, the heterolithic upper Subunit IA cor-responds to the high-amplitude seismic reflectors be-tween U12 and the seafloor, which correlates to thesame stratigraphic package as Unit I at Site U1353.Subunit IB lithology contains regular alternations ofmuddy strata and extends from just above the pre-dicted depth of U9 to U12, equivalent to the transi-tional zone between Units I and II identified at SitesU1353 and U1351. Unit II corresponds to the clino-
Proc. IODP | Volume 317
formal strata below U9, with the hole terminatingbetween U8 and U7.
At Site U1351, Unit I is defined as extending fromthe seafloor to 262 m, although a transition zonewas identified between ~247 and 300 m. This unitwas distinguished by the high variability in lithofa-cies, which, not surprisingly, corresponds to thehigh-amplitude reflectors between U9 (predicteddepth of 312 m) and the seafloor. All of Unit II lieswithin the broadly clinoformal succession betweenU4 and U9. The transition zone identified in thecores between Units I and II corresponds to the zonebetween U9 and U10, the lowermost unit of the up-per high-amplitude succession and the one mostsimilar in shape to the underlying rounded clino-forms.
For Site U1352 the boundary between Subunits IAand IB correlates to a subsequence boundary be-tween U18 and U19 (Fig. F14), whereas the bound-ary between Subunits IB and IC correlates to U14,and the boundary between Units I and II correlatesto a subsequence boundary at the base of the irregu-larly shaped high-amplitude reflectors between U13and U11. Subunit IB corresponds to high-amplitudereflectors, and Subunit IC correlates to the irregular(possibly drift-related) reflectors below U14. In con-trast to Sites U1351 and U1354, the Unit I/II bound-ary at Site U1352 occurs at a much higher seismicstratigraphic level (between U11 and U13), similar tothe Unit I/II boundary at Site U1353. At all sites,Unit I is differentiated from Unit II by a higher de-gree of lithofacies heterogeneity. Subunit IIA at SiteU1352 is remarkably homogeneous, although it cor-responds in age and updip correlation to the basalpart of Unit I at Sites U1351 and U1354.
Subunit IIA correlates with the prograding clino-forms between U8 and the base of the aforemen-tioned erosional features between U11 and U13. Thebottommost, more calcareous, part of this subunitoccurs in a set of down- and onlapping reflectors di-rectly overlying U8. Subunit IIB correlates with themore irregular, possibly channelized, reflectors be-tween U8 and U4. The portion of this subunit thatcontains mud beds is located above U6, and the cur-rent-dominated, wavy-laminated calcareous lithofa-cies in this subunit occurs below U6. The very calcar-eous Subunit IIC correlates with the parallel seismicreflections between U4 and the Marshall Paraconfor-mity at this site. Unit III lies below the high-ampli-tude Marshall Paraconformity reflector.
One objective of drilling on the shelf was to test thehypothesis that these contrasting characteristics ofsequence boundaries and seismic facies above andbelow ~U9 occur because the paleoshelves of U9 andthe underlying sequence boundaries were not suba-
11

Expedition 317 Scientists Expedition 317 summary
erially exposed at lowstand, whereas those above U9may have been exposed, probably because of increas-ing eustatic amplitudes during the Pleistocene. Thelithologic contrasts between Units I and II at shelfSites U1351, U1354, and U1353 appear to broadlysupport this hypothesis, with the heterolithic sedi-ments of Unit I representing deposition under condi-tions of fluctuating sea level since the mid-Pliocene.The fact that the transition is gradational also im-plies that the change in processes operating to pro-duce these sediments is also gradational and not anabrupt change from one type of process that pro-duces rounded shelf-slope breaks to one that pro-duces sharp shelf-slope breaks.
The change in lithology between units is mirrored inthe percentage of carbonate components, as esti-mated from smear slides and thin sections and mea-sured using X-ray diffraction (XRD) and coulometry.The carbonate percentage in Unit I is high and vari-able (Fig. F16). The carbonate percentage in Unit IIat shelf sites is low and only variable at the top of theunit, whereas it is moderate and less variable at slopeSite U1352 (Fig. F16). At shelf Site U1351, the car-bonate percentage begins to increase downhole,which is a reflection of the shift of depositional envi-ronment toward the slope with depth at this site. Atslope Site U1352, the carbonate percentage also in-creases downhole, reflecting a rise in oceanicity(planktonic foraminiferal abundance) of the deposi-tional environment (Fig. F16). Subunit IIC and UnitIII are both limestones, deposited in truly oceanicenvironments, with little to no terrigenous sedimentinput.
Correlation to Site 1119Site 1119 is located ~35 km northeast of Site U1352in slightly deeper water (~400 m) but essentiallyalong strike and in a similar upper slope position, ~5km from the modern shelf-slope break (ShipboardScientific Party, 1999b). The stratigraphic successionat Site 1119 was divided by shipboard scientists intothree lithologic units that correspond to units de-fined on seismic profiles across the site. Unit I, inter-preted as slope-drape deposits, extends from 0 to 88m and ranges in age from 0 to 0.42 Ma. It comprisesbeds of silty sand and hemipelagic silty clay (mud)deposited on the slope. The underlying Unit II com-prises drift deposits of silty sand and glacial silty clay.Unit II is divided into three subunits according tothe nature of the drift deposits (composition andsedimentary structures) and their correlation withthree seismically defined drift packages. The last ma-jor sandy interval at ~400 m (~2.5 Ma) and the un-derlying noncalcareous mudstone marks the bound-ary between Units II and III, the former being more
Proc. IODP | Volume 317
sand rich and more calcareous. This boundaryroughly corresponds to the top of a series of strongreflectors that marks the top of another drift se-quence.
In thickness, lithology, and seismic character, Unit Iat Site 1119 roughly corresponds to Subunit IA atSite U1352. Seismic facies mapping between the sitessuggests that the drift packages composing Unit II atSite 1119 are different from those at Site U1352 (Luand Fulthorpe, 2004) and that there is a significantdifference in the thicknesses of the seismic se-quences between the sites. Subunit IB is interpretedas a transitional slope/drift facies, becoming moredrift dominated into Subunit IC.
The major units at both sites are roughly defined bycarbonate content, with Unit I at Site 1119 and Sub-unit IA at Site U1352 exhibiting generally lower min-imum and lower maximum carbonate values thanthe lower units at each site (cf. fig. F24 in ShipboardScientific Party, 1999b; Fig. F18). Comparison sug-gests that Units II and III at Site 1119 roughly corre-spond with Subunit IB and the top of Subunit IC atSite U1352. A distinctly low carbonate interval at~430 m at Site 1119 corresponds to a similar low-car-bonate interval occurring at ~620 m at Site U1352.
Potential sequence boundaries in coresShelf sites (U1351, U1353, and U1354)Finer scale correlations between lithology and seis-mic interpretations are also possible. Correlation ofspecific lithologic features with seismic sequenceboundaries will be improved by postcruise analysis,but some intriguing relationships can be drawnbased on shipboard observations. Lithologic contactsand associated sediment packages were identifiednear the predicted depths of seismic sequenceboundaries at all sites (Figs. F19, F20). Identificationwas based on changes in lithologic composition, thepresence of reworked sediments, and the nature ofthe contacts. Basal surfaces were not always recov-ered—for example, in zones where recovery was poorbecause of the (inferred) presence of sand. In suchcases, the surfaces were picked based on the presenceof sand (or the assumption of washed-out sands) andcorrelation to wireline logs. Because of time restric-tions on board ship, surfaces were only examinedclose to the predicted depths of seismic sequenceboundaries; therefore, the lithologic surfaces identi-fied here are implicitly linked to the predicted occur-rences of sequence boundaries identified on the seis-mic profiles (Lu and Fulthorpe, 2004). A similarapproach was used during ODP Legs 150 and 174A,the objectives of which were also the study of sealevel changes. Postcruise study will attempt to clarifythe exact relationship of all lithologic surfaces and
12
Expedition 317 Scientists Expedition 317 summary
facies associations to sea level changes and seismicstratigraphy. The numbering system used in the sitechapters, tables, and summary diagrams consists of ahole-specific prefix and a surface designation (e.g.,U1351A-S1) that links each surface to a seismic se-quence boundary (Figs. F19, F20); therefore, theselithologic surfaces and associated sediments arethought to be correlative between sites across thetransect.
Candidate sequence boundaries are best identified inlithologic Unit I at each site, where recovery washighest (Fig. F17). For example, the lithologic sur-faces of Unit I at Site U1351 are overlain by a seriesof lithofacies associations composed of upward-fin-ing shelly sandy mud topped by regressive coarsen-ing-upward sandy mud. Our working model is thatthe package is a transgressive wave-eroded ravine-ment surface overlain by a lag deposit correspondingto a transgressive systems tract. Subsequent high-stand mud units are topped by the regressive coars-ening-upward sediments. The facies assemblage in-cludes decimeter- to centimeter-thick clay bedssimilar to those attributed to rapid deposition byflood events on modern shelves near sediment-richfluvial systems. Truncated versions of this facies asso-ciation lacking the regressive highstand phase occurin the uppermost 30 m at Site U1352, suggestingmore frequent erosive episodes or nondeposition ofthis facies. There are more such truncated facies asso-ciations than there are seismic sequence boundaries,and it is therefore possible that some of the trun-cated facies associations may represent higher ordercycles or autocyclicity related to migration of distrib-utaries and/or shelf depocenters. The facies associa-tions, both complete and truncated, are similar tothose known from the Wanganui Basin, between theNorth and South Islands of New Zealand (Abbottand Carter, 1999; Saul et al., 1999; Abbott et al.,2005; Naish et al., 2005).
Unit I surfaces at Site U1351 may be correlative withU19–U11 (Fig. F20). The geometries of U19–U11, aswell as paleoenvironmental interpretations from bio-stratigraphy, show that these surfaces developed onthe middle to outer shelf, where eustatic fluctuationshad the most significant direct impact. In contrast,surface U1351-S8 and the underlying strata formedwhen the position of Site U1351 was on the outer-most shelf, progressively migrating (downhole) tothe upper slope. Consequently, U1351-S8 is lesssharp than U1351-S1 to U1351-S7, and reworkedsediments are more difficult to identify belowU1351-S8.
These lithologic surfaces were also identified in UnitII at Site U1351, although cemented intervals occur,some of which may correlate with seismic sequence
Proc. IODP | Volume 317
boundaries. Diagenetic changes begin in the lowerpart of Unit I (at ~150 m), with authigenic carbonatecements and limestone concretions. Unit II is darkgreenish gray very fine sandy mud and greenishblack to dark greenish gray mud. Shells are less fre-quent below ~350 m and are absent below ~890 m,probably reflecting the downhole shift from shelf toslope environments. The indurated clayey or sandymud found in some core catchers in the lower part ofthe unit was drilling related, caused by frictionalheating and baking by the XCB cutting shoe. How-ever, other indurated intervals represent in situ car-bonate cementation. These nodules or concretionsare present throughout the unit, particularly below750 m. These have no clear relationship to intervalsof low recovery.
The facies associations linked with seismic sequenceboundaries at Site U1351 may also be present in UnitI at Site U1353, but they are not as prominent. Theuppermost three, and possibly four, surfaces identi-fied at Site U1353 correlate well with U19–U16 (Fig.F20). Surface U1353-S4 was not recognized in coresbecause of low recovery, but a biostratigraphic hiatusthat is potentially correlative with U16 was recog-nized. Correlations of other surfaces and associatedsediment packages at Site U1353 with seismic se-quence boundaries remain tentative because of poorrecovery (Fig. F17). Recovery from below 80 m at SiteU1353, the most landward of the shelf sites, was ei-ther low or involved significant cave-in of overlyingshell hash. The dominant recovered facies is mud,interpreted mostly to represent a highstand facies.Sandy intervals represent transgressive or regressiveperiods, whereas the shell hash, even when muddy,probably formed as a transgressive shoreface deposit.Although sediment recovered from Unit II was pre-dominantly muddy, recovery was low and otherlithofacies may have been present. The mud suggestsdeposition on a shelf below the fair-weather wavebase, and the lack of abundant shell debris suggeststhat the setting was more distal than it was duringdeposition of Unit I. The sediment source for terrige-nous sediments of both Units I and II at Site U1353appears to have been the Torlesse graywacke to thewest. This contrasts with sediments in Unit II atouter shelf Site U1351 and Subunit IB and Unit II atslope Site U1352, which include a major contribu-tion from the Otago Schist to the south.
Site U1354 facies associations are similar to those atthe other shelf Sites U1351 and U1353. Several po-tential unconformities were recognized withinUnit I. U19–U15 were intersected in both HolesU1354A and U1354B at depths comparable to thosepredicted (Fig. F20). The strongest correlation of lith-ologic surfaces to seismic sequence boundaries was
13

Expedition 317 Scientists Expedition 317 summary
found at Site U1354: a burrowed probable sequenceboundary in the same interval containing the Brun-hes/Matuyama boundary that corresponds to U16. A~0.3 m.y. gap that encompasses the Jaramillo normalchron, as demonstrated on nannofossil evidence,corresponds to U15. Furthermore, other older seis-mic sequence boundaries correspond to erosionalgaps in the succession. In many cases, more thanone candidate surface in the core was correlativewith seismically mapped surfaces. These stratal rela-tions suggest greater preservation of sediment at SiteU1354, which could potentially contribute to an un-derstanding of how sequence boundaries form andevolve. Correlations with seismic sequence boundar-ies therefore remain tentative, but good recovery inthe uppermost 250 m at Site U1354 should allow forimproved correlation between lithologic featuresand U19–U10. As at other Expedition 317 sites, poorrecovery in the lower part of the hole makes core-seismic correlation more difficult.
Lithostratigraphic correlation of shelf sites
Packages of lithofacies can be tracked across the shelfbetween the three shelf sites, from Site U1353 in wa-ter depths of ~85 m, through Site U1354, to SiteU1351 in water depths of ~122 m (Fig. F21). Gener-ally, the landward Holes U1353B and U1354B showcoarsening-upward trends. Muddy sand, presumablyof Holocene age, drapes the shelf but thins offshorefrom 9 to 4 m thick. A similar trend is evident in alayer of very fine, well-sorted quartz sand, whichthins offshore from nearly 10 m thick in HoleU1353B to 2 m thick in Hole U1351B. These sedi-mentation patterns are consistent with both the Ho-locene eustatic rise and a decrease in sedimentationrates at middle and outer shelf settings. Additionalshore-based studies will provide insight into the nu-merous depositional environments in which ob-served sedimentary cyclicity and sediments were de-posited, as well as their correlation between sites.
Slope site (U1352)
A number of distinct lithologic surfaces and their as-sociated sediments present at slope Site U1352 havethe potential to be resolvable by seismic profiles. Theuppermost 500 m of Site U1352 contains coarse-grained deposits that have been tentatively corre-lated to U19–U13. These remain the best-constrainedboundaries. However, because of improved recoveryat Site U1352 (Fig. F17), candidate slope surfaceswere also identified in all lithologic units down toand including the Marshall Paraconformity (Fig.F19).
Proc. IODP | Volume 317
Sedimentary cyclicitySeismic sequences and Milankovitch cyclicityThe relationship between high-frequency Milanko-vitch sequences and longer, seismically resolvable se-quences remains an active and unresolved area of re-search. Saul et al. (1999) showed that for theWanganui Basin, classic fourth- and fifth-order cy-clothems are grouped together into third-order cy-cles controlled by basinwide tectonic rhythms. Alter-natively, Miller et al. (2005) pointed out that somethird-order cyclicity may be the manifestation oflonger wavelength Milankovitch periodicities of 1.2and 2.4 m.y. or of interference between these cycles.
Sequences drilled during Expedition 317 span theboundary between Milankovitch-scale cyclicity andlonger third-order seismically resolvable cycles: peri-ods of most seismic sequences range from ~0.1 (sea-floor to ~U17) to ~0.4 m.y. (U16–U7) (Table T2; Fig.F22). The two upper seismically delimited sequenceson the Canterbury shelf (corresponding to the se-quences overlying U19 and U18) almost certainlycorrespond to marine isotope Stages (MIS) 1–5 andMIS 6–7 sedimentary cycles, based on the magneticsusceptibility and natural gamma radiation (NGR)time series (Fig. F23). Surfaces U1351-S1 to U1351-S4correlate with U18–U16, respectively. Between suc-cessive low spikes in this interval, gamma radiationshows four cycles of a gradual uphole increase fol-lowed by a decrease. These cycles correlate with fin-ing- to coarsening-upward facies associations, whichare formed by one cycle of transgression and regres-sion (e.g., U1351-S2 to U1351-S4; Fig. F19). Based onbiostratigraphic datums and the inferred position ofthe Brunhes/Matuyama boundary (~70 m at SiteU1351), we can speculate that these sequenceboundaries formed during periods of low global sealevel and perhaps correlate with three of the fourMIS 8, 10, 12, and 16 (Fig. F24). Three distinct inter-vals of low gamma radiation and high resistivity inwireline logging data across the three shelf sites cor-respond well to the predicted depths of U12, U11,and U10 (Fig. F25), which are also well resolved inpreliminary synthetic seismograms generated fromthe logs. These features, which most frequently coin-cide with intervals of poor core recovery, appear tobe associated with sand, shell, and gravel beds sev-eral meters thick that may be laterally continuousacross the shelf.
Postcruise analysis, including improved age controlfor deeper sequence boundaries, will document andclarify the probable relationship between seismic se-quences and Milankovitch cycles. Careful study willbe needed to distinguish lithologic changes corre-
14

Expedition 317 Scientists Expedition 317 summary
sponding to genuine Milankovitch cyclicity fromthose resulting from autocyclic variation within cy-cles controlled by sedimentary changes of local sig-nificance. It is already clear that Expedition 317 datawill provide important insights into the hierarchy ofsedimentary cyclicity and into how and why certaincycles and/or periodicities are preferentially imagedusing seismic data.
Pleistocene to Holocene glacial–interglacial cyclesExpedition 317 shelf sites (landward to basinward:U1353, U1354, and U1351) provide highly signifi-cant high-recovery sections through the Holocene–Pliestocene for high-resolution study of recent gla-cial cycles in a continental shelf setting. The smallerscale cycles penetrated during Expedition 317 drill-ing are similar in part to the Milankovitch-scalerhythms documented at nearby Site 1119 (ShipboardScientific Party, 1999a; Carter and Gammon, 2004)and the New Jersey shelf (McHugh and Olson, 2002)and correspond to cycles with inferred lengths of100,000 and 40,000 years. The seismic stratigraphyof the sequences deposited during the last (MIS 1–5)and penultimate (MIS 6–7) glacial–interglacial cycleson the Canterbury and Otago shelves has been de-scribed by Browne and Naish (2003) and Osterberg(2006).
Cycles drilled during Expedition 317 have differingsedimentary architectures depending on whetherthey were deposited seaward (Site U1352) or land-ward (Sites U1353 and U1354) of the inferred posi-tion of the last glacial lowstand shoreline (~125 m).Site U1351 at 122 m water depth is located near thelowstand shoreline. Cycles at slope Site U1352 are al-ways seaward of the lowstand shoreline. The mainsedimentary facies association on the slope is com-posed of a sharp basal contact with sand-filled Thala-ssinoides burrows overlain by a few decimeters ofshelly sand that grades upward into sandy mud. Sim-ilar cycles at Site 1119 were shown to contain tem-perate-water planktonic foraminifers in the basalsand (Shipboard Scientific Party, 1999a), with acolder water microfauna in the intervening muds;these facts are consistent with each cycle represent-ing a full interglacial–glacial rhythm (though per-haps with a diastem of a few thousand years, repre-sented by the sharp, burrowed bases of the sandunits). These rhythms are interpreted as resultingfrom oscillations in flow intensity of cold-waterSAMW, perhaps linked also to migrations of theSouthland (Subtropical) Front across the site (Carteret al., 2004b). The rhythms also have to be influ-enced by terrestrial sediment supply, which is likely
Proc. IODP | Volume 317
highest at lowstands and minimal to absent duringhighstands.
Glacial–interglacial deposits landward of the posi-tion of the lowstand shoreline are well developed inthe upper parts of Sites U1353 and U1354. These arecomposed of a sharp and sometimes burrow-pene-trated base, inferred to sometimes represent ashoreface ravinement surface, overlain by well-sorted sands as thick as several meters that grade rap-idly up into sandy siltstone and siltstone. A pedo-genic profile may be preserved below one or more ofthe ravinement surfaces that coincide with seismicsequence boundaries; if confirmed, this would be anunusual circumstance because virtually all of thePleistocene sequence boundaries in the onland Wan-ganui Basin are characterized by sharp (albeit oftenburrowed) marine ravinement surfaces cut duringtransgression, and only one soil profile has been re-corded (Abbott, 1992).
Some basal sandy units have a lower shelly portionor possess a shell-hash facies similar to the Type Atransgressive shell beds described from middle Pleis-tocene cyclothems in the onland Wanganui Basin(Abbott and Carter, 1994). The associated molluskfaunas are firmly indicative of a proximal shoreface–beach environment for the sandy and shelly units(Austrodosinia, Phacosoma, Anchomasa, Maoricolpus,and Alcithoe) and a distal shoreface–inner shelf envi-ronment (Atrina, Dosinia lambata, Divaricella, Maori-mactra, Scalpomactra, Antisolarium, and Stiracolpus)for the slightly deeper water siltstones.
Overall, the sedimentary cycles penetrated in the up-per parts of Sites U1353 and U1534 show strikingsimilarities to Pleistocene cyclothems described fromthe Wanganui Basin. Although in detail individualcycles display differing sedimentary architecturesthat await full description and interpretation, ele-ments of the Castlecliff motif (Abbott and Carter,1999; Saul et al., 1999) and the Birdgrove and Max-well motifs (Abbott et al., 2005) may all be repre-sented.
Located close to the lowstand shoreline, Site U1351displays cyclicity characteristic of the more shore-ward facies associations in its upper part and of theupper slope facies associations deeper in the hole.However, the uppermost cycles at Site U1351 arethicker and represent deeper water mud facies set-tings than those of their shelf counterparts at SitesU1353 and U1354, as would be expected. Some SiteU1351 cycles coarsen upward into sands before be-ing truncated by the superjacent sequence boundary,in similar fashion to Pliocene cycles described fromthe Wanganui Basin (Naish et al., 2005).
15

Expedition 317 Scientists Expedition 317 summary
Sedimentary processesOne goal of Expedition 317 was to provide insightsinto the role of contour-current deposition in a loca-tion where prominent sediment drift geometries areabsent. Slope Site U1352 is most relevant to thisquestion, but the deeper parts of Site U1351 alsosampled slope facies between U6 and U8.
Northeasterly flowing currents (Southland Current,inboard of the Subtropical Front, and a gyre of theSubantarctic Front) are active today. At present, thecore of the Southland Current is over the ~300 m iso-bath (Chiswell, 1996). The local gyre of the AntarcticCircumpolar Current circulates clockwise within thehead of Bounty Trough parallel to the SouthlandCurrent to at least 900 m (Fig. F2) (Morris et al.,2001). The sediment drifts in the northern part ofthe Canterbury Bight, as well as outcrop evidence ofcurrent-related deposition, suggest that similar cur-rents have been active for the last 30 m.y.
Early Pliocene and late Miocene nannofossil assem-blages at Site U1351 contain reworked older mate-rial, some as old as Oligocene, but mainly early tomiddle Miocene. The downhole increase in rework-ing began while paleowater depths were still rela-tively shallow (inner to middle shelf) and before thedownhole transition from shelf to upper slope facies,between U8 and U7 (~725 m), where paleowaterdepths became more equivalent to those influencedby modern ocean currents. Nannofossils are smalland easily transported. Reworked nannofossils at SiteU1351 may have been reworked from the CampbellPlateau, where Miocene sediment is shallowly buriedand may have been exposed. This suggests an along-strike component of deposition.
A nearly complete Neogene continental slope sedi-mentary record dominated by pelagic to hemipelagicsedimentation with minor traction and gravity flowsediments was cored at slope Site U1352, as was acondensed late Eocene to early Oligocene section be-low the Marshall Paraconformity. This site representsa downhole record of unlithified sediments transi-tioning to lithified carbonates at depth. The gradualdownward transition in lithofacies from more silici-clastic-rich Holocene–Pleistocene muddy facies intopelagic limestones and glauconitic marlstones andmarls appears to reflect the downhole transition,seen on seismic profiles, from an upper slope loca-tion on a clinoformal margin with sharp shelf-slopebreaks in the Holocene–Pleistocene toward a toe-of-slope location on a margin with more rounded shelf-slope breaks and a more gently inclined slope in theMiocene (Fig. F14). The lower carbonate content inthe upper part of this interval may be linked to
Proc. IODP | Volume 317
higher terrigenous input related to the uplift of theSouthern Alps and/or Neogene climate change.
Subunit IA at Site U1352 may be composed of sedi-ment gravity flows that fed a series of lowstand del-tas. Evidence for this is found in the composition ofthe sediments. The gray sand beds of Subunit IAhave a Torlesse Terrane mineralogy, indicating thatthey are derived from the Canterbury region. Thiscontrasts with the rest of Site U1352 (Subunit IB andbelow) and with Site U1351, which appear to be pre-dominantly sourced from the Otago Schist to thesouth. Subunit IB also seems likely to contain evi-dence of mass transport deposition, although theequivalent interval at Site 1119 was interpreted asbeing contourites. Subunit IB may be a transitional(downhole) downslope-to-drift interval culminatingin Subunit IC, which shows evidence (well-sorted,very fine–grained sand fraction) consistent with con-siderable transport distance and seismic evidence ofsediment drift deposition.
Unit II is dominantly calcareous (sandy marl andmarlstone). Hemipelagic to pelagic sediments of Sub-unit IIA (709–1189 m) may have been deposited assediment drifts, based primarily on seismic evidencedownslope and along strike (Fig. F14) (Lu and Fult-horpe, 2004): diagnostic sedimentary structures arerare, in part because of extensive bioturbation. Morecalcareous lithologies may represent condensed non-depositional intervals within the drifts. The increas-ing frequency of calcareous intervals toward the baseof Subunit IIA may reflect reduced rates of terrige-nous deposition near clinoform toes.
Subunit IIB (1189–1694 m) contains intermittentcurrent-generated structures (wavy laminations andripple cross laminations) interpreted as contourites.An alternation of light-colored marlstone withdarker mudstone suggests switching between morehemipelagic carbonate (highstand?) sources and ter-rigenous (lowstand?) sources. Subunit IIB also con-tains mass transport complexes (slumping) near itsbase. Subunit IIB lithologies therefore suggest a com-plex interplay between along-strike and downslopesedimentary processes.
Subunit IIC marlstones and limestones lack tractionfeatures, suggesting pelagic deposition from suspen-sion in deep water. Micropaleontology indicates alower bathyal setting. The intercalated glauconiticsandstone laminae characteristic of this unit are in-ferred to be injected sands derived from the underly-ing Oligocene greensand (Kekenodon Group), whichwas not recovered at this site. The Marshall Paracon-formity (see below) forms the boundary betweenUnits II and III. Unit III is Amuri Limestone–equiva-
16

Expedition 317 Scientists Expedition 317 summary
lent pelagic nannofossil limestone deposited inlower bathyal depths.
Marshall Paraconformity
The Marshall Paraconformity is a regional unconfor-mity terminating the postrift transgressive phase andcapping the widespread Amuri Limestone. The para-conformity has been dated at its onshore type sec-tion using strontium isotopes as representing a hia-tus between 32.4 and 29 Ma (Fulthorpe et al., 1996),where it occurs at the base of middle–upper Oligo-cene cross-bedded glauconitic sand (Concord Forma-tion) and calcarenite limestone (Weka Pass Forma-tion). The paraconformity was the deepest target ofExpedition 317 drilling and was hypothesized to rep-resent intensified current erosion or nondepositionassociated with the initiation of thermohaline circu-lation (Deep Western Boundary Current) and associ-ated shallower circulation upon the opening of theseaway between Antarctica and Australia (~33.7 Ma)prior to the opening of the Drake Passage (Carter,1985; Fulthorpe et al., 1996; Carter et al., 2004c).
The Marshall Paraconformity is represented by a lith-ologic change at 1853 m in Hole U1352C, a recordpenetration for a Deep Sea Drilling Project (DSDP)/ODP/IODP hole drilled during a single expedition(total depth was 1927 m). The paraconformity marksthe boundary between overlying lower Mioceneglauconitic limestone and underlying lower Oligo-cene recrystallized pelagic nannofossil limestonecontaining trace fossils and stylolites, equivalent tothe onshore Amuri Limestone. Recovery was lowacross the paraconformity, which is represented by adecimeter-scale rubble zone in the recovered core.No equivalent to Concord Formation glauconiticsand was recovered, although logs from the Clipperwell suggest the presence of a boundary sand layer.The hiatus at the paraconformity is estimated to be11–12 m.y. at Site U1352, conforming with previousobservations that the hiatus is longer offshore thanat the type section, perhaps owing to greater current-induced erosion at deeper water locations (ShipboardScientific Party, 1999a; Carter et al., 2004c). HoleU1352C terminated in upper Eocene (35.2–36.6 Ma)limestone with clayey interbeds.
Drilling results indicate that the Marshall Paracon-formity correlates with the “Green” reflection ob-served by industry interpreters (e.g., Hawkes andMound, 1984). Our original interpretations assumeda correlation with a reflection ~160 m shallowerthan “Green.” This, in turn, means that “Green”does not represent the base of the Amuri Limestone,as was previously inferred.
Proc. IODP | Volume 317
BiostratigraphySubtidal to lower bathyal sediments of Holocene tolate Eocene age (0–36 Ma) were cored in a transectacross the Canterbury Basin continental shelf andslope. Sequence stratigraphic processes influencedcalcareous nannofossil and planktonic foraminiferalassemblages, which is strongly reflected in the over-all abundance, preservation, and assemblage varia-tions in relation to lithology. These variations mayhave been influenced by a number of factors, includ-ing global climate, local paleoceanography, changesin sea level, and tectonic uplift along the AlpineFault. In general, Expedition 317 age assignments re-lied on nannofossils from the Holocene to middlePliocene and planktonic foraminifers from the earlyPliocene to late Miocene. Both fossil groups were in-tegral for biostratigraphic control from the middleMiocene to Eocene. The following biostratigraphyand resulting interpretations are described in the or-der of sequences drilled, from youngest to oldest.
HoloceneThe Holocene was not identified biostratigraphically,but, based on lithologic evidence, the thickness ofHolocene sediments decreased oceanward, from amaximum of 9.9 m at the innermost shelf SiteU1353 to 1.2 m at slope Site U1352. Mudline sam-ples from Sites U1352, U1353, and U1354 containedtemperate planktonic foraminiferal assemblages con-sistent with the Holocene highstand and the pres-ent-day landward position of these sites relative tothe Southland Front.
PleistoceneCalcareous nannofossil dating provided robust agecontrol through the Pleistocene and contributed tothe identification of several intra-Pleistocene hia-tuses at all three shelf sites. The hiatuses potentiallycorrespond to seismic surfaces inferred to representsequence boundaries (Fig. F22). Calcareous nanno-fossil abundances appear to be cyclical. Maximumabundances are thought to be correlated with high-stands and lowest abundances with lowstands. Thisis consistent with observed lithologic variations. Ingeneral, greenish gray sandy marls were associatedwith high numbers of calcareous nannofossils andwith temperate populations, whereas gray sandymuds were associated with low numbers of nanno-fossils and cool-water populations. The Pleistocenesection at slope Site U1352 was expanded relative tothe shelf sites, and the hiatuses seen at the shelf siteswere either absent or less pronounced at Site U1352.
Planktonic foraminiferal assemblages through thePleistocene sections of shelf Sites U1351, U1353, and
17

Expedition 317 Scientists Expedition 317 summary
U1354 were generally characterized by low abun-dances and small, thin-walled neritic forms typicalof deposition under inner neritic conditions (Fig.F26). These low abundances are consistent with anoffshore westerly wind pattern, similar to that of thepresent day. However, higher abundances indicativeof deposition under outer neritic or extraneritic con-ditions were noted in some samples, especiallygreenish gray sandy marls. These assemblages in-cluded larger temperate forms, whereas interbeddedgray calcareous muds were dominated by smallercold-water forms, including the subantarctic speciesNeogloboquadrina pachyderma. Similar alternationsbetween temperate and cold-water assemblages werenoted throughout the Pleistocene succession. Age-di-agnostic planktonic foraminifers that need deep wa-ter to complete their reproductive cycles were gener-ally rare, which contributed to poor planktonicforaminiferal dating through the Pleistocene. Plank-tonic foraminifers were better represented at slopeSite U1352 (Fig. F26), but temperate species that fa-cilitate a robust correlation with the New Zealandtimescale were relatively rare and were generallyonly found in greenish gray sandy marls. There werefew age-diagnostic species in intervals of gray calcar-eous mud.
PlioceneThe Pliocene/Pleistocene boundary is unconform-able at all four sites and is a major correlation surfaceclose to the predicted depth of U13 (Table T2). Bio-stratigraphic evidence indicated that most, if not all,of the upper Pliocene was missing. The thickness ofthe Pliocene succession was poorly constrained atthe innermost shelf Site U1353, but at middle shelfSite U1354 the middle Pliocene was 50 m thick, andthe lower Pliocene was at least 185 m thick. At theoutermost shelf Site U1351, where the Pliocene wasrepresented by a progradational middle and lowerPliocene succession, the middle and lower Pliocenesections were 100 and 580 m thick, respectively. Thesame progradational succession at slope Site U1352was 390 and 380 m thick, respectively.
Standard calcareous nannofossil zonation schemes(typically derived from mid- to low latitudes) couldnot be applied to the Pliocene section at any site inspite of their published presence at even highersouthern latitudes. This is attributed to cold subant-arctic waters that strongly influence the oceano-graphic setting of the Canterbury Basin. Age-diag-nostic planktonic foraminifers associated with theGloboconella sphericomiozea-puncticulata-inflata groupare common throughout the Pliocene section ofslope Site U1352 and the lowermost Pliocene sectionof outer shelf Site U1351. This, in combination with
Proc. IODP | Volume 317
calcareous nannofossils and seismic stratigraphy,provided age control through the Pliocene sectionsof the shallower shelf Sites U1353 and U1354.
At Site U1351, planktonic abundances increaseddownhole throughout the lower Pliocene section be-low 590 m, marking a downhole change from shelfalto slope sedimentation and reflecting oceanward mi-gration of the shelf break over the site. Significantly,a major influx of reworked late–middle Miocene cal-careous nannofossils occurred in this same interval.The absence of low-latitude zonal markers in the re-worked calcareous nannofossil assemblage indicatedthat it must have come from a cold southerly source.This has implications concerning the role of along-strike sediment transport, the focus of which appearsto be at the shelf break.
Similar increases in planktonic foraminiferal abun-dance related to slope deposition and reworking ofMiocene calcareous nannofossils were not seen inthe Pliocene sections of the shallower shelf sites. Infact, the Pliocene–?upper Miocene section of themost landward Site U1353 is largely devoid of micro-fossils, except for occasional pulses of calcareousnannofossils and planktonic foraminifers.
MioceneUpper Miocene sediments were recovered at SitesU1351, U1352, and U1353, although the dating andsubdivision of the Miocene was very poorly con-strained at the latter site. The Miocene/Plioceneboundary was identified between U7 and U6 and ispresumably conformable.
Reworked calcareous nannofossil material continuedthrough the 204 m thick progradational upper Mio-cene slope succession, except reworked taxa weremid-Miocene to Oligocene in age. The continuity ofthe upper Miocene section at Site U1351 was inter-rupted by a major hiatus between U6 and U5, wherea gap of ~5 m.y. exists between 5.6 and 10.5 Ma (Ta-ble T2).
At slope Site U1352, the progradational upper Mio-cene section was 220 m thick, overlying a 190 mthick middle Miocene section and a 170 m thicklower Miocene section. Deposition at this site oc-curred in a lower to basal slope environment underoceanic conditions (Fig. F26). The high abundanceof planktonic foraminifers and the presence of bol-boformids contributed to reliable dating at this site,although preservation was generally poor, especiallyin intervals of cemented sandy marl. Calcareousnannofossil assemblages in the Miocene section ofSite U1352 included pulses of reworking, but the to-tal amount of reworked material was less than that atSite U1351. The major hiatus recognized between U6
18

Expedition 317 Scientists Expedition 317 summary
and U5 in the lower upper Miocene section at SiteU1351 was also recognized at Site U1352, although itoccurs above, rather than below, U6. This suggeststhat the seismic mapping of U6 needs review. A sig-nificant hiatus was also noted between the middleand upper Miocene at Site U1352, where at least 1.3m.y. was missing. The same hiatus may have also oc-curred in the lowermost part of Site U1353, althoughages were poorly constrained at that site, which re-duces the reliability of the correlation. A markedchange to warmer planktonic foraminiferal and cal-careous nannofossil assemblages occurred in thelower Miocene below the level of the hiatus. This co-incided with the return of standard nannofossilzonal markers in the lower Miocene. Another majorhiatus associated with the Marshall Paraconformitywas recognized at the base of the Miocene succes-sion, where ~12 m.y. was missing. At Site 1123, lo-cated on the deep northeast slope of Chatham Rise~1000 km north-northeast of Site U1352, a similaramount of time was missing at the Marshall Paracon-formity (Shipboard Scientific Party, 1999a).
Oligocene to EoceneSlope Site U1352 was the only site where Oligoceneand Eocene sediments were recovered. Microfossilpreservation was generally poor, but nannofossil andplanktonic foraminifer markers were identifiable,providing solid age control. The extremely highabundances of planktonic foraminifers throughoutthis succession are consistent with basin floor depo-sition under an open oceanic watermass (Fig. F25).The Oligocene/Miocene boundary is unconformable(Marshall Paraconformity). This hiatus extendedfrom lower Miocene (18–19 Ma) to lower Oligocene(30.1–32.0 Ma), a gap of ~12 m.y. The Eocene/Oligo-cene boundary is also unconformable, falling withina hiatus of ~2.3 m.y. from the lower Oligocene (32.5–32.9 Ma) to the upper Eocene (35.2–36.0 Ma) (Fig.F22). The age at the bottom of the hole is 35.2–36.0Ma.
OceanicityPlanktonic foraminiferal abundance provides a mea-sure of overlying oceanicity and serves as a measureof the distance from land in paleogeographic recon-structions. Test size, diversity, and composition ofthe planktonic foraminiferal assemblages also serveas proxies for oceanicity.
Oceanicity records from Expedition 317 sites weremarkedly different, except in the Pleistocene. Thethree shelf sites all exhibited high-amplitude Pleisto-cene fluctuations in planktonic abundance (Fig.F26). These high-amplitude peaks may correspond to
Proc. IODP | Volume 317
highstands and could potentially be correlatedacross the shelf.
The Pliocene–Miocene succession of landward shelfSite U1353 was characterized by the absence ofplanktonic foraminifers, except for a single specimenfound in the last sample (Fig. F26). This is unusualeven in such a shallow marine environment and isin marked contrast with the continental shelf in theTaranaki Basin, where planktonic foraminifers wererelatively common. This difference is attributed tothe prevailing westerly wind pattern, which inTaranaki drives planktonics inshore and in Canter-bury drives them offshore. Turbid water over theCanterbury shelf, related to high-volume river dis-charge, may also have contributed to the paucity ofplanktonic foraminifers.
The Pliocene–Pleistocene record of oceanicity atshelf Site U1354 was similar to the correlative succes-sion at Site U1353, except planktonic abundanceswere slightly higher (Fig. F26). This is consistentwith the site location closer to the shelf break.
Planktonic abundances throughout the lower Plio-cene–Miocene succession of outermost shelf SiteU1351 increased from inner neritic to suboceanicvalues (Fig. F26). The onset of this downhole in-crease in the lower Pliocene occurred when the shelfbreak was located near the site. The subsequent in-crease in oceanicity below this level suggests that thesite was located progressively more oceanward of theshelf break. This trend was also reflected in the testsize and diversity of planktonic foraminiferal assem-blages. Second-order high-amplitude perturbationsin the oceanicity record of the slope succession maybe related to changes in sea level, although more de-tailed sampling is needed.
The abundance of planktonic foraminifers at slopeSite U1352 generally increased downhole from sub-oceanic values in the Pleistocene to fully oceanic val-ues in the Oligocene (Fig. F26). This is consistentwith deposition on the mid- to lower slope and pos-sibly the basin floor in the lowermost part of the suc-cession. It also indicates that the site was always lo-cated oceanward of the shelf break.
Benthic foraminifers and paleowater depthsAlthough their abundance varied, benthic foramini-fers constituted the major microfossil componentwithin the 150–1000 µm size fraction at all Expedi-tion 317 sites. The preservation of benthic foramini-fers was generally good in the Pleistocene, becamepoor to moderate in the Pliocene and Miocene atshelf Sites U1353, U1354, and U1351, and was poorin the Oligocene and Eocene at slope Site U1352.
19

Expedition 317 Scientists Expedition 317 summary
The Pleistocene assemblage was composed of mainlyinner to outer shelfal taxa at shelf Sites U1351,U1353, and U1354 and outer shelf to upper bathyaltaxa at slope Site U1352. Subtidal to inner shelfal as-semblages alternated with mid- to outer shelfal as-semblages at Sites U1351, U1353, and U1354, imply-ing cyclic changes in water depth. General trends ofdeepening or shallowing can be provisionally corre-lated with some seismic sequence boundaries (Fig.F27). Pliocene assemblages at the shelf sites are simi-lar to those of the Pleistocene, with marker speciessuggesting slightly deeper shelfal environmentsoceanward across the transect.
In spite of the poor preservation and rarity of earliestPliocene to latest Miocene benthic foraminifers atslope Site U1352, assemblages suggested a downholedecrease in shelfal species and an increase in upperbathyal marker species. Deep middle to deep lowerbathyal species were the main components in themiddle Miocene. Water depths at slope Site U1352therefore shallowed from lower bathyal to upper-most bathyal since the middle Miocene as the shelf-slope sediment prism prograded out into the basin(Fig. F27). Early Miocene and Oligocene benthic for-aminifers were too rare for reliable estimation of pal-eowater depths.
Age-depth plotsAge-depth plots (Figs. F28, F29, F30, F31) were cre-ated for each site using biostratigraphic datums, NewZealand stage determinations based on foraminiferalassemblages, and paleomagnetic reversal data at SiteU1354. At all sites, age control data points werespaced too far apart to determine sedimentationrates with accuracy; however, average sedimentationrates were calculated over the gross intervals be-tween major hiatuses, where the rate appeared to re-main constant (dashed lines). These rates may be av-eraged over unresolved hiatuses, so the relatively lownumbers may actually represent high rates of sedi-mentation separated by periods of nondepositionand/or erosion.
The pattern of sedimentation rates across the sitesindicates relatively slow deposition during the earlyto middle Miocene (data mainly from slope SiteU1352; Fig. F31), with one or more hiatuses in thelate Miocene, dividing this succession from a latestMiocene to Pliocene period of rapid depositionacross shelf sites (data from Sites U1354, U1351, andU1352; Figs. F29, F30, F31).
Note that the benthic foraminiferal datums includedin the plots are in some cases likely to be strongly af-fected by environmental changes. An example ofthis effect is the highest occurrence (HO) of Hopkin-sina mioindex at 1220 m in Hole U1352C (Fig. F31).
Proc. IODP | Volume 317
This datum (3.62 Ma) appears displaced from the restof the data points in this zone, perhaps because thespecies occurs only in water depths greater than~1000 m. This HO is therefore actually an indicationthat water depths in the depositional environmentreached 1000 m at this horizon.
Hiatuses were identified by the biostratigraphygroup based on the occurrence of multiple datums ata single stratigraphic level, as well as on “softer” datasuch as sudden changes in abundance, preservation,and faunal assemblages. Sometimes these hiatusescorresponded with lithologic changes or surfacesidentified in the cores, but, more often, low recoverymeant that unconformity surfaces were not recov-ered. The exception is Site U1354, where severalsharp lithologic changes were recovered in intervalswhere biostratigraphy identified hiatuses; the goodrecovery allowed the identification of two unconfor-mity surfaces between 60 and 80 m (Fig. F29),whereas at other sites only one unconformity wasdefinitely identified. Otherwise, the unconformitiesfirst identified at Site U1351 were also identified atother sites, particularly a mid-Pleistocene unconfor-mity (two surfaces at Site U1354), a significant un-conformable surface at the Pliocene/Pleistoceneboundary (identified at all sites), and a late Mioceneunconformity (or possibly two, identified at SiteU1352).
Porosity and backstrippingOne of the goals of Expedition 317 was to providethe data necessary to allow quantitative analysis ofsubsidence and, ultimately, sea level change in theCanterbury Basin using two-dimensional backstrip-ping. In addition to paleoenvironment and age data,backstripping requires an estimate of the history ofsediment compaction. Porosity measurements revealvariations in compaction of mixed, largely terrige-nous sediments as a function of both burial depthand location across the shelf to the upper slope (Fig.F32).
All sites showed rapid compaction in the upper sev-eral tens of meters, suggesting a rapid change fromloosely to closely packed grains. Beneath this is azone in which little porosity loss occurs with depth.The thickness of this zone increases from the middleshelf to the upper slope (Fig. F32). This zone is allbut absent at landward shelf Site U1353, where com-paction as a function of depth is most rapid. At up-per slope Site U1352, two overlapping compactiontrends were observed (Fig. F32). The coarser grainedfacies display rapid cementation and porosity loss,whereas interbedded finer grained sediments remainunlithified to greater depths and lose their porositymore slowly. Improved understanding of sediment
20

Expedition 317 Scientists Expedition 317 summary
compaction and diagenesis that arises from thesedata will be incorporated into backstripping models.
GeochemistryThe transect of four sites drilled during Expedition317 provided the opportunity to study pore fluidand sediment geochemistry from middle shelf to up-per slope settings spanning present-day water depthsof 85–344 m. This contrasts with the majority of sci-entific ocean drilling sites, which involve coring inwater depths of 1500–5000 m. Shelf sediments dis-play variability imposed by glacial–interglacialchanges in sea level and changes in conditions asso-ciated with discontinuities in sedimentation, includ-ing subaerial emergence, uplift, and erosion. Theseconditions introduce complications such as missingsection and major changes in variables such as tem-perature and pressure that affect the ephemeralproperties of pore fluids.
Many of the geochemical processes studied in theshipboard geochemistry program are driven by themicrobially mediated remineralization of organicmatter buried with the sediments. In addition, otherprocesses increase with burial depth as unstable min-eral assemblages are reorganized by dissolution andprecipitation. By sampling and analysis at successivecore depths, we attempted to piece together thedominant geochemical processes that have takenplace in the sediments. The analyses are groupedconveniently by gas, liquid, and solid.
Gas and shallow biogeochemical zonesDuring Expedition 317, cores at all four sites wereroutinely sampled for traces of residual dissolved gas,both as a hydrocarbon safety procedure and as a sen-sitive technique to determine the status of the mi-crobial and thermal degradation of organic matter.Combined with high-resolution water samples(taken in every section of recovered cores), this ap-proach led to detailed profiles covering the biogeo-chemical zones of sulfate reduction, anaerobic oxida-tion of methane (AOM), and methanogenesis at allsites (Fig. F33).
Sites U1351 and U1352 are located farther offshoreand have similar geochemical profiles distinct fromthose at Sites U1353 and U1354. At both sites a clas-sic sulfate–methane transition (SMT) zone is locatedat ~15–16 m. In sediments below the SMT, sulfate isvirtually absent, and methane concentrations in-crease dramatically from background levels in thelow ppmv range to >10,000 ppmv. Alkalinity at theSMT maximizes at 10 and 24 mM for Sites U1351and U1352, respectively (Fig. F33). The apparent lev-els of carbon oxidized and the low levels of ammo-
Proc. IODP | Volume 317
nium and phosphate generated at Site U1351 suggestthat sulfate reduction is primarily fueled by AOM,whereas at Site U1352 both AOM and organic matteroxidation are coupled with the removal of sulfate.Residual methane concentrations below the SMT re-main constant at 10,000–20,000 ppmv for both sites,approximately equivalent to 4–8 mM of methane perliter of pore volume, which probably represents only5%–10% of actual subsurface dissolved gas contents.However, ethane levels (shown by the methane/eth-ane [C1/C2] ratio) vary significantly. C1/C2 at SiteU1351 increases gradually with depth and tempera-ture, as expected, but C1/C2 ratios at shallow depthsare unusually low (400–600). This suggests somecombination of higher temperatures associated withwarmer bottom waters, some removal of sediment atunconformities, preferential loss of methane by an-aerobic oxidation, or gas loss from sands during corerecovery and sampling. At Site U1352, which is lo-cated farther offshore on the slope, gas just belowthe SMT has a C1/C2 ratio of 16,000, which is lowerthan most deepwater coring sites. The average C1/C2
ratio decreases by three orders of magnitude to ~60at the bottom of Hole U1352C at 1920 m. At an ap-parent discontinuity near 1390 m, only very low gascontent was found (~40 ppmv methane) and C1/C2
drops as low as 7, mainly from the near absence ofmethane. Below the discontinuity the gas resumesthe normal trend of residual methane contents(>10,000 ppmv). At both Sites U1351 and U1352,higher hydrocarbons (C3–C5) were detected in in-creasing amounts with depth, apparent products ofthe low-temperature alteration of organic matter inthe deeper cores.
Sites U1353 and U1354 are located on the shelf inwater depths of 85 and 113 m, respectively. Bothsites are characterized by the absence or low levels ofmethanogenic activity in the uppermost 150 m,leading to low methane concentrations (Fig. F33). AtSite U1353 no hydrocarbons above background lev-els were detected, and sulfate remains close to sea-water concentration, with the exception of slightlydecreased sulfate in a lower salinity interval at 20–70 m. No SMT is apparent, suggesting that either(1) methanogenesis did not occur in the sediments,(2) previously generated methane was lost when theshelf was emergent, or (3) methane was oxidizedwhen sulfate was replenished by diffusion after asubsequent sea level rise. Alkalinity never rises above6.5 mM and declines gradually with depth.
Hydrocarbon monitoring at Site U1354 showed twopeaks in methane, a small peak (23 ppmv) at 33–75 m, and a large peak below ~200 m, where meth-ane increased to >20,000 ppmv. In both cases meth-ane begins to increase when sulfate drops to zero,
21

Expedition 317 Scientists Expedition 317 summary
and the shallow methane peak disappears when sul-fate reappears in the cores. These alternations of me-thanogenesis appear to be related to changes in sedi-mentation rate. The upper and lower methane zonescorrespond to periods of rapid sedimentation (200–400 m/m.y.), during which sulfate was depleted andmethane was generated. The intermediate interval(60–178 m) corresponds to periods of slower sedi-mentation (<50 m/m.y.), when pore waters could bereplenished with sulfate by diffusion from overlyingseawater.
Interstitial water geochemistryInterstitial water was squeezed from sediments inmost of the sedimentary sequence for the three shelfsites but only in the uppermost 1400 m of slope SiteU1352. At this site pore water yields decrease from~2–5 mL/cm of whole round squeezed in the shal-lower sediments to <1 mL/cm below 1200 m, reflect-ing progressive compaction, porosity and water loss,and the general sediment to rock transformation.Pore waters in the Canterbury Basin have quite vari-able properties depending on site location on thetransect.
Below the sulfate reduction zone calcium always in-creases with depth, but at different rates and to dif-ferent values (Fig. F34). At Sites U1353 and U1354,the increase occurs mainly in the uppermost 200 mand reaches only moderate values (<20 mM),whereas at Sites U1351 and U1352 the calcium in-crease is noticeably sharp (at ~250 and ~500 m, re-spectively) and reaches values of 30 mM and higherin the deepest sediments at each site. These varia-tions are likely related to carbonate diagenesis, andpossibly contributions from deeper basinal brines,and are broadly consistent with dissolution of car-bonates and the poor preservation of microfossils.More particularly, there is evidently some exchangeof magnesium for calcium in the dissolution and re-precipitation of carbonates during diagenesis at SitesU1351 and U1352, as indicated by the greater de-clines in the Mg/Ca ratio and the higher carbonatecontent at these sites.
Alkalinity, mainly as bicarbonate ion produced byoxidation of organic matter, always decreases withdepth below the sulfate reduction zone and gener-ally reaches values <3 mM below 200 m (Fig. F33),although this transition, together with the increasein calcium, occurs at ~500 m at slope Site U1352.
Chloride and salinity generally co-vary, but there areother controls on sodium content. The salinity andchloride contents of pore water remain constant andnear seawater composition throughout slope SiteU1352, except for the deepest sample, which has asignificantly lower chloride content. At Site U1351
Proc. IODP | Volume 317
the chloride becomes more concentrated than sea-water between 50 and 200 m and again below900 m. The highest salinity and chloride values oc-cur at Site U1354, where they increase throughoutthe sequence and reach values of 3.8 and 694 mM,respectively. The deepest samples from Site U1353are also the most saline, but this site is also charac-terized by a salinity minimum in the uppermost150 m that reaches 2.4 mM or 70% of seawater at~50 m. This less saline lens affects the pore watercomposition of several other ions, including sodium,potassium, and magnesium (Fig. F34). The presenceof this less saline lens could be explained by eithermodern intrusion of meteoric water from land or bythe historic remains of freshwater that was emplacedwhen the shelf was emergent and is now beingslowly replaced by the downward diffusion of sea-water. However, this less saline water lens is not pres-ent at the more seaward Sites U1354 and U1351. Wa-ter depths are 85 m at Site U1353, compared with113 m at Site U1354 and 122 m at Site U1351. Globalsea level was ~125 m below today’s sea level at thelast glacial maximum about 20 k.y. ago, so both SitesU1353 and U1354 should have experienced periodsof complete emergence. Therefore, the lack of less sa-line water at Site U1354 and its presence at SiteU1353 are more likely explained by the modern in-trusion of meteoric water from land, rather than bythe historic remains of freshwater emplaced whenthe shelf was emergent.
Potassium concentrations decrease with depth at allfour sites, starting from slightly higher than seawatervalues of ~11 mM in the shallowest samples (Fig.F34). The decrease to <6 mM is rapid within the up-permost 150 m at the shelf sites but is much morecomplex at the slope site, with an initial decrease inthe sulfate reduction zone, an increase back to sea-water values, and finally a steady decrease to <4 mMbelow 800 m (Fig. F34). The decrease in potassium,and to some extent sodium, is likely related to diage-netic glauconite precipitation, which is a commonmineral at all four sites and usually appears aroundthe depth of the potassium drawdown.
Silica and silicon concentrations are always <1000µM and generally rapidly fluctuate in abundance inthe uppermost 100 m. At the slope site this variabil-ity persists throughout the section with interstitialwater samples, but silica and silicon are more consis-tent and less abundant below 700 m. At Site U1351silicon concentration levels are ~400–500 µM below100 m, whereas they are ~200 µM at nearer shoresites. This suggests that silica mobilization and pre-cipitation is more active nearer to shore, consistentwith the lower carbonate and greater clastic compo-nent at these sites.
22

Expedition 317 Scientists Expedition 317 summary
Lithium concentrations generally increase withdepth at all four sites, with very smooth profiles to<100 µM at Sites U1353 and U1354 and more com-plex patterns and higher overall concentrations atthe two more distal sites. The lithium increases maybe caused by dehydration reactions that removedlithium from clay interlayer exchange sites and insome cases are related to lithologic changes.
Barium concentrations increase rapidly in the shal-lowest samples (<40 m) and then generally remainsteady until >250 m, below which they increase. AtSites U1353 and U1354 this increase never exceeds10 µM, but barium concentrations are much higher(>20 µM) in Site U1352 samples below 500 m. SiteU1351 has intermediate barium concentrations inthe deeper sediments (5–12 µM) but higher abun-dance (up to 23 µM) in the four shallowest samples,which so far remains unexplained.
Boron concentrations also increase with depth at allfour sites, but to different values. Boron reaches ~0.6mM in the deepest sample (586 m) at Site U1353,1.26 mM at 318 m at Site U1354, and maximum val-ues of 4–5 mM at Sites U1351 and U1352. Thus,there is a trend of higher boron farther offshore anddeeper in the cores, which may be consistent with adiagenetic opal-A/opal-CT transition and microbialdegradation of organic matter.
Sediment geochemistryThe sediments cored at Site U1351 show marked dif-ferences in geochemistry with depth, with highercarbonate, higher nitrogen, and lower sulfur above200 m (Fig. F35). Organic carbon contents rangefrom <0.1 to 1.5 wt%, with more frequent highervalues in the uppermost 200 m. Pyrolysis character-ization suggests the organic matter is dominated bydegraded higher plant debris.
Analyses of sediment samples at Site U1352 also dis-tinguished the clay-rich lithologic Unit I from thecarbonate-dominated Unit II. Organic carbon con-tent was generally low (<0.6 wt%), with only a fewsamples having >1% total organic carbon (TOC) (Fig.F35). The character of the organic matter changesfrom relatively labile volatile material in the shal-lower sediments to more stable proto-kerogen down-hole, with evidence for increasing thermal maturityat total depth. The organic matter appears to bemainly terrestrial plant or degraded marine in origin.
At Site U1353 the average carbonate content ishighly variable but generally is lower below 300 m(Fig. F35). The decrease in TOC in the uppermost100 m can be correlated with intervals of increasedalkalinity and decreased sulfate and might representactive biological oxidation. Pyrolysis characteriza-
Proc. IODP | Volume 317
tion of organic matter suggests a major contributionfrom terrestrial plants, whereas ratios of TOC by dif-ference (TOCDIFF) to total nitrogen (TN) from elemen-tal analysis are consistent with a significant marineinfluence.
Only 18 Site U1354 sediment samples were analyzedfor carbonate content and by the elemental analyzerbecause of time constraints at the end of the expedi-tion. Calcium carbonate contents range from 1.3 to52 wt% in the sediments analyzed down to burialdepths of 81 m. Organic carbon ranges from 0.02 to1.1 wt%, with the highest value at 50 m (Fig. F35).TOCDIFF/TN generally decreases with depth, with theexception of some of the high-carbonate samples inthe 73–76 m depth interval.
MicrobiologyMicrobiological studies on sediment cores collectedduring DSDP, ODP, and IODP expeditions have dem-onstrated the presence of microbial communities indeeply buried marine sediments down to >1600mbsf. The Canterbury Basin is a promising place toexpand our knowledge of the deep biosphere in acomplex setting, representing the history of life un-der a variety of environmental constraints. The basinis heavily influenced by the input of terrestrial or-ganic matter and is therefore an excellent end-mem-ber environment to complement marine settingsthat have been studied during previous drilling expe-ditions.
The Expedition 317 shipboard microbiology pro-gram included collecting samples for onshore micro-biological investigations, assessing the degree of sea-water contamination of microbiological sedimentsamples, and testing a new cell-counting technique.Three sites were sampled for microbiology investiga-tions (Sites U1351, U1352, and U1353). Elevenwhole-round samples between 1630 m and the bot-tom of Hole U1352C at 1927 m were taken for mi-crobiological and organic geochemical characteriza-tion of in situ microbial communities. These sampleswill be studied in more detail onshore and could po-tentially extend the maximum known depth of hab-itable sediments.
A cell-counting technique recently developed by Mo-rono et al. (2009) was also tested. The procedureproved to be highly efficient, and discriminative detec-tion and enumeration of microbial cells in sedimentsusing diluted (1%) hydrofluoric acid was achieved atSite U1351. The greatest abundance of cells was foundin the near-surface sample, which contained 1.08 × 10⁸
cells/cm3, and the sample containing the smallestnumber of cells (1.34 × 10⁵ cells/cm3) was found at930.9 m. Generally, the total number of cells decreased
23

Expedition 317 Scientists Expedition 317 summary
rapidly with depth in the uppermost 4 m of sediment.This depth profile follows a trend observed at ODPsites, but the absolute number of prokaryotes is lowerthan the averages for all previously examined sites, par-ticularly below 4 m.
Contamination tests were performed on board usingparticulate tracers, providing confirmation that un-contaminated samples can be recovered and there isno difference in contamination produced by thethree types of coring (advanced piston corer [APC],XCB, and RCB). Nevertheless, the dispersion of thesetracers was found to not be homogeneous along thecore liner, and microsphere concentrations werefound to be diluted during RCB coring.
Preliminary scientific assessmentExpedition 317 marked a new direction for IODP byincorporating (1) drilling in shallow water on thecontinental shelf and (2) unusually deep penetra-tions. Expedition 317 set records for the shallowestwater depth for a site drilled for scientific purposesand the deepest hole drilled on a continental shelfby the JOIDES Resolution, as well as the deepest sedi-ment site and deepest site drilled in a single expedi-tion in the history of scientific ocean drilling.
Only Leg 174A (New Jersey margin) previously at-tempted shelf drilling using the JOIDES Resolution.Experience gained during Leg 174A, where uncon-solidated sands caused hole collapse during coring,suggested that similar problems might be encoun-tered during Expedition 317 and penetrations mightfall far short of target depths.
However, penetration during Expedition 317 ex-ceeded all expectations. Drilling of Canterbury Basinsediments went smoothly even at the shallowest wa-ter sites (including Site U1354 in only 85 m waterdepth) and reached 1030 m in Hole U1351B on theouter shelf (122 m water depth). The performance ofthe drillers and the level of cooperation and supportfrom the operations staff were superb. There was nohesitation in taking on new challenges.
Recovery was highly variable and, indeed, poorwithin long intervals of unconsolidated sediment,particularly at shelf Sites U1351 and U1353 duringXCB coring (Fig. F17). This may be unavoidable withexisting IODP coring technology. It would be veryuseful to develop new coring methods, if possible,for future operations in such lithologies. Percussiveor vibracoring tools could provide solutions, al-though it will be important to maintain a reasonablerate of penetration in order to core thick sectionsequivalent to those targeted during Expedition 317.On the other hand, XCB coring was effective in the
Proc. IODP | Volume 317
uppermost 250 m at shelf site Site U1354. A differentrecovery problem was encountered at slope site HoleU1352C, where RCB cores of solid rock with verylow recovery (1%–2%) were occasionally inter-spersed with cores having 100% recovery, for reasonsnot fully understood (it was speculated that heavyrock cores may have fallen out of the core barrels). Acorrelation between rate of recovery and degree ofsediment lithification was noted, with XCB drillingfailing to recover lithified sediments, and RCB drill-ing failing to recover unlithified sediments. How-ever, we believe that recovery was sufficient toachieve most of the expedition’s objectives, particu-larly in providing ground truth at the scale of seismicresolution (~5 m vertically).
Drilling in shallow water requires good weather (lowheave and wind speeds that can be managed by thedynamic positioning system). In this we were ex-tremely fortunate. Although it was often windy, onlytwo delays were caused by weather. One was rela-tively minor because it occurred when the ship wasabout to move from slope Site U1352 to landwardshelf Site U1353. The swell was considered too highfor shelf operations, so we used the opportunity toduplicate the uppermost 127 m at Site U1352 bydrilling Hole U1352D while we waited for conditionsto improve. This occupied <24 h. The second delaywas more serious and occurred at the final site (shelfSite U1354). The wind became too strong to main-tain position over the hole in such shallow water(113 m), and operations in Hole U1354B were shutdown after 73.6 m of APC coring. In this case wecould only wait for weather conditions to improve,given the short time remaining for the expeditionand the need to resume operations at Site U1354;however, once again the delay was <24 h. That theoperational plan was impacted by <2 days in >6weeks of operations, much of it in shallow water andin a region of unstable weather patterns, is remark-ably fortunate and a tribute to the abilities of the dy-namic positioning operators and drillers.
The upper sections (~500 m) of most of the bore-holes contained coarse-grained, unlithified materialthat proved highly unstable. This made wireline log-ging challenging, even in one instance when a dedi-cated logging hole was drilled (Hole U1351C). How-ever, the logging personnel worked hard to achievesuccess and were always prepared to commit thetools to these unstable holes. Strategies were refinedto manage the difficult conditions, including using aspecial tool combination at the final site.
It was possible to keep the holes clear of collapsingsand and shell hash during drilling while rotationand circulation were maintained, but, when thesewere stopped during logging, unconsolidated mate-
24

Expedition 317 Scientists Expedition 317 summary
rial flowed into the hole, forming bridges. In HoleU1351C this situation trapped the triple combina-tion (triple combo) tool string, which was rescuedusing the drill pipe in a 36 h operation. In addition,the Formation MicroScanner (FMS)-sonic tool stringcould not be pulled into the drill pipe in HoleU1353C because the centralizers were jammed by de-bris. The tool was retrieved by tripping the pipe asthe hole collapsed around it.
In spite of these difficulties, valuable logs were ob-tained, particularly at Site U1351, where the triplecombo tool string reached the bottom of HoleU1351B at 1030 m WSF during the first run; in HoleU1353C, where a triple combo run was also com-pleted in a dedicated logging hole to ~530 m WSF;and at Site U1354, where a special tool string(gamma ray/sonic/resistivity) reached total depth at380 m WSF. The caliper was at maximum extent overlong intervals in all holes in which a caliper was run,implying significant wash-out.
The limited success at Site U1352, where logging wasnot possible below ~500 m WSF in the 1927 m deepHole U1352C, was surprising given that the sedi-ments at this slope site were more fine grained thanat the shelf sites. However, the amount of time (2weeks) that Hole U1352C was open prior to loggingprobably caused significant deterioration of the hole,which may have played a part. The varying successat different sites may also have been related to theuse of varying amounts/weights of mud during log-ging at different sites. A degree of mud rationing wasrequired because of the heavy use of mud while cor-ing in unstable lithologies and in deep holes withenlarged diameters.
Sonic and vertical seismic profile (VSP) data were es-pecially important to expedition objectives for seis-mic correlation. However, although complete runswith the triple combo tool string were made to totaldepth in Holes U1351C and U1353C, the holes didnot stay open long enough to complete a run withthe second FMS-sonic tool string, let alone the thirdrun required for the VSP. Therefore, FMS-sonic runswere not completed to total depth (<500 m WSF inHoles U1351B and U1352B and ~230 m WSF in HoleU1353C). It was for this reason that a modifiedstring was used, with success, in Hole U1354C to to-tal depth at ~380 m WSF. No VSPs were conducted.Even if the holes had stayed open long enough for aVSP, wash-out made the holes too wide for the toolto make contact with the formation.
The sonic log from Hole U1351B requires postcruiseprocessing, but the sonic log from Hole U1352B wasused to generate a traveltime/depth conversion. Theresultant velocities proved to be anomalously lowerthan the precruise-predicted function, which is itself
Proc. IODP | Volume 317
evidently too low, at least for traveltimes corre-sponding to the deepest penetrations. Results fromHole U1353C may be more representative. The soniclog to ~230 m WSF yielded an excellent syntheticseismogram and estimated depths to seismic se-quence boundaries within the logged interval (U13–U10) that were 5–10 m deeper than predicted pre-cruise. The sonic log from Hole U1354C was ac-quired late in the expedition and was not assessedwhile at sea.
Although the logs obtained will be extremely valu-able, the limited depths reached by sonic logs, thelack of VSPs, and poor hole conditions limit our abil-ity to provide an improved traveltime/depth conver-sion for seismic correlation throughout the full ex-tent of the drilled interval. In a sense, wirelinelogging was a victim of Expedition 317’s success inachieving deep penetrations. However, the relativeease of drilling indicates that logging-while-drilling(LWD) would be ideal for Canterbury Basin sites. Useof LWD was discussed before the expedition. How-ever, the level of drilling difficulty and the associatedrisks to LWD equipment were anticipated to be moresevere than turned out to be the case. Coupled withthe cost of LWD operations at a time of financialconstraint, this led to the decision not to employLWD during Expedition 317. We hope that we willbe able to return with LWD in the future.
Site summariesSite U1351
BackgroundHole U1351A
Position: 44°53.0307′S, 171°50.4037′EStart hole: 0931 h, 18 November 2009End hole: 2330 h, 18 November 2009Time on hole (d): 0.58Seafloor (drill pipe measurement from rig floor, m
DRF): 133.3 (APC mudline)Distance between rig floor and sea level (m): 11.0Water depth (drill pipe measurement from sea
level, m): 122.3Total depth (drill pipe measurement from rig floor,
m DRF): 161.3Total penetration (m DSF): 28.0Total length of cored section (m): 28.0Total core recovered (m): 27.3Core recovery (%): 98Total number of cores: 6
Hole U1351B
Position: 44°53.0422′S, 171°50.4065′EStart hole: 2330 h, 19 November 2009
25

Expedition 317 Scientists Expedition 317 summary
End hole: 1800 h, 25 November 2009Time on hole (d): 6.77Seafloor (drill pipe measurement from rig floor, m
DRF): 132.7 (APC mudline)Distance between rig floor and sea level (m): 11.0Water depth (drill pipe measurement from sea
level, m): 121.7Total depth (drill pipe measurement from rig floor,
m DRF): 1163.3Total penetration (m DSF): 1030.6Total length of cored section (m): 1030.6Total core recovered (m): 304.5Core recovery (%): 30Total number of cores: 116
Hole U1351C
Position: 44°53.0572′S, 171°50.4057′EStart hole: 1800 h, 25 November 2009End hole: 0200 h, 30 November 2009Time on hole (d): 4.33 Seafloor (drill pipe measurement from rig floor, m
DRF): 132.7 (by proxy, Hole U1351B)Distance between rig floor and sea level (m): 11.0Water depth (drill pipe measurement from sea
level, m): 121.7Total depth (drill pipe measurement from rig floor,
m DRF): 1100.0Total penetration (m DSF): 967.3Total length of cored section (m): 0Total core recovered (m): 0Core recovery (%): 0Total number of cores: 0
Site U1351 is located on the outer shelf and is themost basinward shelf site of the Canterbury Basindrilling transect. Seismic sequence boundaries U6–U19 were penetrated at Site U1351. Lower Pliocene–upper Miocene sequence boundaries (below U9) fea-ture smooth onlapped paleoshelves and roundedclinoform breaks, or rollovers, with sigmoid internalreflection geometries. In contrast, upper Pliocene–Pleistocene sequence boundaries (above U9) displayeroded and incised downlapped paleoshelves andmore pronounced breaks with oblique reflection ge-ometries. U8–U19 were penetrated on their paleo-shelves, whereas U6 and U7 were penetrated on theirpaleoslopes.
LithostratigraphyStratigraphic changes at Site U1351 on the Canter-bury margin are fairly gradual, reflecting progressivedifferences in sedimentary styles. Two lithologicunits were differentiated based on transitional sedi-mentary facies. Unit I (0–262 m) is heterolithic,mainly dark gray to greenish gray or olive-gray incolor, and is composed of mud and sandy mud with
Proc. IODP | Volume 317
lesser shell hash, sand, and muddy sand. In contrast,Unit II (262–1024 m) is composed of mainly darkgreenish gray to greenish black sandy mud (sandymudstone) and muddy sand (muddy sandstone)with lesser sand (sandstone) and shell hash (lime-stone).
Unit I lithologies can be bounded by abrupt to gra-dational bedding planes, including distinct uncon-formities, and are locally bioturbated (ichnofabricindex of 1–5). Fining- and coarsening-upward beds,lamination, convolute bedding, and carbonate con-cretions are rare. The diverse assemblage of bioclasts/macrofossils is locally concentrated (shell hash) butis generally dispersed in the core and becomes lesscommon with depth. Coarse shelly beds on theboundaries are overlain by fining-upward sandymud and are followed by coarsening-upward litholo-gies. The arrangement of lithologies in Unit I is char-acteristic of eustatically influenced shelf successions.Tentatively, eight candidate surfaces (U1351-S1 toU1351-S8) were identified. These surfaces are allwithin the uppermost 250 m and generally havesharp basal contacts, are commonly bioturbated, andseparate coarse lithologies from underlying muds.
Unit II is generally structureless, becoming morelithified with depth owing to carbonate cementa-tion, as expressed in short pieces of cemented sandymudstone recovered in the XCB core catcher. Recov-ery in Unit II was poor, but contrasts across litho-logic boundaries appear more gradational downcore(from shelly to sandy to calcareous muds). Unit IIcomprises mainly dark greenish gray to greenishblack sandy mud with an ichnofabric index of 1–3.Mineralogy suggests southerly schist rather thanmore local graywacke provenance, perhaps reinforc-ing the importance of northeastward-flowing cur-rents during deposition. Alternatively, the schist de-tritus may be recycled from more local, uplifted, anderoded units onshore. The uppermost part of Unit IIrepresents the transition from a shelf to slope envi-ronment. Below ~300 m the sediments indicate de-position in an upper slope environment, with someintervals possibly influenced by drift deposition.
BiostratigraphyThe biostratigraphy of Site U1351 was based on ship-board study of calcareous nannofossils, diatoms, andplanktonic and benthic foraminifers in core catchersamples from Holes U1351A and U1351B. Additionalcalcareous nannofossil samples were taken fromwithin selected cores to address specific age andpaleoenvironmental questions. All microfossilgroups were present throughout the cored Holoceneto upper Miocene section, except for diatoms, whichwere present in only a few samples.
26

Expedition 317 Scientists Expedition 317 summary
The Holocene to Pleistocene section between Cores317-U1351B-1H and 18X (0–141.6 m) was primarilydated and divided using calcareous nannofossils intoZones NN21 (Cores 1H through 5H), NN20 (Cores6H through 10H), and NN19 (Cores 11H through18X). Benthic foraminifers suggested that waterdepths were variable throughout the Pleistocene butgenerally deepened downcore, from inner–middleshelf depths to middle–outer shelf depths. The Plio-cene section between Cores 317-U1351B-19X and94X (151.2–822.3 m) was primarily dated with cal-careous nannofossils in the upper part and withplanktonic foraminifers in the lower part. Reworkedcalcareous nannofossils of Miocene age occurredthroughout the lower part of the Pliocene, whichwas close to where planktonic foraminifers indicateda change to deposition on the slope and where thefirst consistently outer shelf to uppermost bathyalwater depths were recorded, the upper part of thePliocene being shallower. The Miocene section be-tween Cores 317-U1351B-95X and 116X (831.8–1030.6 m) was primarily dated with planktonic fora-minifers. A major hiatus was identified betweenSample 317-U1351B-113X-CC and Core 114X in thelowermost Miocene and was provisionally correlatedwith U5 in the seismic interpretation. Planktonicforaminifers and calcareous nannofossils suggested ahiatus of at least 3.4 m.y. Outer shelf to uppermostbathyal water depths persisted throughout the coredMiocene section, although planktonic foraminiferalabundances were consistent with deposition on theslope. The age at the bottom of Hole U1351B waslate Miocene (10.60–10.91 Ma).
PaleomagnetismNatural remanent magnetization (NRM) was mea-sured on all but the most heavily disturbed cores. In-tensities generally range from 10–2 to 10–4 A/m, withsome higher intensity zones, particularly at the topsof cores, attributed to cave-in. NRM orientationstend to show steep (~80°) positive inclinations anddeclinations clustered in the northern hemisphere.Alternating-field (AF) demagnetization was appliedat 10 and 20 mT steps and removed ~30% of theNRM. Where magnetic core barrels had been used(in XCB coring from 94.7 m drilling depth belowseafloor [DSF]), orientations changed very little withdemagnetization. In contrast, where nonmagneticcore barrels were used with APC coring at shallowerdepths, NRM orientations did change with demagne-tization. In the uppermost 65 m of Hole U1351B, in-clinations after 20 mT were negative (approximately–70°), suggesting a normal characteristic component.Between 65 and 94 m, core recovery decreased, andwhen material was available, inclinations shallowed
Proc. IODP | Volume 317
with demagnetization but remained positive, sug-gesting that the first polarity change occurs between65.9 and 69.7 m. Poor core recovery and a strongdrilling overprint at greater depths limited furthermagnetostratigraphic interpretations.
Physical propertiesSystematic whole-round and/or section-half mea-surements of magnetic susceptibility, NGR, gammaray attenuation (GRA) bulk density, and colorimetryrevealed patterns of sedimentation characterized bywell-defined cyclicity in the uppermost 180 m. Atgreater depths these patterns seem to be missing, butthis may be the result of poor core recovery. Down-hole logging suggests that lower amplitude cyclesmay persist to at least 400 m. Automated vane shear(AVS) and fall cone penetrometer (FCP) sedimentstrength tests and moisture and density (MAD)analyses reveal interesting trends. The observedshear strength generally reflects the cyclicity seen inother parameters in the uppermost 250 m. Addition-ally, abrupt changes or offsets in both magnetic sus-ceptibility and shear strength suggest the presence ofunconformities. A gradual increase in bulk densitywith depth was matched by a similarly subtle de-crease in porosity from an average of ~45% at thesurface to ~37% at 1000 m. Thermal conductivityvariations seemed to follow these trends.
GeochemistryHigh-frequency sampling established the midpointof the SMT at 16 m, based on the dissolved sulfateand methane gradients. The maximum alkalinity atthe SMT was 10 mM, with marked cation depletionsof 17 mM for Mg2+ and 5 mM for Ca2+. The apparentlevels of carbon oxidized and low levels of ammo-nium and phosphate generated suggest that sulfatereduction is fueled primarily by AOM. The initial gaspresent beneath the SMT contains ethane at rela-tively high levels (C1/C2 = 500–800), but absolute gascontents were low (3,000–20,000 ppm C1 in head-space or 1–6 mM in pore space). This suggests prefer-ential loss of methane due to AOM (possibly whenthe shelf at Site U1351 was emergent) or gas lossfrom sands during core recovery and sampling. Thegas did not show any major deviations from estab-lished trends at greater depths to 1000 m. The porewaters in the uppermost 250 m have moderately ele-vated Cl– and Na+ (~10% greater than seawater). Ca2+
increases from 16 to 40 mM, whereas Mg2+ decreasesfrom 30 to 20 mM over the interval between 200 and250 m. There are also marked differences in the sedi-ment geochemistry, with higher carbonate, highernitrogen, and lower sulfur above 200 m. Organic car-bon contents range from <0.1 to 1.5 wt%, with more
27

Expedition 317 Scientists Expedition 317 summary
frequent higher values in the uppermost 200 m. Py-rolysis characterization suggests that the organicmatter is dominated by degraded higher plant de-bris.
Heat flowOnly one out of five temperature measurementstaken at this site was of acceptable quality based onconductive cooling curves over >300 s. Using all fivetemperature measurements yields a poorly fit geo-thermal gradient of 14.1°C/km, much lower than the40°–50°C/km obtained at the Clipper well (Reyes,2007) and almost certainly in error. Thermal conduc-tivity measured in the laboratory (0.962–2.233 W/[m·K])was corrected to in situ conditions (0.959–2.215W/[m·K]). The resulting values increase linearlywith depth. Use of a Bullard plot yields a heat flow of20.1 mW/m2. However, as with the estimated geo-thermal gradient, heat flow values are suspect be-cause of insufficient reliable temperature measure-ments.
Downhole loggingDownhole logging took place in Holes U1351B andU1351C. Two tool strings were deployed in HoleU1351B: (1) the triple combo tool string, which mea-sures gamma radiation, bulk density, porosity, andelectrical resistivity, was run from the seafloor to1032 m WSF; (2) the FMS-sonic tool string, whichmeasures electrical resistivity images and sonic ve-locities, could not reach the total depth of the holeand acquired data from 74 to 488 m WSF. In HoleU1351C, only the triple combo tool string was de-ployed, recording gamma radiation and resistivityduring its descent between the seafloor and 801 mWSF. The tool was trapped by hole collapse, prevent-ing logging of the deeper section of Hole U1351C.The complete tool string was later recovered after a36 h recovery effort.
Three logging units were identified in the logs. Log-ging Unit 1 (83–260 m WSF) is characterized by rela-tively high amplitude variations in gamma ray val-ues, which increase overall with depth. In this unit,gamma ray minima associated with high resistivityand sonic velocities are consistent with sand layersalternating with clay. Logging Unit 2 (260–510 mWSF) is defined by low-amplitude variability in alllogs and trends of decreasing gamma radiation andresistivity. Three distinct intervals of uphole-increas-ing gamma radiation within this unit suggest fining-upward transgressive sequences. Caliper readingsconsistently higher than 19.5 inches in Units 1 and2 show that the formation has little cohesion. Thetop of Logging Unit 3 (510–1032 m WSF) is definedby significant downhole increases in gamma radia-
Proc. IODP | Volume 317
tion, density, and resistivity, which remain variablewith no distinct trends in this unit. The borehole di-ameter was slightly smaller (12–18 inches) but wasirregular, suggesting a change to more cohesive sedi-ments.
Site U1352BackgroundHole U1352A
Position: 44°56.2440′S, 172°1.3615′EStart hole: 1145 h, 30 November 2009End hole: 1530 h, 30 November 2009Time on hole (d): 0.16Seafloor (drill pipe measurement from rig floor, m
DRF): 354.8 (APC mudline)Distance between rig floor and sea level (m): 11.0Water depth (drill pipe measurement from sea
level, m): 343.8Total depth (drill pipe measurement from rig floor,
m DRF): 397.0Total penetration (m DSF): 42.2Total length of cored section (m): 42.2Total core recovered (m): 43.92Core recovery (%): 104Total number of cores: 5
Hole U1352B
Position: 44°56.2558′S, 172°1.3630′EStart hole: 1530 h, 30 November 2009End hole: 1615 h, 5 December 2009Time on hole (d): 5.03 Seafloor (drill pipe measurement from rig floor, m
DRF): 354.6Distance between rig floor and sea level (m): 11.0Water depth (drill pipe measurement from sea
level, m): 343.6Total depth (drill pipe measurement from rig floor,
m DRF): 1185.5Total penetration (m DSF): 830.9Total length of cored section (m): 830.9Total core recovered (m): 613.87Core recovery (%): 74Total number of cores: 94
Hole U1352C
Position: 44°56.2662′S, 172°1.3630′EStart hole: 2015 h, 5 December 2009End hole: 2200 h, 20 December 2009Time on hole (d): 15.07 Seafloor (drill pipe measurement from rig floor, m
DRF): 354.5 (tagging seafloor)Distance between rig floor and sea level (m): 11.0Water depth (drill pipe measurement from sea
level, m): 343.5
28
Expedition 317 Scientists Expedition 317 summary
Total depth (drill pipe measurement from rig floor, m DRF): 2282.0
Total penetration (m DSF): 1927.5Total length of cored section (m): 1296.4Total core recovered (m): 655.02Core recovery (%): 51Total number of cores: 146
Hole U1352D
Position: 44°56.2326′S, 172°1.3611′EStart hole: 0615 h, 21 December 2009End hole: 2100 h, 21 December 2009Time on hole (d): 0.61Seafloor (drill pipe measurement from rig floor, m
DRF): 345.2 (APC mudline)Distance between rig floor and sea level (m): 11.0Water depth (drill pipe measurement from sea
level, m): 344.2Total depth (drill pipe measurement from rig floor,
m DRF): 472.2Total penetration (m DSF): 127.0Total length of cored section (m): 127.0Total core recovered (m): 130.84Core recovery (%): 103Total number of cores: 14
Site U1352 is located on the upper slope within theCanterbury Bight and is the most basinward site ofthe Canterbury Basin drilling transect. Seismic se-quence boundaries U6–U19 were penetrated at SiteU1352, where sediments are finer grained and pe-lagic microfossils are more abundant than at shelfsites, providing good age control for sequencesdrilled on the shelf.
An additional target, requiring deep penetration, wasrecovery of the early Oligocene Marshall Paraconfor-mity. The paraconformity is presumed to record in-tensified current erosion or nondeposition at all wa-ter depths that accompanied the development of apartial Antarctic Circumpolar Current system follow-ing the opening of the seaway south of Tasmania.There are indications from Leg 181 drilling that theparaconformity developed in deep (bathyal) water~1–2 m.y. earlier than in shallow water. Dating theparaconformity in the offshore Canterbury Basin atSite U1352 tests this hypothesis by sampling it wherepaleowater depths were intermediate.
Because of time constraints, drilling into one of thelarge, elongate sediment drifts of the Canterbury Ba-sin became a secondary contingency objective. How-ever, it is likely that insights into sediment drift de-position and paleoceanography will be obtainedfrom Site U1352 cores. Current reworking of sedi-ments is evident at Site U1352, even though distinc-tive large-scale drift seismic geometries are absent.
Proc. IODP | Volume 317
LithostratigraphyFour holes were drilled at Site U1352, reaching a to-tal depth of 1927 m and spanning the Holocene tolate Eocene. This site contains a gradual lithologictransition between the Holocene and Miocene and amajor unconformity between the early Miocene andearly Oligocene at 1853 m. The succession is dividedinto three lithologic units.
Unit I (0–711 m) spans the Holocene to middle Plio-cene and contains predominantly mud-rich sedi-ment consisting of calcareous sandy mud, interbed-ded sandy mud and clay, interbedded sand and mud,massive sand, mottled sandy mud, homogeneousmud, shelly mud, and marl. The ichnofabric index is1–5. Unit I is divided into three subunits. Subunit IA(0–98 m) is dominated by interbedded mud, sand,and clay lithologies, with frequent greenish graysharp-based muddy sand or sandy mud beds. Sub-unit IB (98–447 m) contains more homogeneousmud and less frequent sharp-based greenish graymuddy sand or sandy mud beds. Subunit IC (447–711 m) represents a transition between the mud-dominated lithologies of Unit I and the calcareous li-thologies of Unit II. This gradual transition reflects aprogressive change in water depth to deeper slopedepositional environments.
Unit II (711–1853 m) spans the middle Pliocenethrough lower Miocene and contains hemipelagic topelagic sediment consisting of calcareous sandymud, sandy marls, chalk, sandy marlstone, andsandy limestone with minor amounts of calcareousmudstone and sandstone. The ichnofabric index is1–5. The unit is divided into three subunits. SubunitIIA (711–1189 m) ranges from homogeneous marl(in Hole U1352B) to bioturbated marlstone (in HoleU1352C). Occasional mudstone, muddy sandstone,and chalk lithologies also occur. Subunit IIB (1189–1694 m) contains abundant dark-colored mudstonebeds in the upper part and more frequent occur-rences of current bedding, especially toward the baseof the unit. The frequency of mudstone bed occur-rence decreases below 1392 m, in concert with otherchanges in mineralogy and an unconformity de-tected by biostratigraphy. Packages of recumbentand isoclinal folds, tilted beds, contorted strata, andfluid escape features are present both above and be-low this unconformity. Subunit IIC (1694–1853 m)contains a gradual progression from marlstone tolimestone, with frequent glauconitic laminae andbeds.
A ~12 m.y. unconformity occurs at the base of UnitII, with an abrupt change into lithologic Unit III(1853–1924 m [total depth]) consisting of hemipe-lagic to pelagic foraminifer-bearing nannofossil lime-stone of early Oligocene to late Eocene age with an
29

Expedition 317 Scientists Expedition 317 summary
ichnofabric index of 1–5. Except for minor abun-dances of quartz and clay, Unit III lacks siliciclasticcomponents. This unit is correlative to the onshoreAmuri Limestone.
Site U1352 represents an upper Eocene to lower Oli-gocene and nearly complete Neogene continentalslope sedimentary record dominated by pelagic tohemipelagic sedimentation with minor traction andgravity flow sediments. The sediments were depos-ited along a passive continental margin character-ized by large volumes of sediment from a tectoni-cally and climatically evolving hinterland. The siterepresents a unique downhole record from unlithi-fied sediments to lithified carbonates at depth. Thegradual downhole transition in lithofacies frommore siliciclastic-rich Pleistocene–Holocene muddyfacies into pelagic limestones and glauconitic marl-stones and marls appears to reflect the downholetransition, seen on seismic profiles, from an upperslope location on a clinoformal margin with a sharpshelf-slope break in the Pleistocene–Holocene to-ward a toe-of-slope location on a more ramplikemargin in the Miocene. The lower carbonate contentin the upper part of this interval may be linked tohigher terrigenous supply, possibly related to the up-lift of the Southern Alps and/or Neogene climatechange.
BiostratigraphySite U1352 recovered a Holocene–upper Eocene suc-cession. Fifty-five bioevents were recognized andused to provide a detailed biostratigraphic frame-work. Calcareous nannofossils were the primary dat-ing tool in the Pleistocene, whereas planktonic fora-minifers provided robust age control in thePliocene–middle Miocene section. Both fossil groupswere integral for biostratigraphic assessment of thelower Miocene–upper Eocene succession. Diatomswere sparse but provided two useful Pleistocene da-tums. Analysis of benthic foraminifer assemblagesyielded detailed estimates of paleowater depthsthroughout the succession.
A ~500 m thick progradational Holocene–Pleistocenesection was recovered, and 16 bioevents were distin-guished. The Pliocene/Pleistocene boundary wasconstrained between 492 and 525 m and is poten-tially unconformable. Sediments below the bound-ary were dated at 2.45–3.04 Ma, suggesting thatmost, if not all, of the upper Pliocene was missing.Pleistocene nannofossil abundances fluctuated dra-matically across predicted seismic sequence bound-aries (most notably from 0.8 Ma to recent). Similarfluctuations in planktonic foraminifer abundanceswere also noted near seismic surfaces interpreted assequence boundaries.
Proc. IODP | Volume 317
The progradational Pliocene interval was also thick(~785 m) and spanned Cores 317-U1352B-58Xthrough 73R (500–1285 m). As at Site U1351, allstandard nannofossil zonal markers (except Reticu-lofenestra pseudoumbilicus) were absent. The Mio-cene/Pliocene boundary was identified between1266 and 1284 m and is conformable, although po-tentially condensed toward the base of the Pliocene.
Twenty-six foraminifer and nannofossil datums wereobserved within the cored Miocene succession(1275–1851 m). The Miocene interval containedthree biostratigraphically defined unconformities: alower upper Miocene unconformity between Cores317-U1352C-90R and 91R (1395–1410 m), an un-conformity within the upper to middle Miocenetransition between Cores 101R and 102R (1487–1497 m), and the Marshall Paraconformity betweenCores 139R and 140R (1848–1853 m). The latter sep-arated lower Miocene sediments (~18–19 Ma) fromunderlying lower Oligocene sediments (30.1–32.0Ma), with ~12 m.y. absent.
The Oligocene and Eocene intervals were relativelythin (1851–1910 and 1910–1924 m, respectively).Microfossil preservation was generally poor in Oligo-cene sediments and moderate in the Eocene. Thisboundary was recognized between Cores 317-U1352C-146R and 147R (1903–1917 m) and was un-conformable, with ~2.3 m.y. missing. The bottom-hole age was constrained between 35.2 and 36.0 Main Core 148R (1924 m).
Pleistocene and Pliocene sediments were dominatedby inner to outer shelf benthic foraminiferal taxa, al-though the rare but persistent presence of bathyalmarker species suggested that the shallower shelfaltaxa were possibly reworked. Paleodepths generallyincreased downhole to lower bathyal depths in thelower part of the cored succession. Middle to deepbathyal taxa occurred in lower Pliocene and oldersediments, which is consistent with the generally in-creasing downhole abundance of planktonic fora-minifers through the progradational foreset se-quence into the bottom sets and basin floor faciesand coincides with the change from suboceanic tofully oceanic conditions.
PaleomagnetismNRM was measured on all but the most disturbedcores from all four holes at Site U1352. Intensityranged from 10–2 to 10–3 A/m in the upper half of thedrilled interval and decreased to 10–4 A/m in thelower half of the record (consistent with an increasein carbonate). One AF demagnetization step at peakfields of 20 mT was routinely applied. Where non-magnetic core barrels were used with APC coring
30

Expedition 317 Scientists Expedition 317 summary
(the uppermost 27 cores in Hole U1352B [to 246 m]),inclinations after 20 mT demagnetization are wellgrouped around –60.1°. The uppermost 18 cores (to166 m) are azimuthally oriented and show a meandeclination of 27.7° after correction. These values areclose to the orientation of the present-day magneticfield (inclination –70°, declination 25°). The rela-tively shallower inclination of this component sug-gests that it may be a primary magnetization. Thechange to magnetic barrels occurred within the in-terval where the Brunhes/Matuyama boundary wasanticipated (from biostratigraphic age determina-tions), and the boundary was not unambiguouslyidentified at this site. A pervasive drilling overprinthampered further magnetostratigraphic interpreta-tion.
Rock magnetic experiments and demagnetization ofdiscrete specimens indicate that a low-coercivitymineral is the main magnetization carrier. Thermaldemagnetization of NRM showed unblocking tem-peratures in the range of 320° to 340°C and an in-crease in susceptibility at ~400°C, suggesting thepresence of iron sulfides.
Physical propertiesCore physical properties change with depth broadly,as anticipated, with decreasing overall trends inmagnetic susceptibility and NGR and an increasingtrend in bulk density obtained from GRA and MADmethods.
The uppermost 275 m exhibits regular cyclicity inmagnetic susceptibility and NGR, similar to the NGRrecord at Site 1119. For example, three peaks be-tween 50 and 70 m in Hole U1352B correlate withpeaks in Holes 1119B and 1119C (between 36 and 46mbsf), which have been recognized as signals ofMIS 5. Magnetic susceptibility, NGR, GRA bulk den-sity, and color reflectance b* show unexplained butconspicuous negative peaks between 555 and 630 m,followed positive peaks at 665 m. Below the MarshallParaconformity (~1853 m), magnetic susceptibilityswitches to negative values, consistent with diamag-netic limestone.
Excellent P-wave velocity measurements were ob-tained using the P-wave caliper (PWC) method ondiscrete samples from cemented sediments in RCBcores from Hole U1352C. PWC values increaseslightly below 1255 m (averaging ~2500–3500 m/s)and increase strongly between 1500 and 1670 m (av-eraging ~3500–4000 m/s). Below ~1795 m P-wave ve-locity increases again to 5900 m/s, and an additionalslight increase in P-wave velocity was observed be-low the Marshall Paraconformity. The unexpected
Proc. IODP | Volume 317
high velocities below 1255 m may require a revisionof the traveltime/depth conversion of seismic re-cords.
Reflectance spectrometry measurements on splitcores revealed clear trends in both reflectivity andcolor. Variations in color were observed to correlatewith similar variations in magnetic susceptibility.
Results from MAD analyses revealed downholetrends in sediment compaction and lithification.Lithologic Subunit IA shows little downhole variabil-ity, but porosity begins to decrease and bulk densitybegins to increase in Subunit IB. Cementation beginsat this level and increases downcore toward litho-logic Subunit IIB, which is almost fully cemented.Grain density varies little with depth.
AVS and FCP sediment strength tests indicate thatsediments range from very soft (0–20 kN/m2) to verystiff (150–300 kN/m2). Sediment strengths correlatewell in very soft and soft sediments, but AVS tests ap-pear to underestimate shear strength in firm to verystiff sediments. The pronounced cyclicity in shearstrength seen at Site U1351 was not observed at SiteU1352.
GeochemistryThe SMT occurs between 15 and 17 m. The apparentlevel of carbon oxidized relative to sulfate reducedsuggests that sulfate reduction is driven by bothmethane oxidation and organic matter oxidation.The initial gas below the SMT contains ethane(2 ppmv) with C1/C2 of ~16,000. Gas compositionchanges regularly with increasing depth, reachingC1/C2 of ~60 near the bottom of Hole U1352C at1920 m. C3–C5 hydrocarbon abundance also gener-ally increases with depth. At an apparent unconfor-mity near 1390 m, gas content is very low (40 ppmvmethane) and C1/C2 drops as low as 7, mainly be-cause of the near absence of methane. Below the un-conformity the gas resumes the normal trend. Theinitial predominance of branched C4 and C5 alkanesin the gas decreases with depth. Below the unconfor-mity the normal/(normal + iso) C4 and C5 ratiosshow a large and consistent decrease followed by anincrease, which so far remains unexplained but mostlikely reflects the mixing of different gas generations.
Analyses of sediment samples distinguish the clay-rich lithologic Unit I from the carbonate-dominatedUnit II. Organic carbon content is generally low(<0.6 wt%), with only a few samples having >1 wt%TOC. The character of the organic matter changesfrom relatively labile volatile material in the shal-lower sediments to more stable proto-kerogen down-
31

Expedition 317 Scientists Expedition 317 summary
hole, with evidence for increasing thermal maturityat total depth. The organic matter appears to bemainly terrestrial plant in origin.
Interstitial water analyses were conducted to 1400m. Initial reductions in calcium and magnesium inthe SMT are related to microbial processes (sulfate re-duction and methanogenesis). Below 400 m, cal-cium, magnesium, and strontium concentrations ininterstitial water increase and alkalinity decreases,consistent with dissolution of carbonates and thepoor preservation of microfossils. Potassium and so-dium concentrations decrease markedly below300 m, possibly related to glauconite formation,whereas fluctuations in silica concentrations pointto dissolution of siliceous fossils. Increasing boronconcentrations below 200 m may reflect a diageneticopal-A/opal-CT transition and microbial degradationof organic matter. A lithium increase below 500 mcan be explained by dehydration reactions that re-move lithium from clay interlayer exchange sites.
Eleven whole-round samples were taken between1630 m and the bottom of Hole U1352C at 1927 mfor microbiological and organic geochemical charac-terization of in situ microbial communities. Onshoreinvestigation of these samples could potentially ex-tend the maximum known depth of habitable sedi-ments.
Heat flowFour good-quality temperature measurements outof six measurement attempts in the depth intervalfrom 94 to 313 m yielded a geothermal gradient of46.2°C/km. Laboratory thermal conductivity mea-surements from 8 to 1920 m, with a range of 0.849–3.440 W/(m·K), reveal a trend of increasing thermalconductivity with depth except in the topmost 90m, where a decreasing trend was observed. Two in-dividual trends were recognized: one for unlithifiedsediment from 90 to 800 m and another for hardrock from 600 to 1920 m. Thermal conductivityshows positive and negative relationships with bulkdensity and porosity, respectively. Heat flow wascalculated as 57.8 mW/m2 within the depth intervalwhere the geothermal gradient was established. As-suming steady-state heat flow, the temperature pro-file yields a bottom-hole temperature of ~60°C, butthis would be higher if a constant geothermal gradi-ent were assumed.
Downhole loggingDownhole logging at Site U1352 took place in HolesU1352B and U1352C. Two tool strings were de-ployed in Hole U1352B: (1) the triple combo toolstring, which measures natural gamma ray, bulk den-
Proc. IODP | Volume 317
sity, porosity, and electrical resistivity, was run fromthe seafloor to 487 m WSF, below which an obstruc-tion prevented it from reaching total depth, and(2) the FMS-sonic tool string, which measures electri-cal resistivity images and sonic velocities, encoun-tered the same blockage and acquired data from 82to 442 m WSF. In Hole U1352C, hole conditionswere unstable, and only a modified triple combo(without radioactive sources) tool string was de-ployed, recording gamma ray and resistivity betweenthe seafloor and 207 m WSF. Below 207 m WSF thetool string encountered a blockage that prevented itfrom reaching total depth.
Two logging units were identified. Logging Unit 1(82–250 m WSF) is characterized by relatively lowamplitude variations in gamma radiation, resistivity,and acoustic velocities. A distinct uphole-increasingand then uphole-decreasing trend in gamma radia-tion is consistent with gamma ray logs at Site 1119and may be associated with variations in clay con-tent. Resistivity decreases with depth in this unit,whereas velocity increases with depth. Caliper mea-surements consistently higher than 19.5 inches indi-cate an enlarged borehole in this interval. LoggingUnit 2 (250–487 m WSF) is defined by a change tohigher amplitude variations in gamma radiation, re-sistivity, and acoustic velocities. Gamma radiationand velocity show increasing trends with depth,whereas resistivity varies around a relatively con-stant value. Sharp peaks in P-wave velocity associ-ated with variations in density or lithology may cor-relate with significant seismic reflections in this unit.The borehole diameter is smaller but highly irregular(6–19.5 inches) and may reflect the appearance ofmore cohesive marls within the formation.
Site U1353BackgroundHole U1353A
Position: 44°46.1079′S, 171°40.4368′EStart hole: 0230 h, 22 December 2009End hole: 1115 h, 22 December 2009Time on hole (d): 0.36Seafloor (drill pipe measurement from rig floor, m
DRF): 95.5 (APC mudline)Distance between rig floor and sea level (m): 11.3Water depth (drill pipe measurement from sea
level, m): 84.2Total depth (drill pipe measurement from rig floor,
m DRF): 151.5Total penetration (m DSF): 56.0Total length of cored section (m): 56.0Total core recovered (m): 56.38Core recovery (%): 101Total number of cores: 8
32

Expedition 317 Scientists Expedition 317 summary
Hole U1353B
Position: 44°46.1203′S, 171°40.4407′EStart hole: 1115 h, 22 December 2009End hole: 2050 h, 26 December 2009Time on hole (d): 4.40Seafloor (drill pipe measurement from rig floor, m
DRF): 96.0 (APC mudline)Distance between rig floor and sea level (m): 11.3Water depth (drill pipe measurement from sea
level, m): 84.7Total depth (drill pipe measurement from rig floor,
m DRF): 710.3Total penetration (m DSF): 614.3Total length of cored section (m): 614.3Total core recovered (m): 211.48Core recovery (%): 34Total number of cores: 98
Hole U1353C
Position: 44°46.0982′S, 171°40.4380′EStart hole: 2050 h, 26 December 2009End hole: 2100 h, 28 December 2009Time on hole (d): 2.01Seafloor (drill pipe measurement from rig floor, m
DRF): 96.0 (by proxy, Hole U1353B)Distance between rig floor and sea level (m): 11.3Water depth (drill pipe measurement from sea
level, m): 84.7Total depth (drill pipe measurement from rig floor,
m DRF): 625.0Total penetration (m DSF): 529.0Total length of cored section (m): 0Total core recovered (m): 0Core recovery (%): 0Total number of cores: 0
Site U1353 is located on the middle shelf within theCanterbury Bight and is the most landward shelf siteof the Canterbury Basin drilling transect. As a result,Site U1353 was considered the most challenging site,both because the water depth at the site (85 m) is theshallowest of all Expedition 317 sites and also be-cause the lithologies at this inboard setting werelikely to be particularly coarse grained.
Site U1353 penetrates a middle Miocene–Holocenesection containing seismic sequence boundaries U5–U19. All sequence boundaries were penetrated land-ward of their rollovers, or paleoshelf edges, with thegoal of recovering proximal facies, yielding evidenceof shallow-water deposition, and providing optimalpaleowater depths from benthic foraminiferal bio-facies. Cores from Site U1353 include upper Mioceneto lower Pliocene sequence boundaries (below U10)that feature smooth onlapped paleoshelves androunded rollovers with middle Pliocene to Pleisto-cene sequence boundaries (U10 and above), which
Proc. IODP | Volume 317
display eroded and incised downlapped paleoshelvesand more pronounced rollovers.
LithostratigraphySite U1353 provides an excellent and unique sedi-mentary record of deposition through the Holocene–Pleistocene period of global sea level fluctuations.Hole U1353B also penetrated some of the older earlyPleistocene–Miocene seismic reflectors in the off-shore Canterbury Basin, which at this site are at rela-tively shallow subbottom depths of <500 m. Poorcore recovery, however, hindered lithologic interpre-tation in deeper portions of the hole.
Cores recovered from Holes U1353A and U1353Bshow a downhole transition from a heterolithic up-per section with abrupt contacts (Unit I) to a morefeatureless, mud-dominated section with depth(Unit II). These changes suggest a progressive andgradual change in sedimentary style as the marginevolved.
Unit I (Hole U1353B, 0–151 m) is characterized by itsoverall muddy character, the dominant lithology be-ing a dark greenish gray homogeneous mud with afew percent very fine sand. Shells are either rare andscattered or locally concentrated in layers as thick as15 cm. Bioturbation is common, with ichnofabric in-dexes of 3–4. Subordinate lithologies include shellymud to shell hash, micaceous well-sorted very finesand, clay, and sandy marl.
The dominant lithology of Unit II (Hole U1353B,151–614 m) consists of dark greenish gray, mica-ceous very fine sandy mud and mud, typically withshells. Both types of sediment are slightly to heavilybioturbated (ichnofabric indexes of 2–4). Sand andcemented intervals were recovered sporadicallythroughout the unit as minor lithologies.
Close similarities were noted between Site U1353and Sites U1354 and U1351 (located 13 and 20 km,respectively, to the southeast). Comparable Unit Iand II subdivisions and constituent lithotypes wererecognized at these sites, and potential lithologic ex-pression of seismic unconformities can also bematched between the sites. Site U1353 was inter-preted to represent a slightly more shoreline-proxi-mal equivalent of Sites U1354 and U1351. Deposi-tion is dominated by shelf processes, characterizedduring Unit I (Holocene–Pleistocene) by frequent sealevel variations and preceded by inner to middleshelf depositional settings through Unit II (earlyPleistocene–Miocene).
BiostratigraphyCalcareous nannofossil, planktonic and benthic for-aminifer, and diatom assemblages from Site U1353
33

Expedition 317 Scientists Expedition 317 summary
core catcher samples were used to create a shipboardbiostratigraphic framework. Benthic foraminiferswere also used to estimate paleowater depths. Dia-toms were sparse to absent at this site.
Site U1353 contained a Holocene to Miocene succes-sion. Thirteen biostratigraphic events were recog-nized, most of them in the Pleistocene. Pleistocenemicrofossil abundances were high, and assemblagesexhibited good preservation, which allowed for ro-bust age control, particularly with nannofossils. A hi-atus was recognized within the middle-lower Pleisto-cene section between Samples 317-U1353B-12H-CCand 14X-CC (80.12–80.77 m), where ~0.8 m.y. wasmissing.
The Pliocene/Pleistocene boundary was biostrati-graphically picked between Samples 317-U1353B-21H-CC and 23H-CC (121.16–135.71 m) and is un-conformable, missing most, if not all, of the upperPliocene. Biostratigraphic analysis of Pliocene andMiocene sediments at this site was particularly prob-lematic for all microfossil groups because of eitherlow abundances and/or the absence of biostrati-graphic markers. Below Sample 60H-CC (257.69 m),nannofossil abundances dropped sharply and re-mained low for the rest of the downhole succession.Samples below this level were nearly barren of plank-tonic foraminifers, but shelfal benthic foraminiferswere present, albeit without reliable age-diagnosticmarkers.
Nevertheless, several important datums allowed forbiostratigraphic constraint and critical correlationwith Sites U1351 and U1352. The early/middle Plio-cene boundary was distinguished on the basis of anannofossil datum (3.7 Ma) between Samples 317-U1353B-27H-CC and 28H-1, 124 cm (149.68–150.64 m). In combination with a planktonic fora-minifer datum (<4.3 Ma) it constrained the intervalfrom 150.64 to 256.04 m to the lower Pliocene be-tween 3.7 and 4.3 Ma. The Miocene/Pliocene bound-ary could not be picked biostratigraphically.
Although Site U1353 yielded no biostratigraphic evi-dence for upper Miocene sediments, the extrapola-tion of correlative seismic reflectors from outermostshelf Site U1351 supported the presence of an upperMiocene interval at Site U1353. A nannofossilmarker constrained between Samples 317-U1353B-88X-CC and 89X-CC (510.52–518.66 m) was datedolder than 12.03 Ma, indicating a substantial hiatusabove this interval, although the amount of timemissing is unknown. Samples below 90X-CC werebarren of calcareous nannofossils and planktonicforaminifers, except for the bottommost core catcher(98X-CC [604.60 m]), which contained sparse nan-nofossils with an assemblage age of middle to earlyMiocene.
Proc. IODP | Volume 317
Paleowater depths derived from benthic foraminifersranged from subtidal to outer shelf environmentsthroughout the Holocene to Miocene section butwere no deeper than outer shelf. Pleistocene paleo-water depths fluctuated between subtidal and middleshelf water depths, although a notable deepening toouter shelfal depths (correlated to the interval justabove the early/middle Pleistocene hiatus) was notedin Samples 317-U1353B-10H-CC and 11H-CC (67.5–73.19 m). Pliocene water depths were generally sub-tidal to inner shelf but ranged down to outer shelf inthe early Pliocene. Middle–early Miocene paleowaterdepths could not be interpreted because of low num-bers of benthic foraminifers.
PaleomagnetismNRM was measured on all but the most disturbedcores from Site U1353. NRM intensities are on theorder of 10–3–10–2 A/m and decrease to 10–4–10–3 A/mby AF demagnetization at peak fields of 20 mT. Asteep, northerly, positive drilling overprint was re-moved by AF peak demagnetization at 20 mT fromAPC cores recovered using nonmagnetic core barrels(Hole U1353B, 0–67.6 m). After demagnetization,remanence direction was oriented upward, or nega-tive (normal), with a mean inclination around –60°,consistent with a Brunhes age for this component.The overprint persisted (with declinations clusteredat north) where standard steel core barrels were usedat greater depths. Consequently, no reversals couldbe detected at Site U1353.
Rock magnetic experiments reveal lithology-depen-dent changes in magnetic behavior between graymuds and green silty/sandy intervals in HoleU1353B. Gray muds show relatively higher coercivi-ties (~80 mT) and lose ~80% of their remanence be-tween 250° and 360°C heating steps. Green, coarsergrained sediments have coercivities of ~40–50 mTand lose only 40%–50% of their remanence betweenthe same heating steps. Rock magnetic parametersare consistent with the presence of magnetic ironsulfides throughout the sediments and indicate thepresence of an additional remanence carrier, likelymagnetite, particularly in the greenish intervals.
Physical propertiesIn the uppermost 260 m, systematic whole-roundand/or section-half measurements of magnetic sus-ceptibility, NGR, GRA bulk density, and P-wave ve-locities, as well as colorimetry and MAD measure-ments, revealed patterns of sedimentationcharacterized by cyclic variations as well as evidencesuggestive of unconformities. Two abrupt excursionsin magnetic susceptibility, NGR, and color occur be-tween 13 and 17 m and between 27 and 36 m and
34
Expedition 317 Scientists Expedition 317 summary
are associated with thick sandy units. These peaksmay correlate with the two most recent glacial–inter-glacial cycles, MIS 1–5 and 6–7, and provide tenta-tive age estimates for the Holocene and latest Pleisto-cene.
Overall, magnetic susceptibility decreases, and P-wave velocity and bulk density increase downhole.Several abrupt shifts were observed in these trends.These shifts correspond to intervals where biostrati-graphic evidence indicates a hiatus, and those inter-vals could be related to erosion or a missing section.
A number of prominent peaks in magnetic suscepti-bility in the uppermost 80 m may be linked to caved-in shell-hash material observed at the top of eachcore, as observed previously at Site U1351. Thesefindings indicate that the noisy magnetic suscepti-bility signal below ~100 m may also be mainlycaused by the drilling process, including materialthat fell down onto the tops of cores (cave-in) or ma-terial that was sucked into the bottoms of core liners(flow-in). Caution is required before additional on-shore analyses confirm or reinterpret tentative ship-board observations.
Good P-wave velocity results were obtained in themuddy portions of the sediment to >585 m. Thiscontrasts with Sites U1351 and U1352, where highgas content in unlithified sediments destroyed the P-wave signal below the top ~20 m of soft sediments.
AVS and FCP sediment strength tests correlate well invery soft and soft sediments, but AVS test values areabout three times lower than FCP test values in firmto very stiff sediments. These findings, consistentwith those at Sites U1351 and U1352, suggest thatthe applicability of the AVS test in firm to very stiffsediments is limited in that it underestimates thestrength of such sediments.
GeochemistryGaseous hydrocarbon monitoring at Site U1353 didnot show significant levels of hydrocarbons abovethe background laboratory air concentration of ~2ppmv. Sulfate levels are never strongly depleted andno SMT is apparent, suggesting that either (1) me-thanogenesis did not occur in the sediments, (2) pre-viously generated methane was lost when the shelfwas emergent, or (3) methane was oxidized whensulfate was replenished by diffusion after a subse-quent sea level rise.
Interstitial water chemistry in the uppermost 150 mis dominated by a salinity minimum, reaching val-ues of 2.4, or 70% of seawater, at ~50 m. Below thisdepth salinity increases again to seawater values andreaches a value slightly higher than that of seawaterin the deepest sample at 586 m. The presence of this
Proc. IODP | Volume 317
less saline lens can be explained by either modernintrusion of meteoric water from land or by the his-toric remains of freshwater that was emplaced whenthe shelf was emergent and is now being slowly re-placed by the downward diffusion of seawater. Theprofiles of chloride, sodium, sulfate, and, to some ex-tent, potassium closely track the salinity trend andalso show minima at ~50 m. Normalization of alka-linity, sulfate, calcium, and magnesium profiles toseawater chloride concentrations allows the evalua-tion of changes due to reaction rather than dilutionwith freshwater. Chloride-normalized alkalinity in-creases from 3.2 mM near the seafloor to 9 mM at54 m, which co-occurs with a depletion of 8 mM inchloride-normalized sulfate. This implies that somesulfate reduction occurred and that alkalinity is af-fected by additional processes such as carbonate pre-cipitation and dissolution. The normalized calciumconcentrations increase with depth to 16 mM andpossibly reflect dissolution of calcareous microfos-sils. The chloride-normalized magnesium profileshows a steady decline downhole and levels out at45 mM. Increasing boron concentrations indicate re-lease of a desorbable boron fraction and degradationof organic matter. Similarly, the increasing lithiumamounts can be explained by desorption reactions.Barium concentrations seem to be coupled to thesulfate profile and increase slightly when sulfate con-centrations decline, possibly related to dissolution ofbarite.
Average carbonate content is highly variable but islower below 300 m. The decrease of TOC over theuppermost 100 m can be correlated with the inter-vals of alkalinity increase and sulfate decrease andmight represent active biological oxidation. Pyrolysischaracterization of organic matter suggests a majorcontribution from terrestrial plants, whereas C/N ra-tios from elemental analysis are consistent with asignificant marine influence.
Heat flowOne in situ temperature measurement was at-tempted with the third-generation advanced pistoncorer temperature tool (APCT-3), but it yielded poorresults. Additional temperature measurements werenot obtained because of difficult drilling conditions,and therefore heat flow could not be determined.Laboratory thermal conductivity measurements forthe depth interval 5.2–413.5 m provide a range of1.122–1.840 W/(m·K) and show two downhole-in-creasing trends: an increasing trend in the 0–32 minterval, with a local maximum at ~30 m, and a sub-sequent drop followed by another increasing trendto 413 m. The origin of the local maximum at ~30 mis unclear because porosity and bulk density are con-
35

Expedition 317 Scientists Expedition 317 summary
stant in the 20–50 m interval. In general, thermalconductivity varies positively with bulk density andnegatively with porosity. Thermal conductivity mea-surements are unreliable below 414 m.
Downhole loggingDownhole logging of dedicated logging HoleU1353C took place on 28 December 2009. Two toolstrings were deployed: (1) a modified triple combotool string (without radioactive sources because ofunstable hole conditions at this site), which mea-sured natural gamma ray and resistivity from the sea-floor to a total depth of 528 m WSF, and (2) the FMS-sonic tool string, which measured electrical resistiv-ity images and sonic velocities from 105 to 249 mWSF. Below 249 m WSF the FMS-sonic tool string en-countered a blockage that prevented it from reach-ing total depth.
Two units were identified in the logs. Logging Unit 1(105–260 m WSF) is characterized by an increasingtrend from the top of the unit to 180 m WSF. Belowthat interval the gamma ray trend decreases down-hole to ~250 m WSF. These trends are interrupted byabrupt high-amplitude lows in gamma radiation andpeaks in resistivity and velocity that are interpretedas sandy intervals, many of which coincide withsand or gravel at corresponding depths in HoleU1353B. These features also show good correspon-dence to significant seismic reflections. LoggingUnit 2 (260–528 m WSF) is characterized by overalldecreasing trends with depth in gamma radiationand resistivity, with low variability. The top of theunit is roughly the same depth as the onset of lowcore recovery in Hole U1353B and the point atwhich the FMS-sonic tool string was unable to de-scend deeper into the hole, suggesting a change inthe properties of the formation across the unitboundary.
Site U1354BackgroundHole U1354A
Position: 44°50.8281′S, 171°47.2096′EStart hole: 0415 h, 29 December 2009End hole: 2300 h, 29 December 2009Time on hole (d): 0.78Seafloor (drill pipe measurement from rig floor, m
DRF): 121.2 (APC mudline)Distance between rig floor and sea level (m): 11.4Water depth (drill pipe measurement from sea
level, m): 109.8Total depth (drill pipe measurement from rig floor,
m DRF): 206.6Total penetration (m DSF): 85.4
Proc. IODP | Volume 317
Total length of cored section (m): 83.4Total core recovered (m): 84.43Core recovery (%): 101Total number of cores: 18
Hole U1354B
Position: 44°50.8367′S, 171°47.2069′EStart hole: 2300 h, 29 December 2009End hole: 1245 h, 30 December 2009Time on hole (d): 0.57Seafloor (drill pipe measurement from rig floor, m
DRF): 124.8 (APC mudline)Distance between rig floor and sea level (m): 11.4Water depth (drill pipe measurement from sea
level, m): 113.4Total depth (drill pipe measurement from rig floor,
m DRF): 202.0Total penetration (m DSF): 77.2Total length of cored section (m): 77.2Total core recovered (m): 77.52Core recovery (%): 100Total number of cores: 15
Hole U1354C
Position: 44°50.8487′S, 171°47.2080′EStart hole: 0700 h, 31 December 2009End hole: 1200 h, 2 January 2010Time on hole (d): 2.21 Seafloor (drill pipe measurement from rig floor, m
DRF): 124.8 (by proxy, Hole U1354B)Distance between rig floor and sea level (m): 11.4Water depth (drill pipe measurement from sea
level, m): 113.4Total depth (drill pipe measurement from rig floor,
m DRF): 509.0Total penetration (m DSF): 384.2Total length of cored section (m): 319.2Total core recovered (m): 133.37Core recovery (%): 42Total number of cores: 35
Site U1354 (110 m water depth) is located on themid-outer shelf within the Canterbury Bight be-tween landward shelf Site U1353 and outer shelf SiteU1351 within the Canterbury Basin drilling transect.Site U1354 occupies an intermediate position in theshelf portion of the Expedition 317 transect. Litholo-gies and paleoenvironments were thus expected tobe intermediate between those at Sites U1351 andU1353.
Site U1354 penetrates a middle Miocene to Pleisto-cene section containing seismic sequence boundariesU8–U19. All sequence boundaries were penetratedlandward of their rollovers, or paleoshelf edges, withthe goal of recovering proximal facies, yielding evi-dence of shallow-water deposition, and providing
36
Expedition 317 Scientists Expedition 317 summary
optimal paleowater depths from benthic foraminif-eral biofacies.
The principal objectives at Site U1354 were to(1) sample facies landward of rollovers of prograda-tional seismic sequence boundaries U8–U19 and inparticular to use benthic foraminiferal biofacies toestimate paleowater depths both above and belowthese sequence boundaries in order to calculate eu-static amplitudes using two-dimensional backstrip-ping and (2) investigate the facies, paleoenviron-ments, and depositional processes associated withthe sequence stratigraphic model in a proximal set-ting on a prograding continental margin where se-quence architecture is well constrained by seismicimaging.
LithostratigraphyAt Site U1354, Holocene to lower Pliocene sedimentswere drilled at a water depth and location intermedi-ate between Site U1351 on the outer shelf and SiteU1353 on the middle shelf. This site provides an ex-cellent sedimentary record of deposition throughoutthe Holocene–Pleistocene period of eustatic sea levelfluctuation. Some of the older lower Pleistocene–Pliocene seismic reflectors in the offshore Canter-bury Basin were penetrated at this site at relativelyshallow subbottom depths. Core recovery was re-duced below 175 m, which hindered lithologic inter-pretation of the deeper parts of the section.
Lithologic changes suggest a progressive and gradualchange in sedimentary style as the margin evolvedand are consistent with similar observations made atother shelf sites. Cores recovered from HolesU1354A, U1354B, and U1354C show a downholetransition from a heterolithic upper section between0 and 251 m with abrupt contacts (Unit I) to a morefeatureless, mud-dominated succession below 251 m(Unit II). Unit I is further divided into Subunits IA(0–146 m) and IB (146–251 m).
Subunit IA is more heterolithic, containing darkgreenish gray to olive-gray calcareous muddy sand,sandy marl, and homogeneous marl (e.g., Cores 317-U1354A-1H and 317-U1354B-10H) and very darkgray, massive, quartz-rich, very well sorted very fine–fine sand (e.g., Cores 317-U1354A-7H and 317-U1354B-7H). The ichnofabric index ranges between1 and 5. Subunit IA also contains examples of sharpbioturbated contacts between very fine muddy sand(sometimes calcareous), above, and silty mud, below(e.g., Section 317-U1354B-13H-2). In contrast, Sub-unit IB lacks the aforementioned olive-gray marlsand massive sands and is characterized by more re-petitive assemblages of facies (e.g., Cores 317-U1354C-19X and 21X) consisting of homogeneousgreenish gray mud, which appears to be more clay
Proc. IODP | Volume 317
rich (e.g., Sections 317-U1354C-18X-1 and 12X-2)than that of Subunit IA and which contains a minorcalcareous component, and greenish gray to gray cal-careous sandy mud to sandy marl that often con-tains calcareous concretions (e.g., Sample 317-U1354C-21X-CC). The ichnofabric index ranges be-tween 1 and 5.
The dominant Unit II lithology consists of very darkand dark greenish gray to gray micaceous, very finesandy mud and mud, typically with shells. Bothtypes of sediment have variable degrees of bioturba-tion ranging from absent to moderate (ichnofabricindexes of 1–3). Muddy very fine sand with shells oc-curs as a minor lithology.
Site U1354 is interpreted to represent a slightly moreshoreline-proximal equivalent of Site U1351, butUnit I appears to represent a shallower water innershelf setting compared to Sites U1351 and U1353.This is surprising because Site U1354 is today in shal-lower water. Evidence for shoreface and subtidal de-position, including potential paleosols, suggests thatSubunit IA at Site U1354 might represent a shoaledregion of deposition. Several sharp, subtle contacts,along with biostratigraphic evidence for hiatuses, areevidence that sea level variations controlled the de-positional facies of Unit I. Unit II represents inner tomiddle shelf depositional settings during the Plio-cene. Potential lithologic expression of seismic se-quence boundaries can be matched between all threeshelf sites.
BiostratigraphyThe Holocene to early Pliocene biostratigraphy ofSite U1354 was based on the shipboard study of cal-careous nannofossils, diatoms, and planktonic andbenthic foraminifers in core catcher samples fromHoles U1354A, U1354B, and U1354C. Additional in-tra-core samples were taken from selected cores toaddress specific age and paleoenvironmental ques-tions using calcareous nannofossils. All microfossilsgroups were represented throughout the cored sec-tion, except for diatoms, which were only found in afew Pleistocene samples.
The Holocene to Pleistocene sections in HolesU1354A (0–85.4 m), U1354B (0–77.3 m), andU1354C (0–127.8 m) were primarily dated and di-vided with calcareous nannofossils. Two hiatuseswere identified with nannofossil dating: (1) an intra-Pleistocene hiatus at 76.2–80.2 m in Hole U1354Aand 73.7–73.9 m in Hole U1354B, where ~0.3 m.y.was missing, and (2) a hiatus at the base of the Pleis-tocene at 122.2–133.4 m in Hole U1354C, where ~1m.y. was missing. Another potential hiatus was iden-tified on the basis of calcareous nannofossil datingand magnetostratigraphic data in Holes U1354A and
37

Expedition 317 Scientists Expedition 317 summary
U1354B at 69.9 and 64.8 m, respectively. Benthic for-aminifers were generally indicative of subtidal tomiddle shelf depths throughout the Pleistocene, andplanktonic foraminifers suggested deposition gener-ally occurred under sheltered inner neritic condi-tions, except for short-lived excursions to outer ner-itic and extraneritic conditions.
The Pliocene section between 133 and 375 m waspoorly dated, although calcareous nannofossils andplanktonic foraminifers suggested that the age of thesection was middle Pliocene (>2.78 Ma, calcareousnannofossils) to late early Pliocene (>4.3 Ma, plank-tonic foraminifers). There was no biostratigraphicevidence for upper Pliocene sediments, which wereprobably missing at the level of the basal Pleistocenehiatus. Pliocene deposition occurred generally in in-ner shelf water depths, possibly ranging at times tomiddle shelf depths, under sheltered inner neriticconditions. The age at the bottom of Hole U1354C(375.3 m) was late early Pliocene (3.7–4.3 Ma), con-strained by calcareous nannofossils and planktonicforaminifers.
PaleomagnetismWhen possible, NRM was measured before and afterdemagnetization at 20 mT peak fields. Persistent fluxjumps in the superconducting rock magnetometer(SRM) rendered measurement difficult, and in somecases impossible, in the time available. In spite ofthis, a good, unambiguous record was recovered. Theuse of nonmagnetic core barrels throughout theoverlapping Holes U1354A and U1354B allowed theidentification of sediments holding reversed polarityfrom ~69.9 and 65 m downhole, respectively. TheBrunhes/Matuyama boundary lies within an uncon-formity marked by a sharp lithologic boundary inboth holes. Coring in Hole U1354C began just be-neath this boundary and revealed sediments with re-versed polarity of Matuyama age. Biostratigraphicconstraints indicate that the Jaramillo Subchron(C1r.1n, 0.998–1.072 Ma) was not recorded in sedi-ments from Site U1354. Below 78.1 m, coring inHole U1354C used the XCB system, which imparteda pervasive drilling overprint not fully removed dur-ing shipboard analyses.
Physical propertiesMagnetic susceptibility, NGR, and color recordsshow pronounced variations in the uppermost~170 m in all three holes, and these variations aresimilar to the patterns observed at other Expedition317 sites. Changes in magnetic susceptibility, NGR,and color can be linked to changes in lithology.Color changes, in particular, highlight the utility ofthis parameter for distinguishing between sands and
Proc. IODP | Volume 317
marls with low NGR and magnetic susceptibility.Abrupt changes in these records at 34 and 54 m alsocoincide with two changes in sulfate–methane abun-dances in Hole U1354A.
P-wave measurements yielded good results over theuppermost 217 m. Good results were also gainedfrom measurements made at Site U1353. At bothSites U1353 and U1354, the long record of good P-wave data can be ascribed to the absence of sedimentfracturing caused by high gas content. A change be-tween ~68 and 70 m in Hole U1354A and 64 and65 m in Hole U1354B marks both a hiatus and theposition of the Brunhes/Matuyama boundary. Thisboundary can also be recognized in NGR, magneticsusceptibility, and color data.
Decreases in porosity and void ratio and changes inbulk density are compatible with the porosity trendsseen at the other sites. Grain density shows somescatter, reflecting the variable lithology at this site.Sediment strength measurements have a similar pat-tern to that observed at all Expedition 317 sites.
GeochemistryGaseous hydrocarbon monitoring at Site U1354 re-vealed two peaks in methane content, one at 33–75 m, where headspace methane increases to a peakof 23 ppmv at 46 m, and one below ~200 m, whereheadspace methane increases to >20,000 ppmv.Where sulfate is zero, methane begins to increaseand then decreases to near background concentra-tions at 60 m, the depth at which sulfate reappearsin the cores. Sulfate is also fully depleted below 200m. The upper methane zone corresponds to a zoneof rapid sedimentation, above which sulfate was de-pleted quickly by both organic matter oxidation(one-third) and AOM (two-thirds). In the 60–178 mdepth interval the stoichiometry suggests that sul-fate reduction was driven almost exclusively by AOMand that apparently sediments in this depth intervalwere deposited at a rate slow enough to permit con-tinuous replenishment of dissolved sulfate by diffu-sion from overlying seawater.
One notable aspect of the shallow pore water chem-istry profiles at Site U1354 is the lack of a low-salin-ity zone like that seen at ~50 m at the more land-ward Site U1353. This helps clarify the origin of thislow-salinity zone. Because the water depth at SiteU1354 is only slightly deeper than at Site U1353,there is no reason to believe that these sites experi-enced significantly different exposure during low-stands caused by glaciation. Therefore, the presenceof a less-saline lens at Site U1353 is most likely ex-plained by modern intrusion of meteoric water fromland rather than by the historic remains of freshwa-ter emplaced when the shelf was emergent.
38
Expedition 317 Scientists Expedition 317 summary
Other changes in pore water chemistry at Site U1354are probably related to carbonate diagenesis and pos-sible contributions from deeper basinal brines. Themain decreases in dissolved calcium and magnesiumoccur within the depth intervals characterized bysulfate reduction, methanogenesis, and AOM. Theseprocesses are commonly associated with precipita-tion of authigenic carbonates with distinct carbonisotopic compositions. The increase in sodium andchloride from 0 to 60 m, possibly related to an influxof saline fluid, may also account for some of theother changes seen at Site U1354, such as the in-creases in barium, lithium, and boron with depth.
Because of time constraints at the end of the expedi-tion, only 18 sediment samples were analyzed forcarbonate content by the elemental analyzer. Cal-cium carbonate contents range from 1.3 to 52 wt%in the sediments analyzed down to burial depths of81 m. Organic carbon ranges from 0.02 to 1.1 wt%,with the highest value at 50 m. The ratio of TOC toTN generally decreases with depth, with the excep-tion of some of the high-carbonate samples in the73–76 m depth interval.
Heat flowTwo temperature measurements were made usingthe Sediment Temperature (SET) tool, but resultswere poor because of harsh coring conditions. Ac-cordingly, it was impossible to determine the geo-thermal gradient and heat flow at Site U1354. Labo-ratory thermal conductivity ranges from 1.183 to1.873 W/(m·K), showing a constant profile withdepth. Overall thermal conductivity correlates nega-tively with porosity and positively with bulk density.However, the highest values (>1.700 W/[m·K]) camefrom very fine–fine sand layers in Holes U1354A andU1354B that were not associated with low porosityand high bulk density, probably because the sandlayers consist mainly of highly thermally conductivematerial such as quartz.
Downhole loggingDownhole logging of Hole U1354C took place on 2January 2010. Based on the potential for unstablehole conditions, our previous experience loggingshelf sites, and time constraints at the end of the ex-pedition, we decided that a single logging run with-out radioactive sources was the most reasonable log-ging strategy for this site. A modified “sonic combo”tool string was deployed to measure natural gammaray, sonic velocities, and electrical resistivity fromthe seafloor to 383 m WSF.
Two units were identified in the logs. Logging Unit 1(110–285 m WSF) is characterized by an increasingtrend in gamma radiation from the top of the unit to
Proc. IODP | Volume 317
~185 m WSF, followed by a generally decreasingtrend to the base of the unit, punctuated by abrupthigh-amplitude lows in gamma radiation and peaksin resistivity and velocity. This unit is identical tologging Unit 1 at Site U1353, and the high-ampli-tude features at both sites correspond to coarsergrained intervals in the cores. Preliminary syntheticseismograms show that the two most prominentsand-rich intervals coincide with U10 and U11. Log-ging Unit 2 (285–384 m WSF) is characterized byslightly decreasing trends in gamma radiation andresistivity, with limited variability and increasing ve-locity. Unit 2 at this site is similar to logging Unit 2at Site U1353, which is characterized by low core re-covery associated with sandy sediments.
ReferencesAbbott, S.T., 1992. The mid-Pleistocene Waiomio Shellbed
(c. 500–600 ky), Wanganui Basin, New Zealand. Alcher-inga: Australas. J. Palaeontol., 16(2):171–180. doi:10.1080/03115519208619038
Abbott, S.T., and Carter, R.M., 1994. The sequence archi-tecture of mid-Pleistocene (0.35–0.95 Ma) cyclothems from New Zealand: facies development during a period of known orbital control on sea-level cyclicity. In de Boer, P.L., and Smith, D.G. (Eds.), Orbital Forcing and Cyclic Sequences, Spec. Publ. Int. Assoc. Sedimentol., 19:367–394.
Abbott, S.T., and Carter, R.M., 1999. Stratigraphy of the Castlecliffian type section: 10 mid-Pleistocene sequences from the Wanganui coast, New Zealand. N. Z. J. Geol. Geophys., 42:91–111. http://www.royalsoci-ety.org.nz/publications/journals/nzjg/1999/008/
Abbott, S.T., Naish, T.R., Carter, R.M., and Pillans, B.J., 2005. Sequence stratigraphy of the Nukumaruan strato-type (Pliocene-Pleistocene, c. 2.08–1.63 Ma), Wanganui Basin, New Zealand. J. R. Soc. N. Z., 35(1–2):123–150.
Adams, C.J.D., 1979. Age and origin of the southern Alps. In Walcott, R.I., and Cresswell, M.M. (Eds.), The Origin of the Southern Alps. Bull.—Roy. Soc. N. Z., 18:73–78.
Austin, J.A., Jr., Christie-Blick, N., Malone, M.J., et al., 1998. Proc. ODP, Init. Repts., 174A: College Station, TX (Ocean Drilling Program). doi:10.2973/odp.proc.ir.174a.1998
Batt, G.E., Braun, J., Kohn, B., and McDougall, I., 2000. Thermochronological analysis of the dynamics of the southern Alps, New Zealand. Geol. Soc. Am. Bull., 112(2):250–266. doi:10.1130/0016-7606(2000)112<250:TAOTDO>2.3.CO;2
Berggren, W.A., Kent, D.V., Swisher, C.C., III, and Aubry, M.-P., 1995. A revised Cenozoic geochronology and chronostratigraphy. In Berggren, W.A., Kent, D.V., Aubry, M.-P., and Hardenbol, J. (Eds.), Geochronology, Time Scales and Global Stratigraphic Correlation. Spec. Publ.—SEPM (Soc. Sediment. Geol.), 54:129–212.
Billups, K., and Schrag, D.P., 2002. Paleotemperatures and ice volume of the past 27 Myr revisited with paired Mg/
39
Expedition 317 Scientists Expedition 317 summary
Ca and 18O/16O measurements on benthic foraminifers. Paleoceanography, 17(1):1003. doi:10.1029/2000PA000567
Browne, G.H., and Field, B.D., 1988. A review of Creta-ceous–Cenozoic sedimentation and tectonics, east coast, South Island, New Zealand. In James, D.P., and Leckie, D.A. (Eds.), Sequences, Stratigraphy, Sedimentology: Surface and Subsurface. Mem.—Can. Soc. Pet. Geol., 15:37–48.
Browne, G.H., and Naish, T.R., 2003. Facies development and sequence architecture of a late Quaternary fluvial-marine transition, Canterbury Plains and shelf, New Zealand: implications for forced regressive deposits. Sed-iment. Geol., 158(1–2):57–86. doi:10.1016/S0037-0738(02)00258-0
Cande, S.C., and Kent, D.V., 1995. Revised calibration of the geomagnetic polarity timescale for the Late Creta-ceous and Cenozoic. J. Geophys. Res., 100(B4):6093–6095. doi:10.1029/94JB03098
Cande, S.C., and Stock, J.M., 2004. Pacific–Antarctic–Aus-tralia motion and the formation of the Macquarie Plate. Geophys. J. Int., 157(1):399–414. doi:10.1111/j.1365-246X.2004.02224.x
Carter, L., Carter, R.M., McCave, I.N., and Gamble, J., 1996. Regional sediment recycling in the abyssal south-west Pacific Ocean. Geology, 24(8):735–738. doi:10.1130/0091-7613(1996)024<0735:RSRITA>2.3.CO;2
Carter, R.M., 1985. The mid-Oligocene Marshall Paracon-formity, New Zealand: coincidence with global eustatic sea-level fall or rise? J. Geol., 93(3):359–371. doi:10.1086/628957
Carter, R.M., 1988. Post-breakup stratigraphy of the Kaik-oura Synthem (Cretaceous–Cenozoic), continental mar-gin, southeastern New Zealand. N. Z. J. Geol. Geophys., 31:405–429.
Carter, R.M., 2007. The role of intermediate-depth currents in continental shelf-slope accretion: Canterbury Drifts, SW Pacific Ocean. In Viana, A.R., and Rebesco, M. (Eds.), Economic and Paleoceanographic Significance of Contourite Deposits. Geol. Soc. Spec. Publ., 276(1):129–154. doi:10.1144/GSL.SP.2007.276.01.07
Carter, R.M., Abbott, S.T., Fulthorpe, C.S., Haywick, D.W., and Henderson, R.A., 1991. Application of global sea-level and sequence-stratigraphic models in Southern Hemisphere Neogene strata from New Zealand. In Mac-donald, D.I.M. (Ed.), Sedimentation, Tectonics, and Eustasy: Sea-level Changes at Active Margins. Spec. Publ. Int. Assoc. Sedimentol., 12:41–65.
Carter, R.M., Fulthorpe, C.S., and Lu, H., 2004a. Canter-bury drifts at Ocean Drilling Program Site 1119, New Zealand: climatic modulation of southwest Pacific inter-mediate water flows since 3.9 Ma. Geology, 32(11):1005–1008. doi:10.1130/G20783.1
Carter, R.M., and Gammon, P., 2004. New Zealand mari-time glaciation: millennial-scale southern climate change since 3.9 Ma. Science, 304(5677):1659–1662. doi:10.1126/science.1093726
Carter, R.M., Gammon, P.R., and Millwood, L., 2004b. Gla-cial–interglacial (MIS 1–10) migrations of the subtropi-
Proc. IODP | Volume 317
cal front across ODP Site 1119, Canterbury Bight, Southwest Pacific Ocean. Mar. Geol., 205(1–4):29–58. doi:10.1016/S0025-3227(04)00017-9
Carter, R.M., and Landis, C.A., 1972. Correlative Oligocene unconformities in southern Australasia. Nature (Lon-don), Phys. Sci., 237:12–13.
Carter, R.M., McCave, I.N., and Carter, L., 2004c. Leg 181 synthesis: fronts, flows, drifts, volcanoes, and the evolu-tion of the southwestern gateway to the Pacific Ocean, eastern New Zealand. In Richter, C. (Ed.), Proc. ODP, Sci. Results, 181: College Station, TX (Ocean Drilling Pro-gram), 1–111. doi:10.2973/odp.proc.sr.181.210.2004
Carter, R.M., and Norris, R.J., 1976. Cainozoic history of southern New Zealand: an accord between geological observations and plate-tectonic predictions. Earth Planet. Sci. Lett., 31(1):85–94. doi:10.1016/0012-821X(76)90099-6
Chiswell, S.M., 1996. Variability in the Southland Current, New Zealand. N. Z. J. Mar. Freshwater Res., 30:1–17. http://www.royalsociety.org.nz/publications/jour-nals/nzjm/1996/100/
Christie-Blick, N., 1991. Onlap, offlap, and the origin of unconformity-bounded depositional sequences. Mar. Geol., 97(1–2):35–56. doi:10.1016/0025-3227(91)90018-Y
Christie-Blick, N., Austin, J.A., Jr., and Shipboard Scientific Party, 1998. Introduction: Oligocene to Pleistocene eustatic change at the New Jersey continental margin—a test of sequence stratigraphy. In Austin, J.A., Jr., Chris-tie-Blick, N., Malone, M.J., et al., Proc. ODP, Init. Repts., 174A: College Station, TX (Ocean Drilling Program), 5–16. doi:10.2973/odp.proc.ir.174A.101.1998
Christie-Blick, N., and Driscoll, N.W., 1995. Sequence stra-tigraphy. Annu. Rev. Earth Planet. Sci., 23(1):451–478. doi:10.1146/annurev.ea.23.050195.002315
Christie-Blick, N., Mountain, G.S., and Miller, K.G., 1990. Seismic stratigraphic record of sea-level change. In National Research Council (Ed.), Sea-level Change: Wash-ington, DC (National Academy Press), 116–140.
Cloetingh, S., McQueen, H., and Lambeck, K., 1985. On a tectonic mechanism for regional sealevel variations. Earth Planet. Sci. Lett., 75(2–3):157–166. doi:10.1016/0012-821X(85)90098-6
Coombs, D.C.R., Kawach, Y., Landis, C.A., McDonough, W.F., and Reay, A., 1986, Cenozoic volcanism in north, east, and central Otago. In Smith, I.E.M. (Ed.), Late Cenozoic Volcanism in New Zealand. Bull—R. Soc. N. Z., 23:278-312.
COSOD II, 1987. Report of the 2nd Conference on Scientific Ocean Drilling: Washington/Strasbourg (JOIDES/Euro-pean Sci. Found.).
Dewey, J.F., and Pitman, W.C., 1998. Sea level changes: mechanisms, magnitudes and rates. In Pindell, J.L., and Drake, C.L. (Eds.), Paleogeographic Evolution and Nongla-cial Eustasy, Northern South America. Spec. Publ.—SEPM (Soc. Sediment. Geol.), 58:1–16.
Eberli, G., Swart, P., and Malone, M., 1996. ODP Prelim. Rept., 166. doi:10.2973/odp.pr.166.1996
Expedition 313 Scientists, 2010. New Jersey Shallow Shelf: shallow-water drilling of the New Jersey continental
40

Expedition 317 Scientists Expedition 317 summary
shelf: global sea level and architecture of passive margin sediments. IODP Prel. Rept., 313. doi:10.2204/iodp.pr.313.2010
Field, B.D., and Browne, G.H., 1989. Cretaceous and Ceno-zoic Sedimentary Basins and Geological Evolution of Canter-bury Region, South Island, New Zealand. N. Z. Geol. Surv., Basin Stud., 2.
Findlay, R.H., 1980. The Marshall Paraconformity. N. Z. J. Geol. Geophys., 23(1):125–133.
Fleming, C.A., 1962. New Zealand biogeography: a paleon-tologist’s approach. Tuatara, 10:53–108.
Fulthorpe, C.S., Miller, K.G., Droxler, A.W., Hesselbo, S.P., Camoin, G.F., and Kominz, M.A., 2008. Drilling to deci-pher long-term sea-level changes and effects—a joint consortium for Ocean Leadership, ICDP, IODP, DOSECC, and Chevron workshop. Sci. Drill., 6:19–28. doi:10.2204/iodp.sd.6.02.2008
Fulthorpe, C.S., and Carter, R.M., 1989. Test of seismic sequence methodology on a Southern Hemisphere pas-sive margin: the Canterbury Basin, New Zealand. Mar. Pet. Geol., 6(4):348–359. doi:10.1016/0264-8172(89)90031-7
Fulthorpe, C.S., and Carter, R.M., 1991. Continental-shelf progradation by sediment-drift accretion. Geol. Soc. Am. Bull., 103(2):300–309. doi:10.1130/0016-7606(1991)103<0300:CSPBSD>2.3.CO;2
Fulthorpe, C.S., Carter, R.M., Miller, K.G., and Wilson, J., 1996. Marshall paraconformity: a mid-Oligocene record of inception of the Antarctic Circumpolar Current and coeval glacio-eustatic lowstand? Mar. Pet. Geol., 13(1):61–77. doi:10.1016/0264-8172(95)00033-X
Haq, B.U., Hardenbol, J., and Vail, P.R., 1987. Chronology of fluctuating sea levels since the Triassic. Science, 235(4793):1156–1167. doi:10.1126/sci-ence.235.4793.1156
Hawkes, P.W., and Mound, D.G., 1984. Clipper-1 geologi-cal completion report. N. Z. Geol. Surv. Open-File Rep., 1036.
Hoernle, K., White, J.D.L., van den Bogaard, P., Hauff, F., Coombs, D.S., Werner, R., Timm, C., Garbe-Schönberg, D., Reay, A., and Cooper, A.F., 2006. Cenozoic intraplate volcanism on New Zealand: upwelling induced by litho-spheric removal. Earth Planet. Sci. Lett., 248(1–2):350–367. doi:10.1016/j.epsl.2006.06.001
Kamp, P.J.J., 1987. Age and origin of the New Zealand oro-cline in relation to alpine fault movement. J. Geol. Soc. (London, U. K.), 144(4):641–652. doi:10.1144/gsjgs.144.4.0641
Karner, G.D., 1986. Effects of lithospheric in-plane stress on sedimentary basin stratigraphy. Tectonics, 5(4):573–588. doi:10.1029/TC005i004p00573
Karner, G.D., Driscoll, N.W., and Weissel, J.K., 1993. Response of the lithosphere to in-plane force variations. Earth Planet. Sci. Lett., 114(4):397–416. doi:10.1016/0012-821X(93)90072-H
Kennett, J.P., and von der Borch, C.C., 1986. Southwest Pacific Cenozoic paleoceanography. In Kennett, J.P., von der Borch, C.C., et al., Init. Repts. DSDP, 90: Washington, DC (U.S. Govt. Printing Office), 1493–1517. doi:10.2973/dsdp.proc.90.148.1986
Proc. IODP | Volume 317
King, P.R., 2000. Tectonic reconstructions of New Zealand: 40 Ma to the present. N. Z. J. Geol. Geophys., 43:611–638.
Kominz, M.A., 1984. Oceanic ridge volumes and sea-level change: an error analysis. In Schlee, J.S. (Ed.), Interre-gional Unconformities and Hydrocarbon Accumulation. AAPG Mem., 36:109–127.
Kominz, M.A., Miller, K.G., and Browning, J.V., 1998. Long-term and short-term global Cenozoic sea-level estimates. Geology, 26(4):311–314. doi:10.1130/0091-7613(1998)026<0311:LTASTG>2.3.CO;2
Kominz, M.A., and Pekar, S.F., 2001. Oligocene eustasy from two-dimensional sequence stratigraphic backstrip-ping. Geol. Soc. Am. Bull., 113(3):291–304. doi:10.1130/0016-7606(2001)113<0291:OEFTDS>2.0.CO;2
Lavier, L.L., Steckler, M.S., and Brigaud, F., 2000. An improved method for reconstructing the stratigraphy and bathymetry of continental margins: application to the Cenozoic tectonic and sedimentary history of Congo margin. AAPG Bull., 78:923–939.
Lavier, L.L., Steckler, M.S., and Brigaud, F., 2001. Climatic and tectonic control on the Cenozoic evolution of the West African margin. Mar. Geol., 178(1–4):63–80. doi:10.1016/S0025-3227(01)00175-X
Lever, H., 2007. Review of unconformities in the late Eocene to early Miocene successions of the South Island, New Zealand: ages, correlation, and causes. N. Z. J. Geol. Geophys., 50(3):245–261. doi:10.1080/00288300709509835
Lewis, D.W., 1992. Anatomy of an unconformity on mid-Oligocene Amuri limestone, Canterbury, New Zealand. N. Z. J. Geol. Geophys., 35(4):463–475.
Loutit, T.S. (Ed.), 1992. JOIDES Sea Level Working Group (SLWG) Report: Woods Hole, MA (Woods Hole Oceano-graphic Institute).
Lu, H., and Fulthorpe, C.S., 2004. Controls on sequence stratigraphy of a middle Miocene–Holocene, current-swept, passive margin: offshore Canterbury Basin, New Zealand. Geol. Soc. Am. Bull., 116(11):1345–1366. doi:10.1130/B2525401.1
Lu, H., Fulthorpe, C.S., and Mann, P., 2003. Three-dimen-sional architecture of shelf-building sediment drifts in the offshore Canterbury Basin, New Zealand. Mar. Geol., 193(1–2):19–47. doi:10.1016/S0025-3227(02)00612-6
Lu, H., Fulthorpe, C.S., Mann, P., and Kominz, M., 2005. Miocene–Recent tectonic and climate controls on sedi-ment supply and sequence stratigraphy: Canterbury Basin, New Zealand. Basin Res., 17(2):311–328.
McGonigal, K., and Di Stefano, A., 2002. Calcareous nan-nofossil biostratigraphy of the Eocene–Oligocene Tran-sition, ODP Sites 1123 and 1124. In Richter, C. (Ed.), Proc. ODP, Sci. Results, 181: College Station, TX (Ocean Drilling Program), 1–22. doi:10.2973/odp.proc.sr.181.207.2002
McHugh, C.M.G., and Olson, H.C., 2002. Pleistocene chro-nology of continental margin sedimentation: new insights into traditional models, New Jersey. Mar. Geol., 186(3–4):389–411. doi:10.1016/S0025-3227(02)00198-6
41

Expedition 317 Scientists Expedition 317 summary
Miall, A.D, and Miall, C.E., 2001. Sequence stratigraphy as a scientific enterprise: the evolution and persistence of conflicting paradigms. Earth Sci. Rev., 54(4):321–348. doi:10.1016/S0012-8252(00)00041-6
Miller, K.G., et al., 1994. Proc. ODP, Init. Repts., 150X: Col-lege Station, TX (Ocean Drilling Program). doi:10.2973/odp.proc.ir.150X.1994
Miller, K.G., Kominz, M.A., Browning, J.V., Wright, J.D., Mountain, G.S., Katz, M.E., Sugarman, P.J., Cramer, B.S., Christie-Blick, N., and Pekar, S.F., 2005. The Phanero-zoic record of global sea-level change. Science, 310(5752):1293–1298. doi:10.1126/science.1116412
Miller, K.G., and Mountain, G.S., 1994. Global sea-level change and the New Jersey margin. In Mountain, G.S., Miller, K.G., Blum, P., et al., Proc. ODP, Init. Repts., 150: College Station, TX (Ocean Drilling Program), 11–20. doi:10.2973/odp.proc.ir.150.102.1994
Miller, K.G., Mountain, G.S., the Leg 150 Shipboard Party, and Members of the New Jersey Coastal Plain Drilling Project, 1996. Drilling and dating New Jersey Oligo-cene–Miocene sequences: ice volume, global sea level, and Exxon records. Science, 271(5252):1092–1095. doi:10.1126/science.271.5252.1092
Miller, K.G., Sugarman, P.J., Browning, J.V., et al., 1998. Proc. ODP, Init. Repts., 174AX: College Station, TX (Ocean Drilling Program). doi:10.2973/odp.proc.ir.174AX.1998
Miller, K.G., Wright, J.D., and Fairbanks, R.G., 1991. Unlocking the ice house: Oligocene–Miocene oxygen isotopes, eustasy, and margin erosion. J. Geophys. Res., 96(B4):6829–6848. doi:10.1029/90JB02015
Milne, A.D., Simpson, C., and Threadgold, P., 1975. Reso-lution-1 well completion report. N. Z. Geol. Surv. Open-File Rep., 648.
Mitchum, R.M., Vail, P.R., and Thompson, S., 1977. Seis-mic stratigraphy and global changes of sea level, part 2: The depositional sequence as a basic unit for strati-graphic analysis. In Payton, C.E. (Ed.), Seismic Stratigra-phy: Applications to Hydrocarbon Exploration. AAPG Mem., 26:53–62.
Molnar, P., Atwater, T., Mammerickx, J., and Smith, S., 1975. Magnetic anomalies, bathymetry and the tectonic evolution of the South Pacific since the Late Cretaceous. Geophys. J. R. Astron. Soc., 40:383–420.
Morono, Y., Terada, T., Masui, N., and Inagaki, F., 2009. Discriminative detection and enumeration of microbial life in marine subsurface sediments. ISME J., 3(5):503–511. doi:10.1038/ismej.2009.1
Morris, M., Stanton, B., and Neil, H., 2001. Subantarctic oceanography around New Zealand: preliminary results from an ongoing survey. N. Z. J. Mar. Freshwater Res., 35:499–519.
Mountain, G.S., Miller, K.G., Blum, P., et al., 1994. Proc. ODP, Init. Repts., 150: College Station, TX (Ocean Drill-ing Program). doi:10.2973/odp.proc.ir.150.1994
Naish, T.R., Wehland, F., Wilson, G.S., Browne, G.H., Cook, R.A., Morgans, H.E.G., Rosenberg, M., King, P.R., Smale, D., Nelson, C.S., Kamp, P.J.J., and Ricketts, B., 2005. An integrated sequence stratigraphic, palaeoenvironmen-tal, and chronostratigraphic analysis of the Tangahoe
Proc. IODP | Volume 317
Formation, southern Taranaki coast, with implications for mid-Pliocene (c. 3.4–3.0 Ma) glacio-eustatic sea level changes. J. R. Soc. N. Z., 35(1–2):151–196. http://www.royalsociety.org.nz/publications/journals/nzjr/2005/006/
Nelson, C.S., and Cooke, P.J., 2001. History of oceanic front development in the New Zealand sector of the Southern Ocean during the Cenozoic—a synthesis. N. Z. J. Geol. Geophys., 44:535–553. http://www.royalsoci-ety.org.nz/publications/journals/nzjg/2001/038/
Norris, R.J., Carter, R.M., and Turnbull, I.M., 1978. Caino-zoic sedimentation in basins adjacent to a major conti-nental transform boundary in southern New Zealand. J. Geol. Soc. (London, U. K.), 135(2):191–205. doi:10.1144/gsjgs.135.2.0191
Osterberg, E.C., 2006. Late Quaternary (marine isotope stages 6–1) seismic sequence stratigraphic evolution of the Otago continental shelf, New Zealand. Mar. Geol., 229(3–4):159–178. doi:10.1016/j.margeo.2006.03.005
Posamentier, H.W., Jervey, M.T., and Vail, P.R., 1988. Eus-tatic controls on clastic deposition, I. Conceptual framework. In Wilgus, C.K., Hastings, B.S., Ross, C.A., Posamentier, H.W., Van Wagoner, J., and Kendall, C.G.St.C. (Eds.), Sea-Level Changes: An Integrated Approach. Spec. Publ.—Soc. Econ. Paleontol. Mineral., 42:109–124.
Posamentier, H.W., and Vail, P.R., 1988. Eustatic controls on clastic deposition, II: Sequence and systems tract models. In Wilgus, C.K., Hastings, B.S., Ross, C.A., Posa-mentier, H.W., Van Wagoner, J., and Kendall, C.G.St.C. (Eds.), Sea-Level Changes: An Integrated Approach. Spec. Publ.—Soc. Econ. Paleontol. Mineral., 42:125–154.
Reyes, A.G., 2007. Abandoned oil and gas wells: a recon-naissance study of an unconventional geothermal resource. GNS Sci. Rep., 2007/23.
Reynolds, D.J., Steckler, M.S., and Coakley, B.J., 1991. The role of the sediment load in sequence stratigraphy: the influence of flexural isostasy and compaction. J. Geo-phys. Res., [Solid Earth], 96(B4):6931–6949. doi:10.1029/90JB01914
Saul, G., Naish, T.R., Abbott, S.T., and Carter, R.M., 1999. Sedimentary cyclicity in the marine Pliocene–Pleisto-cene of the Wanganui Basin (New Zealand): sequence stratigraphic motifs characteristic of the past 2.5 m.y. Geol. Soc. Am. Bull., 111(4):524–537. doi:10.1130/0016-7606(1999)111<0524:SCITMP>2.3.CO;2
Shipboard Scientific Party, 1999a. Leg 181 summary: southwest Pacific paleoceanography. In Carter, R.M., McCave, I.N., Richter, C., Carter, L., et al., Proc. ODP, Init. Repts., 181: College Station, TX (Ocean Drilling Pro-gram), 1–80. doi:10.2973/odp.proc.ir.181.101.2000
Shipboard Scientific Party, 1999b. Site 1119: drift accretion on Canterbury Slope. In Carter, R.M., McCave, I.N., Richter, C., Carter, L., et al., Proc. ODP, Init. Repts., 181: College Station, TX (Ocean Drilling Program), 1–112. doi:10.2973/odp.proc.ir.181.103.2000
Steckler, M.S., Mountain, G.S., Miller, K.G., and Christie-Blick, N., 1999. Reconstruction of Tertiary progradation and clinoform development on the New Jersey passive
42

Expedition 317 Scientists Expedition 317 summary
margin by 2-D backstripping. Mar. Geol., 154(1–4):399–420. doi:10.1016/S0025-3227(98)00126-1
Tippett, J.M., and Kamp, P.J.J., 1993a. Fission track analysis of the late Cenozoic vertical kinematics of continental Pacific crust, South Island, New Zealand. J. Geophys. Res., [Solid Earth Planets], 98(9):16119–16148.
Tippett, J.M., and Kamp, P.J.J., 1993b. The role of faulting in rock uplift in the Southern Alps, New Zealand. N. Z. J. Geol. Geophys., 36(4):497–504.
Vail, P.R., Audemard, F., Bowman, S.A., Eisner, P.N., and Perez-Cruz, G., 1991. The stratigraphic signatures of tec-tonics, eustasy, and sedimentology—an overview. In Einsele, G., Ricken, W., and Seilacher, A. (Eds.), Cycles and Events in Stratigraphy: Berlin (Springer), 617–659.
Van Wagoner, J.C., Posamentier, H.W., Mitchum, R.M., Jr., Vail, P.R., Sarg, J.F., Loutit, T.S., and Hardenbol, J., 1988. An overview of the fundamentals of sequence stratig-raphy and key definitions. In Wilgus, C.K., Hastings, B.S., Ross, C.A., Posamentier, H.W., Van Wagoner, J., and Kendall, C.G.St.C. (Eds.), Sea-Level Changes: An Inte-grated Approach. Spec. Publ.—Soc. Econ. Paleontol. Min-eral., 42:39–45.
Walcott, R.I., 1998. Modes of oblique compression: late Cenozoic tectonics of the South Island of New Zealand. Rev. Geophys., 36(1):1–26. doi:10.1029/97RG03084
Proc. IODP | Volume 317
Ward, D.M., and Lewis, D.W., 1975. Paleoenvironmental implications of storm-scoured ichnofossiliferous mid-Tertiary limestones, Waihao District, South Canterbury, New Zealand. N. Z. J. Geol. Geophys., 18:881–908.
Watkins, J.S., and Mountain, G.S. (Eds.), 1990. Role of ODP Drilling in the Investigation of Global Changes in Sea Level [JOI/USSAC Workshop, El Paso, TX, 24–26 October 1988].
Watters, W.A., 1978. Tertiary volcanism–Miocene. In Sug-gate, P.R., and Stevens, G.R. (Eds.), The Geology of New Zealand: Wellington (New Zealand Govt. Printer), 2:637–644.
Wellman, H.W., 1971. Age of the Alpine Fault, New Zea-land. Proc Int. Geol. Congr, 22nd, 4:148–162.
Wilding, A., and Sweetman, I.A.D., 1971. Endeavour-1 petroleum report. N. Z. Geol. Surv. Open-File Rep., 303.
Wilson, I.R., 1985. Galleon-1 geological completion report. N. Z. Geol. Surv. Open-File Rep., 1146.
Publication: 4 January 2011MS 317-101
43

Expedition 317 Scientists Expedition 317 summary
Figure F1. Map of the Canterbury Basin on the eastern margin of South Island, New Zealand. Inset map showsExpedition 317 site locations, with primary and alternate sites marked in red and yellow, respectively (also seeFig. F3). ODP = Ocean Drilling Program.
120°E 140° 160° 180°70°
60°
50°
40°
30°
20°
10° S
-100
-100
-200
171°E 172° 173°46°
45°
44° S
-500
-1000
Australia
New Z
eala
nd
Antarctica
Canterbury Basin
Bounty Trough
ODPSite 1119
SouthIsland
Proc. IODP | Volume 317 44

Expedition 317 Scientists Expedition 317 summary
Figure F2. Bathymetric map of area drilled during Expedition 317. The Canterbury Basin underlies the present-day onshore Canterbury Plains and offshore continental shelf. It is bounded by the Miocene volcanic centersof the Banks Peninsula (BP) (5.8–12 Ma) (Watters, 1978) to the northeast and the Otago Peninsula (OP) (9.6–16.0 Ma) (Coombs et al., 1986; Hoernle et al., 2006) to the southwest and faces the Bounty Trough to thesoutheast. The Alpine Fault is the boundary between the Australasian and Pacific plates. Locations of themodern Southland Front and Subantarctic Front, together with a local gyre within the Bounty Trough, areshown (Chiswell, 1996; Shipboard Scientific Party, 1999a; Morris et al., 2001). Also shown are four explorationwells in the offshore basin (Resolution [R], Clipper [C], Endeavour [E], and Galleon [G]) as well as OceanDrilling Program (ODP) Site 1119. A fifth well, Cutter, was drilled in 2006; information concerning Cutter,however, is sparse. Bathymetric contours are in meters.
250
1500
3000
2000
500 1000
1500
3000
2000
5 1000
Hikurangi Trough
Cante
rbur
y
Basin
E
BP
250
250
1500
3000
2000
250
1000
3000
20001000
2000
South
250
1000
OP
Southland Front
Alpine Fault
N
Bounty Trough
Island
0 80 160
km
Subantarctic Front
Local gyre
Cante
rbur
y
Plain
s
R
G
CODP Site 1119
Profile Fig. F4A
42°S
44°
46°
48°
50°168°E 170° 172° 174° 176° 178°
Campbell Plateau
Chatham Rise
500
Proc. IODP | Volume 317 45

Expedition 317 Scientists Expedition 317 summary
Figure F3. Drilled and proposed Expedition 317 sites, together with EW00-01 high-resolution (frequencies ashigh as 300 Hz) multichannel seismic (MCS) grid (thick straight lines), low-resolution CB-82 commercial MCSgrid (thin straight lines), exploration wells Clipper and Resolution, and Ocean Drilling Program (ODP) Site1119. The EW00-01 survey was designed to provide improved vertical resolution (~5 m in the upper 1 s) to en-hance our definition of high-frequency sedimentary sequences. Also shown is the distribution of seismicallyresolvable sediment drifts D1–D11 (blue curved lines = drift mound crests). D1–D6 and D10–D11 are simple,elongate drifts, and D7–D9 are complex drifts. D8 has three subdrifts (D8-1, D8-2, and D8-3) and is a multi-crested complex drift. D9 is a multistage drift with superimposed subdrifts D9-1, D9-2, and D9-3. Dashed bluelines = drifts identified on CB-82 profiles, thick black lines = locations of dip profiles shown in Figures F7, F8,and F9 (66, 12, and 60, respectively). Other dip profiles containing alternate sites are also labeled (12, 14, and70). Bathymetric contours are in meters.
-600
-800
-1000
-400
D2
D3
D8
D10
D11
D9-2
D9-3
D8-
1 D8-
2D
8-3
D7
D5
D9-1
D6
D4
D1
0 20
km
-200
-1200
ODPSite1119
606670
12
14
N
Rangitata
Pareora
Waitaki
CB-01B
CB-02B
CB-05B/D/ECB-05C
CB-03ASite U1351 (CB-03B)
CB-06B
Site U1352 (CB-04B)
171°E 172°
172°E
45°S
173°
44°S
45°
ResolutionSouthIsland
Site U1353 (CB-01A)
Site U1354 (CB-02A)CB-01C
CB-04A
ClipperCB-04C
CB-05F
New Zealand
Canterburybasin
South
islan
dProposed sites
Drilled sites
Proc. IODP | Volume 317 46

Expedition 317 Scientists Expedition 317 summary
Figure F4. Schematic stratigraphy of the Canterbury Basin, drilled during Expedition 317, at three differentscales. Modified from Fulthorpe et al. (1996). A. Large-scale postrift stratigraphy (see profile location in Fig. F2).Onekakara, Kekenodon, and Otakou groups were deposited during regional transgressive, highstand, and re-gressive phases, respectively. B. Seismic-scale stratigraphy. Sediment drifts occur within the Otakou Group.Limestones are shown as distal facies of the uppermost transgressive Onekakara Group and lowermost re-gressive Otakou Group. C. Outcrop-scale stratigraphy across the Marshall Paraconformity.
Otakou Group
Kekenodon Group
Marshall Paraconformity
Onekakara GroupAmuri
Burnside
ConcordWeka Pass
Bluecliffs
Equivalent onshoreformations
10 km
2 km
Southern Alps
NW
Canterbury Plains Canterbury Bight
SE
Otakou
Kekenodon
OnekakaraMatakea
Otakou
Onekakara
Drifts
Coa
st
Alp
ine
Faul
t zon
e
A
B
C
Proc. IODP | Volume 317 47

Expedition 317 Scientists Expedition 317 summary
Figure F5. Total and tectonic subsidence curves for the Clipper exploration well (Fig. F2), with and withoutpaleowater depth estimates, used during Expedition 317. Curve with paleowater depths shows that most tec-tonic subsidence occurred during the early Late Cretaceous, with mild uplift during the latest Cretaceous. Littletectonic subsidence has occurred during the last 30 m.y. The increase in the rate of tectonic subsidence be-ginning at ~8 Ma may be a response to increasing convergence at the Alpine Fault. Curves provided byR. Funnell, R. Wood, and G. Browne, GNS Science.
Age (Ma)
Dep
th (
km)
90
4
3
2
1
0
Tectonic subsidence
Tectonic subsidence withpaleowater depths
Total subsidence
Total subsidence withpaleowater depths
80 70 60 50 40 30 20 10 0
Proc. IODP | Volume 317 48

Expedition 317 Scientists Expedition 317 summary
Figure F6. Revised subsidence analysis for the Clipper exploration well with eustatic estimates used during Ex-pedition 317. A. Water depth (WD; blue), tectonic subsidence (red), and theoretical thermal curves (minimumand maximum) for the Clipper well (Figs. F2, F3). As Figure F5 also shows, most tectonic subsidence occurredduring the early Late Cretaceous, with mild uplift during the latest Cretaceous. This analysis also shows the lowrates of tectonic subsidence between 30 and ~8 Ma and the increase in total subsidence beginning at ~8 Ma,which may be associated with increasing convergence at the Alpine Fault. B. R2, an estimate of eustasy, haslarge uncertainties because of the poorly constrained paleowater depths of much of the sediment preserved inthe Clipper well (M. Kominz, unpubl. data). NJ = New Jersey.
0 0 000
A
B
WD ranges
Thermalsubsidenceplate model
R2 Clippermaximum WD
R2 Clippermaximum WD
R2 NJrange
R2 Clippermaximum WD
Haq et al. (1987)
Kominz(1984)range
Kominz(1984)range
Kominz (1984)“best estimate”
90 80 70 60 50 40 30 20 10 0
500
250
200
150
100
50
0
-50
-100
1000
1500
2000
Dep
th (
m)
Age (Ma)
Sea
leve
l (m
)
R2 NJbest
estimates R2 Clipper maximum WD
Cretaceous Paleocene Eocene Oligocene Miocene
100
Late late lateearly lateearlyearly middle lateearly middle
Proc. IODP | Volume 317 49

Expedition 317 Scientists Expedition 317 summary
Figure F7. A. Uninterpreted multichannel seismic (MCS) dip Profile EW00-01-66 (southern part of survey grid)showing the locations of Sites U1351, U1353, and U1354. Proposed alternate Sites CB-01B, CB-02B, and CB-03A are also shown (see Fig. F3 for location). Red = actual penetration, yellow = proposed penetration. B. In-terpretation showing seismic sequence boundaries and selected locations of onlap, truncation, and downlap(arrows). Circles = clinoform rollovers, or breaks, representing paleoshelf edges. Paleoshelf edges from seismicsequence boundaries U4 to U8 prograde steadily. Progradation decreases from U8 to U12, increasing again fromU13 to U19. U4–U8 are onlapped and truncate underlying reflections; internal reflection geometries from U4to U9 are mainly sigmoid. In contrast, U10–U19 are downlapped on paleoshelves but also truncate underlyingreflections, and internal reflection geometries from U9 to the seafloor are oblique. Site U1351 sampled the pa-leoslopes of U6–U7 and sampled U8–U19 landward of their paleoshelf edges. Sites U1353 and U1354 sampledU5–U18 landward of their paleoshelf edges in a more proximal setting. Sediment drift development in this arealargely ceased by U4. Only drift D5, capped by a postdrift slope platform at U4, was present. Prograding clino-forms dominate later sequences, and the slope steepens to 3°–5°. Drifts migrate northwestward (landward) ondip profiles. Erosional unconformities at the landward edges of drift moats are diachronous and intersected bymultiple sequence boundaries. (Figure shown on next page.)
Proc. IODP | Volume 317 50

Exped
ition
317 Scientists
Exped
ition
317 summ
ary
Proc. IOD
P | Volume 317
51
0 5 10Truncation
km
19a1715 SE
es between9
Sequences betweenseafloor and U9
Shelf edge
rm
Figure F7 (continued). (Caption shown on previous page.)
0
2.0
1.5
1.0
0.5
2.0
1.5
1.0
0.5
17
4
6
8
11
1
13
45
67
118
9
17
1MP
66-10-00WE
Two-
way
trave
ltim
e(s
)
NW
3
2
2
6-16-2
5-1
7-1
Truncation
1 3 7a 1395
2
3
Tie line
Site U1353 CB-01B Site U1354 CB-02B Site U1351 CB-03A
CB-03ASite U1351CB-02BSite U1354CB-01BSite U1353
Current erosionalunconformity
Sequence boundary:regional unconformity
Sequences betweenU1 and U4
SequencU4 and U
Two-
way
trave
ltim
e(s
)
A
B
Postdrift platfo
Onlap
D5

Expedition 317 Scientists Expedition 317 summary
Figure F8. A. Uninterpreted dip Profile EW00-01-12 across the slope (northern part of survey grid; see Fig. F3for location). B. Interpretation showing seismic sequence boundaries and selected locations of reflection trun-cation (arrows). Undrilled contingency Site CB-05C was selected to sample drift D11, the last of the large,elongate drifts of the Canterbury Basin. The underlying Marshall Paraconformity (MP) is also shown (see Fig.F4).
0
2.0
1.5
1.0
0.5
NW SE17 19b 23
Tie line
2.0
1.5
1.0
0.5
31
EW00-01-12
19
4
8
11
18
6
9
161513
7
D10
Postdrift platform
0
km
MP
0°
2°
4°
CB-05C
CB-05C
“Green”
Two-
way
trave
ltim
e(s
)
5
D11
A
B
Two-
way
trave
ltim
e(s
)
Proc. IODP | Volume 317 52
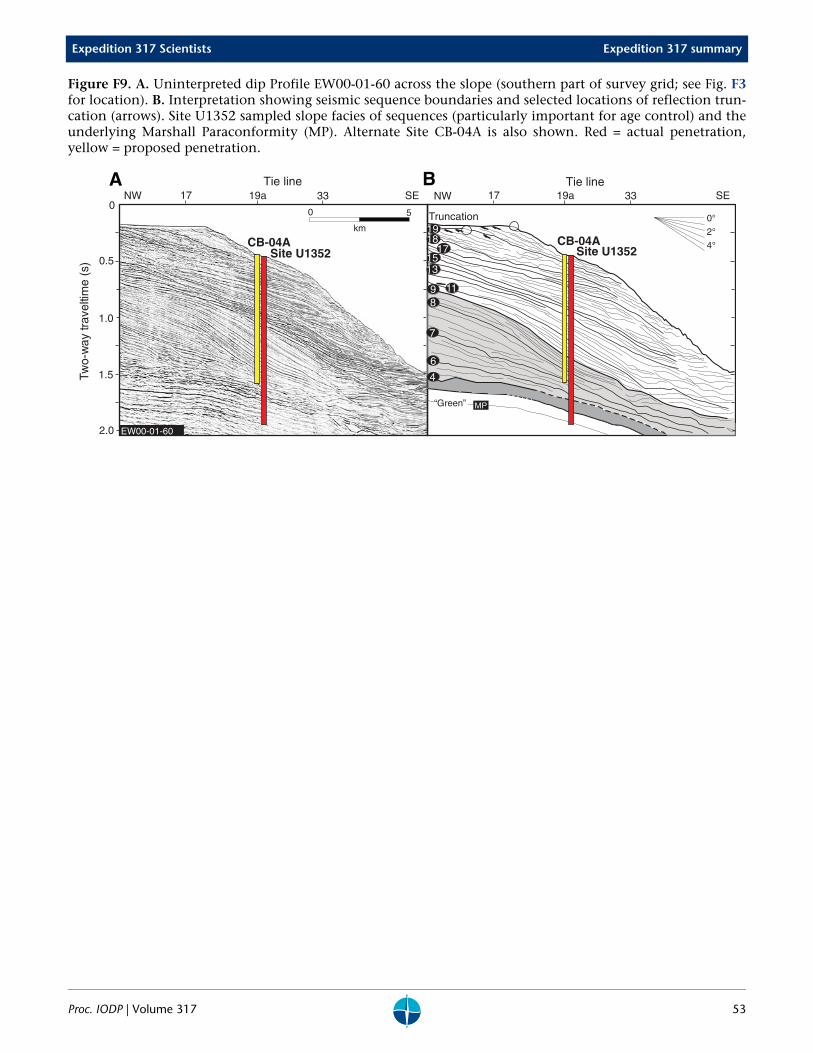
Expedition 317 Scientists Expedition 317 summary
Figure F9. A. Uninterpreted dip Profile EW00-01-60 across the slope (southern part of survey grid; see Fig. F3for location). B. Interpretation showing seismic sequence boundaries and selected locations of reflection trun-cation (arrows). Site U1352 sampled slope facies of sequences (particularly important for age control) and theunderlying Marshall Paraconformity (MP). Alternate Site CB-04A is also shown. Red = actual penetration,yellow = proposed penetration.
EW00-01-66
0
2.0
1.5
1.0
0.5
SE17 19a 33Tie line
EW00-01-60
Truncation19
811
18
6
9
171513
7
17 19a 33
0°
2°
4°
4
0
km
CB-04ASite U1352 Site U1352
CB-04A
“Green”
Two-
way
trave
ltim
e(s
)
NW
5
A B Tie lineSENW
MP
Proc. IODP | Volume 317 53

Expedition 317 Scientists Expedition 317 summary
Figure F10. Comparison of multichannel seismic (MCS) profiles across a large sediment drift in the offshoreCanterbury Basin used during Expedition 317. A. Colocated CB-82-22 commercial MCS profile. B. High-reso-lution EW00-01-12 MCS profile, showing the improved imaging of the high-resolution profile. The commercialprofile has a vertical resolution of ~20 m, whereas that of the high-resolution profile is ~5 m in the uppersecond.
0.5
1.0
1.5
2.0
SENW SENW
Two-
way
trave
ltim
e(s
)
CB-82-22 (migrated) EW00-01-120 1 2
km
0 1 2
km
A B
Proc. IODP | Volume 317 54

Expedition 317 Scientists Expedition 317 summary
Figure F11. Predrilling age estimates of seismic sequence boundaries targeted during Expedition 317 and ten-tative correlation with oxygen isotopic record, sedimentation rates, and Alpine Fault convergence rates. Al-though predrilling age estimates are sometimes too old, they are close to drilling results, and tentative correla-tions remain valid. Two isotopic records are shown, both from Billups and Schrag (2002): (1) unmodifiedbenthic foraminiferal δ18O record from ODP Site 747; (2) the same record corrected using Mg/Ca thermometryto remove the temperature effect and yield the δ18O of seawater (δ18Osw), predominantly a response to icevolume and therefore an enhanced proxy for global sea level. The δ18Osw record correlates better both with in-dividual seismic sequences and longer term progradational and aggradational trends, as well as with the Haqet al. (1987) eustatic curve (also shown, recalibrated to the timescale of Berggren et al., 1995). This suggests eu-static control of sequence timing. Cooling Events Mi2, Mi3a, Mi3b, Mi4, and Mi5, derived from the oxygenisotope records from DSDP Site 608 and ODP Sites 703 and 704 (Miller et al., 1996) are shown. Average sedi-mentation rates are calculated from estimated sequence volumes (Lu et al., 2005). The perpendicular com-ponent of motion at the Alpine Fault plate boundary was calculated using the method of Cande and Stock(2004). Finite rotations for Australia–Pacific motion were determined for four chrons (2A, 2.58 Ma; 3A, 6.04Ma; 5, 11.53 Ma; 6, 20.13 Ma; ages are those of Cande and Kent [1995]). The increases in both sedimentationand convergence rates over the last 5–8 m.y. correlate well. The early phase of high sedimentation rates (se-quences S2–S4) reflects global processes. See text for further discussion. A summary of South Island tectonicand volcanic events is also shown. (Figure shown on next page.)
Proc. IODP | Volume 317 55

Exped
ition
317 Scientists
Exped
ition
317 summ
ary
Proc. IOD
P | Volume 317
56
610
endicular componentlpine Fault (mm/y) tectonic events
11.5
3-6
.04
Ma
6.0
6-2
.58
Ma
2.58
-0M
a
2
20.1
3-1 1
.53
Ma
South Island
Volcanism
Ota
go
Ban
ks
Dex
tral
str
ike
-slip
mot
ion
alon
g A
lpin
e F
ault
sinc
e 23
Ma
(Kam
p, 1
987)
6.2
Ma
(Lew
iset
al.,
1986
)In
itiat
ion
of u
plift
of S
outh
ern
Alp
s
5.8
-12
Ma
(Wat
ters
,197
8)
9.6-
12.9
Ma
(Coo
mbs
et a
l., 1
986)
8-5
Ma
(Tip
pett
and
Kam
p,19
93a)
Figure F11 (continued). (Caption shown on previous page.)
23 -50 500 15001 -1
Corrected seawater
TB3.9
TB3.8
TB3.6
TB3.4
TB3.3
TB3.2
TB3.1
TB2.6
TB2.514
16
15
8
9
10
11
12
13
3
4
5
6
7
mid
dle
late
Epoch
Ag
e (
Ma
)
12
9
8
6
5
7
3
2
1
4
1
214
18
16
1011
Hia
tus
4 100Sei
smic
sequ
ence
S1
S2
S3
S4
S5
S7
S6
S8
S11
S13
S15
S17
Global sea level (m)(Haq et al., 1987)
TB3.10
Sei
smic
sequ
ence
boun
dary
TB3.5
Hia
tus
19
Benthic foraminiferal
Mi5
Mi3a
Mi3b
Mi4
Mi6
Mio
cene
Plio
cene
Ple
ist.
Perpat A
4547
Sedimentationrate (m/m.y.)
S2-4
S5-7
S8-11
S12-19
32
TB2.4
δ18O (‰) δ18O (‰)
middle-late
mid
dle
late
ea
rly
ea
rly
Holocene

Expedition 317 Scientists Expedition 317 summary
Figure F12. Correlation of seismic sequence boundaries U1–U14 (predrilling age estimates) targeted during Ex-pedition 317 with periods of sediment drift activity and the oxygen isotopic record from Deep Sea DrillingProject (DSDP) Site 588 in the southwest Pacific (Kennett and von der Borch, 1986). The relative size of theellipse representing each drift is an approximate measure of drift volume. Drifts D1–D4 are of short duration(~3 m.y.), whereas D10–D11 are larger and longer lived (~7 m.y.). Dark and light shading represent cool andwarm periods, respectively, as defined by Kennett and von der Borch (1986).
16 15 14 13 12 11 10 9 8 7 6 5 4 3 2
U7 U8 U9 U11 U12 U14
D7
D8
D5
D6
D4
D3
D2
lateearly
PlioceneMiocene
middle
Epo
ch late
Age (Ma)
D9
D10
D1
U2U1 U3 U4 U5 U6
Pleist.
D11
WarmingCooling
U13
1.0
2.0
3.0
4.0
Ben
thic
fora
min
ifera
l δ1
8O
(‰
)
DSDP Site 588oxygen isotopecurve
middle
Proc. IODP | Volume 317 57

Exped
ition
317 Scientists
Exped
ition
317 summ
ary
Proc. IOD
P | Volume 317
58
-oriented seismic Profile EW00-01-cations (see also Fig. F7). B. Corre-1-66. The location of the Unit I/IIII boundary (teal) at Site U1353 isll Paraconformity.
50 10
km
19a17 SE
quences betweenafloor and U9
Shelf edge
Figure F13. Correlation of lithologic units defined at shelf Sites U1353, U1354, and U1351 to interpreted dip66. Red = actual penetration, yellow = proposed penetration. A. Uninterpreted seismic profile showing site lolation of lithologic Units I and II at shelf Sites U1353, U1354, and U1351, overlain on seismic Line EW00-0boundary (teal) at Site U1351 is uncertain (see “Lithostratigraphy” in the “Site U1351” chapter). The Unit I/placed at 151 m; other options are possible (see “Lithostratigraphy” in the Site U1353 chapter). MP = Marsha
0
2.0
1.5
1.0
0.5
2.0
1.5
1.0
0.5
17
4
6
8
11
1
13
45
67
118
9
17
1MP
661-0-00WE
T noitacnur
5D
Two-
way
trave
ltim
e(s
)
NW
3
2
2
6-16-2
5-1
7-1
1 3 7a 151395
2
3
Tie line
Site U1353 Site U1354 Site U1351
Two-
way
trave
ltim
e(s
)
A
B Site U1353 Site U1351Site U1354
Current erosionalunconformity
Sequence boundary:regional unconformity
Sequences betweenU1 and U4
Sequences betweenU4 and U9
Sese
mroftalptfirdtsoP
palnO
noitacnurT
I
II
IA
IIIB
I
II

Expedition 317 Scientists Expedition 317 summary
Figure F14. Correlation of lithologic units defined at Site U1352 to dip-oriented seismic Profile EW00-01-60.A. Uninterpreted profile showing site location. B. Interpretation based on predicted depths of seismic reflectorsand assumptions about the type of bedding that causes these reflections. MP = Marshall Paraconformity.
EW00-01-66
0
2.0
1.5
1.0
0.5
SE17 19a 33Tie line
EW00-01-60
Truncation
811
18
6
9
171513
7
17 19a 33
4
SiteU1352
SiteU1352
0
km
5
Tie lineSE
Two-
way
trav
eltim
e (s
)
19
IA
IC
IIA
IIB
IICIII
NW NW
MP
A B
IB
Proc. IODP | Volume 317 59

Exped
ition
317 Scientists
Exped
ition
317 summ
ary
Proc. IOD
P | Volume 317
60
5 are shown schematically, inter-formity.
Ple
isto
cene
-Hol
ocen
eP
lioce
neM
ioce
ne
e
e
ne
eneM
iocene
IIA
IA
III
IB
IC
IIB
IIC
U17
U16
U15
U14
U13
MP
Site U1352(projected)
344 m
Figure F15. Summary of lithology and unit boundaries, Expedition 317. Seismic sequence boundaries U19–Usecting each site at their predicted depths. Ages were determined from biostratigraphy. MP = Marshall Paracon
Eocen
Oligocen
Pleistoce
Plioc
Clay(stone)
Siliciclastics:
Mud(stone)
Sandy mud(stone)
Silt(stone)
Very fine-fine sand(stone)
Gravel(conglomerate)
Muddy gravel (conglomerate)
Medium-very coarse sand(stone)
Sandy gravel (conglomerate)
Interbedded clay(stone) and mud(stone)Muddy sand(stone)
Interbedded silt(stone) and mud(stone)
Interbedded sand(stone) and mud(stone)
Calcareous:
Marl(stone)
Muddy chalk/Limestone
Chalk/Limestone
Grainstone
Shell hash
II
I
II
IA
II
I
IB
Seafloor
U19
U18
U18U16U14
U12
U11
U9
U8
U7
U6
U8
U6
U10
U5
?
Dep
th (
m)
Site U1353 Site U1354 Site U13510
200
400
600
800
1000
1200
1400
1600
1800
2000
2200
85 m122 m113 m

Exped
ition
317 Scientists
Exped
ition
317 summ
ary
Proc. IOD
P | Volume 317
61
tes from coulometry analyses (redn schematically, intersecting each
Ple
isto
cene
-Hol
ocen
eP
lioce
neM
ioce
ne
ene
IIA
IA
III
IB
IC
IIB
IIC
U17
U16
U15
U14
U13
MP
Site U1352(projected)
344 m
Figure F16. Carbonate component percent estimates from smear slide data (blue circles), plotted with estimadiamonds) and thin sections (purple crosses), Expedition 317. Seismic sequence boundaries U19–U5 are showsite at their predicted depths. Ages were determined from biostratigraphy. MP = Marshall Paraconformity.
Eocene
Oligocene
Pleistocene
PlioceneM
ioc
Hole A
Hole B
Coulometry analyses
Unit boundaries
Seismic sequence boundaries
Thin sectionsHole C
II
I
II
IA
II
I
IB
Seafloor
U19
U18
U18U16U14
U12
U11
U9
U8
U7
U6
U8
U6
U10
U5
?
Dep
th (
m)
Site U1353 Site U1354 Site U13510
200
400
600
800
1000
1200
1400
1600
1800
2000
2200
85 m122 m113 m
0 50 100%
0 50 100%
0 50 100%

Exped
ition
317 Scientists
Exped
ition
317 summ
ary
Proc. IOD
P | Volume 317
62
ologic Unit II at shelf Sites U1353,
Ple
isto
cene
-Hol
ocen
eP
lioce
neM
ioce
ne
e
IIA
IA
III
IB
IC
IIB
IIC
17
16
15
14
13
MP
Site U1352(projected)
344 m
Hol
e U
1352
B74
%
Hol
e U
1352
A10
4%
Hol
e U
1352
C51
%
Hol
e U
1352
D10
3%
Figure F17. Summary of core recovery across the Expedition 317 transect. Recovery was particularly low in lithU1354, and U1351. MP = Marshall Paraconformity.
Eocene
Oligocene
Pleistocene
PlioceneM
iocenII
I
II
ISeafloor
U19
U18
U
U
U
U
U
U18U16U14
U12
U11
U9
U8
U7
U6
U8
U6
U10
U5
?
Dep
th (
m)
Site U1353 Site U1354 Site U13510
200
400
600
800
1000
1200
1400
1600
1800
2000
2200
85 m122 m113 m
Recovered interval
Nonrecovered interval
Hol
e U
1353
A10
0%
Hol
e U
1353
B34
%
Hol
e U
1354
B10
0%
Hol
e U
1354
A99
%
Hol
e U
1354
C42
%
Hol
e U
1351
A98
%
Hol
e U
1351
B30
%
II
IA
IB

Expedition 317 Scientists Expedition 317 summary
Figure F18. Calcium carbonate content in Hole U1352B and in Ocean Drilling Program (ODP) Hole 1119C.Major lithologic units at both sites correlate with carbonate content and similar depth trends in carbonatecontent. A distinctly low carbonate (clay-rich) interval at ~430 mbsf at Site 1119 corresponds to a similar low-carbonate interval at ~620 mbsf at Site U1352.
0
100
200
300
400
500
0 20 40 60 800 20 40 60 80
Dep
th (
m)
0
100
200
300
400
500
600
700
800
Dep
th C
SF
-A (
m)
ODP Hole 1119C
Subunit IA
Subunit IB
Subunit IC
Unit II
Unit I
Subunit IIA
Subunit IIB
Subunit IIC
Unit III
CaCO3 (%)Hole U1352BCaCO3 (%)
Proc. IODP | Volume 317 63

Expedition 317 Scientists Expedition 317 summary
Figure F19. The Expedition 317 drilling transect across the shelf and upper slope of the Canterbury Basinpermits correlation of lithology to seismic sequence boundaries. Lithologic contacts and their overlying asso-ciated facies were documented, and preliminary correlations were made to the predicted depths of seismic se-quence boundaries. At Sites U1352 and U1354, at which recovery was high, there is good correlation betweenthe sedimentary and seismic records, particularly above U10. The figure illustrates the depths of lithologic con-tacts at each site (e.g., inner shelf, U1351-S1 [99 m]). U19–U5 are shown schematically, intersecting each siteat their predicted depths. Future shore-based studies will expand on these initial results. For further detailsabout lithologic surfaces, see Tables T4 in the “Site U1351” chapter, T4 in the “Site U1352” chapter, T2 in the“Site U1353” chapter, and T3 in the “Site U1354” chapter. Black lines = seismic sequence boundaries, red lines= lithologic boundaries. Contacts shown in blue are uncertain because of poor recovery. MP = Marshall Para-conformity. (Figure shown on next page.)
Proc. IODP | Volume 317 64

Exped
ition
317 Scientists
Exped
ition
317 summ
ary
Proc. IOD
P | Volume 317
65
MP
Site U1354(projected)
344 m
12
U19
U18
11
U15
U17
U14
U13
S1
S2
S3
S4
S5
S9
S11
S10
S12
S13
S5.1S6
Figure F19 (continued). (Caption shown on previous page.)
?
0
200
400
600
800
1000
1200
1400
1600
1800
2000
2200
Seafloor
S1
S9S10
S2S3
S8
S1S1
U10
U5
Dep
th (
m)
Site U135385 m
Site U1354113 m
Site U1351122 m
S7S6
S8
S6S7
S2
S8
S7S7.1
S5S4
S3S2
S4S3
UU9
U8
U7
U6
U
U6
U7
U8
U10U12
U18
U14U16
S6S5.1

Expedition 317 Scientists Expedition 317 summary
Figure F20. Enlargement of the shelf portion of the Expedition 317 drilling transect showing lithologic con-tacts and correlative seismic sequence boundaries. Note that contacts shown in blue at Site U1353 are particu-larly tentative because of poor recovery in that interval.
Dep
th (
m)
?
Site U1353
S2
S9
S10
S7S6
S3
S6
S8
S7
200
400
0
600
S3
S2S1
1000
1200
800
S5
S1S2
S3S4
S7
S7.1
S8
U8
U12
U16
U18
U6
U5
S6S5.1
85 m
Site U1354
113 m
Site U1351
122 m
S8
U10
U14
S1Seafloor
Proc. IODP | Volume 317 66
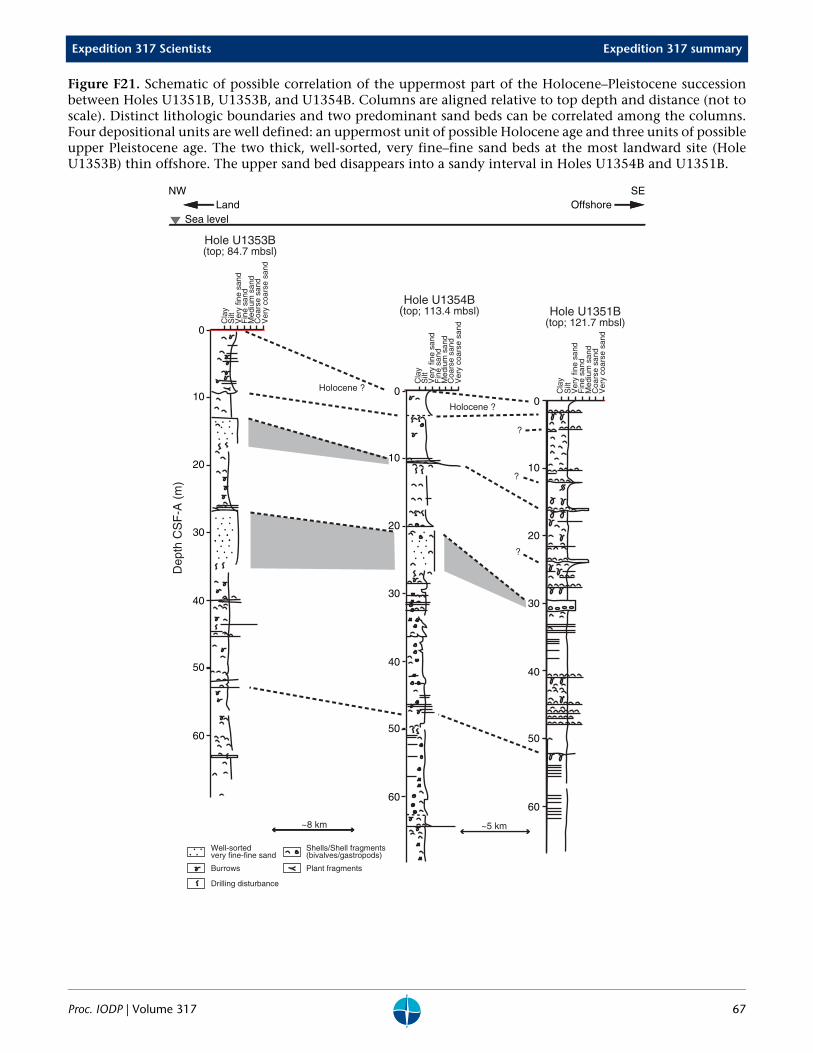
Expedition 317 Scientists Expedition 317 summary
Figure F21. Schematic of possible correlation of the uppermost part of the Holocene–Pleistocene successionbetween Holes U1351B, U1353B, and U1354B. Columns are aligned relative to top depth and distance (not toscale). Distinct lithologic boundaries and two predominant sand beds can be correlated among the columns.Four depositional units are well defined: an uppermost unit of possible Holocene age and three units of possibleupper Pleistocene age. The two thick, well-sorted, very fine–fine sand beds at the most landward site (HoleU1353B) thin offshore. The upper sand bed disappears into a sandy interval in Holes U1354B and U1351B.
Cla
yS
iltV
ery
fine
sand
Fin
e sa
ndM
ediu
m s
and
Coa
rse
sand
Ver
y co
arse
san
d
Cla
yS
iltV
ery
fine
sand
Fin
e sa
ndM
ediu
m s
and
Coa
rse
sand
Ver
y co
arse
san
d
Cla
yS
iltV
ery
fine
sand
Fin
e sa
ndM
ediu
m s
and
Coa
rse
sand
Ver
y co
arse
san
d
?
?
?
Land OffshoreSea level
Dep
th C
SF
-A (
m)
Holocene ?
Holocene ?
Well-sortedvery fine-fine sand
Burrows
Shells/Shell fragments(bivalves/gastropods)
Plant fragments
Drilling disturbance
Hole U1353B(top; 84.7 mbsl)
~8 km ~5 km
Hole U1354B(top; 113.4 mbsl) Hole U1351B
(top; 121.7 mbsl)0
10
20
30
40
50
60
0
10
20
30
40
50
60
0
10
20
30
40
50
60
NW SE
Proc. IODP | Volume 317 67

Expedition 317 Scientists Expedition 317 summary
Figure F22. Chronostratigraphic framework and biostratigraphic ages of predicted seismic sequence boundaryunits across the Expedition 317 drilling transect. Pleistocene ages are derived from calcareous nannofossils.Pliocene–Eocene ages are derived from calcareous nannofossils and planktonic foraminifers (early Pliocene–lateMiocene ages are primarily from planktonic foraminifers). Major hiatuses indicated by microfossil biostratig-raphy are displayed in the epoch (left-hand) column for each site. Right-hand columns provide ages (in Ma) atthe predicted depths of seismic sequence boundaries. U19–U5 are shown schematically, intersecting each siteat their predicted depths. The Marshall Paraconformity (MP) is noted for Site U1352 as the unconformableboundary between the early Miocene and early Oligocene. (Figure shown on next page.)
Proc. IODP | Volume 317 68
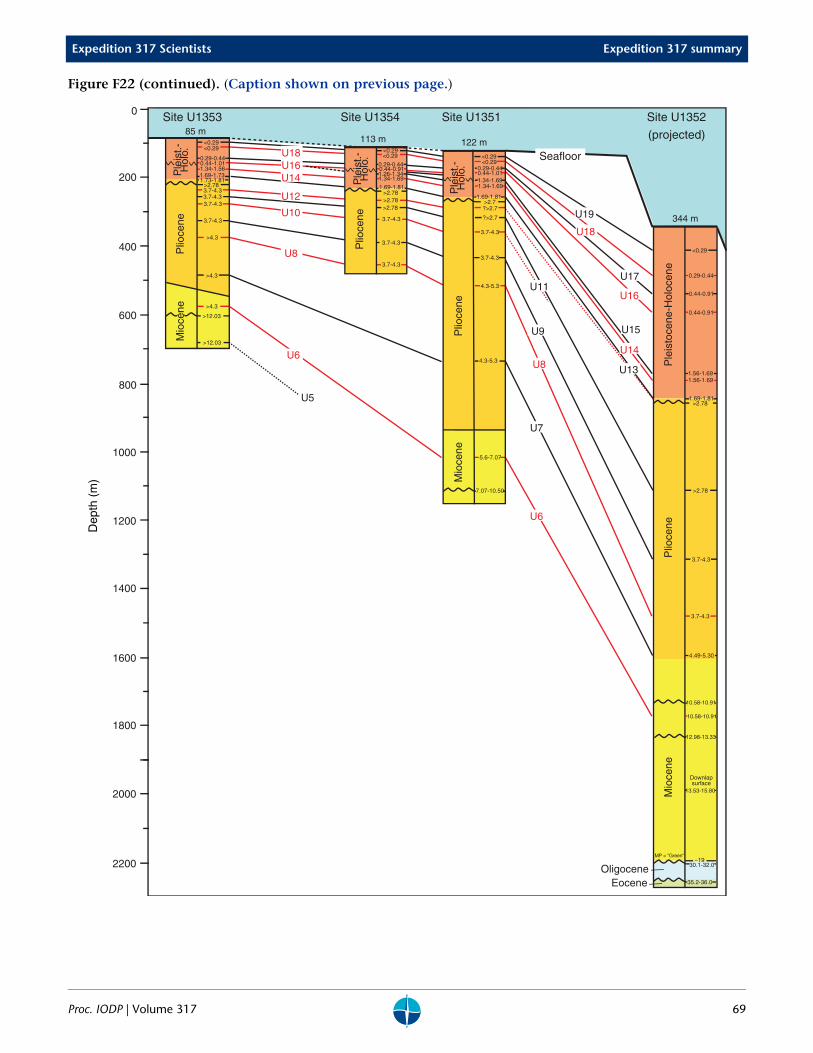
Expedition 317 Scientists Expedition 317 summary
Figure F22 (continued). (Caption shown on previous page.)
Seafloor
Site U1354 Site U1352
(projected)
U19
U18
U17
U16
U15
U14
U13
U18U16U14
U12
U11
U9
U8
U7
U6
U8
U10
U5
Site U1353
3.7-4.3
3.7-4.3
0.44-0.91
0.29-0.44
0.44-0.91
1.56-1.69
1.69-1.81
3.7-4.3
4.49-5.30
>2.78
0.29-0.44
3.7-4.3
0.29-0.44
1.69-1.73
>4.3
>4.3
>4.3
1.34-1.69
<0.29
1.56-1.69
~19
1.34-1.56
3.7-4.3
<0.29
1.34-1.69
3.7-4.3
5.6-7.07
?>2.7
?>2.7
3.7-4.3
3.7-4.3
0.44-1.01
<0.29
Plio
cene
0.44-1.01
<0.29
>2.7
<0.29
Plio
cene
Mio
cene
Ple
isto
cene
-Hol
ocen
eP
lioce
neM
ioce
ne
<0.29<0.29
0.29-0.44
1.26-1.341.34-1.69
0.44-0.91
3.7-4.3
3.7-4.3
4.3-5.3
3.7-4.3
4.3-5.3P
lioce
ne
>12.03
OligoceneEocene
0
200
400
600
800
1000
1200
1400
1600
1800
2000
2200
1.73-1.81
7.07-10.50
>2.78
>2.78>2.78
Mio
cene
>12.03
1.69-1.81
1.69-1.81
10.58-10.91
12.98-13.33
10.58-10.91
30.1-32.0
35.2-36.0
MP = "Green"
85 m122 m
344 m
113 m
>2.78>2.78
13.53-15.80
Downlapsurface
U6
Site U1351
Dep
th (
m)
Ple
ist.-
Hol
o.
Ple
ist.-
Hol
o.
Ple
ist.-
Hol
o.
Proc. IODP | Volume 317 69
Expedition 317 Scientists Expedition 317 summary
Figure F23. Magnetic susceptibility (left-hand column) was measured on whole-round samples at 2.5 cm in-tervals (instrument units [IU]) using a Bartington Instruments MS Loop sensor. NGR (right-hand column) wasmeasured on whole-round samples at 10 cm intervals (counts per second [cps]) using the Natural Gamma Ra-diation Logger (NGRL) designed and built at Texas A&M University by IODP-USIO. To help illustrate key trends,the signal was cleaned using a Gaussian low-pass filter (30 passes). The data correlate well between the twomethods and between sites: both data sets show similar cyclic patterns in the uppermost ~250 m at all sites.Some unconformities are well represented by abrupt changes. The Marshall Paraconformity (MP) is charac-terized at Site U1352 by a switch to negative magnetic susceptibility and a decrease in NGR to nearly zero.(Figure shown on next page.)
Proc. IODP | Volume 317 70

Expedition 317 Scientists Expedition 317 summary
Figure F23 (continued). (Caption shown on previous page.)
0
200
400
600
800
1000
1200
1400
1600
1800
2000
2200
Dep
th (
m)
Seafloor
Site U1353 Site U1354 Site U1351 Site U1352(projected)
U19
U18
U17
U16
U15
U14
U13
U18U16U14
U12
U11
U9
U8
U7
U6
U8
U6
U10
85 m122 m
344 m
U5
MP
?
Magnetic susceptibility Natural gamma radiation (loop sensor)
Hole U1351B Hole U1351B
Hole U1352B Hole U1352B
Hole U1352C Hole U1352C
Hole U1353B Hole U1353B
Hole U1354B Hole U1354B
Hole U1354C Hole U1354C
IU cps
IU cps
IU cps
IU cps
0 50 8040
0 50 8040
0 40 5020
0 50 50
113 m
Proc. IODP | Volume 317 71

Exped
ition
317 Scientists
Exped
ition
317 summ
ary
Proc. IOD
P | Volume 317
72
51. The 0–150 m intervals at eachles. Nannofossil ages are shown to
SiteU1351
Color of mudGray Green
MS (IU)0 10 20 30 40
MIS
2 to 1
6 to 5
8 to 7
10 to 9
12 to 11
M S
0
80
90
100
110
120
130
140
150
160
170
180
190
200
210
220
230
240
250
260
270
280
Figure F24. Lithologic columns, color, and magnetic susceptibility (MS) at shelf Sites U1353, U1354, and U13site are compared. Red lines = marine isotope stage (MIS) boundaries tentatively correlated with lithologic cycthe left of each column. IU = instrument units.
Present sea level
Dep
th (
m)
10
20
30
40
50
60
70
80
90
100
110
120
130
140
150
10
20
30
40
50
60
70
80
90
100
110
120
130
140
150
SiteU1353
DepthCSF-A
(m)Color of mudGray Green
MS (IU)0 10 20 30 40
10
20
30
40
50
60
70
80
90
100
110
120
130
140
150
SiteU1354
Color of mudGray Green
MS (IU)0 10 20 30 40
M S
M S
0
80
90
100
110
120
130
140
150
160
170
180
190
200
210
220
230
240
250
260
270
280
0.29
0.44
1.26
1.69
1.81
0.29
0.34
0.44
1.26
1.34
1.69
1.73
1.81
1.73
0.29
0.34
0.44
0.60
1.26
1.34
1.69
1.81
1.73
M: MudS: Sand
Lithologic boundary
Predicted stage boundary
Age(Ma)
Age(Ma)
Age(Ma)
DepthCSF-A
(m)DepthCSF-A
(m)

Expedition 317 Scientists Expedition 317 summary
Figure F25. Summary of natural gamma ray and electrical resistivity data from wireline logging of Sites U1353,U1354, U1351, and U1352. Seismic sequence boundaries U10–U12, in particular, are distinct features in thelogging data characterized by low gamma radiation and high resistivity and can be well correlated across thethree shelf sites. GR = gamma ray, IDPH = phasor deep induction log.
0
200
400
600
800
1000
1200
Dep
th (
m)
Seafloor
Site U1353 Site U1354 Site U1351 Site U1352(projected)
U19
U18
U17
U16
U15
U14
U13
U18U16U14
U12
U11
U9
U8
U7
U6
U8
U6
U10
85 m122 m
344 m
U5
?
GRGR
GR
GRIDPH
IDPH
IDPHIDPH
113 m
Proc. IODP | Volume 317 73

Exped
ition
317 Scientists
Exped
ition
317 summ
ary
Proc. IOD
P | Volume 317
74
ovides a measure of oceanicity and
U19
U18
U16
U14U15
U13
344 m
U17
Ple
isto
cene
-Hol
ocen
eP
lioce
neM
ioce
ne
OligoceneEocene
Site U1352(projected)
Figure F26. Downhole and across-transect variations in oceanicity. Planktonic foraminiferal abundance (%) pris a relative measure of distance from land.
Dep
th (
m)
0
200
400
600
800
1000
1200
1400
1600
1800
2000
2200
U5
U6
U8
U12
U14U16U18
U10
U8
U7
U9
U6
U11
85 m 113 m 122 m
Ple
ist.-
Hol
o.P
lioce
neM
ioce
ne
Ple
ist.-
Hol
o.P
lioce
ne
Ple
ist.-
Hol
o.P
lioce
neM
ioce
ne
Planktonic foraminifer abundance (oceanicity)
0 60 100%4020 80
0%-5% Sheltered inner neritic
5%-15% Inner neritic
15%-30% Outer neritic
30%-60% Extraneritic
60%-90% Suboceanic
90%-95% Oceanic
95%-100% Open oceanic
SeafloorSeafloor
Site U1353 Site U1354 Site U1351

Expedition 317 Scientists Expedition 317 summary
Figure F27. Benthic foraminifer–derived paleowater depth changes across Sites U1353, U1354, U1351, andU1352. Seismic sequence boundaries U19–U5 are shown schematically, intersecting each site at their predicteddepths.
0
200
400
600
800
1000
1200
1400
1600
1800
2000
2200
Dep
th (
m)
Seafloor
Site U1353 Site U1354 Site U1351 Site U1352(projected)
U19
U18
U17
U16
U15
U14
U13
U18U16U14
U12
U11
U9
U8
U7
U6
U8
U6
U10
85 m122 m113 m
344 m
U5
?
Mid
dle
shel
f
Inne
r sh
elf
Out
er s
helf
Upp
erm
ost b
athy
al
Mid
dle
shel
fIn
ner
shel
f
Out
er s
helf
Upp
erm
ost b
athy
alU
pper
bat
hyal
Mid
dle
bath
yal
Dee
p m
iddl
e ba
thya
lLo
wer
bat
hyal
Mid
dle
shel
f
Inne
r sh
elf
Est
uarin
e-su
btid
al
Out
er s
helf
Mid
dle
shel
f
Inne
r sh
elf
Est
uarin
e-su
btid
al
Out
er s
helf
Proc. IODP | Volume 317 75

Expedition 317 Scientists Expedition 317 summary
Figure F28. Age-depth plot for Hole U1353B. Sedimentation rates are tentative and based on visual correlationof data. Hiatuses are inferred from biostratigraphic analysis. NZ = New Zealand.
?
?
?
?
1H
2H
3H4H
5H
6H7H8H9H
10H11H12H
13H14X
15X
16X17H 18X
19H20H21H
22X
23H24H
25H26H
27H28H29H30H
31X
32X33H34H
35H36H
37H38H39H40H
41H42H43H
44X
45H46H47H48H49H
50X51H52H53H54H55H56H57H58H59H60H 61X
62X
63X
64X
65X
66X
67X
68X
69X
70X
71X
72X
73X
74X
75X
76X
77X
78X
79X
80X
81X
82X
83X
84X
85X
86X
87X
88X
89X
90X
91X
92X
93X
94X
95X
96X
97X
98X
600
550
500
450
400
350
300
250
200
150
100
50
0
Dep
th C
SF
-A (
m)
Nannofossil datum
Planktonic foraminifer datum
Planktonic foraminifer maximum age
Benthic foraminifer minimum age
Unit I
Unit II
26 cm/k.y.
8.2 cm/k.y.
7.4 cm/k.y.
Hole U1353B
12 13Age (Ma)
Pleistocenemiddle
Pliocene
Wq Wp lTkNZ stage
late late middle
0 1 2 3 4 5
lateearly
Wc Wm lWo
MioceneearlyGlobal
timescale
6 7 8 9 10 11
uTt Sw SIWn uWo uTk lTt
Corerecovery
Proc. IODP | Volume 317 76

Expedition 317 Scientists Expedition 317 summary
Figure F29. Age-depth plot for Holes U1354A–U1354C. Sedimentation rates are tentative and based on visualcorrelation of data. Hiatuses are inferred from biostratigraphic analysis. NZ = New Zealand.
?
?
21 cm/k.y.
9.3 cm/k.y.
4.5 cm/k.y.
40 cm/k.y.
350
300
250
200
150
100
50
0 1H
2H3H
4H 5H6H
7H
8H
9H
10H11H
12H
13H14H 15H
16D17H
18H19H
HoleU1354A
1H2H
3H
4H5H
6H7H
8H
9H
10H
11H
12H
13H
14H15H
HoleU1354B
2H
3H4X
5X
6X
7X
8X
9X
10X
11X
12X
13X
14X
15X
16X
17X
18X
19X
20X
21X
22X
23X
24X
25X
26X
27X
28X
29X
30X
31X
32X
33X
34X
35X
36X
HoleU1354C
Nannofossil datum, Hole U1354ANannofossil datum, Hole U1354B
Nannofossil datum, Hole U1354C
Planktonic foraminifer maximum age
Benthic foraminifer datum, Hole U1354ABenthic foraminifer datum, Hole U1354B
Benthic foraminifer minimum age, Hole U1354ABenthic foraminifer minimum age, Hole U1354CBrunhes-Matuyama reversal, Hole U1354A
Brunhes-Matuyama reversal, Hole U1354B
Age (Ma)Holocene-Pleistocene
middlePliocene
Wq Wp lTkNZ stagelate late
lateearly
Wc Wm lWo
MioceneearlyGlobal
timescale
uTtWn uWo uTk
Corerecovery
Corerecovery
Corerecovery
0 1 2 3 4 5 6 7 8 9
Dep
th C
SF
-A (
m)
Unit II
Subunit IB
Subunit IA
Proc. IODP | Volume 317 77

Expedition 317 Scientists Expedition 317 summary
Figure F30. Age-depth plot for Hole U1351B. Sedimentation rates are tentative and based on visual correlationof data. Hiatuses are inferred from biostratigraphic analysis. Hiatus positions are sometimes located at distinctboundaries found in recovered cores, but some hiatuses exist in intervals of low recovery. Dashed wavy lines =the most poorly constrained hiatuses. NZ = New Zealand.
?
?
Dep
th C
SF
-A (
m)
1000
800
600
400
200
0
Age (Ma)
Holocene-Pleistocenemiddle
Pliocene
Wq Wp lTkNZ stagelate late
0 1 2 3 4 5
lateearly
Wc Wm lWo
MioceneearlyGlobal
timescale
6 7 8 9 10 11
uTt Sw middleWn uWo uTk lTt
Corerecovery
Nannofossil minimum age
Nannofossil maximum age
Nannofossil datum
Planktonic foraminifer minimum age
Planktonic foraminifer maximum age
Planktonic foraminifer datum
Benthic foraminifer minimum age
Benthic foraminifer maximum age
Diatom minimum age
NZ stage (from planktonic foraminifers)
Unit I
Unit II
20 cm/k.y.
17 cm/k.y.
29 cm/k.y.
59 cm/k.y.
1H2H4H6H7H8H9H11H
12H13H14X15X16X17X18X19X20X21X22X23X24X25X26X27X28X29X30X31X32X33X34X35X36X37X38X39X40X41X42X43X44X45X46X47X48X49X50X51X52X53X54X55X56X
60X61X62X63X64X66X67X68X69X70X71X72X73X74X75X76X77X79X80X81X82X83X84X86X87X88X89X90X91X92X93X94X95X96X97X98X99X
100X101X102X103X104X105X106X107X108X109X110X111X112X113X114X115X116X
Proc. IODP | Volume 317 78

Expedition 317 Scientists Expedition 317 summary
Figure F31. Age-depth plot for Holes U1352B and U1352C. Sedimentation rates are tentative and based onvisual correlation of data. Hiatuses are inferred from biostratigraphic analysis. NZ = New Zealand.
Holo.-Pleist. Pliocene
Wp
Tklate late
0 5 10 15 20 25
WcWm
Wo
Mioceneearly
30 35
uTt SwWn
lTt Sl Sc Pl Po Lw Ld lLwh
Oligocene
uLwh
Eoc.lateearly earlymiddle
1800
1600
1400
1200
1000
800
600
400
200
0 2H
4H
6H
8H
10H
12H
14H
16H18H
22H
24H
26H
30H32H
38X
40X
42X
44X
46X
48X
50X
52X
54X
56X
58X
60X
62X
64X
68X
70X
72X
74X
76X
78X
80X
84X
86X
88X
90X
92X
94X
Dep
th C
SF
-A (
m)
HoleU1352B
Corerecovery
Corerecovery
2R
4R
5D
6R
8R
10R
12R
14R
16R
18R
20R
22R
24R
26R
28R
30R
32R
34R
36R
38R
40R
42R
44R
46R
48R
50R
52R
54R
56R
58R
60R
62R64R
68R70R
72R
74R
76R
79R
82R
86R
88R
90R
92R
94R
96R
98R100R
102R
104R
106R
108R
110R
112R
114R
116R
118R120R
122R124R
126R
128R
130R
132R
134R
136R
138R
140R142R
144R
146R
148R
HoleU1352C
Ar
20H
28H
34H
66X
82X
Subunit IA
5.9 cm/k.y.
1.2 cm/k.y.
26 cm/k.y.
22 cm/k.y.
Subunit IB
Subunit IC
Subunit IIA
Subunit IIB
Subunit IIC
Unit III
Age (Ma)
NZ stage
Globaltimescale
Nannofossil datum
Planktonic foraminifer datum
Planktonic foraminifer maximum age
Benthic foraminifer datum
Benthic foraminifer minimum age
Diatom datum
Proc. IODP | Volume 317 79

Exped
ition
317 Scientists
Exped
ition
317 summ
ary
Proc. IOD
P | Volume 317
80
matically, intersecting each site at
U17
U16
U15
U14
U13
MP
Site U1352(projected)
0 20 40 60Porosity (%)
Figure F32. Porosity vs. depth curves, Expedition 317. Seismic sequence boundaries U19–U5 are shown schetheir predicted depths. MP = Marshall Paraconformity.
Seafloor
U19U18
U18U16U14U12
U11
U9
U8
U7
U6
U8
U6
U10
U5?
Dep
th (
m)
Site U1353 Site U1354 Site U13510
200
400
600
800
1000
1200
1400
1600
1800
2000
2200
0 20 40 600 20 40 60 0 20 40 60
Sediment
Sedimentary rock
Porosity (%) Porosity (%) Porosity (%)

Expedition 317 Scientists Expedition 317 summary
Figure F33. Variation of (A) methane, (B) alkalinity, (C) sulfate, and (D) phosphate concentrations over theuppermost 250 m, Expedition 317.
100 101 102 103 104 105
50
100
150
200
250
Methane (ppmv)
Dep
th C
SF
-A (
m)
0 5 10 15 20 25
Alkalinity (mM)
0 5 10 15 20 25 30
Sulfate (mM)
0.1 1 101 102
Phosphate (mM)
Site U1351 Site U1352 Site U1353 Site U1354
A B C D
Proc. IODP | Volume 317 81

Exped
ition
317 Scientists
Exped
ition
317 summ
ary
Proc. IOD
P | Volume 317
82
U17
U16
U15
U14
U13
Site U1352(projected)
344 m
0 20 40 60mM
Figure F34. Downhole plots of calcium, magnesium, sodium, and potassium, Expedition 317.
Seafloor
U19
U18
U18U16U14
U12
U11
U9
U8
U7
U6
U8
U6
U10
U5
?
Dep
th (
m)
Site U1353 Site U1354 Site U13510
200
400
600
800
1000
1200
1400
1600
1800
2000
2200
85 m122 m
Ca
Mg
(Na - 300)/10
K x 5
113 m
0 20 40 60mM
0 20 40 60mM
0 20 40 60mM

Expedition 317 Scientists Expedition 317 summary
Figure F35. Downhole plots of (A) carbonate, (B) total organic carbon by difference between total carbon fromthe elemental analyzer and coulometer-derived inorganic carbon (TOCDIFF), (C) ratio of TOCDIFF to total nitrogencontent, (D) Tmax, (E) hydrogen index (HI), and (F) production index (PI), Expedition 317.
0
500
1000
1500
2000
0
500
1000
1500
2000
0 50 100
Carbonate (wt%)
0.0 0.5 1.0 1.5 2.0 0.1 10 1000
A B CTOCDIFF (wt%) TOCDIFF/Total nitrogen
Dep
th C
SF
-A (
m)
Dep
th C
SF
-A (
m)
D E FTmax (°C) HI (mg S2/g TOC) PI (S1/[S1+S2]) (%)
Site U1351 Site U1352 Site U1353 Site U1354
350 400 450 0 50 100 150 0 20 40 60
Proc. IODP | Volume 317 83

Expedition 317 Scientists Expedition 317 summary
Table T1. Coring summary, Expedition 317. (See table note.)
Note: NA = not applicable.
Hole Latitude Longitude
Water depth(m)
Cores (N)
Interval cored(m)
Core recovered
(m)Recovery
(%)
Drilled interval
(m)
Total penetration
(m)
Timeon hole
(h)
Timeon site(days)
U1351A 44°53.0307′S 171°50.4037′E 122.3 6 28.0 27.3 98 0.0 28.0 14.0U1351B 44°53.0422′S 171°50.4065′E 121.7 116 1030.6 304.5 30 0.0 1030.6 162.5U1351C 44°53.0572′S 171°50.4057′E 121.7 NA 0.0 NA NA 967.3 967.3 104.0
Site U1351 totals: 122 1058.6 331.8 64 967.3 2025.9 280.5 11.7
U1352A 44°56.2440′S 172°1.3615′E 343.8 5 42.2 43.9 104 0.0 42.2 3.8U1352B 44°56.2558′S 172°1.3630′E 343.6 94 830.9 613.9 74 0.0 830.9 120.8U1352C 44°56.2662′S 172°1.3630′E 343.5 148 1296.4 655.0 51 631.1 1927.5 361.8U1352D 44°56.2326′S 172°1.3611′E 344.2 14 127.0 130.8 103 0.0 127.0 23.0
Site U1352 totals: 261 2296.5 1443.6 83 631.1 2927.6 509.3 21.2
U1353A 44°46.1079′S 171°40.4368′E 84.2 8 56.0 56.4 101 0.0 56.0 12.0U1353B 44°46.1203′S 171°40.4407′E 84.7 98 614.3 211.5 34 0.0 614.3 105.5U1353C 44°46.0982′S 171°40.4380′E 84.7 NA 0.0 NA NA 529.0 529.0 48.3
Site U1353 totals: 106 670.3 267.9 68 529.0 1199.3 165.8 6.9
U1354A 44°50.8281′S 171°47.2096′E 109.8 19 85.4 84.4 101 0.0 85.4 23.3U1354B 44°50.8367′S 171°47.2069′E 113.4 15 77.2 77.5 100 0.0 77.2 13.8U1354C 44°50.8487′S 171°47.2080′E 113.4 36 319.2 133.4 42 65.0 384.2 53.8
Site U1354 totals: 70 481.8 295.3 81 65.0 546.8 90.8 3.8
Expedition 317 totals: 559 6003.5 2338.6 74 696.1 6699.6 1046.3 43.6
Proc. IODP | Volume 317 84

Exped
ition
317 Scientists
Exped
ition
317 summ
ary
Proc. IOD
P | Volume 317
85 nformity. TD = total depth. MP = Marshalla.
ary age (Ma)
sibly <0.1 (CN)
sibly <0.1 (CN)
0.44 (CN)
0.91 (CN)/M boundary)best age for U15)
1.69 (CN)
1.81 (CN)73–1.81 (CN)liocene boundary>2.78 (CN)
) possibly >3.7
) possibly >3.7
N)–4.3 (PF)
N)–4.3 (PF)
N)–4.3 (PF)
enetrated
enetrated
Table T2. Sequences drilled during Expedition 317. (See table notes.) (Continued on next page.)
Notes: CN = ages derived from nannofossils, PF = ages derived from planktonic foraminifers, BF = ages derived from benthic foraminifers. u/c = uncoParaconformity (“Green” horizon of industry interpreters), DLS = seismic downlap surface originally thought to be MP, B/M = Brunhes/Matuyam
Site U1353 Site U1354
Seismic sequence boundary
Predicted age (Ma)
Predicted depth (mbsf)
DepthCSF-A (m) Preliminary age (Ma)
Predicted depth(mbsf)
DepthCSF-A (m) Prelimin
U19 0.1 12 <0.29, possibly <0.1 (CN) 11 <0.29, pos
U18 0.3 26 <0.29, possibly <0.1 (CN) 22 <0.29, pos
U17 0.7 59 0.29–0.44 (CN) 51 0.29–
U16 1.1 72 0.44–1.01 (CN) 64 0.44–65–69 >0.78 (B
U15 1.4 Absent 79 1.26–1.34 (
U14 1.7 91 1.34–1.56 (CN) 93 1.34–
U13 2.4 112 1.69–1.73 (CN) 121 1.69–Above 1.
121.16–135.71 Pleistocene/Pliocene boundary 122.20–133.37 Pleistocene/P135.71 >2.78 (CN) Below
U12 2.6 151 3.7 (CN)–4.3 (PF) 156 >2.78 (CN
U11 3.6 171 3.7 (CN)–4.3 (PF) 177 >2.78 (CN
U10 3.65 192 3.7 (CN)–4.3 (PF) 211 3.7 (C
U9 3.7 241 3.7 (CN)–4.3 (PF) 279 3.7 (C
U8 5 290 >4.3 (PF) 344 3.7 (C
U7 9 400 >4.3 (PF) 467 Not p
U6 10.4 491 >4.3 (PF) 713 Not p
New u/c 518.66 Below u/c >12.03 (CN)
U5 11.3 597 middle Miocene assemblage
U4 12.4 679 Not penetrated: :: :: :DLS 28
MP = Green ?

Exped
ition
317 Scientists
Exped
ition
317 summ
ary
Proc. IOD
P | Volume 317
86
Preliminary age (Ma)
<0.29; possibly <0.1 (CN)
0.29–0.44 (CN)
0.44–0.91 (CN)
0.44–0.91 (CN)0.91 (CN)
1.56–1.69 (CN)
1.56–1.69 (CN)
1.69 (1.73?)–1.81
eistocene/Pliocene boundaryBelow >?2.7 (PF)
>2.78 (CN)
>2.78 (CN)
3.7 (CN)–4.3 (PF)
3.7 (CN)–4.3 (PF)
3.7 (CN)–4.3 (PF)4.3 (PF)
4.49–5.3 (PF)ne/Miocene boundary (5.3 Ma)
10.58 below10.58–10.91 (PF)
12.98–13.33 (PF)
13.53–15.80 (CN)~19 above MP
30.1–32.0 below MP35.2 (CN)–36.0 (PF)
Table T2 (continued).
Site U1351 Site U1352
Seismic sequence boundary
Predicted age (Ma)
Predicted depth(mbsf)
DepthCSF-A (m) Preliminary age (Ma)
Predicteddepth(mbsf)
DepthCSF-A (m)
U19 0.1 17 <0.29; possibly <0.1 (CN) 68
U18 0.3 31 <0.29; possibly <0.1 (CN) 142
U17 0.7 51 0.29–0.44 (CN), >0.6 (BF) 195
U16 1.1 64 0.44–1.01 (CN), >0.6 (BF) 249266.92
U15 1.4 86 1.34–1.69 (CN) 428
U14 1.7 103 1.34–1.69 (CN) 448
U13 2.4 135 Above 1.69–1.81 (CN) 500
134.48–147.55 Pleistocene/Pliocene boundary 504.14–507.09 PlBelow ?>2.7 (PF)
U12 2.6 166 ?>2.7 (PF) Absent 542.58
U11 3.6 195 ?>2.7 (PF) 769
U10 3.65 237 3.7 (CN)–4.3 (PF) Absent 889.64
U9 3.7 312 3.7 (CN)–4.3 (PF) 970
U8 5 394 4.3–5.3 (PF) 11361151.22
U7 9 614 4.3–5.3 (PF) 1251819.12–822.69 Pliocene/Miocene boundary (5.3 Ma) 1266.38–1283.95 Plioce
New u/c 1394.62–1409.66U6 10.4 895 5.6–7.07 (PF) 1428
New u/c 998.34–1005.34 Below u/c: 10.50–10.91 (PF) New u/c or U5? 1486.8–1496.51024 (TD) 10.50–10.91 (PF)
U5 11.3 1073 Absent?
U4 12.4 1153 Not penetrated Absent?: :: :: :DLS 28 Not penetrated 1647
1848.49MP = Green ? Not penetrated 1824 ~1850
1852.7TD 1924.26