Embed Size (px)
Citation preview

Report-BCTC-R009B
Expected Energy Not Served (EENS) Study for Vancouver
Island Transmission Reinforcement Project (Part II: Comparison between VITR and Sea Breeze HVDC Light Options)
December 23, 2005
Prepared by
Wenyuan Li System Planning and Performance Assessment British Columbia Transmission Corporation
1

DISCLAIMER This report was prepared by BCTC solely for the purposes described in this report, and is based on information available to BCTC as of the date of this report. Accordingly, this report is suitable only for such purposes, and is subject to any changes arising after the date of this report. Unless otherwise expressly agreed by BCTC, BCTC does not represent or warrant the accuracy, completeness or usefulness of this report, or any information contained in this report, for use or consideration by any third party, nor does BCTC accept any liability out of reliance by a third party on this report, or any information contained in this report, or for any errors or omissions in this report. Any use or reliance by third parties is at their own risk. COPYRIGHT NOTICE Copyright and all other intellectual property rights are expressly reserved to BCTC. Without prior written approval of BCTC, no part of this report shall be reproduced or distributed in any manner or form whatsoever.
2

December 23, 2005
Expected Energy Not Served (EENS) Study for Vancouver Island Transmission Reinforcement Project
(Part II: Comparison between VITR and Sea Breeze HVDC Light Options) (Executive Summary)
by Wenyuan Li
System Planning and Performance Assessment British Columbia Transmission Corporation
The purpose of this study is to conduct a comparison in the reliability to VI power supply between the 230 kV line option (VITR proposed by BCTC) and the HVDC Light option (proposed by Sea Breeze Corporation). The technology used in the HVDC Light option is Voltage Source Converter (VSC). Reliability of the VI power supply system depends on two factors: capacity of and failure probability of transmission supply sources. In the two options, 500 kV lines and local generation are identical. The 230 kV line option has a capacity of 600 MW at the receiving point whereas the Sea Breeze HVDC option has a capacity of 540 MW at the receiving point (574 MW at the delivery point minus 34 MW of losses). The Sea Breeze HVDC option is composed of underground cables, submarine cables and converter station equipment (valves, transformers, reactors, capacitors, controls, etc.), while the 230 kV line only consists of overhead lines, submarine cables and a phase shifting transformer. All these components are in series and the total length of underground and submarine in the Sea Breeze HVDC option (120.4 km) is much longer than that of the overhead line and submarine cable in the 230 kV line option (66.7 km). A basic concept in reliability evaluation is that more components in series and a longer distance of circuit will lead to a higher failure probability. Therefore, it can be qualitatively judged from both the capacity and failure probability of circuits that the 230 kV line will have higher supply reliability than the Sea Breeze HVDC link. The study given in this part of the report provides a proof through a quantified EENS reliability evaluation. The failure data for HVDC components (converter station equipment, underground and submarine cables) used in the study are based on outage statistics in the similar HVDC projects across the world. Due to inherent uncertainty in the statistics, optimistic and pessimistic failure data estimates are obtained. The failure data for the 230 kV line are based on outage statistics of 230 kV overhead lines in the BC Hydro system and a pessimistic engineering estimate for the submarine cable (3 months of repair time due to extreme difficulties for repairing activities under water). The failure data of the phase shift transformer is based on historical failure records of the PST on 2L112 in the BC Hydro system. The EENS study results indicate:
• The 230 kV AC line option can provide much better VI power supply reliability than the Sea Breeze HVDC link. The pessimistic failure data estimate is used for the 230 kV AC line. With the same pessimistic assumption of the failure data estimate for the submarine cable in the Sea Breeze HVDC link, the 230 kV AC line will result in about 26% to 32%
3

higher VI supply reliability. Even if the optimistic failure data estimate for the Sea Breeze HVDC link is used, the 230 kV AC line will still have about 15% to 18% higher VI supply reliability.
• The reason why the Sea Breeze HVDC provides lower reliability to VI supply (higher EENS) than the 230 kV AC line is not only because of its relatively higher unavailability but also due to that fact that the capacity of the Sea Breeze HVDC is 60 MW lower than the 230 kV AC line at the receiving point. The effect due to the lower capacity of 60 MW (600 MW - 540 MW) is comparable to the difference in the EENS caused by changing the availability from 97% to 93%.
• Although the Sea Breeze HVDC link unavailability based on the pessimistic failure data estimate is more than double of that based on the optimistic failure data estimate, the difference in the EENS indices for VI power supply system is only about 11% to 18 % depending on the load level on the Vancouver Island. In other words, VI power supply reliability will not have a significant variance when the availability of the Sea Breeze HVDC system ranges between 93% to 97%.
4

December 23, 2005
Expected Energy Not Served (EENS) Study for Vancouver Island Reinforcement Project (Part II: Comparison between VITR and Sea Breeze HVDC Light Options)
by Wenyuan Li
System Planning and Performance Assessment British Columbia Transmission Corporation
1. Introduction A report titled “Reliability Evaluation of Three Scenarios for Vancouver Island Power Supply – An Expected Energy Not Served (EENS) Study” was released for the VIGP project in June 11, 2003 [1]. In that report, three scenarios of VIGP (Portfolio 2), 230 kV line and HVDC life extension were evaluated and compared. Based on various technical studies and the VIGP hearing, it was decided to go ahead with the 230 kV line project. The purpose of this study is to conduct a comparison in the reliability to VI power supply between the 230 kV line option (VITR proposed by BCTC) and the HVDC light option (proposed by Sea Breeze Corporation). The technology used in the HVDC light option is Voltage Source Converter (VSC). Reliability of the VI power supply system depends on two factors: capacity of and failure probability of transmission supply sources. In the two options, 500 kV lines and local generation are the same. The 230 kV line option has a capacity of 600 MW at the receiving point whereas the Sea Breeze HVDC option has a capacity of 540 MW at the receiving point (574 MW at the delivery point minus 34 MW of losses). The Sea Breeze HVDC option is composed of underground cable, submarine cable and converter station equipment (valves, transformers, reactors, capacitors, controls, etc.), while the 230 kV line only consists of overhead line, submarine cable and a phase shifting transformer. All these components are in series and the total length of underground and submarine in the Sea Breeze HVDC option (120.4 km) is much longer than that of the overhead line and submarine cable in the 230 kV line option (66.7 km). A basic concept in reliability evaluation is that more components in series and a longer distance of circuit will lead to a higher failure probability. Therefore, it can be qualitatively judged from both the capacity and failure probability that the 230 kV line will have higher supply reliability than the Sea Breeze HVDC link. The study given below will provide a proof through a quantified EENS reliability evaluation. The method and the computing tool used in this study are the same as those in Part I of the report (See Section 2 of Part I) [2]. The failure data for the 500 kV lines, 230 kV line (including overhead, submarine cable and phase shifting transformer) and local generating units are also the same as those in Part I. The failure data of Sea Breeze HVDC system are based on a published report, in which failure data of various HVDC components across the world are analyzed, and a published paper by CIGRE, in which the similar VSC-based HVDC project is presented.
2. Data
5

2.1 Sea Breeze HVDC system data The Sea Breeze HVDC system data is summarized as follows.
Component Parameter Capacity 574 MW at delivering point, 540 MW at receiving point Voltage ±150 kV Converter station 150 m x 100 m Underground cable (HVDC) 53.02 km (21.02 km on Lower Mainland, 32.0 km on VI) Submarine cable (HVDC) 67.38 km (across the Straight of Georgia) AC overhead lines 200 – 1000 m (from each converter station to nearby substation)
The detail data is given in Appendix D. 2.2 VITR 230 kV AC line data The 230 kV line data is as follows:
Component Parameter Capacity 600 MW at receiving point Phase shifting transformer 600 MW ±20 deg., 33 tap positions (can be bypassed) Voltage 230 kV Overhead lines (AC) 35.6 km Submarine cable (AC) 31.1 km
2.3 Failure data 2.3.1 Failure data of the 230 kV line The 230 kV AC line includes three portions: overhead line, submarine cable and phase shifting transformer. The failure data for the overhead portion were based on the average of existing 230 kV lines in the BC Hydro system, which were obtained from BCTC’s CROW (Control Room Operations Window) system. The failure data for the submarine cable were based on an engineering estimate. The failure data of the phase shift transformer is based on historical failure records of the PST on 2L112 in the BC Hydro system. The basic failure data used in the study is as follows:
Component Failure frequency (failures/year)
Repair time (hours)
Overhead line (line-related) 0.2778 16.85 Overhead line (terminal-related) 0.2136 16.40 Submarine cable 0.1 2190 Phase shifting transformer 0.3333 3.06
6

It can be seen that a long repair time has been assumed for the submarine cable. This is based on the assumption that there is no specific shipping facility available for repairing activities under water. This is a pessimistic estimate. With the failure frequencies and repair times of components, the total FORs (Forced Outage Rate, i.e., unavailability) and equivalent repair times are: For circuit (overhead and submarine cable combined):
FOR = 0.0259 Repair time = 383.74 hours For the phase shifting transformer: FOR = 0.000116 Repair time = 3.06 hours Total unavailability of the 230 kV line (including overhead, submarine cables and PST): FOR = 0.02602 The calculations for the FORs and repair times are given in Appendix B. 2.3.2 Failure data from other HVDC systems across the world It is a reasonable approach to make use of failure data of other HVDC systems that have similarities to the Sea Breeze HVDC system. 1. Failure data from the Murraylink transmission interconnection project [3] The Murraylink transmission interconnection project in Australia is a VSC-based HVDC link with only underground cable (177 km). The total availability of this VSC-based HVDC system in the one year is 97%, corresponding to an unavailability of 0.03 [3]. The most serious forced outage was a cable failure resulting in one week (168 hours) of outage in a year. Based on the data provided in Reference [3], the total unavailability can be broken down as follows:
• Unavailability due to the cable failure is: 1/52 = 0.019231. This unavailability corresponds to the whole underground cable of 177 km. Therefore, the unavailability in 100 km is 0.019231 x 100 /177 = 0.010864.
• Unavailability due to the converter station facilities is: 0.03 – 0.01923 = 0.010769.
2. Failure data from the report of “RAM Study Phase II: NORNED KABEL HVDC project” [4] In this report, a comprehensive failure data analysis for HVDC components across the world (including converter station facilities, underground and submarine cables) was performed. Although the analysis is based on conventional HVDC systems, the reliability data especially on cables can be used as a reference in the reliability studies of the HVDC light. The failure data analysis given in the report shows that causes of cable failures mainly depend on its external environment (corrosion, ship accident, cable ducts, joints, etc.) and slightly on internal factors (such as insulation related to the voltage level). The failure data are always associated with
7

uncertainty and the report provided pessimistic and optimistic estimates for failure data of both underground and submarine cables. According to the report, the following failure data are obtained:
• The average repair time of converter station facilities: 49.01 hours. This is a weighted average of repair times of various converter station components with their failures frequencies as weighting factors.
• Underground cable:
Failure frequency (failures/year/100 km)
Repair time (hours)
Pessimistic estimate 0.057 312 Optimistic estimate 0.0144 288
• Submarine cable: Failure frequency
(failures/year/100 km) Repair time (hours)
Pessimistic estimate 0.2684 1272 Optimistic estimate 0.2684 936
Note: The failure frequency is associated with two portions: external and internal failures.
The external failure frequency = 0.264 failures/year/100km and the internal failure frequency = 0.0044 failures/year/100km. It can be seen that the failure frequency is dominated by external factors. A larger estimate of internal failure frequency (0.0143 failures/year/100km) given in the report was not used in this study since it includes statistics in earlier years before 1965, which may be related to out-of-date technologies. Therefore the same failure frequency for both pessimistic and optimistic estimates is assumed.
2.3.3 Failure data used for the Sea Breeze HVDC system The Sea Breeze HVDC system consists of three major portions: converter station, underground cable and submarine cable. The failure data for these three portions have to be estimated separately. The converter station facilities have similarities to those in other HVDC projects whereas the lengths of both underground and submarine cables are different from other HVDC projects. The failure data for the Sea Breeze HVDC system is estimated with the following assumptions:
• The unavailability due to converter station facilities is the same as that obtained from the Murraylink transmission interconnection project since both HVDC systems use the VSC technology of ABB.
8

• The average repair time of the converter station facilities is the weighted average of repair times of various converter station components given in the report of “RAM Study Phase II: NORNED KABEL HVDC project”.
• For the unavailability of the underground cable, the failure data in the report of “RAM Study Phase II: NORNED KABEL HVDC project” provides the optimistic estimates and the failure data in the Murraylink transmission interconnection project provides the pessimistic estimates.
• For the repair time of the underground, the failure data in the report of “RAM Study Phase II: NORNED KABEL HVDC project” provides both optimistic and optimistic estimates.
• For the unavailability and repair time of the submarine cable, the failure data in the report of “RAM Study Phase II: NORNED KABEL HVDC project” provides the optimistic estimates and the failure data of the 230 kV AC line (submarine cable portion) provides the pessimistic estimates. The submarine portion in the 230 kV AC line option has the highest unavailability mainly due to the assumption of a long repair time (2190 hours). Using the assumption of the submarine cable of the 230 kV AC line option as the pessimistic estimate is reasonable since the purpose of the study is to conduct the comparison between the 230 kV AC line and Sea Breeze HVDC link.
It should be noted that in calculating the unavailability or failure frequency of underground and submarine cables for the Sea Breeze HVDC system, the values have been adjusted proportionally according to their actual lengths. The failure data used for the Sea Breeze HVDC system is as follows:
Optimistic estimates Component Length
(km) Repair time (hours)
Unavailability
Converter station facility 49.01 0.010769 Underground cable 53.02 288 0.000251 Submarine cable 67.38 936 0.019323 Whole HVDC (equivalent) 125.79 0.030344
Pessimistic estimates Component Length
(km) Repair time (hours)
Unavailability
Converter station facility 49.01 0.010769 Underground cable 53.02 312 0.005761 Submarine cable 67.38 2190 0.054164 Whole HVDC (equivalent) 268.85 0.070694
It can be seen that the optimistic estimate of the unavailability of the whole Sea Breeze HVDC system is slightly higher than that of the 230 kV line while the pessimistic estimate is twice higher than the optimistic estimate.
9

2.3.4 Failure data of 500 kV lines and local generating units The failure data for the 500 kV lines and on-Island generating units were based on historical failure records and are the same as those used in Part I of the report. These data are given in Appendices A and B. 2.4 Load data The load model used in the study was the most recent Vancouver Island peak load forecast for 2008/09 to 2022/23. The 8760 hourly load records in 2004 were used to model the annual load curve shape. The peak load forecast and the total VI generation MW are given in Appendix C.
3. EENS Evaluation 3.1 EENS for the Sea Breeze HVDC option using optimistic and pessimistic failure data Both optimistic and pessimistic failure data for the Sea Breeze HVDC link were used to evaluate the EENS indices to Vancouver Island power supply. The results are shown in Table 1 and Figure 1. It can be seen that although the unavailability based on the optimistic failure data estimate is more than double of the unavailability based on the pessimistic failure data estimate, the difference in the EENS indices between the two cases is only about 11% to 18 %. In other words, VI power supply reliability will not have a significant variance when the availability of the Sea Breeze HVDC system ranges between 93 to 97%.
Table 1 EENS index (MWh/year) for Sea Breeze HVDC option
Year HVDC HVDC
Difference Unavailability
(Forced outage rate) 0.03034 0.07069 Availability 0.96966 0.92931
2008 3454 3888 11.16% 2009 3349 3767 11.10% 2010 3566 4047 11.89% 2011 3693 4211 12.30% 2012 3904 4522 13.67% 2013 4193 4824 13.08% 2014 4435 5167 14.17% 2015 4719 5468 13.70% 2016 5146 6020 14.52% 2017 5650 6716 15.87% 2018 6127 7329 16.40% 2019 6746 8059 16.29% 2020 7535 9150 17.65% 2021 8493 10299 17.54% 2022 9375 11385 17.65%
10
0
2000
4000
6000
8000
10000
12000
2008 2009 2010 2011 2012 2013 2014 2015 2016 2017 2018 2019 2020 2021 2022
year
EEN
S(M
Wh/
year
)
HVDC(FOR=0.03034)HVDC(FOR=0.07069)
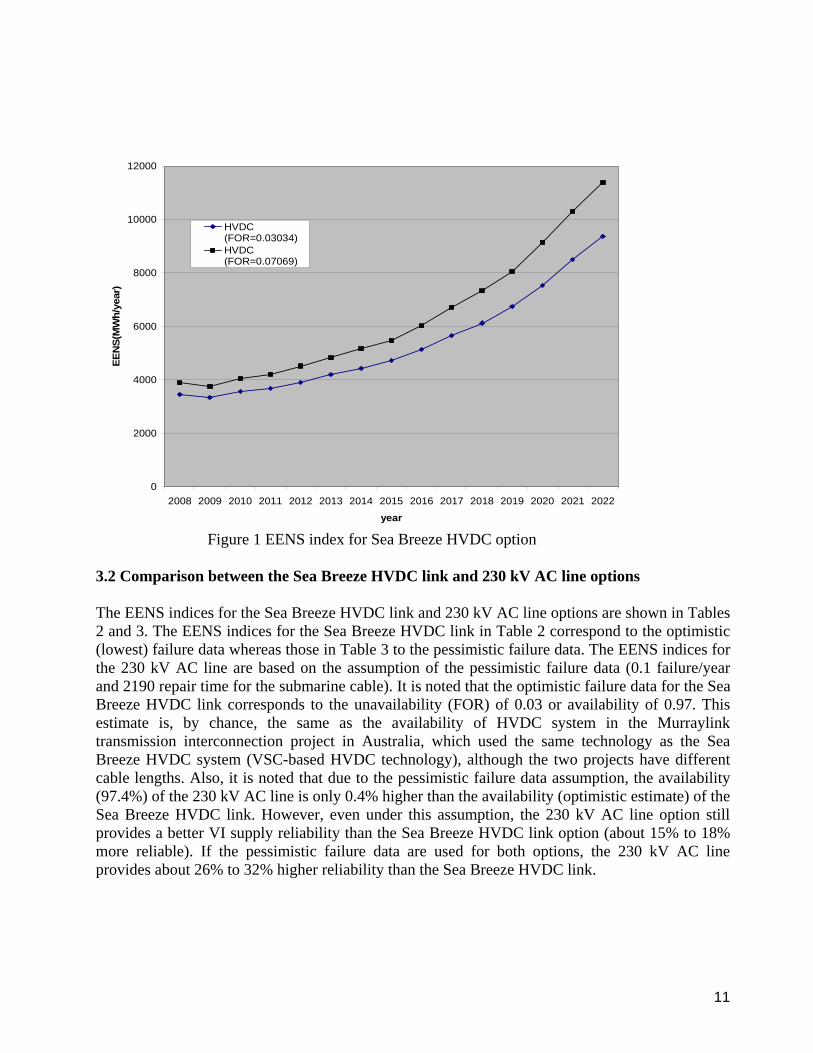
Figure 1 EENS index for Sea Breeze HVDC option
3.2 Comparison between the Sea Breeze HVDC link and 230 kV AC line options The EENS indices for the Sea Breeze HVDC link and 230 kV AC line options are shown in Tables 2 and 3. The EENS indices for the Sea Breeze HVDC link in Table 2 correspond to the optimistic (lowest) failure data whereas those in Table 3 to the pessimistic failure data. The EENS indices for the 230 kV AC line are based on the assumption of the pessimistic failure data (0.1 failure/year and 2190 repair time for the submarine cable). It is noted that the optimistic failure data for the Sea Breeze HVDC link corresponds to the unavailability (FOR) of 0.03 or availability of 0.97. This estimate is, by chance, the same as the availability of HVDC system in the Murraylink transmission interconnection project in Australia, which used the same technology as the Sea Breeze HVDC system (VSC-based HVDC technology), although the two projects have different cable lengths. Also, it is noted that due to the pessimistic failure data assumption, the availability (97.4%) of the 230 kV AC line is only 0.4% higher than the availability (optimistic estimate) of the Sea Breeze HVDC link. However, even under this assumption, the 230 kV AC line option still provides a better VI supply reliability than the Sea Breeze HVDC link option (about 15% to 18% more reliable). If the pessimistic failure data are used for both options, the 230 kV AC line provides about 26% to 32% higher reliability than the Sea Breeze HVDC link.
11

Table 2 EENS indices (MWh/year) for Sea Breeze HVDC link (optimistic failure data) and 230 kV AC line (pessimistic failure data)
Year HVDC 230kV line Difference Unavailability
(Force outage rate) 0.03034 0.02602 Availability 0.96966 0.97398
Capacity 540 MW 600 MW 2008 3454 2870 16.91% 2009 3349 2779 17.02% 2010 3566 2969 16.74% 2011 3693 3085 16.46% 2012 3904 3281 15.96% 2013 4193 3523 15.98% 2014 4435 3769 15.02% 2015 4719 3991 15.43% 2016 5146 4348 15.51% 2017 5650 4692 16.96% 2018 6127 5152 15.91% 2019 6746 5710 15.36% 2020 7535 6238 17.21% 2021 8493 6989 17.71% 2022 9375 7807 16.73%
Table 3 EENS indices (MWh/year) for Sea Breeze HVDC link (pessimistic failure data) and 230 kV AC line (pessimistic failure data)
Year HVDC 230kV line Difference Unavailability
(Forced outage rate) 0.07069 0.02602 Availability 0.92931 0.97398
Capacity 540 MW 600 MW 2008 3888 2870 26.18% 2009 3767 2779 26.23% 2010 4047 2969 26.64% 2011 4211 3085 26.74% 2012 4522 3281 27.44% 2013 4824 3523 26.97% 2014 5167 3769 27.06% 2015 5468 3991 27.01% 2016 6020 4348 27.77% 2017 6716 4692 30.14% 2018 7329 5152 29.70% 2019 8059 5710 29.15% 2020 9150 6238 31.83% 2021 10299 6989 32.14% 2022 11385 7807 31.43%
12

3.3 Contribution of different capacities to the EENS To discover the contribution of different capacities to the EENS, a study was conducted with the assumption that the capacity of the Sea Breeze HVDC link is increased to be the same as the 230 kV AC line (i.e., 600 MW) but with the unchanged unavailability (0.03) that is based on the optimistic failure data. The comparison in the EENS indices between this case and the case with 540 MW of capacity is given in Table 4. By comparing the “difference” columns in Tables 2 and 4, it can be asserted that only about 2% to 3% in the total difference of 15% to 18% in the EENS between the Sea Breeze HVDC link and 230 kV AC line is due to different unavailability values of the two options while the contribution of the different capacities (540 MW and 600 MW) to the EENS is about 13% to 15 %. Also, by comparing the numbers in the “difference” columns of Tables 1 and 4, it can be seen that the contribution due to the lower capacity of 60 MW (600 MW - 540 MW) is comparable to the difference in the EENS caused by changing the availability from 97% to 93%. Table 4 Contribution to EENS (MWh/year) due to a capacity difference of 60 MW
Year HVDC
HVDC
Difference Unavailability
(Forced outage rate) 0.030344 0.030344 Availability 0.969656 0.969656
Capacity 540 MW 600 MW 2008 3454 2942 14.82% 2009 3349 2865 14.45% 2010 3566 3053 14.39% 2011 3693 3174 14.05% 2012 3904 3387 13.24% 2013 4193 3617 13.74% 2014 4435 3871 12.72% 2015 4719 4127 12.55% 2016 5146 4483 12.88% 2017 5650 4890 13.45% 2018 6127 5304 13.43% 2019 6746 5885 12.76% 2020 7535 6516 13.52% 2021 8493 7295 14.11% 2022 9375 8076 13.86%
4. Conclusions This part of the report compared the Sea Breeze HVDC Light link with the VITR 230 kV AC line against Vancouver Island power supply reliability. The failure data for HVDC components (converter station equipment, underground and submarine cables) used in the study are based on
13

outage statistics in the similar HVDC projects across the world. Due to inherent uncertainty in the statistics, optimistic and pessimistic failure data estimates are obtained. The failure data for the 230 kV AC line are based on outage statistics of 230 kV overhead lines and phase shifting transformer in the BC Hydro system and a pessimistic estimate for the submarine cable. The EENS study results indicate:
• The 230 kV AC line option can provide much better VI power supply reliability than the Sea Breeze HVDC link. The pessimistic failure data estimate is used for the 230 kV AC line. With the same pessimistic assumption of the failure data estimate for the submarine cable in the Sea Breeze HVDC link, the 230 kV AC line will result in about 26% to 32% higher VI supply reliability. Even if the optimistic failure data estimate for the Sea Breeze HVDC link is used, the 230 kV AC line will still have about 15% to 18% higher VI supply reliability.
• The reason why the Sea Breeze HVDC provides lower reliability to VI supply (higher EENS) than the 230 kV AC line is not only because of its relatively higher unavailability but also due to that fact that the capacity of the Sea Breeze HVDC is 60 MW lower than the 230 kV AC line at the receiving point. The effect due to the lower capacity of 60 MW (600 MW - 540 MW) is comparable to the difference in the EENS caused by changing the availability from 97% to 93%.
• Although the Sea Breeze HVDC link unavailability based on the pessimistic failure data estimate is more than double of that based on the optimistic failure data estimate, the difference in the EENS indices for VI power supply system is only about 11% to 18 % depending on the load level on the Vancouver Island. In other words, VI power supply reliability will not have a significant variance when the availability of the Sea Breeze HVDC system ranges between 93% to 97%.
14

References
[1] BCTC Report, Reliability Evaluation of Three Scenarios for Vancouver Island Power Supply – An Expected Energy Not Served (EENS) Study, filed to BCUC in June 2003
[2] BCTC Report, Expected Energy Not Served (EENS) Study for Vancouver Island Transmission Project (Part I: Reliability Improvements due to VITR), December 8, 2005
[3] A. Ericsson (ABB), al et, “Murraylink, The Longest Underground HVDC Cable in the World”, the CIGRE paper No. B4-103, 2004
[4] Berdal Stromme Report: RAM Study Phase 2: NORNED KABEL HVDC Project, Aril 15, 1998 (This report can be found at the following webpage;
www.tennet.org/images/B2%20Berdal%20Stromme%20RAM%20study_tcm14-7508.pdf.)
15

Appendix A: Local Generating Unit Reliability Data
Generating unit Capacity (MW) FOR Repair time (hrs) ASH 27 0.004 15.35 JHT-1 21 * 0.0795 926.51 JHT-2 21 * 0.0008 2.31 JHT-3 21 * 0.003 36.32 JHT-4 21 * 0.0026 7.84 JHT-5 21 * 0.0096 28.70 JHT-6 21 * 0.0003 3.77 PUN 24 0.0010 13.74 LDR-1 24 0.0063 19.15 LDR-2 24 0.0026 6.60 SCA-1 32 0.0027 5.33 SCA-2 32 0.0218 28.26 UCO/Zeballos 15 0.004 15.35 JOR 170 0.0124 5.99 ICG 240 0.1065 ** 50.30 ** Total 714
Note: 1. The reliability data for the local hydro generating units are based on historical outage
records. These data are the same as those used in the following previous reports: [1] BC Hydro technical report, “Reliability Assessment of Vancouver Island Supply
2000/01”, Section 3 of “Vancouver Island Operation Plan 2000/01” produced by NOS (Network Operation Services), Grid Operation Division, BC Hydro, January 15, 2001
[2] BC Hydro technical, “Reliability Assessment for Vancouver Island Supply Options”, produced by NPP (Network Performance Planning), BC Hydro, December, 2001
[3] BC Hydro technical report, “Probabilistic & Economic Assessment of HVDC Short-term Investment Strategies”, produced by NOS (Network Operation Services), Grid Operation Division, BC Hydro, June 2002
2. * The 6 units at JHT are assumed to increase their capacity by 5 MW each by 2009/2010. 3. ** The failure data for the ICG are based on historical statistics from the NERC database for
combined cycle turbine units from 1977 to 2001. The raw data can be found at http://www.nerc.com/~filez/gar.html. The breakdown of forced and planned failure data is as follows:
Unit Capacity (MW) Unavailability Failure Frequency
(f/year) Repair time (hrs)
Forced Planned Forced Planned Forced Planned ICG 240 0.03238 0.07407 13.22 5.32 21.46 122.0
16

Appendix B: 500 kV Line and 230 kV Line Reliability Data
Line Capacity (MW) FOR Repair time (hrs) 500 kV line 1200 0.0293 137.81 500 kV line 1200 0.0293 137.81 230 kV line 600 0.0259 383.74 Second 230 kV line 600 0.0259 383.74 Phase shift transformer 600 0.000116 3.06 Common cause failure of two 500 kV lines
0.0004 2.98
Note: 1. The reliability data for the 500 kV lines (including the common cause failure data) are the
same as those used in the following previous reports:
[1] BC Hydro technical report, “Reliability Assessment of Vancouver Island Supply 2000/01”, Section 3 of “Vancouver Island Operation Plan 2000/01” produced by NOS (Network Operation Services), Grid Operation Division, BC Hydro, January 15, 2001
[2] BC Hydro technical, “Reliability Assessment for Vancouver Island Supply Options”, produced by NPP (Network Performance Planning), BC Hydro, December, 2001
[3] BC Hydro technical report, “Probabilistic & Economic Assessment of HVDC Short-term Investment Strategies”, produced by NOS (Network Operation Services), Grid Operation Division, BC Hydro, June 2002
2. The common cause failure of two 500 kV lines refers to their simultaneous outage due to a
common cause (lightning and terminal breaker failures). 3. The failure data of the phase shift transformer is based on historical failure records of the
PST on 2L112 in the HC Hydro system. There were only 5 forced failures with a total of outage duration of 15.28 hours in the past 15 years since it was in service in 1990. This translates into the unavailability (FOR) of 0.000116, a forced failure frequency of 0.3333 failures /year and the repair time of 3.06 hours/repair.
4. The reliability data for the overhead portion of the new 230 kV line is based on the average
of historical records of 230 kV lines in the BC Hydro system. The reliability data for the submarine portion is estimated as failure frequency=1/10 years and average repair time = 3 months. The total equivalent reliability data are calculated as follows (planned outage not considered):
Submarine portion:
f(cable)=1/10 years=0.1 f/year r(cable)=3 months =2190 hrs FOR(cable)=f(cable)∗r(cable)/8760 =0.025 Overhead portion- Line-related failure
17

f1=0.6945 /year/ 100 km*40 km=0.2778/year r1=16.85 hours Overhead portion- terminal-related failure f2=0.2136 r2=16.40 hours Overhead portion – total f(overhead)=0.2778+0.2136=0.4914 r(overhead) = Σfr/Σf = (0.2778*16.85+0.2136*16.40)/(0.4914)=16.65
FOR(overhead)=f(overhead)*r(overhead)/8760 = 0.00093 The total reliability data for the new 230 kV line is estimated as: FOR(total) = FOR(cable) +FOR(overhead) – FOR(cable)*FOR(overhead) = 0.025+0.00093-0.025*0.00093 =0.02591 f(total) = 0.1+0.4914=0.5914 r(total) = FOR(total)*8760/f(total) = 0.02591*8760/0.5914 = 383.74 hours
18

Appendix C: Load forecast and resources balance for 2005/06 to 2025/26
Vancouver Island Demand and Resource Balance (Based on the BC Hydro Dec 2005 load forecast)
VI Demand
VI Dep_Gen* 500 kV HVDC 1st cct 2nd cct Balance
MW MW MW MW MW MW MW 05/06 2318 698 1300 240 -80 06/07 2349 714 1300 240 -95 07/08 2370 714 1300 -355 08/09 2397 714 1300 600 21709/10 2425 744 1300 600 21910/11 2454 744 1300 600 190 11/12 2470 744 1300 600 174 12/13 2498 744 1300 600 146 13/14 2531 744 1300 600 113 14/15 2561 744 1300 600 83 15/16 2589 744 1300 600 55 16/17 2628 744 1300 600 16 17/18 2668 744 1300 600 600 576 18/19 2710 744 1300 600 600 534 19/20 2753 744 1300 600 600 491 20/21 2800 744 1300 600 600 444 21/22 2847 744 1300 600 600 397 22/23 2892 744 1300 600 600 352 23/24 2937 744 1300 600 600 307 24/25 2983 744 1300 600 600 260 25/26 3030 744 1300 600 600 214
* The VI dependable generations are assumed to be same as the previous (NITS2004 dependable resource).
19

0
500
1000
15002000
2500
3000
3500
05/06
07/08
09/10
11/12
13/14
15/16
17/18
19/20
21/22
23/24
25/26
Year
Cap
acity
(MW
)2nd VITR Circuit1st VITR CircuitHVDC500 kV CircuitsVI GenerationVI Total Demand
20

Appendix C: Summary specification of Sea Breeze HDVC project
21