Embed Size (px)
Citation preview

Research Article
Expanding the scope of CE reactor tossDNA-binding protein–ssDNA complexesas exemplified for a tool for directmeasurement of dissociation kinetics ofbiomolecular complexes
CE reactor (CER), which was developed as a tool for direct measurement of the disso-
ciation kinetics of metal complexes, was successfully applied to the complexes of
Escherichia coli ssDNA-binding protein (SSB) with ssDNA. The basic concept of CER is
the application of CE separation process as a dissociation kinetic reactor for the complex,
and the observation of the on-capillary dissociation reaction profile of the complex as the
decrease of the peak height of the complex with increase of the migration time. The peak
height of [SSB-ssDNA] decreases as the migration time increases since the degree of the
decrease of [SSB-ssDNA] through the on-capillary dissociation reaction is proportional to
the degree of the decrease of the peak height of [SSB-ssDNA]. The dissociation degree-
time profiles for the complexes are quantitatively described by analyzing a set of
electropherograms with different migration times. Dissociation rate constants of
[SSB-ssDNA] consisting of 20-mer, 25-mer and 31-mer ssDNA were directly determined
to be 3.99� 10�4, 4.82� 10�4 and 1.50� 10�3/s, respectively. CER is a concise and
effective tool for dissociation kinetic analysis of biomolecular complexes.
Keywords:
Biomolecular complex / CE / Dissociation kinetic analysisDOI 10.1002/elps.200900110
1 Introduction
There is no question as to the importance of biomolecular
interaction analysis, which is one of the molecular biological
approaches in the understanding of the life phenomenon.
As for the research trends in biomolecular interaction
analysis, structural or thermodynamic approaches are the
mainstream. Consideration about the dynamics of biomo-
lecular complexes is, however, indispensable in under-
standing their biological meaning because biomolecules are
constantly in flux; the temporary interactions between
biomolecules or their complexes with noncovalent bonding
play important roles in the vital activity in the living cells [1].
In addition, kinetics provide intrinsic information about
reaction mechanisms [2]. There are not a lot of works on
kinetics of biomolecular complex in spite of its widely
recognized importance. This is partly due to the lack of the
convenient methodologies for investigating the kinetics of
the biomolecular complexes. Basically, direct measurement
of their rate constants is technically difficult because of
extreme difficulty in creating a reaction system, where the
reverse-reaction to a reaction of interest does not take place,
in homogeneous solution. In many cases, one, therefore,
could not help measuring them indirectly after repeating
many complex operations in equilibrium state [3, 4]. On the
other hand, the technique using surface plasmon resonance
(SPR) [5] enabled the direct analysis of biomolecular
interaction. It, however, needs immobilization of the target
molecules on the gold thin film surface of the flow-cell with
tangled procedures. The deactivation of the target molecules
arising from immobilization is also concerned. In addition,
the transport of the analyte between the immobilized
surface- and the liquid-phase complicates the handling of
the kinetic data.
Recently, a review was published, where CE is a
promising technique for the investigation of molecular
interactions especially in obtaining kinetic information [6].
We also had exemplified the advantages in CE for kinetic
Toru TakahashiKei-ichirou OhtsukaYoriyuki TomiyaNobuhiko IkiHitoshi Hoshino
Division of EnvironmentallyBenign Systems, GraduateSchool of Environmental Studies,Tohoku University, Sendai,Japan
Received February 23, 2009Revised April 23, 2009Accepted May 12, 2009
Abbreviations: CER, CE reactor; lCER, microchip CEreactor; SPR, surface plasmon resonance; SSB, SSB-binding protein; TPP1, tetraphenylphosphonium; TPPCl,
tetraphenylphosphonium chloride
Correspondence: Dr. Toru Takahashi, Division of Environmen-tally Benign Systems, Graduate School of EnvironmentalStudies, Tohoku University, 20 Aoba, Aramaki, Aoba-ku, Sendai980-8579, JapanE-mail: [email protected]: 181-22-795-7223
& 2009 WILEY-VCH Verlag GmbH & Co. KGaA, Weinheim www.electrophoresis-journal.com
Electrophoresis 2009, 30, 3079–3085 3079

studies by a report in which a unique approach for the
dissociation kinetic measurement of metal complexes viaCE reactor (CER) [7] was described well before the review
was issued. Chemical basis of CER is just based on the fact
observing the on-capillary dissociation reaction profile of
the metal complexes in the pre-capillary derivatization
CE employing an electrophoretic buffer solution without
chelating reagent [7, 8]. In above CE system, metal
complexes, which migrate in their isolated bands along a
capillary from those of free ligand and metal ions, are
exposed to an overwhelming force causing dissociation by
CE resolution because of the absence of the free ligand
in the electrophoretic buffer solution. One can obtain the
dissociation rate constant (kd) of the metal complex by
analyzing the first-order decay dissociation degree-time
profile directly, readily and accurately. An approach by
CE-based dissociation kinetic analysis methods [7–10]
is the sole one, which enables the direct measurement
of kd of metal complex in homogeneous solution because
CE is a one-of-a-kind method which can create the driving
force for the dissociation reaction of metal complex in
homogeneous solution. Another advantage of CER is that
the estimation of the dissociation reaction profile of the
complex is accurate because of employing the degree of
decrease of the peak height of the complex with increase
of the migration time for the estimation of the degree of
the decomposition of the complex. The estimation of the
degree of the decomposition of the complex by the ratio of
the peak area [11] or the direct fit to the asymmetrical part
of electropherogram [12] may give misguided evaluation
of kd since the boundary between the zone of the complex
and that of the decomposed products is not clear in the
capillary.
It is expected that CER theoretically can be applied to
the dissociation kinetic analysis of complexes in the broad
sense, which are the aggregates of the molecules that are not
bound with covalent bond. In this study, we tried to enhance
the concept of CER to biomolecular complexes. Dissociation
reaction of a protein–DNA complex was chosen as a model
system for kinetic analysis by CER. In the replication of
DNA, ssDNA-binding protein (SSB) stabilizes ssDNA
through binding with the region consisting of about 30
origonucreotides on the template ssDNA chain [13]. As SSB
repeats binding and dissociation with ssDNA according to
the progress of the polymerization of the replicated DNA
chain, dissociation kinetics of the complex of SSB with
ssDNA ([SSB-ssDNA]) has biological importance. In this
study, it has been successfully demonstrated that CE serves
as a chemical reactor for the measurements of dissociation
kinetics of the dissociation kinetics of [SSB-ssDNA]
consisting of Escherichia coli (E. Coli) and ssDNA of 20-mer,
25-mer, and 31-mer. Also such attractive features of CE as
the plug-flow profile, no interactions with a secondary
phase, and the parallel scheme of dissociation and separa-
tion allow the simple treatment of data in the CER. CER is a
concise and effective tool for dissociation kinetic analysis of
not only metal complexes but also biomolecular complexes.
2 Materials and methods
2.1 Reagent and apparatus
An E. coli origin SSB (72 kDa) was purchased from Promega
(Madison, WI, USA). Synthesized ssDNA, 50-cctgccacgctc-
cgctggtt-30 (s20), 50-cctgccacgctccgctggttggtgt-30 (s25) and
50-cctgccacgctccgctggttggtgtggttgg-30 (s31), were purchased
from Nippon EGT (Toyama, Japan). A transferrin
(Tf, 79 kDa) was purchased from Sigma (St. Louis, MO,
USA). A tetraphenylphosphonium chloride (TPPCl) was
purchased from TCI (Tokyo, Japan). All other reagents used
were of guaranteed reagent grade. A laboratory made CE
setup was consisted with a JASCO (Tokyo, Japan) CE-2070
UV-VIS spectrophotometric detector, a Matsusada Precision
(Kusatsu, Japan) HPCZE-30 PO.25 LD high-voltage power
supply, and a Shimadzu (Kyoto, Japan) C-R5A CHROMA-
TOPAC recorder. A GL Science (Tokyo, Japan) fused silica
capillary (50 mm id, total length; 54.5 cm) was used.
Spectrophotometric detection was performed at 200 nm on
the detection window setup from the cathodic side of the
capillary to 12.5 cm. The temperature of the system was kept
at 303 K in a safety box with an interlock system.
2.2 Procedure for dissociation kinetic analysis of
[SSB-ssDNA] by CER
Electrophoresis was performed by constant voltage opera-
tion mode. Before every run, the capillary was conditioned
with 0.1 M NaOH, followed by doubly distilled water and
electrophoretic buffer solution. An electrophoretic buffer
solution containing 15 mM phosphate buffer (pH 7.2) was
used. The sample solution containing 0.12 mg/mL SSB,
4.55 mg/mL ssDNA, 10 mM phosphate buffer (pH 7.2) and
0.25 mM TPPCl is introduced hydrostatically by elevating
the sample at 5 cm for 10 s at anodic side of the capillary.
Several CE experiments with a variety of migration times
while controlling the applied voltage from 5 to 20 kV were
performed. Then, the migration times and the peak height
of [SSB-ssDNA] and tetraphenylphosphonium (TPP1) for
each of electropherograms were recorded. The same
procedure is repeated for the sample containing 0.18
mg/mL Tf, 10 mM phosphate buffer (pH 7.2) and
0.25 mM TPPCl.
3 Results and discussion
3.1 CE separation and the composition of [SSB-
ssDNA]
CE separation of SSB, ssDNA and [SSB-ssDNA] was
examined before CER experiments because dissociation
kinetic analysis of [SSB-ssDNA] with CER would not be
approved if there were overlapping of the peak of SSB
or ssDNA with [SSB-ssDNA]. A single peak except for that of
Electrophoresis 2009, 30, 3079–30853080 T. Takahashi et al.
& 2009 WILEY-VCH Verlag GmbH & Co. KGaA, Weinheim www.electrophoresis-journal.com

TPP1 was observed respectively in the electropherogram of
the sample containing only SSB or ssDNA (s31) as shown
in Figs. 1A and C. In this work, because of using an
electrophoretic buffer solution with no addition of SSB or
ssDNA (s31) that composes the complex, the peak of the
complex that is kinetically labile is not observed [8].
However, a new peak of [SSB-ssDNA] completely separated
from that of SSB was observed in the electropherogram of
the sample containing both SSB and ssDNA (s31) as shown
in Fig. 1B. This indicates that [SSB-ssDNA] is kinetically
stable in the time scale of CE separation. In other words,
dissociation reaction of [SSB-ssDNA] is slow enough to
measure its dissociation rate constant by CER. Actually, a
kind of asymmetrical peak shape, i.e. fronting shape, of the
complex peak shows that the complex has dissociated
partially in the CE separation process. The complex
continuously dissociate while migrating in the CE separa-
tion process employing the electrophoretic buffer solution
containing no constituents of the complex. The products of
the dissociation reaction of the complex, i.e. free SSB and
free ssDNA, were immediately separated from the complex
since their electrophoretic mobilities were different. Then,
the products appear as the fronting or the tailing region of
the complex peak. In this case, free SSB particularly
appeared as the fronting part of the complex peak because
of larger apparent electrophoretic mobility of free SSB than
that of the complex.
The composition of [SSB-ssDNA] was also estimated by
CE experiments. It is well known that SSB can bind ssDNA
in various binding modes, referred as (SSB)n, which differ in
the number of nucleotides (n) occluded per bound one SSB,
and that there are two major binding modes, (SSB)35 and
(SSB)65, occlude n 5 3573 and n 5 6573 nucleotides per
SSB [14, 15]. In addition, these two modes quite depend on
the salt concentration [15]. A low salt concentration mode,
(SSB)35, dominates in the present experimental conditions.
Formation of the 1:1 complex is predicted in consideration
of the number of binding positions of SSB at (SSB)35. With
addition of excess SSB to ssDNA (s31), there is no peak
other than free SSB and [SSB-ssDNA] as shown in Fig. 1B.
This strongly suggests that the SSB-ssDNA complexes with
lower molar ratio of ssDNA to SSB than 1 did not form, and
that SSB form the 1:1 complex with ssDNA with addition of
excess SSB to ssDNA. Contrastingly, as shown in the elec-
tropherograms in Fig. 2, with addition of excess ssDNA
(s31) to SSB in the sample, some new broad peaks (pointed
by arrows in the electropherograms) came out behind the
[SSB-ssDNA] peak. The peak height of [SSB-ssDNA] in
Fig. 2A was much smaller than that of in Fig. 1B, in addi-
tion [SSB-ssDNA] peak disappeared in Figs. 2B
and C. This shows the complexes with higher molar ratio of
ssDNA to SSB than 1 dominates with addition of excess
ssDNA to SSB. The migration times of these complexes are
larger than that of 1:1 complex since they have larger
negative charge. Hence, these new peaks are corresponding
to those of these complexes. The results of experiments
do not contradict assumption that the composition of
[SSB-ssDNA] is 1:1. In this study, to avoid formation of
SSB-ssDNA complexes with higher molar ratio, which make
the kinetic analysis of [SSB-ssDNA] complicated, excess SSB
to ssDNA was added in the sample solution.
3.2 Dissociation kinetic analysis of [SSB–ssDNA] by
CER
Figure 3 shows the series of electropherograms of [SSB-
ssDNA] of 20-mer, 25-mer and 31-mer ssDNA with different
0
Migration time / min
TPP+SSB
ssDNATPP+
[SSB-ssDNA]
SSBTPP+
A
B
C
4 8 12
Figure 1. Typical electropherograms of SSB (A), [SSB-ssDNA](B), and ssDNA (C). Sample: 0.12 mg/ml SSB (a), 0.12 mg/ml SSBand 4.55 mg/ml ssDNA (b), and 4.55 mg/ml ssDNA (c). All thesamples contain 10 mM phosphate buffer (pH 7.2) and 0.25 mMTPPCl. Capillary: L 5 42.5 cm, l 5 12.5 cm. Applied voltage: 15 kV.Electrophoretic buffer: 15 mM phosphate (pH 7.2).
0Migration time / min
ssDNA
TPP
TPP
TPP
[SSB-ssDNA]
ssDNA
A
B
C
4 8 12
Figure 2. Typical electropherograms of the complexes of SSBwith ssDNA with different compositions. Sample: 0.12 mg/mlSSB and 9.1 mg/ml ssDNA (A), 0.12 mg/ml SSB and 18.2 mg/mlssDNA (B), 0.12 mg/ml SSB and 36.4 mg/ml ssDNA (C). Otherconditions were the same as Fig. 1.
Electrophoresis 2009, 30, 3079–3085 CE and CEC 3081
& 2009 WILEY-VCH Verlag GmbH & Co. KGaA, Weinheim www.electrophoresis-journal.com
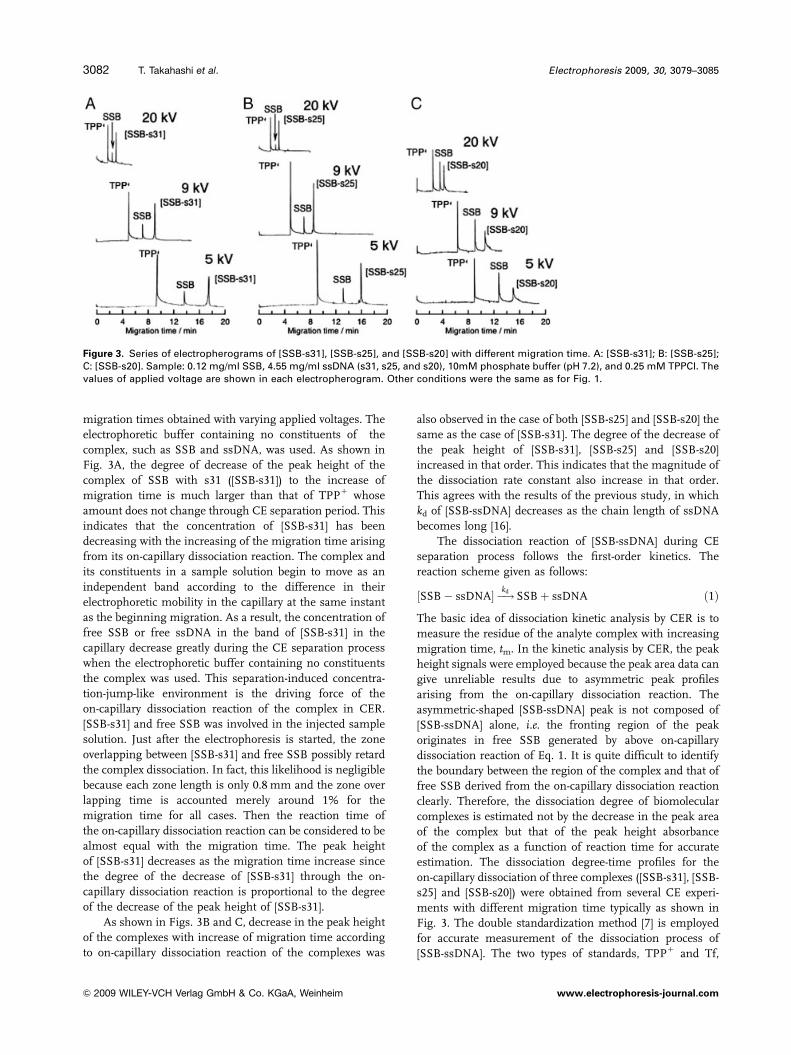
migration times obtained with varying applied voltages. The
electrophoretic buffer containing no constituents of the
complex, such as SSB and ssDNA, was used. As shown in
Fig. 3A, the degree of decrease of the peak height of the
complex of SSB with s31 ([SSB-s31]) to the increase of
migration time is much larger than that of TPP1 whose
amount does not change through CE separation period. This
indicates that the concentration of [SSB-s31] has been
decreasing with the increasing of the migration time arising
from its on-capillary dissociation reaction. The complex and
its constituents in a sample solution begin to move as an
independent band according to the difference in their
electrophoretic mobility in the capillary at the same instant
as the beginning migration. As a result, the concentration of
free SSB or free ssDNA in the band of [SSB-s31] in the
capillary decrease greatly during the CE separation process
when the electrophoretic buffer containing no constituents
the complex was used. This separation-induced concentra-
tion-jump-like environment is the driving force of the
on-capillary dissociation reaction of the complex in CER.
[SSB-s31] and free SSB was involved in the injected sample
solution. Just after the electrophoresis is started, the zone
overlapping between [SSB-s31] and free SSB possibly retard
the complex dissociation. In fact, this likelihood is negligible
because each zone length is only 0.8 mm and the zone over
lapping time is accounted merely around 1% for the
migration time for all cases. Then the reaction time of
the on-capillary dissociation reaction can be considered to be
almost equal with the migration time. The peak height
of [SSB-s31] decreases as the migration time increase since
the degree of the decrease of [SSB-s31] through the on-
capillary dissociation reaction is proportional to the degree
of the decrease of the peak height of [SSB-s31].
As shown in Figs. 3B and C, decrease in the peak height
of the complexes with increase of migration time according
to on-capillary dissociation reaction of the complexes was
also observed in the case of both [SSB-s25] and [SSB-s20] the
same as the case of [SSB-s31]. The degree of the decrease of
the peak height of [SSB-s31], [SSB-s25] and [SSB-s20]
increased in that order. This indicates that the magnitude of
the dissociation rate constant also increase in that order.
This agrees with the results of the previous study, in which
kd of [SSB-ssDNA] decreases as the chain length of ssDNA
becomes long [16].
The dissociation reaction of [SSB-ssDNA] during CE
separation process follows the first-order kinetics. The
reaction scheme given as follows:
½SSB� ssDNA� �!kdSSBþ ssDNA ð1Þ
The basic idea of dissociation kinetic analysis by CER is to
measure the residue of the analyte complex with increasing
migration time, tm. In the kinetic analysis by CER, the peak
height signals were employed because the peak area data can
give unreliable results due to asymmetric peak profiles
arising from the on-capillary dissociation reaction. The
asymmetric-shaped [SSB-ssDNA] peak is not composed of
[SSB-ssDNA] alone, i.e. the fronting region of the peak
originates in free SSB generated by above on-capillary
dissociation reaction of Eq. 1. It is quite difficult to identify
the boundary between the region of the complex and that of
free SSB derived from the on-capillary dissociation reaction
clearly. Therefore, the dissociation degree of biomolecular
complexes is estimated not by the decrease in the peak area
of the complex but that of the peak height absorbance
of the complex as a function of reaction time for accurate
estimation. The dissociation degree-time profiles for the
on-capillary dissociation of three complexes ([SSB-s31], [SSB-
s25] and [SSB-s20]) were obtained from several CE experi-
ments with different migration time typically as shown in
Fig. 3. The double standardization method [7] is employed
for accurate measurement of the dissociation process of
[SSB-ssDNA]. The two types of standards, TPP1 and Tf,
Figure 3. Series of electropherograms of [SSB-s31], [SSB-s25], and [SSB-s20] with different migration time. A: [SSB-s31]; B: [SSB-s25];C: [SSB-s20]. Sample: 0.12 mg/ml SSB, 4.55 mg/ml ssDNA (s31, s25, and s20), 10mM phosphate buffer (pH 7.2), and 0.25 mM TPPCl. Thevalues of applied voltage are shown in each electropherogram. Other conditions were the same as for Fig. 1.
Electrophoresis 2009, 30, 3079–30853082 T. Takahashi et al.
& 2009 WILEY-VCH Verlag GmbH & Co. KGaA, Weinheim www.electrophoresis-journal.com

employed are both kinetically inert, i.e. their concentration
does not change through CE experiment. Typically as shown
in Fig. 3, the execution of several CE experimental runs is
necessary to obtain the series of electropherograms with
different migration times. Then TPP1 is added as an
internal standard for correcting the difference in injection
volume of each experimental run [7]. On the other hand, an
external standard, Tf, is used for an accurate estimation of
the remaining concentration of [SSB-ssDNA] that survived
during migration in the capillary, because the decrease in
the peak height of the complex arises from both the on-
capillary dissociation reaction and the zone broadening
caused by the diffusion. If the decrease in the peak height by
zone broadening is not corrected, the decrease in the peak
height by the on-capillary dissociation reaction is over-
estimated. Hence, it is necessary to correct a decrease in the
peak height by the zone broadening caused by the diffusion
of the solute. The degree of the zone broadening by diffusion
depends on the migration time and the molecular size of the
solute [7, 17]. Tf was, therefore, chosen as the external
standard, which has close migration time and molecular
weight to those of [SSB-ssDNA]. Typical electropherograms
of Tf varying with the applied voltage were shown in Fig. 4.
The electropherograms of Tf were acquired in the same CE
condition as the electropherograms of the complexes that
paired with each of them. The normalized peak height
signals of [SSB-ssDNA] and TPP1 with that of Tf in each
electropherograms are HSSB-ssDNA and HTf, respectively. In
this case, the residual ratio of [SSB-ssDNA] can be estimated
using HSSB-ssDNA and HTf,
½SSB� ssDNA�=½SSB� ssDNA�0 ¼ A HSSB�ssDNA=HTf
ð2Þ
where, [SSB-ssDNA]0 is the initial concentration of [SSB-
ssDNA] and A is the proportional constant [9]. As the
dissociation reaction follows the first-order kinetics, the rate
law is given by,
d½SSB� ssDNA�=dt ¼ kd½SSB� ssDNA� ð3Þ
Integrating Eq. 3 from t 5 0 to tm yields Eq. 4, and then
Eq. 5.
lnð½SSB� ssDNA�=½SSB� ssDNA�0Þ ¼ �kd tm ð4Þ
½SSB� ssDNA�=½SSB� ssDNA�0 ¼ expð�kd tmÞ ð5Þ
Eq. 6 is given by introducing Eq. 2 into Eq. 5.
HSSB�ssDNA=HTf ¼ a expð�kd tmÞ ð6Þ
Where, a is 1/A. Here we can obtain kd by fitting Eq. 6 using
the data HSSB-ssDNA/HTf at various tms. Thus, kd was
obtained with analyzing the dissociation degree-time profile
of [SSB-ssDNA] as the plot of the normalized peak height
signals of [SSB-ssDNA] with that of Tf (HSSB-ssDNA/HTf)
against the migration time. Simple first-order decay
profiles for [SSB-s31], [SSB-s25] and [SSB-s20] are observed
as shown in Fig. 5, and plots are fitted well to Eq. 6. The
dissociation rate constants for [SSB-s31], [SSB-s25] and
[SSB-s20] are determined to be 3.99� 10�4, 4.82� 10�4
and 1.50� 10�3/s, respectively.
The kd values found and those obtained by various
methods are summarized in Table 1 [11, 16, 18]. In
comparison with the kd values of the longer (70) [16] and
shorter (15) [11] chain length of their pair ssDNA, kd values
found were located in the middle of them. The kd values
found also decrease with increase of the chain length of
ssDNA. It is thus reasonable because kd decreases as the
chain length of it is pair ssDNA becomes long [16].
Although the values of kd of the complexes of 8, 16, and 35
bases ssDNA were also reported with stopped-flow method
and temperature-jump method [16], they do not agree with
those obtained by CER, CE and SPR as summarized in
Table 1. ‘‘Small’’ kd value of the order of 10�4/s obtained
by CER experiments show that the dissociation reaction of
[SSB-ssDNA] is a relatively slow process. This is also
supported by the results obtained by other methods [12, 16].
Contrastingly the formation reaction of the complex would
be a fast process judging from ‘‘large’’ values of the
formation reaction rate constant, kf [16, 18]. In the conven-
tional methods including stopped-flow method and
temperature-jump method, both the formation and disso-
ciation processes occur simultaneously since the experi-
ments for kinetic measurement are performed in the closed
batch system. Then, kf and kd are obtained simultaneously.
Though the simultaneous determination of kf and kd is
theoretically possible, it is difficult from a practical stand-
point to evaluate both kf and kd accurately from the experi-
mental data. The error in the evaluation of kd would be very
TfTPP+
Tf
Tf 20 kV
9 kV
5 kV
0Migration time / min
TPP+
TPP+
4 8 12 16 20
Figure 4. A series of electropherograms of Tf with differentmigration time. Sample: 0.18 mg/ml Tf, 10 mM phosphate buffer(pH 7.2), and 0.027 mM TPP1. The values of applied voltage areshown in each electropherogram. Other conditions were thesame as Fig. 1.
Electrophoresis 2009, 30, 3079–3085 CE and CEC 3083
& 2009 WILEY-VCH Verlag GmbH & Co. KGaA, Weinheim www.electrophoresis-journal.com

large since the value of kd is too small compared with that of
kf. In fact, kd of the complex with ssDNA of 35 bases was not
obtained by stopped-flow method and temperature-jump
method [16]. On the other hand, in the case of the deter-
mination of kd by the proposed method, CE [11, 12] and SPR
[18], only the dissociation process of the complex is observed
and the formation reaction does not occur since these
methods are based on separation. Abovementioned separa-
tion-induced concentration-jump-like environment, in
which the concentration of free SSB or free ssDNA around
[SSB-ssDNA] greatly decreases during separation process, is
the driving force of the dissociation reaction of the complex
in those systems, and the reverse reaction, i.e. formation
reaction, does not occur because the products of the disso-
ciation reaction of the complex (free SSB and free ssDNA)
are separated immediately. Comparing with conventional
‘‘indirect’’ measurement methods, an accurate measure-
ment of kd becomes possible by observing the dissociation
reaction of the complex directly in these separation-based
‘‘direct’’ measurement methods. The high separation ability
of CE gives the clear-cut concentration-jump-like property
suitable for direct observation of the dissociation process of
the complex to the CE-based kinetic measurement methods
but the sharp concentration-jump-like property is not
obtained in the SPR-based method [5], because diffusion
from the solid phase to the mobile phase by the concen-
tration gradient is a driving force of the separation. The
clear-cut resolution due to CE separation enables more
accurate kd measurement with CE-based kinetic analysis
methods than that of SPR method. In addition, the asym-
metric, i.e. fronting or tailingshaped, target complex peak
resulting from on-capillary dissociation reaction of the
complex is observed in CER [7] and other CE-based kinetic
analysis method similar to CER [9, 11, 12]. In the estimation
of kd from the ratio of the peak area [11] or the fitting the
asymmetrical part of electropherogram [12], the reaction
profile might not be accurately described, because the
boundary between the region of the complex and that of the
decomposition products is not clear-cut, and the region of
complex and that of the decomposition product in the peak
is not clearly distinguished. The kinetic analysis using the
peak height absorbance of the complex therefore provides
the correct description for the dissociation degree-time
profile of the complexes [7, 9], if the mutual separation
between the complex and the decomposed products is
achieved. CER is a method that can measure kd most
accurately among the existence methods for the measure-
ment of kd.
kd of the chain length of its pair ssDNA around 30 is
not estimated correctly except for our present study. SSB
binds and stabilizes template ssDNA in cooperation with
many other SSB molecules, and one SSB molecule binds
ssDNA through about 30 nucleotides [14]. SSB coming
free from template ssDNA chain binds with ssDNA again.
This cycle is repeated until the end of the DNA replication.
The half-life of [SSB-ssDNA] is calculated to be about
10 min from above kd. The rate of the replication of DNA is
reported to be about 100–1000 base pair per second [19].
The rate of the dissociation reaction of [SSB-ssDNA] is
much smaller than that of the reproduction of DNA. It is
therefore found that template ssDNA has been stabilized
by SSB as [SSB-ssDNA] during the period of the replication
of DNA.
4 Concluding remarks
In this study, the successful application of CER to the
determination of the dissociation kinetics of [SSB-ssDNA]
has been demonstrated. The dissociation rate constant of
[SSB-ssDNA] in a homogeneous solution can be measured
directly and accurately by CER without any troublesome
procedures such as immobilization and derivatization. If the
proper internal and external standard materials are avail-
Table 1. Dissociation rate constants of [SSB-ssDNA] obtained
by various methods
kd/s Chain length of ssDNA Method Reference
1.3� 10�5 70 SPR [18]
3.99� 10�4 31 CER This work
4.82� 10�4 25 CER This work
1.50� 10�3 20 CER This work
3.3� 10�2 15 CE [11]
o 1 30–40 Stopped-flow [16]
40 16 Temperature jump [16]
1700 8 Temperature jump [16]
0
0.2
0.4
0.6
0.8
1
0
Migration time / s
[SSB-s31]
[SSB-s25]
[SSB-s20]
200 400 600 800 1000
H [S
SB
-ssD
NA
] / H
Tf
Figure 5. Reaction profiles of [SSB-s31], [SSB-s25], and[SSBs20] obtained by CER. Solid lines show the approximationcurve for the first order dissociation reaction profile of eachcomplex by Eq. 6.
Electrophoresis 2009, 30, 3079–30853084 T. Takahashi et al.
& 2009 WILEY-VCH Verlag GmbH & Co. KGaA, Weinheim www.electrophoresis-journal.com

able, CER can actually extend its applications to a great
number of biomolecular complexes. CER can monitor
relatively slow reaction with kd in the range from 10�4 to
10�3/s. On the other hand, we had demonstrated the direct
monitoring of the dissociation reaction profile of a
polyaminocarboxylate complex with lanthanide within some
seconds to some tens of seconds and its dissociation kinetic
analysis by microchip CE reactor (mCER) [9]. If mCER is
applicable to the determination of the dissociation kinetics
of biomolecular complexes, we can determine kd of
biomolecular complexes in a wide range underlying from
10�4 to 10�1/s using CER and mCER. In CER, one must
repeat several CE runs with a variety of migration times to
obtain a set of data necessary for kinetic analysis of the
complex. But, one can acquire the data for kinetic analysis
during a single run in mCER system since UV absorption
linear imaging detection employed in mCER allows the
acquisition of a kind of continuous time-resolved electro-
pherograms [9]. CER and mCER will bring good knowledge
for shedding light on the biological functions of such
biomolecular complexes.
The authors acknowledge Dr. Akira Tsuyoshi for his usefuldiscussions and suggestions. This work was partly supported by agrant-in-aid for Scientific Research (20550070) from the JapanSociety for the Promotion of Science (JSPS).
The authors have declared no conflict of interest.
5 References
[1] Stryer, L., in: Biochemsiry, 3rd Edn., W. H. Freeman andCompany, New York 1988.
[2] Hammes, G. G., in: Thermodynamics and Kinetics for theBiological Sciences, Wiley, New York 2000, Chapter 4.
[3] Johnson, K. A., in: Johnson, K. A. (Ed.), Kinetic Analysisof Macromolecules, Oxford University Press, Oxford2003, Chapter 1.
[4] Smith, T. W., Skubitz, K. M., Biochemistry 1975, 14,1496–1502.
[5] Karlsson, R., Michaelsson, A., Mattsson, L. J., Immunol.Methods 1991, 145, 229–240.
[6] Newman, C. D., Collins, G. E., Electrophoresis 2008, 29,44–55.
[7] Iki, N., Hoshino, H., Yotsuyanagi, T., Anal. Chem. 2000,72, 4812–4820.
[8] Takahashi, T., Takehara, Y., Hoshino, H., Bull. Chem.Soc. Jpn. 2007, 80, 910–915.
[9] Takahashi, T., Ohtsuka, K., Iki, N., Hoshino, H., Analyst2005, 130, 1337–1339.
[10] Wada, A., Harada, M., Okada, T., Anal. Chem. 2006, 78,4709–4712.
[11] Berezovski, M., Krylov, S. N., J. Am. Chem. Soc. 2002,124, 13674–13675.
[12] Krylov, S. N., Berezovski, M., Analyst 2003, 124, 571–575.
[13] Watson, J. D., Hopkins, N. H., Roberts, J. W., Steitz, J. A.,Weiner, A. M., in: Molecular Biology of the Gene, 4th Edn.,Addison Wesley Longman, Boston 1987, Chapter 10.
[14] Raghunathan, S., Kozlov, A. G., Lohman, T. M., Waks-man, G., Nature Struct. Biol. 2000, 7, 648–652.
[15] Lohman, T. M., Overman, L. B., J. Biol. Chem. 1985, 260,3594–3603.
[16] Krauss, G., Sindermann, H., Schomburg, U., Maass, G.,Biochemistry 1981, 20, 5346–5352.
[17] Jorgenson, J. W., Lukacs, K. D., Anal. Chem. 1981, 53,1298–1302.
[18] Fisher, R. J., Fivash, M., Casas-Finet, J., Bladen, S.,McNitt, K. L., Methods 1994, 6, 121–133.
[19] Lodish, H., Berk, A., Zipursky, S. L., Matsudaira, P.,Baltimore, D., Darnell, J., in: Molecular Cell Biology, 4thEdn., W. H. Freeman and Company, New York 2000,Chapter 12.
Electrophoresis 2009, 30, 3079–3085 CE and CEC 3085
& 2009 WILEY-VCH Verlag GmbH & Co. KGaA, Weinheim www.electrophoresis-journal.com


![Jihad Defined and Exemplified pUpdated]](https://img.dokumen.tips/doc/110x75/577ccff61a28ab9e789107bc/jihad-defined-and-exemplified-pupdated.jpg)


