Embed Size (px)
Citation preview

OPENING PATHWAYS TO EMPOWERMENT
E X P A N D I N G T H E B R I D G E :
2 0 1 4 I M P A C T R E P O R T

We believe these three capitals are interlinked, self-reinforcing, and critical to long-term change:CAPITAL AT FRIENDSHIP BRIDGE
Alleviating poverty is not simple. Our clients live in highly volatile environments that inherently work to disempower them, and their individual lives and objectives are diverse. Empowering our clients to find their own solutions to poverty requires increasing their capacity to make changes in their lives, which means our approach must be multifaceted and responsive. Successfully empowering clients requires more than providing loans and access to financial capital.
We’ve known this for years. The reality of the poor is characterized not only by a lack of material resources, but also a high degree of vulnerability and marginalization. That’s why in addition to financial capital, we have focused on enhancing clients’ collection of social and human capital through our Microcredit Plus program. We’ve found that clients who utilize our Plus services are 4% better off in our poverty index, leading us to believe that if we track the use of Plus services it will become a predictor of decreased poverty levels. >>>
Financial/Physical Capital Human Capital Social Capitalrelationships and networks
skills and capabilitiescredit, savings, and physical assets
1FRIENDSHIP BRIDGE 2014 IMPACT REPORT
2014 was a year of learning and expanding on our journey to empower impoverished Guatemalan women to create a better future for themselves, their children, and their communities through microfinance and education.

To enhance Social and Human Capital, our Plus services have always been delivered via a group lending model and include participatory Non-Formal Education sessions at monthly repayment meetings. Our selection of Plus services forms the foundation of our Client Continuum strategy because these services are designed to prepare our clients to move forward on their path toward empowerment. In this report you will see a variety of results from our Microcredit Plus program, some suggestive, some positive, and some from which to learn. We are especially encouraged by the results of two new Plus services—one that had positive effects on clients’ health through the purchase of clean burning stoves and one that allowed clients’ children to continue their education by assisting with expenses related to school enrollment. Overall, our results show Microcredit Plus is increasing the economic stability and agency of our clients. With increased agency, our clients know what they want, believe they can achieve it, and are able to take action to realize it. In this report you will read about outcomes related to our clients’ increased capacity over financial decisions, for economic
change, and to aspire for a better future. One way clients are exercising their agency is through taking on leadership roles —90 percent of our clients report having taken on a leadership role since becoming a Friendship Bridge client. These positive outcomes from 2014 are shaping our strategy as we move forward with our Social Performance Management goals. Our results are leading us to understand poverty with a wider lens —one that encompasses more than just financial outcomes. Our findings from 2014 have shaped pilot programs we will be evaluating in 2015, including Salud para la Vida, a women’s preventative health program, and our Artisan Market Access program, both of which were identified as strategic initiatives because they address needs our clients said are important to help them move out of poverty. We are excited to see positive results as clients utilize our Plus services and participate in our program through multiple loan cycles. As we learn from our findings year-to-year we will be increasingly able to expand the bridge and open pathways of empowerment to even more women.
29,669Clients served throughout the year
$313Average loan for new clients
$483Average loan for returning clients
30,555Number of surveys analyzed
201,349Hours of Non-Formal Education
$6.43MLoan portfolio value
2014 Institutional Stats
3FRIENDSHIP BRIDGE 2014 IMPACT REPORT

In This ReportOur ClientsOur Client Continuum StrategyOur Plus ServicesOur ImpactOur Management
48
11 15 23
CLIENT ASPIRATIONS
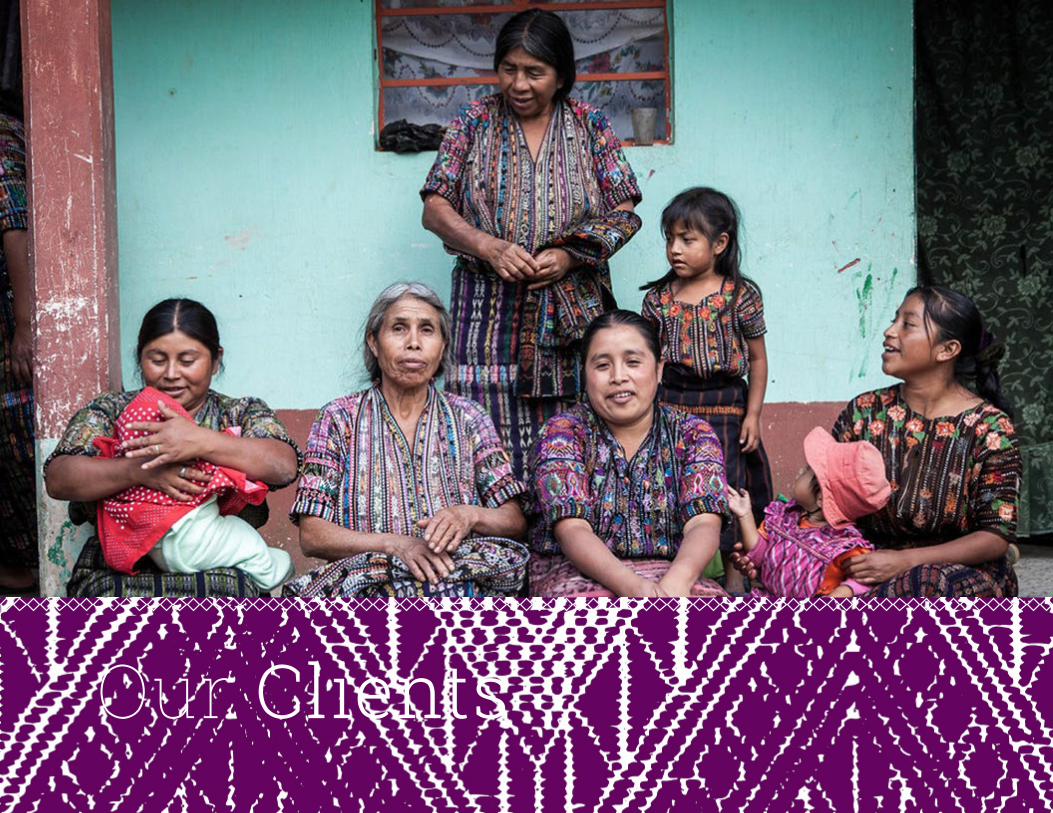
Our Clients

To understand their realities, we subdivide clients according to the three poverty levels that correspond to national poverty rates, which we measure using the Progress out of Poverty Index (PPI).
POOR EXTREMELY VULNERABLE
VULNERABLE
In 2014, Friendship Bridge provided microloans to 29,669 Guatemalan women.
Roughly a third, or 10,667, of those clients were new to Friendship Bridge. Our clients live in 12 of the 22 departments of Guatemala, in regions that are predominantly indigenous, impoverished, and rural (see map on page 7). As indigenous women, they are among the most marginalized populations in Guatemala and suffer frequent discrimination because of their gender, economic status, and ethnicity. As a result, our clients lack access to healthcare and education and do not have significant representation in the government. Additionally, like most indigenous people in Guatemala, many of our clients do not speak Spanish, the country’s official language. Instead, they speak one of the country’s 24 indigenous languages, which functions as an invisible barrier of communication.
Through poverty targeting, we ensure that we provide services to the women who need them most. We target clients who live in households that earn between $1.11 and $4.49 a day, and 87% of our clients, as measured by PPI®, fall within this range.1 On average, our clients are 38-years-old, largely illiterate, and have four children. They manage various types of businesses, mostly as artisans, farmers, and vendors. Roughly half have completed more than two loan cycles with Friendship Bridge.
1This is based upon Progress out of Poverty Index® (PPI) surveys collected in disbursement meetings by Facilitators and is meant to be a census. The valid number of surveys of single observation per client for 2014 is 22,051, which is 74.3% of clients served during 2014, 99% CL for NPL, +/-0.6%.
5OUR CLIENTS | FRIENDSHIP BRIDGE 2014 IMPACT REPORT
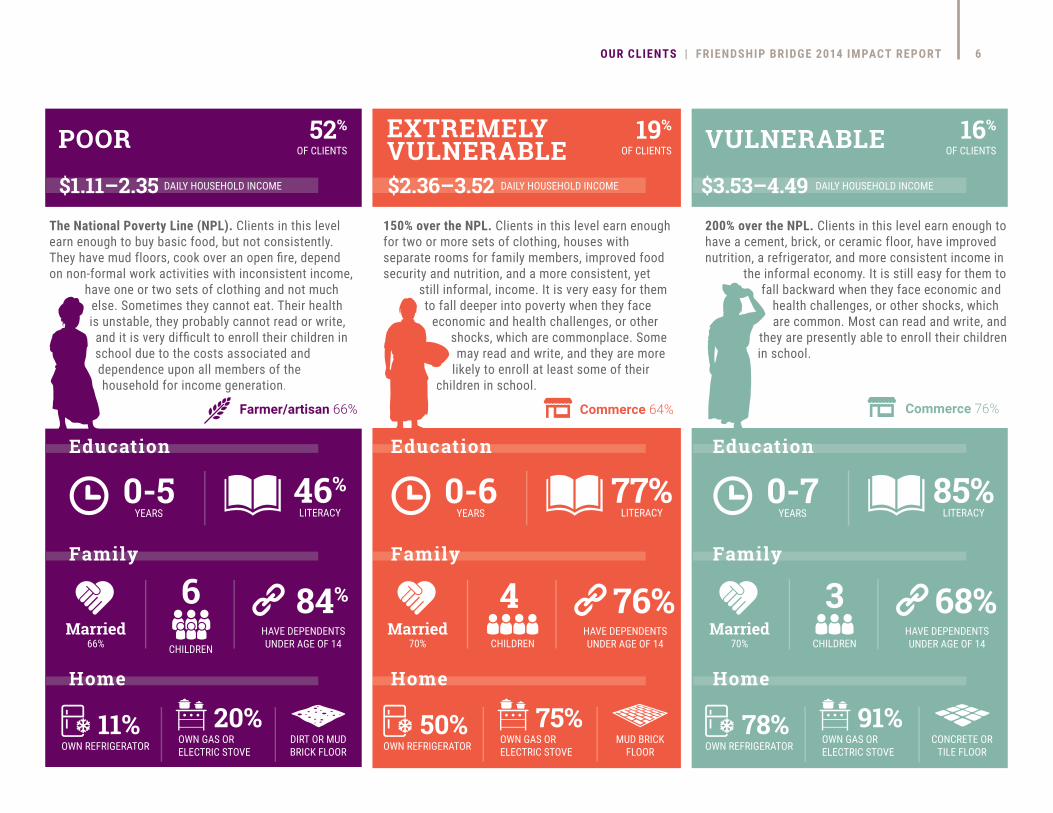
POOR
Education
52%OF CLIENTS
Family
Home
LITERACY46%
CHILDREN
OWN REFRIGERATOR OWN GAS ORELECTRIC STOVE
6 84%
11% 20%
YEARS0-5
Married66%
HAVE DEPENDENTS UNDER AGE OF 14
$1.11–2.35
DIRT OR MUD BRICK FLOOR
EXTREMELYVULNERABLE
Education
19%OF CLIENTS
Family
Home
LITERACY77%
CHILDREN
OWN REFRIGERATOR OWN GAS ORELECTRIC STOVE
4 76%
50% 75%
YEARS0-6
Married70%
HAVE DEPENDENTS UNDER AGE OF 14
MUD BRICK FLOOR
VULNERABLE
Education
16%OF CLIENTS
Family
Home
LITERACY85%
CHILDREN
OWN REFRIGERATOR OWN GAS ORELECTRIC STOVE
3 68%
78% 91%
YEARS0-7
Married70%
HAVE DEPENDENTS UNDER AGE OF 14
CONCRETE OR TILE FLOOR
The National Poverty Line (NPL). Clients in this levelearn enough to buy basic food, but not consistently. They have mud floors, cook over an open fire, depend on non-formal work activities with inconsistent income,
have one or two sets of clothing and not muchelse. Sometimes they cannot eat. Their health is unstable, they probably cannot read or write,and it is very difficult to enroll their children in school due to the costs associated and dependence upon all members of the household for income generation.
150% over the NPL. Clients in this level earn enoughfor two or more sets of clothing, houses with separate rooms for family members, improved food security and nutrition, and a more consistent, yet still informal, income. It is very easy for them to fall deeper into poverty when they face
economic and health challenges, or other shocks, which are commonplace. Some may read and write, and they are more
likely to enroll at least some of their children in school.
200% over the NPL. Clients in this level earn enough tohave a cement, brick, or ceramic floor, have improved nutrition, a refrigerator, and more consistent income in
the informal economy. It is still easy for them to fall backward when they face economic and
health challenges, or other shocks, whichare common. Most can read and write, and
they are presently able to enroll their childrenin school.
Farmer/artisan 66% Commerce 64% Commerce 76%
DAILY HOUSEHOLD INCOME $2.36–3.52 DAILY HOUSEHOLD INCOME $3.53–4.49 DAILY HOUSEHOLD INCOME
6OUR CLIENTS | FRIENDSHIP BRIDGE 2014 IMPACT REPORT

Since 2011, we have tracked the poverty rates of our clients and increased the concentration of new clients within our target market. We boast one of the better poverty penetration rates in the Latin American and Caribbean region,i meaning we serve a higher proportion of the poorest populations. However, we feel that we could improve outreach within the areas we serve to reach more impoverished women, particularly in the departments of Quetzaltenango, San Marcos, and Retalhuleu.
Women’s Context in Guatemala• Physical security: Guatemala ranks third highest in the world in femicide.ii • Limits to choice/freedom: The U.N. representative of women in Guatemala, María Machicado Terán says, “80% of men believe that women need permission to leave the house, and 70% of women surveyed agreed.” iii • Nature of work: Women work 8% more hours per day than men, but 74% of their work hours are unpaid, versus 16% for men.iv
• Poverty: Guatemala ranks #2 in poverty intensity in the Latin American and Caribbean region.v
7OUR CLIENTS | FRIENDSHIP BRIDGE 2014 IMPACT REPORT

Our Client ContinuumStrategy

Our data continues to reinforce our theory that the longer a client is with us, the better off she is. We believe that our Trust Bank methodology and Non-Formal Education have positive outcomes, but as clients grow with us they need additional Plus services to continue along the Client Continuum. Many clients have the capacity and motivation to take advantage of additional services like new loan products, advanced/technical training, mentorship, health services, and access to new markets. These services could accelerate them along a new growth curve from Dreamers to becoming Entrepreneurs and for some, Leaders.
LeaderEntrepreneurDreamer
The Client Continuum is a key client segmentation strategy in our theory of change.
Client Continuum
9OUR CLIENT CONTINUUM STR ATEGY | FRIENDSHIP BRIDGE 2014 IMPACT REPORT

“I am in charge of deciding the colors, the quantity we produce,
responding to orders, and looking in on the employees. My
husband is the one who travels to the border and delivers orders
and does the selling.” –Ceferina, Totonicapán,
Client for 7 years
IN OUR CLIENTS’ WORDS
Expanding on our work with segmentation in 2013, Friendship Bridge leveraged a long standing partnership with Freedom from Hunger (FFH) in 2014 to conduct qualitative research to advance the client segmentation strategy. Modifying FFH’s existing survey
methodology for “Impact Stories,” Client Advocates (Field Interviewers and SPM Promoters) interviewed 30 clients segmented as Dreamers (10), Entrepreneurs (10), and Leaders (10). Interviews explored themes such as family demographics, description of business, home/work balance, perception of successful people, acquisition of skills and abilities, vision and inspiration, and
resilience. These in-depth, highly personal interviews averaged 2.5 hours each and revealed shared qualities of women who would be ready to take advantage of additional Plus services.
(psychological, physical, social, and economic) is a precursor for ability to consider growth.
In 2014 we conducted research in partnership with Freedom from Hunger to identify factors that had the most influence on clients’ growth:
Freedom from Hunger Project
Friendship Bridge is using these findings to guide our client segmentation, which will allow us to encourage clients to grow along the Continuum. Our segmentation strategy aligns the time a client is with the organization and her desire for personal growth with the services available to her. Through multiple loan cycles, clients are encouraged to develop their aspirations as they gain skills, confidence, and capital. Meanwhile, we learn more about their talents, dreams, opportunities, and constraints. This institutional strategy of strengthening relationships, especially between our Facilitators (Loan Officers) and clients, helps us recognize when clients are ready to take advantage of Plus services (see page 12). Our data continues to reinforce our theory that the longer a client is with Friendship Bridge, the better off she will become.
(a clear, detailed idea of aspirations) is a strong indicator of someone able to grow.
(life cycle, familial support, health, number of young children) either facilitates or holds clients back from growth.
Readiness
Context
Vision
10OUR CLIENT CONTINUUM STR ATEGY | FRIENDSHIP BRIDGE 2014 IMPACT REPORT
Being a woman doesn’t mean that you can’t do things;
you have to have goals and I have the skills….
I feel really capable.” -Aura Marina, Chimaltenago,
Client for 3 years

Our Plus Services

2014 Advanced Training Program
In response to client requests for specific products and services, we began offering Plus services beyond Non-Formal Education.
759 58,842 3clients total hours training
partners
12OUR PLUS SERVICES | FRIENDSHIP BRIDGE 2014 IMPACT REPORT
2014 Plus Services Advanced Training Parallel Loan
CrediSalud Seasonal Loan
CrediEscolar Solidarity Loan
Technical and/or business training in addition to non-formal education
For creditworthy clients to borrow in addition to Trust Bank Loan
Loan to purchase efficient, clean burning wood stove through our partner Doña Dora
Short-term to take advantage of seasonal increases in economic activity
Loan to support with the costs associated with sending students to school, offered two times a year
For long term clients organized into a small group of creditworthy peers

CrediSalud278 women invested in improved stoves in 2014, which notably improved many aspects of their lives.
$37 or 72% savings in fuel expenditures per month $3.5 or 49% savings in medical expenses per month 50% reduction in number of doctor’s visits per month 70% reduction in number of work days missed the prior month 78% decrease in number of school days missed the prior month by children due to illness and 94% reduction due to income generation 20% of families increased number of dinners eaten together during the week
≈70%
5000+
1.8
Percentage of the population using firewood for cooking (2013)
Deaths due to Household Air Pollution (HAP) in 2010
Average hours a day women spend collecting wood in rural areas (2013)vi
A survey was conducted at the time of the credit application and the follow-up survey was conducted in the first quarter of 2015. These are the results of 80 paired surveys. We found that women spend less time and fewer resources collecting wood for fuel – a time consuming and arduous task. Loan recipients are spending more time in income generating activities, but they also spend more time in household duties. Their children spend more time in school-related activities and less time in income generating
and household activities. It would appear that with the savings of time clients experience with increased income generation, they can relieve their children of time spent collecting wood or on income generation. This allows the children more time in school-related activities. Survey results support the CrediSalud strategy, which is that savings on fuel would be equivalent to the loan payments, and clients would show significant improvements in health outcomes and self-perception.
GUATEMALA NATIONAL STATISTICS
Indicator Improved
13OUR PLUS SERVICES | FRIENDSHIP BRIDGE 2014 IMPACT REPORT

CrediEscolarMore than 1,000 students were supported in school in 2014 through 978 education loans.2
Supported children, siblings, grandchildren, nieces, nephews, and clients’ own formal education (55% female) 76% of students finished the school year 77% used loans to support continued education, as opposed to enrolling students for the first time. Clients would have taken from household expenses and sacrificed in other areas if they had not received loan 87% say it was the first time they accessed this type of loan 68% repayment of the loan came from their business, which is less than the basic Trust Bank loan. CrediEscolar showed higher dependence on husband and other children to repay 26% had no education herself, nor did her parents
Clients seem to have similar aspirations for both male and female children in school. A comparison of the educational attainment by gender of the
grandparents’ generation versus the current generation of students shows more girls in the current generation are attending school. The fact that
CrediEscolar supported slightly more girls than boys is notable, given that the national average educational attainment for men is greater.vii
Twenty-six percent of clients interviewed never attended school themselves,
nor did their parents, but they are currently supporting their children in school and their educational aspirations for their children are higher than
the other clients interviewed.3
From 2013-2014, enrollment of dependent children between 7 and 13
INCREASED 17%VIII
3 They wanted their children to complete technical training or university, whereas the other 74% of the clients interviewed wanted for their children to complete middle school.
2 These are the results of 53 or %5 client follow-up interviews
14OUR PLUS SERVICES | FRIENDSHIP BRIDGE 2014 IMPACT REPORT

Our Impact:Capacity Over Financial Decisions
Friendship Bridge helps clients achieve the “good life” because
“…they’re not just another organization. They offer us new capabilities and opportunities.”
–Maria Elena, Escuintla, Client for 3 years
IN OUR CLIENTS’ WORDS

We have administered this tool four consecutive years with the intent of evaluating business development, one of our three social objectives. Results have been inconclusive over the years, which is consistent with similar studies across the industry. We are re-evaluating whether success of client businesses is the best way to measure the success of our program.
SavingsChange in
IncomeApplication
of Increased Income
Source of Loan
RepaymentThe majority of our clients have a sense that their
income is allowing them some relief from life’s
uncertainty. Over half report they have either started or
increased savings. Compared to last year, this feeling of improved security is consistent if not higher.
95% of our clients feel their income has
increased or stabilized. Since last year, more
clients reported increased income
substantially across all poverty levels.
Nearly all clients are feeding their families
better. This finding is also consistent from last year
and remains the major improvement across all
poverty levels.
As clients become less vulnerable, we see that
they are able to shift from relying on their husband’s income to relying on their own
business income.
95% OF CLIENTS
feel their income has increased or stabilized
BUSINESS EVALUATION SURVEY
16OUR IMPACT: CAPACIT Y OVER FINANCIAL DECISIONS | FRIENDSHIP BRIDGE 2014 IMPACT REPORT
One way we have seen this manifested for our clients is a greater capacity for financial decision-making. In satisfaction interviews,ix clients are asked to indicate how certain aspects of their lives may have changed since becoming a Friendship Bridge client.4
A few observations from these interviews allow us to understand the needs of clients, how they perceive changes in their lives since becoming a client, and where Friendship Bridge could improve outcomes.
Though poverty is complex, offering solutions that allow our clients to take advantage of financial, social, and human capital allows them to gain positive change in their lives.
4The same clients were not re-interviewed in 2014 as in 2013 to generate this data, so comparison of results year over year is not demonstrative for the purposes of this report.

Impact on Financial Decisions
17OUR IMPACT: CAPACIT Y OVER FINANCIAL DECISIONS | FRIENDSHIP BRIDGE 2014 IMPACT REPORT
POOR
52%OF CLIENTS
EXTREMELY VULNERABLE
VULNERABLE
19%OF CLIENTS
16%OF CLIENTS
Since becoming a client, have you started saving?
How did your income change?
With what money did you repay your loan?
How did the loan help your family?
62%Yes
Increased Stabilized
66%Yes 59%Yes
67% 30%
Increased Stabilized
69% 24%
Increased Stabilized
72% 26%
Food83%
Homeimprovement
Education for selfor children
2%
10%
Medical1%
Clothing1%
Food75%
Homeimprovement
3%Medical2%
Clothing2%
Food67%
Homeimprovement
2%Medical1%
Clothing3%
Business
65%
fromHusband
fromChildren
from
Education for selfor children12% Education for self
or children21%
24% 4%
Business
81%
fromHusband
fromChildren
from
8% 3%
Business
79%
fromHusband
fromChildren
from
11% 3%

Our Impact:Capacity For Economic Change

Clients who utilized a Plus service, such as Advanced Training, CrediSalud, or CrediEscolar: are found to have a 4% higher PPI score than clients who did not5 move more between the poverty levels when compared to non-participating clients, and their poverty score is generally 6 percentage points higher.6 This means there are indications that clients who took advantage of Plus services, as compared to those who did not, experienced more positive change in their poverty status.
have a 4% higher PPI score than clients
who did not
PPI score decreases 2.34%
Of the clients who saw an improvement in poverty level:
Of the clients who fell back a poverty level:
28% acquired a refrigerator and 20% acquired a gas or electric stove.
49% had an increased number of dependent children under 14 in their homes.
CLIENTS WHO UTILIZED A PLUS SERVICE
FOR EVERY ADDITIONAL DEPENDENT CHILD,
5 Multiple regression for PPI score prediction, correlation coefficient 3.93, p < 0.1 6 Chi Square of PPI level change between 2013 and 2014, correlation coefficient 9.72, the p-value as not significant, even at the 10%-level. We believe that if we continue to track the use of Plus services, it will become a significant, positive predictor of change in poverty.
19OUR IMPACT: CAPACIT Y FOR ECONOMIC CHANGE | FRIENDSHIP BRIDGE 2014 IMPACT REPORT
From 2013 to 2014, our results show most clients have been elevated to a place of financial stability, but not necessarily economic prosperity. Sixty-two percent of our clients did not change in poverty level over the period, while another 20% have experienced improvements that signal movement out of, or less, poverty.x
Our data shows that the longer a client is with Friendship Bridge, the more likely she is to improve her PPI score.xi The two most salient drivers of change in poverty are the number of dependent children under age fourteen in the household and ownership of a durable asset.
Friendship Bridge utilizes the Progress out of Poverty Index (PPI) to help measure our poverty impact.

Our Impact:Capacity to Aspire
In monthly Trust Bank meetings, Friendship Bridge Facilitators generate human and social capital through participatory learning, trust building, and reinforcement of group solidarity.
In 2014, we saw again that clients were largely satisfied with the service their Facilitator provided and felt supported by their group. Clients logged 201,349 hours of education in these
meetings in 2014, and 95% of clients surveyed reported having applied at least one learning in their lives. From 2013 to 2014, we observed a variation in the application of Non-Formal Education topics with more application in health and self-esteem offset by a decrease in
business. How to manage expenses remained the most applied education concept.

2014 NON FORMAL EDUCATION TOPICS Financial Rights Domestic Violence Empowerment Preventative Health
Over-indebtedness Pregnancy and Youth Pregnancy Mental Health Investment of Profits
FOR EACH SUCCESSIVE LOAN CYCLE, CLIENTS ARE
19% MORE LIKELY to report having taken on a leadership role.
21OUR IMPACT: CAPACIT Y TO ASPIRE | FRIENDSHIP BRIDGE 2014 IMPACT REPORT
Before, [women] were submissive. they didn’t have the courage to speak or to demand. Now I ask for or demand what is mine by my rights and those of my children.”
-Jeny, Escuintla, Client for 3 years
IN OUR CLIENTS’ WORDS
Increased self-esteem and skills are the foundation for building agency, defined as the ability to make and act on choices to improve one’s own life. Leadership is one of the ways we can observe agency. To assess our impact on agency, we asked clients if they had taken on a leadership role in their Trust Bank, their family, or their community since becoming a client.xii Trust Banks are the first domain in which clients tend to demonstrate their leadership capacity. In addition to taking on leadership roles within their group, clients also act as leaders in the familial and community domains of daily life.
Ninety percent of clients surveyed reported having taken on a leadership role in one of these three domains since becoming a Friendship Bridge client. We found that for each successive loan cycle, clients are 19% more likely to report that they have taken on a leadership role,xiii which reinforces our theory that through continued participation, clients are aspiring for a better future and more able to achieve their objectives.
The capacity to aspire is a precursor for creating a better future.

Impact on Capacity to Aspire
22 OUR IMPACT: CAPACIT Y TO ASPIRE | FRIENDSHIP BRIDGE 2014 IMPACT REPORT
POOR EXTREMELY VULNERABLE
VULNERABLE
96%Yes 92%Yes 97%Yes
90%Yes 92%Yes 91%Yes
What topics have you put into practice?
34%
Control My Expenses
24% 17%
Improve My Self-Esteem
15%
Improve MyBusiness
35%
Control MyExpenses
20%
Improve MyHealth
Improve MyHealth
14%
Improve My Self-Esteem
17%
Improve MyBusiness
35%
Control MyExpenses
17%
Improve MyHealth
23%
Improve My Self-Esteem
18%
Improve MyBusiness
Have you taken on a leadership role?
Are you satisfied with the service your loan officer provides?
Do you feel supported by your group?
Yes 95% Yes 94% Yes 92%
52%OF CLIENTS
19%OF CLIENTS
16%OF CLIENTS

Although we have a Social Performance Management (SPM) Department, all 130 staff, 10 members of the Board of Directors, volunteers, donors, investors and clients have a role in ensuring that we embody our mission and realize our vision of a world in which Empowered Women Eliminate Poverty. Here are some of the activities, SPM indicators, and people who have helped us stay true to our mission and strive to meet our desired results.
Our Management:Social Performance

Conducted Smart Campaign Self-Assessment and implemented improvement plan
Beta tested Cerise Social Audit tool (SPI4)
Participating member of Social Performance Task Force Outcomes and Gender Working Groups
Participated in Grameen Foundation’s Poverty Outreach research
Conducted PPI validation survey on 5% of clients
Social Performance Board Committee ensured directional oversight and focus
Ensured balanced focus and results through institutional and individual Social Performance objectives
71% of employees are indigenous, and 10% are former clients
ACTIVITIES
SOCIAL PERFORMANCE INDICATORS
Targeted Clients: 89% of new borrowers below 20% of GNI/capita (2014)
Employee Retention: 76% of employees have been employed for more than one year and 90% overall employee and 85.4% Facilitator retention rate
Women employees and leaders: 66% female employees, 55% female managers 76% female Facilitators
Know our Clients:
24OUR MANAGEMENT: SOCIAL PERFORMANCE | FRIENDSHIP BRIDGE 2014 IMPACT REPORT
The Education and Social Performance Committee (ESP) advises the Board of Directors and staff. Friendship Bridge is grateful to be guided by this knowledgeable group. Committee members are experts in the field of microfinance, social performance, popular education techniques, and monitoring and evaluation methods. Current members:
PEOPLE
Chris Dunford for his service on this committee and his many years of valuable advice and mentorship to the organization
In 2014, we created the Client Advisory Committee, which consists of 12 long-standing clients representing each of the geographic areas we currently serve in Guatemala. The committee members are experienced borrowers and businesswomen. Three members are elected to be the Executive Committee. The goal of the committee is to draw upon clients’ experiences as Friendship Bridge develops policies and programs that will best meet the needs of our clients. To collect client feedback and insight, we hold focus groups throughout the year on different topics such as how to define empowerment and methods of increasing client loyalty. The Executive Committee meets with Friendship Bridge’s President and Board of Directors annually.
Francy Milner, Committee Chair JD Bergeron Natalie Dumond Cara Forster
Matilde Olazabal Carolina Roca Claire Simon Carmen Velasco
The SPM Department is comprised of a department manager, three Client Advocates, and a data-entry specialist.
Special thanks to:
Lindsey Richardson for her continued research support
25OUR MANAGEMENT: SOCIAL PERFORMANCE | FRIENDSHIP BRIDGE 2014 IMPACT REPORT

iCrowther, Naomi. (2015). Factors Influencing Poverty Outreach Among Microfinance Institutions in Latin America. Washington, DC: Grameen Foundation and International Finance Corporation. (Report in print)iiSmall Arms Survey. (2012). Femicide: A Global Problem – Research Note 14. Retrieved from http:// www.smallarmssurvey.org/about-us/highlights/highlight-rn14.html. (Report on web)iiiGuinan, Julie. (2015). Nearly 20 years after peace pact, Guatemala’s women relive violence. CNN. Retrieved from http://www.cnn.com/2015/04/02/world/iyw-guatemala-gender-violence/. (Journal article on web)ivUnited Nations Economic Commission for Latin America and the Caribbean. (2014). Statistical Yearbook for Latin America and the Caribbean 2014. Retrieved from http://repositorio.cepal.org/ handle/11362/37647. (Report on web)vBased on Foster-Greer-Thorbecke Index, a multidimensional measurement of poverty that includes income inequality in the metric. United Nations Economic Commission for Latin America and the Caribbean. (2013). 2013 Panorama Social de América Latina. New York: Author. (Report in print)viGlobal Alliance for Clean Cookstoves. (2013). Guatemala Cookstoves and Fuels Market Assessment. Retrieved from http://cleancookstoves.org/resources/213.html. (Report on web)
viiIn 2011, men 15 and older had an average of 5.9 years of education versus 5.4 years for women. Guatemala Ministerio de Educación. (2013). Indicadores de Contexto. Retrieved from http://estadistica. mineduc.gob.gt/SNIE/contexto.html. (Report on web)viiiPaired PPI surveys 2013-2014 (1,913)ixSatisfaction survey is collected by Client Advocates (staff members of the SPM team). 2-3 clients are selected in a Trust Bank meeting by lottery to be interviewed individually following the meeting in a private setting. Sample represents 4.3% of clients served in 2014.xAnalyses conducted using paired PPI data for clients surveyed in the last quarter of 2013 and 2014 (number of observations = 1,913)xiLinear regression of cycle versus binary code change in poverty score, p-value .079 xiiWorld Bank. (2002). Measuring Women’s Empowerment as a Variable in International Development. Retrieved from http://siteresources.worldbank.org/INTGENDER/ResourcesMalhotraSchulerBoender.pdf. (Report on web) xiiiLinear regression of cycle versus binary of having taken a leadership role since becoming a client, correlation coefficient 0.1864, p < 0.01
405 Urban Street, Suite 140Lakewood, Colorado 80228
FOR ADDITIONAL INFORMATIONand stories about women creating a better future for themselves and their children,
please visit friendshipbridge.org and join us on Facebook.
Photography by Michael Allen, Robert Weigel, Jim Cline, and Global Partnerships
Friendship Bridge is a 501(c)(3) nonprofit organization / Tax ID# 84-1141078


![Welcome [1bnzr72wf2sdbsell2gosxfj.wpengine.netdna-cdn.com]](https://img.dokumen.tips/doc/110x75/620167a27b61ce5d584c974c/welcome-1bnz-.jpg)