Embed Size (px)
Citation preview

Expanding District Capacity to Turn Around Failing Schools
An evaluation of the Cameron Middle School
charter conversion
By Public Impact: Daniela Doyle

Acknowledgements
Above all, we are grateful to all of the students, parents, teachers, administrators, and district and charter personnel who shared their experiences with us to make this evaluation of the Cameron con-version possible and improve the district’s future turnaround efforts.
We would also like to thank Amy Rome, director of teacher development at the Academy for Urban School Leadership, Meghan O’Keefe, vice president of Teach Plus’s T3 initiative, and Marco Petruzzi, chief executive officer of Green Dot Public Schools, for sharing the lessons they have learned in their ongoing efforts to turn around low-performing schools. In addition, we would like to thank Julie Kowal, who served as a thought partner early in the district’s development of the conversion model.
In addition we would like to thank members of the Public Impact team who played a vital role in this project. Angie Spong, Brendan Yorke, and Bryan C. Hassel organized and participated in site visits, conducted research, and provided input at critical junctures in the drafting process.
Finally, we thank Sharon Kebschull Barrett, who served as copy editor, Beverley Tyndall, who shep-herded the report through publication, and Jacky Woolsey, who designed the layout.
© 2014 Public Impact, Chapel Hill, NC
Public Impact’s mission is to dramatically improve learning outcomes for all children in the U.S., with a special focus on students who are not served well. We are a team of professionals from many backgrounds, including former teachers. We are researchers, thought leaders, tool-builders, and on-the-ground consultants who work with leading education reformers. For more on Public Impact, please visit www.publicimpact.com.
Public Impact encourages the free use, reproduction, and distribution of this paper for noncommercial use. We require attribution for all use. For more information and instructions on the commercial use of our materials, please contact us at www.publicimpact.com.
Please cite this report as:
Public Impact: Doyle, D. (2014). Expanding district capacity to turn around failing schools: An evalu-ation of the Cameron Middle School charter conversion. Chapel Hill, NC: Public Impact. Retrieved from http://www.mnps.org/files/_DWDTU_/baf2f457863f314d3745a49013852ec4/Expanding_District_Capacity_to_Turn_Around_Failing_Schools-Public_Impact.pdf .

Expanding District Capacity to Turn Around Failing Schools 1
introduction
After several unsuccessful turnaround efforts and years of chronic low performance at Cameron Middle School, Metropolitan Nashville Public Schools (MNPS) decided to try something dif-ferent to dramatically improve student outcomes: gradually convert operation of the school from the district to a charter management organiza-tion (CMO). In 2010–11, the process of trans-ferring responsibility for the school began, with MNPS managing grades 6 through 8 as Cameron Middle School, and LEAD Public Schools man-aging the fifth grade as Cameron College Prep. LEAD managed one more grade each year, com-pleting the conversion in fall 2014, with LEAD managing all of Cameron’s students.
This report tells the story behind the conver-sion. From 2011–12 to 2013–14, Public Impact’s research team conducted six daylong site visits,
one in the fall and another in the spring of each academic year. During these site visits, we inter-viewed teachers, administrators, and district and charter leadership. We also administered staff, parent, and student surveys, and analyzed stu-dent performance and other school data at both schools each year.
The evidence we collected suggests that students attending Cameron were better off by the end of the conversion than they were when the conversion started, both academically and with respect to the culture in the schools they attended. Both schools made large gains in math in 2013–14, leading them to earn the distinction of making the state’s list of “Reward Schools” for growth. Performance gains during the rest of the conversion and in reading/language arts (RLA) were modest, however, and often uneven. Thus,

although some indicators suggest that Cameron will improve student learning as a charter school, the conversion was not a clear success. Many les-sons from it could improve the district’s imple-mentation of future conversions, although the district and its charter partners will always have to address anew the inherent challenges of imple-menting a model that combines both a district-led turnaround and a new charter school.
The report is organized into five sections:
1. Background on the conversion. This provides a history of the conversion, how it was designed to work, why MNPS chose to implement it at Cameron, and the steps MNPS and LEAD took to launch the conversion.
2. Student performance results to date. The main goal of the Cameron conversion was to turn around a failing school and dramatically improve student performance. The second section of this report examines academic performance from the year before the conversion began through the 2013–14 school year.
3. Evaluation of the Cameron conversion. This examines whether and how the Cameron conversion has been successful, as well as the challenges it faced.
4. Selecting a turnaround model. The report proposes a framework for considering different school turnaround models based on the benefits and challenges each present.
5. Recommendations for the district’s future school turnaround work. The last part of the report offers five recommendations for MNPS that take into account the challenges the Cameron conversion has faced, as well as lessons from other organizations engaged in similar efforts. Although these recommendations are intended specifically for MNPS, they are broad enough to apply to any district that wants to strengthen its school turnaround strategy.
2 Expanding District Capacity to Turn Around Failing Schools

Part 1. background on the conversion
Cameron Middle School (CMS) began as Pearl Junior High School in 1924.1 During segrega-tion, it was one of three Nashville high schools that served black students, and was eventually renamed for a World War I veteran and for-mer science teacher at the school, Lieutenant H.A. Cameron. The school transformed into the city’s first 5–8 middle school in the 1970s, and evolved yet again in the late 1980s, when it began serving students for whom English was a second language.2 Today, Cameron enrolls a diverse student body, including large numbers of African-American, Hispanic, and Arab stu-dents. In each of the previous five years, more than 90 percent of Cameron students were eli-gible for free or reduced-price lunch, and more than a quarter were designated as English lan-guage learners.3
The first year that Tennessee released a list of schools in “improvement status,” Cameron
Middle School was on it. But the school ’s improvement plans failed to bring about substan-tive reform, and led to little change in student achievement. By 2009–10, Cameron entered its fifth year of school improvement, which, under the federal No Child Left Behind law, required the school to “restructure” to dramatically improve student learning.4 In response, MNPS kept the principal in place, but replaced 50 per-cent of the staff. By the end of the year, however, Cameron was still f loundering. Just 13 and 20 percent of students were proficient on the state math and reading tests, respectively, and more than a quarter of students were suspended at some point in the year.5 The district determined that Cameron’s latest effort had failed to build the “cultural coherence” required for systemic change, and that the school lacked the opera-tional flexibility or capacity to drive academic improvement.6
Expanding District Capacity to Turn Around Failing Schools 3
4 Expanding District Capacity to Turn Around Failing Schools
a new model
That same fall, Dr. Jesse Register, director of schools for MNPS, met with Alan Coverstone, then the executive director of charter and pri-vate schools, to discuss strategies for improving Cameron. Despite dedicating considerable funds and other resources to better address the needs of students assigned to its lowest-performing schools, MNPS had limited success turning them around.
MNPS was considering having a charter operator take over Cameron’s management all at once—combining the district’s new work on quality authorizing with its need for fresh approaches to school turnarounds. But the dis-trict could not find an operator that was willing and able to assume management of an entire school at once. The few CMOs engaged in turn-around work, such as Mastery Public Schools in Pennsylvania and Green Dot Public Schools in California, were not ready to expand to a new market. Other CMOs that MNPS approached were not willing to get into the turnaround business, or openly shunned turnaround work altogether.
Register wanted a new idea, and Coverstone had one—convert CMS over four years into a zoned charter school.7 The idea lingered for sev-eral months until, in early 2010, the state enacted “First to the Top” legislation and threatened to use it to take over the state’s chronically low-per-forming schools, including Cameron. Register needed a plan to rapidly improve student per-formance at Cameron, and Coverstone pushed again for a charter conversion. This time, the idea gained traction.
The conversion began in 2011–12, with Cameron College Prep (CCP), a charter school operated by the LEAD Public Schools charter management organization, sharing the building
at 1034 1st Avenue South with CMS. CCP took responsibility for fifth grade, while students in grades 6–8 remained enrolled at CMS, which the district continued to operate. Each year, CCP took responsibility for another grade, while CMS served one fewer grade of students, completing the conversion in fall 2014, with CCP enrolling all of the students in the building.
District officials said the conversion model appealed to them for several reasons. First, it seemed to minimize the downside of school turnarounds—which in their experience often lacked serious interventions and a strong vision for change—with the upside of charters, includ-ing an influx of talent and resources, and a long-range plan for sustaining the school turnaround through the charter organization. A charter con-version also provided a remedy for two down-sides of new-start charter schools because the district provided two key resources—a facility and operational supports. At the same time, the model would be efficient because the char-ter school would be “zoned,” meaning that only students residing within the school’s attendance area could enroll. As a result, the conversion model brought the charter directly to the stu-dents who most needed it. Just as important, dis-trict officials say the conversion model brought something new and fresh to a history of failed efforts at Cameron.
preparing for the conversion
To implement the conversion model, MNPS first needed to identify a charter partner. The district issued a request for proposals (RFP) in 2010 and received three applications. An RFP review panel considered each of the applications and eventually chose LEAD Public Schools, a local charter management organization, because it

Expanding District Capacity to Turn Around Failing Schools 5
had both a solid transformation plan and expe-rience operating schools within Nashville.
The conversion officially began in 2010–11, a year before CCP enrolled its first class. During this planning year, the teams from both schools met weekly, fostering the relationships and lay-ing the foundation for the conversion. Both schools took additional steps to prepare; for example, CCP’s new principal and his admin-istrative team dedicated most of their time to community outreach, introducing CCP and explaining what the conversion process would mean for families. They spent time every week answering questions at the local community center, holding conversations with the Cameron alumni association, hosting school visits with incoming fifth-graders and their families, and going door-to-door in the community to get par-ents on board. In large part as a result of these efforts, very few families opted out of CCP in 2011–12. The CCP team members also spruced up their hallway in the school building to wel-come their first class.
To support students still enrolled at CMS in 2010–11 and prepare for the conversion, the district hired a new principal and instituted a number of improvement efforts, described in the next section. The district also hired a trans-formation facilitator to support the principals at both schools and develop a transition plan for the conversion. With these efforts in place, CCP and CMS both opened their doors to students in the fall of 2011, with CCP enrolling fifth-graders only and CMS enrolling students in grades 6–8.
details of the conversion
According to district reports and interviews, the conversion model used at Cameron had several key elements:
1. Gradual transfer of responsibility for students. Each year, responsibility for an additional grade transferred from CMS to CCP, until CCP enrolled and took responsibility for all students in grades 5–8 in the 2014–15 school year.
2. Zoned enrollment. Only students within the Cameron attendance zone could enroll at CCP. At the same time, CCP became the default school for students in the attendance area, so rather than opting in to the school, as with most charters, area students in the grades CCP served were automatically enrolled unless their families opted out through the district’s school choice process.
3. Two distinct schools. The district kept the schools and students physically separate throughout the conversion, with separate entrances and distinct parts of the building, which were decorated differently.8 Students from one school were not permitted to walk through the other’s space, or to simultaneously use shared spaces, such as the cafeteria or library. In the last year of the conversion, however, seventh-graders from CCP and eighth-graders from CMS played on the same sports teams.
4. Intensive improvement efforts at CMS. MNPS committed to an intensive improvement effort at CMS for the years in which it served Cameron students, hiring a new principal to lead CMS through the conversion. In 2012–13, the principal hired five Teach for America corps members to teach at CMS—who made up nearly half of the teaching staff that year, and two-thirds of teaching positions in the school’s final

6 Expanding District Capacity to Turn Around Failing Schools
year. The district also invested heavily in a partnership with Lipscomb University to provide professional development. Over the course of the conversion, Lipscomb provided a variety of supports to improve the quality of instruction, including an on-site liaison, weekly training sessions, individual professional development plans, and regular one-on-one coaching sessions. At the beginning of the conversion, the district also supported the hiring of additional personnel to create more planning and development time for teachers.
5. District support. MNPS hired a transformation facilitator to serve full time at CCP and CMS, charged with helping the schools work together and resolving conflicts when needed. Beginning in 2012–13, CMS also became part of MNPS’s newly created Innovation Zone (iZone), which provides school leaders with greater autonomy around hiring, the school schedule, and program decisions, among other areas.

Expanding District Capacity to Turn Around Failing Schools 7
Part 2. Student Performance Results to Date
Academic gains, or lack thereof, will ultimately determine the success of the Cameron conver-sion. As we describe in more detail below, stu-dents across the Cameron building demonstrated strong math gains in the conversion’s final year. In fact, both schools demonstrated so much growth in 2013-14 that they ranked in the top five percent of schools state-wide in terms of year-over-year growth, earning them spots on the state’s list of “Reward Schools.” However, the results are more mixed when considering performance through-out the conversion in both math and reading/language arts (RLA), including changes in the percentage of students scoring proficient or advanced, changes in the percentage of students scoring below basic, and growth within student cohorts. Achievement gains were generally small and came late, if there were gains at all.
overall proficiency
Students throughout the building demonstrated large gains in math by the end of the Cameron conversion: The percentage of students scor-ing proficient or advanced on the state exam
quadrupled over the baseline year (see Table 1 on page 8).9 The percentage of students scoring proficient or advanced in math across Cameron increased every year of the conversion, with the greatest gains—21 percentage points—in 2013–14. Changes in proficiency rates across grades followed a similar trend (see appendix, page 35).
Meanwhile, student performance in RLA increased much less during the conversion (see Table 2). Although the percentage of students scoring proficient or advanced increased by 12 percentage points between 2009 and 2014, only about 30 percent of students in the building were proficient as of 2013–14. Once again, changes in RLA proficiency across grades followed the same basic trend (see appendix, page 35).
changes in the percentage of students scoring below basic
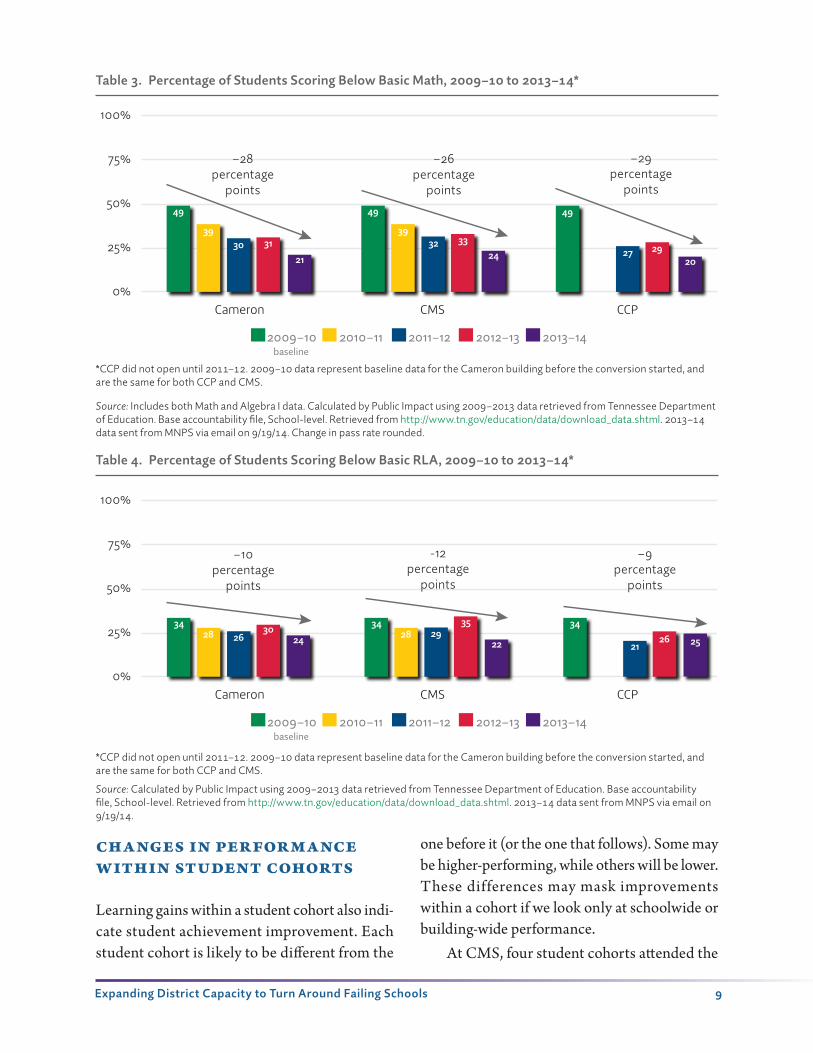
Many students at Cameron were performing two or more years behind grade level when the conversion started. Students may have therefore made large learning gains that were not reflected

8 Expanding District Capacity to Turn Around Failing Schools
in proficiency rates. Decreases in the percentage of students scoring “below basic” on the state exam, the lowest rating, therefore offers another indicator that student performance improved.
The data show that across the building,
the percentage of students scoring below basic decreased by nearly 30 percentage points in math and by 10 percentage points in RLA (see Tables 3 and 4).
100%
75%
50%
25%
0%
+39percentage
points
+37percentage
points
+39percentage
points
Cameron CMS CCP
2009–10 2010–11 2011–12 2012–13 2013–14
13 131323
32
52
212128 30 29
50
30
52
baseline
Table 1. Percentage of Students Scoring Proficient or Advanced in Math, Baseline (2009–10) vs. 2013–14*
*CCP did not open until 2011–12. 2009–10 data represent baseline data for the Cameron building before the conversion started, and are the same for both CCP and CMS.
Source: Includes both Math and Algebra I data. Calculated by Public Impact using 2009–2013 data retrieved from Tennessee Department of Education. Base accountability file, School-level. Retrieved from http://www.tn.gov/education/data/download_data.shtml. 2013–14 data sent from MNPS via email on 9/19/14.
Table 2. Percentage of Students Scoring Proficient or Advanced in RLA, 2009–10 to 2013–14*
100%
75%
50%
25%
0%
+12percentage
points
+10percentage
points
+12percentage
points
Cameron CMS CCP
2009–10 2010–11 2011–12 2012–13 2013–14
20 20 2028 26
32
23 2323 21 2130
2431
baseline
*CCP did not open until 2011–12. 2009–10 data represent baseline data for the Cameron building before the conversion started, and are the same for both CCP and CMS.
Source: Calculated by Public Impact using 2009–2013 data retrieved from Tennessee Department of Education. Base accountability file, School-level. Retrieved from http://www.tn.gov/education/data/download_data.shtml. 2013–14 data sent from MNPS via email on 9/19/14. Change in pass rate rounded.
Expanding District Capacity to Turn Around Failing Schools 9
changes in performance within student cohorts
Learning gains within a student cohort also indi-cate student achievement improvement. Each student cohort is likely to be different from the
one before it (or the one that follows). Some may be higher-performing, while others will be lower. These differences may mask improvements within a cohort if we look only at schoolwide or building-wide performance.
At CMS, four student cohorts attended the
100%
75%
50%
25%
0%
–28percentage
points
–26percentage
points
–29percentage
points
Cameron CMS CCP
2009–10 2010–11 2011–12 2012–13 2013–14
4949 49
27 29
39 3930 32 3331
21 24 20
baseline
Table 3. Percentage of Students Scoring Below Basic Math, 2009–10 to 2013–14*
*CCP did not open until 2011–12. 2009–10 data represent baseline data for the Cameron building before the conversion started, and are the same for both CCP and CMS.
Source: Includes both Math and Algebra I data. Calculated by Public Impact using 2009–2013 data retrieved from Tennessee Department of Education. Base accountability file, School-level. Retrieved from http://www.tn.gov/education/data/download_data.shtml. 2013–14 data sent from MNPS via email on 9/19/14. Change in pass rate rounded.
100%
75%
50%
25%
0%
–10percentage
points
-12percentage
points
–9percentage
points
Cameron CMS CCP
2009–10 2010–11 2011–12 2012–13 2013–14
34
212628
34 342826 29
3530
baseline
24 22 25
Table 4. Percentage of Students Scoring Below Basic RLA, 2009–10 to 2013–14*
*CCP did not open until 2011–12. 2009–10 data represent baseline data for the Cameron building before the conversion started, and are the same for both CCP and CMS.
Source: Calculated by Public Impact using 2009–2013 data retrieved from Tennessee Department of Education. Base accountability file, School-level. Retrieved from http://www.tn.gov/education/data/download_data.shtml. 2013–14 data sent from MNPS via email on 9/19/14.

10 Expanding District Capacity to Turn Around Failing Schools
school for at least two years between 2009–10 and 2013–14 (see Table 5).10 When we look at changes in performance over time within these student cohorts, we find uneven results. In RLA, the percentage of proficient or advanced students on the state exam tended to move up and down within a narrow band. Math performance gener-ally improved overall, but was uneven from year to year, sometimes improving, sometimes falling back. Similarly, the percentage of students scor-ing below basic bounced up and down from year to year in both subjects (see appendix).
At CCP, just two student cohorts have attended long enough to have at least two years
of performance data. The percentage of students scoring proficient or advanced increased each year for both cohorts in both reading and math. Gains in some subjects and years were modest, but oth-ers were stunning. Most notably, the percentage of students in CCP’s first student cohort that passed the state math exam increased by more than 300 percent in the three years they attended the school (from 5th grade to 7th), surpassing the average pass rate for 7th graders statewide by nearly 25 percentage points (see Table 5). Meanwhile, the percentage of students scoring below basic stayed relatively steady, with the exception of math for that first cohort (see appendix).
100%
75%
50%
25%
0%
100%
75%
50%
25%
0%
100%
75%
50%
25%
0%
100%
75%
50%
25%
0%
100%
75%
50%
25%
0%
100%
75%
50%
25%
0%
7th 8th 7th 8th
6th 7th 8th
5th 6th 7th 8th 5th 6th 7th 8th
6th 7th 8th
16.3%
29.2%
19.8% 22.0% 19.4% 21.5%8.5%
18.4%
37.9%31.1%
28.6% 21.4% 13.4% 26.1% 33.3%
17.5% 22.8% 17.2%
Table 5. Percentage of Students Proficient or Advanced, by Student Cohort
RLA Math
CM
S C
ohor
t 1
(Cla
ss o
f ’1
1)C
MS
Coh
ort 2
(C
lass
of
’12)
CM
S C
ohor
t 3
(Cla
ss o
f ’1
3)

Expanding District Capacity to Turn Around Failing Schools 11
takeaway
Student performance data can be interpreted as promising, but gains were less than ideal. Large gains in math and modest gains in RLA in 2013–14 earned both CMS and CCP the distinc-tion of making it on the state’s list of “Reward Schools” for growth, and offer reason to be
optimistic about CCP’s future. During the con-version years, however, many students at CMS did not make academic gains. If the goal of the conversion was to produce learning gains for all students, it seems to have fallen short.
100%
75%
50%
25%
0%
100%
75%
50%
25%
0%
100%
75%
50%
25%
0%
100%
75%
50%
25%
0%5th 6th 7th 5th 6th 7th
5th 6th 5th 6th
32.9%28.2%
18.3% 31.6% 27.0%33.8%
22.5%35.3% 36.2%
69.5%
100%
75%
50%
25%
0%
100%
75%
50%
25%
0%
5th 6th 7th 8th 5th 6th 7th 8th
23.6%25.4% 21.9% 21.2% 30.1% 17.5% 26.2%
50.0%
Table 5. Percentage of Students Proficient or Advanced, by Student Cohort
RLA Math
CM
S C
ohor
t 4
(Cla
ss o
f ’1
4)C
CP
Coh
ort 1
(C
lass
of
’15)
CC
P C
ohor
t 2
(Cla
ss o
f ’1
6)
Note: Darker shade represents baseline year for conversion.
Source: Includes both Math and Algebra I data when applicable. Calculated by Public Impact using 2009–2013 data retrieved from Tennessee Department of Education. Base accountability file, School-level. Retrieved from http://www.tn.gov/education/data/download_data.shtml. 2013–14 data sent from MNPS via email on 9/19/14.
(Continued)

Expanding District Capacity to Turn Around Failing Schools 13Expanding District Capacity to Turn Around Failing Schools 13
Part 3. Evaluation of the Cameron conversion
As CCP assumes responsibility for grades 5–8 in 2014–15 and the conversion officially concludes, the district must answer the question: Did the conversion model work at Cameron? If yes, why, and how can the district replicate that success? And if no, what challenges must the district and its charter partners address to be more successful in the future?
Although student performance improved across the Cameron building from the begin-ning of the conversion to the end, dramatic gains came late in math, and never appeared in RLA. However, several other indicators point in the right direction. Moreover, the conversion pro-vided many lessons from issues that may have impeded more and faster growth at Cameron, but, if addressed, could produce better outcomes in the district’s future conversion schools.
successes of the cameron conversion
The Cameron conversion experienced at least three successes in addition to the performance gains described above: a high percentage of area students enrolled at CCP every year; staff and student morale at CMS improved significantly from the beginning of the conversion to the end; and the transformation facilitator played a critical bridge between the schools and the dis-trict, as the district hoped. As a result, by most accounts from teachers, students, and MNPS staff, the Cameron building was a happier and safer place at the end of the conversion than it was at the start.

14 Expanding District Capacity to Turn Around Failing Schools
Consistently high student enrollment at Cameron College PrepThe Cameron conversion officially began in 2010–11, a year before CCP enrolled its first class. During this planning year, the founding principal and his administrative team dedicated most of their time to community outreach, intro-ducing CCP and explaining what the conversion process would mean for families. They spent time every week answering questions at the local community center, holding conversations with the Cameron alumni association, hosting school visits with incoming fifth-graders and their fami-lies, and going door-to-door in the community to get parents on board. In large part as a result of these efforts, CCP enrolled more fifth-graders than CMS had enrolled in at least the previous five years.
Enrollment remained high, as well. The num-ber of fifth-graders enrolled at CCP increased slightly every year, and after three years, enroll-ment figures remained relatively steady in upper grades (see Table 6).11 The percentages of stu-dents qualifying for special education and for whom English is a second language also exceeded the historical enrollment of these students at CMS. The high take-up rate is especially impres-sive given CCP’s high expectations for students and families, including longer school days. On our final parent survey, 65 percent of CCP par-ents reported thinking that the school was too
demanding and gave too much homework, but for many, the trade-off was worth it; more than 80 percent thought their child received a better education at CCP than (s)he would have received at CMS.
Improvements in staff and student morale at CMSAny time a school is set to close, maintain-ing staff and student morale is a challenge. According to survey data, staff morale at CMS seemed to hit a low in 2011–12, when CCP first opened its doors. But in the two years that fol-lowed, staff morale steadily improved. Although it is not possible to pinpoint the specific changes that drove that improvement, staff interviews identify a number of likely factors. A new cadre of Teach for America teachers who were focused on making as large an impact as possible during their two-year commitment joined the school’s staff; the school’s principal began to collaborate with teachers more and increase his focus on data-driven instruction; and the school served fewer students, fostering a stronger sense of com-munity within the building. In 2011–12, less than 20 percent of teachers responding to our survey indicated that they felt positively about CMS. That figure climbed to 71 percent in 2012–13, and to 100 percent in 2013–14 (see Table 7). The percentage of teachers who thought that student behavior improved over the previous year also
Table 6. Student Enrollment by Grade, 2010–11 to 2013–14
Grade 2010–11 2011–12 2012–13 2013–14
5th 132 150 151 166
6th 143 121 154 145
7th 131 125 123 143
8th 127 116 148 123
CMS CCP

Expanding District Capacity to Turn Around Failing Schools 15
skyrocketed, from 0 percent in 2011–12 to 100 percent in 2013–14.12 The district-administered TELL survey demonstrated similar trends over the previous two years.
In addition, survey questions gauging stu-dent morale at CMS also showed improve-ments. From 2012–13, the first year we surveyed students, to 2013–14, the percentage of students who agreed “a lot” with the statement, “I am proud to go to my school,” nearly doubled from 48 percent to 84 percent (see Table 8). The per-centage of students agreeing “a lot” also jumped
by similar amounts with respect to liking their teachers, knowing how they were performing in school, and feeling safe at school.
Well-implemented transformation facilitator roleInterviewees from both schools and from MNPS staff agreed that the transformation facilitator played a critical role in the conversion, and that both of the individuals filling that role did so effectively. In addition to ensuring that school leaders communicated on a regular basis and
100%
75%
50%
25%
0% The changes at the school Student behavior has improved. I feel more stress. have been positive.
2011–12 2012–13 2013–14
Compared to last year . . .
100%
40%33%
60%
0%0%
100% 100% 100%
100%
75%
50%
25%
0% School leaders rarely consider I feel positive about teachers’ views when makingI feel good about my job. Cameron Middle School. major decisions.
2011–12 2012–13 2013–14
This year . . .
79%71%
29%
82%
29%
100%
19%
100%
25%
Table 7. Selected Results from CMS Staff Survey, 2011–12 to 2013–14
Note: In the top graph, N (number of responses)=11 in 2011–12, N=5 in 2012–13, N=6 in 2013–14. In the bottom graph, N=19 in 2011–12, N=14 in 2012–13, and N=8 in 2013–14.

16 Expanding District Capacity to Turn Around Failing Schools
overseeing many logistical aspects of the conver-sion, the transformation facilitator mediated sev-eral disagreements between the schools, many of which were related to sharing space. For exam-ple, when it came time to refinish the basketball court, the schools both wanted their mascots and colors used in the design. The transforma-tion facilitator played a key role working with school leaders to broker a compromise. The dis-trict could potentially further strengthen the role of the transformation facilitator, but its foresight in creating the position and hiring strong candi-dates clearly smoothed much of the conversion.
challenges
As noted, the Cameron conversion experienced many successes as CMS phased out and CCP phased in. And even where the conversion faced obstacles, the schools and district often made improvements over time. Nonetheless, the dis-trict could improve future conversion efforts by addressing the multiple changes it and the schools faced.
Communication Effective communication between CMS and CCP, between MNPS and the schools, and with the Cameron community presented a challenge throughout the conversion.
Between CMS and CCP. According to staff at both schools, communication between the schools was minimal throughout the conver-sion outside of regular meetings between school leaders and the transformation facilitator. Nearly every staff member we spoke to at CMS and CCP in the first year reported some type of con-flict, animosity, or tension between the schools, and the results of our staff surveys conveyed the same sentiment year after year. They faced no big conflict between the schools (although there were a number of small “fires” along the way), according to interviewees, but by not talking with one another, staff at times made assump-tions about the motives of people working in the other school. According to several CMS teach-ers, CCP staff never recognized how hard they were working or any of the improvements they made. The few times they did hear from CCP,
100%
75%
50%
25%
0% I like being a I feel safe I am proud to go I like my I know how I student at my school. at my school. to my school. teachers. am doing in school.
2012–13 2013–14
Percentage of students who agreed “a lot” with the following statements . . .
44% 48%
72%84%
35% 35%
68% 68%
0%
80%
30%
Table 8. Selected Results from CMS Student Survey, 2012–13 to 2013–14
Note: 27 students responded in in 2012–13 and 26 in 2013–14.

Expanding District Capacity to Turn Around Failing Schools 17
it was to explain how CCP would teach them a new approach to their craft and make them bet-ter teachers if they went to work for the charter, which the CMS teachers largely found insulting. A few CMS teachers did go over to CCP, but CMS’s last group of teachers was not interested. “No teacher from CMS wants to go to CCP,” one CMS teacher told us during our last interview day. “Why would we when they’ve been so cold?”
Between MNPS and the schools. Several staff members at CMS reported that MNPS did not communicate clearly with them about their role in the conversion. Interviews with CMS staff indicated that they never fully understood why CMS had to close, and to some extent, they felt like the district had given up on them.
“In the first year of the conversion at CMS, we felt a lot of hopelessness,” one teacher shared. “ ‘We’re a sinking ship.’ That was the message. No one was saying things like ‘we’re a sinking ship,’ but no one was contradicting us either. And teachers who wanted to make a career here felt really resentful.”
Several CMS teachers said in interviews that they were trying their best, but without a clear turnaround plan, much of what was happening felt forced on them and did not seem part of a more comprehensive effort. For example, when Lipscomb University partnered with CMS to provide professional learning, teachers there did not understand Lipscomb’s role. As one teacher told us, “Were they evaluative? What authority did they have? We didn’t trust them because their role didn’t feel defined.” According to interview-ees, MNPS missed an opportunity to engage staff at CMS at the start of the conversion and work with and through them to clearly communicate expectations for the conversion. Without that, CMS staff were left to speculate about the future of the school and their careers within the district.
Meanwhile, CCP often struggled to get the resources to which it was entitled from the dis-trict because many district personnel did not understand how Cameron’s zoned charter school was different from the other application charter schools in the district. Especially when CCP opened, it took many conversations and phone calls not only from CCP, but also the transfor-mation facilitator and Coverstone, to get all of the key materials, passwords, and infrastructure promised to CCP from the start.
With the Cameron community. According to school and district staff, the district did not work with the schools to develop a cohesive and consistent communication strategy for explain-ing the conversion to students and parents. As noted above, CCP staff spent the better part of a year explaining to families who they were, how they were different from the school they were replacing, and what they planned to do at CCP. But many families also had children who would continue to attend CMS, and the changes there were not communicated as clearly or consis-tently. Meanwhile, a number of media stories in 2011–12 lauded CCP as the charter school that was going to save Cameron, antagonizing CMS staff. When CMS produced gains on the district assessment in the school’s last year, this lack of communication resulted in confusion for par-ents and students. As one CMS parent noted on our survey, “Yes [I have concerns about the con-version of Cameron Middle Schools to a charter school]. The achievement scores of the charter school are not better than CMS’s achievement scores.” Similarly, one teacher noted, “There’s been zero communication to parents who are thinking, ‘Cameron’s doing well—why do we still have to relinquish control?’ ” Teachers also reported that many students asked if CMS would continue to operate as a school distinct

18 Expanding District Capacity to Turn Around Failing Schools
from CCP if they did well on the state exam at the end of the year, which was clearly not a possibility.
AccountabilityAt the beginning of the conversion process, MNPS struggled to establish clear expectations for how it would evaluate the conversion and hold teachers and leaders at each school account-able. At CMS, the district did not establish for-mal student performance goals. CCP’s contract included a set of performance goals, but they were so high that MNPS never held CCP to them. For example, although fewer than 30 per-cent of Cameron students were proficient in any subject the year before CCP opened, one goal called for CCP’s proficiency rate to rank in the top 10 percent of middle schools statewide after enrolling them for just one year. At the school level, neither school leader set clear student per-formance goals in the first year either, choos-ing to focus more attention on improvements in school culture. Consequently, neither staff at CMS nor at CCP were able to articulate in pre-cise terms during our interviews at the start of the conversion how they would know if they had been successful.
By year two, however, the district clarified performance goals for each school. In 2013, the district released a new academic performance framework that measures academic success across four areas: academic progress, attainment and college readiness, reducing the achievement gap between student subgroups, and school cul-ture. The exact indicators used vary based on the grades served, but each includes score ranges that identify whether the school meets the stan-dard. MNPS now evaluates all public schools—district-run and charter—using the academic framework. In addition, Coverstone set as a goal for all iZone schools that pass rates on the state
exam would increase by 10 percent each year. These efforts came late to the conversion, how-ever, and failed to include clear consequences if a school did not meet them.
CostsIn the three years during which CMS trans-ferred responsibility for students to CCP, neither school operated at capacity, making the conver-sion more expensive to operate compared to a single school. While the district could adjust some costs as student enrollment numbers changed, such as textbooks and desks, other resources, like the principal’s salary, remained the same regardless of student enrollment. So while it cost less than $200 per pupil to support the CMS principal’s salary before CCP began to phase in, it cost almost $800 per pupil by CMS’s last year. Similarly, when a school serves just one or two grades, it cannot hire enough staff to offer the variety of courses and extracurricular activi-ties as a larger school without sharing resources. At CMS, there were few academic opportunities outside of core courses by the end of the conver-sion. CCP was able to tap into private fundrais-ing to make up for some of the funding they lacked when they were not operating at scale. At CMS, funds from a School Improvement Grant (SIG) helped, but those funds expired before CMS’s final year (see Table 9).
At the same time, the district poured addi-tional resources into the conversion to support the turnaround efforts there (see Table 9). At CMS, $750,000 of the school’s $2 million SIG grant went to Lipscomb’s professional learn-ing support. The transformation facilitator cost an additional $67,000 per year, plus benefits. Meanwhile, CCP wanted its own bus route to accommodate its longer school day and help dif-ferentiate it from CMS and reinforce the CCP school culture. The district agreed, but it came

Expanding District Capacity to Turn Around Failing Schools 19
at a cost—approximately $50,000 to $80,000 per year. Although MNPS found a way to make ends meet for the Cameron conversion, largely through its SIG grant, the transitional costs of this model may make it difficult to replicate elsewhere.
School turnaround capacitySchool turnaround work is inherently difficult. Rather than building a new school with a new culture from the ground up, school turnarounds require undoing practices and behaviors that undermine student achievement. Most district-led efforts have failed, and the experience in Nashville, as well as in other districts across the country, indicate that the demand for char-ter school operators to take over failing district schools has greatly exceeded the availability of providers willing to do it.
W hen the Cameron conversion started, neither MNPS nor LEAD had done this sort of work before, but given the option of continuing the status quo or trying something new and bold, they chose the latter. Given their inexperience, a certain amount of trial and error was inevitable. Looking back, however, we can see that both organizations could have likely quickened the pace of change had they done more to develop their capacity before the conversion started.
District capacity. A district can pursue at least three approaches in leading a turnaround:
1. Focus on hiring a great school leader, offer him or her the autonomy to lead the school differently, and largely step out of the way;
Table 9. Per-Pupil School Funding During the Conversion
State/ Local
Funds*Federal Funds**
(less SIG) SIG Grant Total
2010–11
CCP – *** – ***
CMS $8,268 $1,790 $820 $10,878
All of Cameron $8,268 $2,326 $820 $11,414***
2011–12
CCP $8,679 $2,174 – $10,853
CMS $8,783 $822 $1,630 $11,235
All of Cameron $8,753 $1,214 $1,158 $11,124
2012–13
CCP $9,169 $692 – $9,862
CMS $8,648 $584 $2,850 $12,082
TOTAL $8,928 $642 $1,318 $10,888
2013–14
CCP $8,579 $524 – $9,103
CMS $10,282 $1,208 $83 $11,572
All of Cameron $8,945 $671 $18 $9,633
* The figures in the table do not include the value of in-kind services that CCP received from MNPS.
** CCP did not receive any Title II or Title III federal funds.
*** Although CCP did not enroll any students in 2010–11, and did not get Title II or III federal funds, the school received $277,511 in federal funds for planning work.

20 Expanding District Capacity to Turn Around Failing Schools
2. Focus on supporting the school leader by being more prescriptive and providing or working with the school to develop the structures and systems to build success, or
3. Seek out a great leader and offer autonomy over key levers, and work with the leader to implement basic structures.
W hen the conversion started, MNPS’s leadership strategy for the grades it managed was most aligned with the first option. This can work if the district is fortunate to find the right leader, but research shows a critical need then for the district to have an incredibly strong selection process, since so much hinges on the leader’s capabilities—and the district must be willing to replace the leader quickly if (s)he does not pro-duce results right away.13 And as is so often the case, great turnaround leaders were in short sup-ply when the conversion started.
According to CMS’s principal during the conversion, he did not understand that he was being hired as a turnaround leader, and he was not prepared for the role. “Right now I would hire me to do this,” he said. “But four years ago I wouldn’t have.” When the conversion started, teacher interviews and survey results indicate that he missed opportunities to engage his staff and create an effective leadership team. In fact, the principal did not initially establish a leader-ship team at all, and nearly 80 percent of CMS teachers responding to our staff survey that first spring said that school leaders rarely considered teachers’ views when making major decisions. In addition to inexperience—he had neither served as a principal nor worked in a turnaround previ-ously—the principal also did not have access to all of the autonomies he felt were necessary from the start. For example, the new principal inher-ited many existing staff members when he took
over, including a significant number of teachers who openly opposed the conversion. In addition, the school was required to absorb at least two teachers who were involuntarily reassigned.
As the conversion progressed, many of these issues improved. The iZone was founded, pro-viding clearer paths to much-needed autono-mies. The iZone also began to offer more struc-tured support through a cohort of 10 schools, including Cameron. Meanwhile, staff surveys suggest that the principal began engaging teach-ers more effectively. Many of the loudest naysay-ers on staff left the school, and the principal hired a group of enthusiastic Teach for America corps members. Lipscomb responded to teacher feed-back by scaling back the demands of its program. And school staff worked together to identify new processes and programs that helped lead to the improvements in teacher and student morale described above, including CREW, an advisory process aimed at building community within the school. Nonetheless, many of the changes came too late for students who finished eighth grade in 2010–11 and in 2011–12. The changes were also largely a fragmented set of policies, rather than a coherent turnaround plan.
CMO capacity. LEAD found its way to Cameron because its leaders felt strongly that students in failing district schools needed a better option–not just an option for kids whose parents were savvy enough to apply to a charter and lucky enough to win a seat, but an option available to all students in a failing school. When LEAD applied to operate CCP as part of the Cameron conver-sion, the CMO was not even three years old and operated two schools serving just over 200 stu-dents. But LEAD felt compelled to do this impor-tant work and saw a window of opportunity.
Over the course of the conversion, however, teachers identified a number of obstacles that

Expanding District Capacity to Turn Around Failing Schools 21
LEAD struggled to address. Teacher interviews and surveys in 2011–12 highlighted strong sys-tems related to school culture alongside an incon-sistent focus on curricula and performance goals. Many teachers noted a lack of instructional sup-port and academic rigor, which not only hindered academic growth, but also forced teachers to work harder and create many lessons from scratch. While CCP’s results from the district-wide TELL survey were overwhelmingly positive, teach-ers felt less positive about professional develop-ment at the school compared to other elements, especially for new teachers. In addition, LEAD began the conversion with little experience edu-cating students for whom English was not a first language, although nearly a third of CCP’s first class were English language learners.14
According to interviews, LEAD also strug-gled to anticipate how a zoned charter school
would differ from its other charters (to which students and their families apply) with respect to buy-in, discipline, and overall engagement. As one CCP teacher explained, “When CCP opened, we took a lot of direction from LEAD, but they take students via application. The lon-ger we’re here, the more we realize that things at application schools won’t be successful at zoned charters.” Although CCP teachers consistently expressed to us how much they believed in what CCP was doing for students and how they were changing lives, many also told us that they were tired and did not anticipate that they could con-tinue working at CCP for the long haul. Over the course of the school’s first three years, up to a third of its staff left the LEAD network, although just 17 percent of staff did not plan to return after the 2013–14 school year.


Expanding District Capacity to Turn Around Failing Schools 23
Part 4. Selecting a Turnaround Model
So should MNPS continue to use the conversion model at schools where student performance is chronically low? After watching the model play out at Cameron, considering the other school turnaround options available to the district, and reviewing the school turnaround research, our answer is—it depends.
a framework for selecting a turnaround model
Our review of the turnaround literature identi-fied consensus on three necessary conditions for a successful school turnaround:15
1. Operator autonomy. Whether the operator is the district, a new turnaround leader hired by the district, or a CMO, that operator must have the flexibility to do things differently. At a minimum, these autonomies ought to include the ability to hire and fire staff, control budgets, and choose and implement curricula.
2. Operator capacity. In addition, the operator must possess the resources and know-how to do the work successfully, including: a high-quality staff with the competencies of effective turnaround educators, a research-based curriculum, a focus on actions common to successful turnarounds, and strong systems for student culture, parent and staff communication, instructional support, and overall school management. In addition, the strongest candidates also have a track record of success supporting student achievement.
3. Accountability. Finally, any turnaround effort must include clear expectations for the turnaround, including metrics for success that include student achievement and interventions if those goals are not met.
Given these three conditions, the specific model itself is less important, though each offers dif-ferent benefits and poses different challenges.

24 Expanding District Capacity to Turn Around Failing Schools
Table 10 summarizes the range of school turn-around models a district might pursue, as well as the benefits and challenges of each. As a district considers which model to select to turn around a failing school, the best choice will reflect the
availability of providers with the capacity to do the work, a determination of which challenges are most manageable, and an assessment of which benefits are most important.16
Table 10. Benefits and Challenges of School Turnaround Options
Options Benefits Challenges
Sam
e op
erat
or
(dis
tric
t)
District turnaround
• Keeps the school under district control
• School continues to serve the same students
• District is unlikely to have the capacity to turn around the school unless it develops a turnaround team that includes a strong leader, high-quality teachers, and a strong set of systems to facilitate the turnaround
New
ope
rato
r(C
MO
or E
MO
)
Gradual con-version (e.g., converting to new operator one grade at a time)
• School continues to serve same students
• Provides an opportunity to increase turnaround capacity within the district
• Requires a transformation of existing school culture and expectations
• Requires the new provider and the district to sell the conversion to families and the community, justi-fying the different approaches for different grades
• District is unlikely to have the capacity to turn around the district school that is phasing out unless it develops a turnaround team that includes a strong leader, high-quality teachers, and a strong set of systems to facilitate the turnaround
• Invites comparisons between the schools that may antagonize a school
• Requires the new operator to co-locate and col-laborate with the outgoing operator
• Imposes additional cost as schools are not operat-ing at scale during the conversion
Immediate conversion
• School continues to serve same students
• Provides an opportunity to increase turnaround capacity within the district
• Requires a transformation of existing school culture and expectations
• Requires the new provider to sell the conversion to families and the community
• Places a greater burden on CMO/EMO to hire staff for the entire school and manage change across all grades at once
Clo
sure
and
new
sch
ool
New district school
• Allows school to start fresh
• Maintains district control of the school
• May not serve the same students, and other high-quality options may not exist for students in the school that is closing
• School closures are generally controversial• Likely to disrupt student enrollment at other local
schools if a school of choice
New charter school
• Allows school to start fresh
• Provides an opportunity to increase turnaround capacity within the district
• May not serve the same students, and other high-quality options may not exist for students in the school that is closing
• School closures are generally controversial• Likely to disrupt student enrollment at other local
schools if a school of choice

Expanding District Capacity to Turn Around Failing Schools 25
choosing conversion at cameron
In the case of Cameron, the district placed a high priority on serving students within the school’s enrollment area, since other high-quality school options were not readily accessible to them. But the district’s previous school turnaround efforts had fallen short, ruling out the option of a district turnaround or closing the school and re-starting it as a new district-run school. The district preferred a CMO with the capacity to convert the entire school at once, but none of the operators respond-ing to the district’s request for proposals was will-ing to do that. LEAD, for example, wanted the opportunity to build a new school culture with incoming students, rather than trying to break the habits and behaviors of students already in the building. A gradual conversion, like a new school, was also more manageable to implement. As a result, a full conversion or closing the school and opening a new charter school were off the table. Given the district’s priorities and constraints, a gradual conversion offered the best option at the time, even in light of its many challenges.
Cameron was the district’s first conversion, leading inevitably to mistakes and much room for improvement in future conversions. And in fact, the climate within the building improved considerably as the conversion progressed. Implementation of the model can certainly get better, but can the model ever produce the dra-matic gains in student learning that districts like MNPS desire?
We think the answer is “yes,” but a conver-sion that transfers management of a district-led school to a CMO one grade at a time is inher-ently more challenging than other school turn-around models. Implementing either a dis-trict-led turnaround or a zoned charter school would be difficult on its own. As in a district-led
turnaround, the district must have the capacity to turn around the grades it manages (which few do), to include transforming the existing culture and expectations in its half of the building and selling the strategy to the community. When putting this together with a zoned charter, dis-trict and charter leaders must address the chal-lenges that each model presents, rather than just one. In addition, at least four new challenges arise from implementing those models side-by-side in the same building:
1. The need to justify different approaches for different grades. Ultimately, a conversion happens because the district school has failed to meet expectations. As long as the charter school is the “solution,” the implicit message is that the district-led side of the school will never be good enough, regardless of the interventions taking place there or whether the adults responsible for the school’s low performance have been replaced. This fact presents two problems. First, it undermines student and staff morale in the grades that the district manages. “[The inevitability that CMS will close] has created a mindset in a whole grade of kids that no matter what they do, they’ll fail because they’re not the chosen ones,” a CMS teacher said. Second, it prompts the question, “Why wait?” If the charter school is the better option, why not transition to a charter school right away? Of course, as was the case at Cameron, no charter provider may be willing to take over an entire school at once. But that message is hardly reassuring for school staff, parents, and students, even if a conversion presents a better learning environment for all of the students in the building.

26 Expanding District Capacity to Turn Around Failing Schools
2. The inevitability of comparisons. In a gradual conversion, the expectation is that the charter school will do better—and largely be better—than the school it is replacing. In this context, district and school staff, students, and community members naturally compare the schools, which often hurts feelings. During our visits, staff compared not just student performance, but student behavior and resources as well. Those comparisons fed tensions in the building. As one CMS teacher explained, “The district did not seem to take into account how awkward it is to be in the same building [as the school that is replacing you]. I don’t know if it’s good for kids to see another school and know that those kids are getting this new place and you’re not.” Having CMS down
the hall had an impact on CCP students as well, who had a longer school day, stricter discipline codes, and more homework. Although these very elements may be key to student success, the juxtaposition between the atmosphere at CCP and CMS likely made it all the more difficult for CCP staff to motivate students and have them buy into the school culture CCP was trying so hard to create. Almost half of CCP students we surveyed indicated that they wished they could attend CMS. In contrast, just 20 percent of CMS students said the same of CCP.
3. The necessity of collaboration. Since the two schools occupy the same building during a gradual conversion, they will always have to engage in some level of

Expanding District Capacity to Turn Around Failing Schools 27
collaboration. At a minimum, they must negotiate how they use shared space and resources. Unlike other co-locations, however, where the schools in the building may have no relationship to each other, CCP and CMS shared families. Not only did the schools have an opportunity for collaboration, they shared a need for collaboration in parent and student interactions. But that collaboration never materialized. According to interviews, neither staff nor students worked together or interacted in any deliberate way. Meanwhile, staff indicated a desire for a deeper level of engagement between the schools as well. “I wish we could find a way to collaborate,” one CCP teacher told us. “The CMS teachers know the families—they could give us a lot of insight.”
4. The imposition of additional costs. As described above, neither the CMO nor the district operates at capacity during a gradual conversion, resulting in higher per-pupil costs for some items and services because the costs are divided among fewer students.
We have no reason to believe that any of these challenges are insurmountable, so it is certainly possible that a gradual conversion model can produce the intended results. Given these chal-lenges, however, the research team for this evalu-ation came to the conclusion that a district ought to seriously weigh the evidence for pursuing con-version compared to other models.
The district’s—and the state’s—school turnaround climate is already changing, how-ever. Two add it iona l CMOs—K I PP a nd Rocketship—have expressed a desire to begin turnaround work in the district for the first time. Rocketship proposed an immediate conversion of a school, while KIPP proposed a gradual Cameron-style conversion.17 Memphis is also experimenting with an array of new school mod-els that include conversions by CMOs that have done them before. Growing interest in school turnarounds will provide more options, but it will always be difficult work, requiring providers to have both the autonomy and the capacity to operate differently, and requiring the district to hold them accountable for dramatically improv-ing student achievement.


Expanding District Capacity to Turn Around Failing Schools 29
Part 5. Recommendations
We offer five recommendations for MNPS that aim to address challenges it faced during the Cameron conversion and improve the condi-tions for turnaround work across the district.
1. build the district’s capacity by developing a comprehensive strategy around a turnaround corps
As described above, MNPS created the iZone with the goal of providing turnaround leaders with flexibility to run the district’s lowest-per-forming schools differently. During the course of the Cameron conversion, however, it became clear that the district’s capacity to support the turnaround at CMS was limited, even through the iZone. Over time, the school saw improve-ments in school culture, climate, and even stu-dent performance, but the district could likely support larger and quicker learning gains as part of a conversion or any other district-led
turnaround by creating a comprehensive strat-egy around a turnaround corps that includes an excellent school leader and a team of effec-tive teachers who can be deployed for the turn-around efforts.
Based on the experiences of several organi-zations that specialize in this type of work, there are at least three critical components to a suc-cessful turnaround corps:
• A turnaround leader who possesses the competencies needed to turn around failing schools, such as those labeled as influencing for results, problem solving, and showing the confidence to lead.18 In addition, the leader must buy into the turnaround approach for the school and be able to articulate the rationale for the changes. He or she should also be able to withstand the public scrutiny this work often sparks. In addition, our conversations with staff at Cameron

30 Expanding District Capacity to Turn Around Failing Schools
suggests that a principal’s interpersonal skills may be particularly important when leading a gradual conversion, given the unusual need for the schools to interact and coordinate. These early experiences suggest that humility, a willingness to compromise and continually communicate, and the ability to ignore perceived slights may be crucial for conversion school principals.
• A team of excellent teachers that can lead the turnaround with the principal, soliciting the support of other staff members along the way. This team ideally includes several teachers from the school because of their institutional knowledge and to help build traction for the turnaround. In the case of a gradual conversion, like Cameron, these teachers must be committed to improving results for the existing students in the district-run school.
• A turnaround plan that prioritizes strategies to stabilize and transform the school, including a clear vision, specific performance goals, and accountability measures. In addition, the plan should outline specific systems to: improve school climate; develop teachers; align curriculum, assessments, and instructional practice; communicate with family and community members; and ensure that the day-to-day logistics of the school run smoothly.
A turnaround corps could include a new leader and group of teachers each time, or a trained team that travels from one low-performing school to the next.
These components are no different than what a high-quality CMO offers. For example,
when Mastery Charter Schools takes control of a failing district school, the CMO introduces six key systems that address school culture, coaching and support, performance-based compensation, curriculum and assessments, leadership, and performance management.19 The details may change from one school to the next, but the overall approach—which Mastery has honed through practice—stays consistent. Furthermore, Mastery has established strong systems for recruiting, selecting, and developing teachers and for establishing leadership teams in schools, which draw on existing staff when appropriate.
In contrast, many district-led turnarounds focus almost entirely on identifying an excellent turnaround leader. Too frequently, however, that leader is hired just weeks before the new school year begins (the CMS principal was hired in July), leaving little time to plan or hire new staff. Consequently, the school turnaround plan will often lack staff buy-in and include an array of intervention strategies that are not integrated with existing school practices.
Of course, an excellent turnaround leader will establish needed structures, but those lead-ers are few and far between. Bolstering a prom-ising leader with a strong team of teachers and a set of strategies from the beginning makes the approach much more likely to succeed, as well as much easier to replicate. For example, Teach Plus initially thought that if it simply hired the right people for its Turnaround Teacher Teams (T3), cohorts of highly effective teachers that lead other teachers to drive dramatic gains in low-performing schools, those individuals would figure out what to do. But they didn’t always fig-ure it out, and in response, Teach Plus has since built out its support and training program for T3. Similarly, Mastery seeks to hire top talent, but also established centralized instructional

Expanding District Capacity to Turn Around Failing Schools 31
and teaching standards, trains teachers on these systems, and tightly monitors implementation.
Districts must also attract the teachers and leaders capable of doing this difficult work. According to several organizations we inter-viewed, the key is to offer excellent teachers and leaders something they cannot get anywhere else. While pay is certainly an important piece of the puzzle, other intangibles resonate as well. The opportunity to engage in meaningful profes-sional learning is a major incentive for teachers who work at schools that the Academy for Urban School Leadership (AUSL) runs in Chicago, for example. Similarly, at T3 schools, pay stipends and opportunities to pursue career ladders that still allow teachers to remain in the classroom have proven key, according to survey data. And within MNPS, the opportunity in several iZone schools to serve as a multi-classroom leader overseeing a team of teachers and earn much higher pay gar-nered more than 30 applicants per vacancy.
2. Develop a rigorous process for evaluating providers’ capacity to conduct the work
If the district chooses to engage a CMO or other provider to conduct turnaround work, it is criti-cal that the district has a robust system in place to evaluate that provider’s capacity to succeed. To this end, the district should require that the provider submit a comprehensive turnaround plan, similar to the application a new charter school would submit. Within the plan, the pro-vider should include:
• Prioritized strategies to transform school culture and instructional practice. Just as the district can build its capacity by developing structures to
address key components of the turnaround, any turnaround provider should share the strategies it plans to implement. At a minimum, the district should evaluate the provider on its plan for staffing, curriculum, professional development, school climate, communication and community engagement, student discipline, and fiscal management. If the provider will serve the same student population, the plan should also identify what it believes are the school’s greatest obstacles, a plan for prioritizing those obstacles, and strategies for overcoming them.
• Evidence of prior success. The best indicator of future success is a track record of past success with a similar student population. If the CMO has engaged in turnaround work previously, those results should weigh heavily in the district’s decision to work with the provider. If the provider is new to turnaround work, the district should review performance results from other schools it has managed and also ask the provider to describe how its approach will adjust to meet the specific needs of a turnaround school. The assessment should focus on student outcomes as well as the presence of robust and replicable systems for school operations that can be implemented in the turnaround school.
In fact, Tennessee now has a “Replication Application” with many questions aimed at determining if a provider has the organizational capacity and school operating systems needed to replicate success in a turnaround school. This document would serve as a good template from which to build a similar “Turnaround Application.”

32 Expanding District Capacity to Turn Around Failing Schools
3. create the conditions that restart providers with the capacity to turn around failing schools want
W hen MNPS released its R FP to convert Cameron, just three providers applied, none of which had ever converted a failing district school before. As described above, more charter provid-ers are getting involved in turnaround work, but demand still greatly exceeds supply. Based on interviews with a number of CMOs engaged in turnaround work, MNPS may be able to increase the supply of providers with the capacity to do this work by offering several incentives, including:
• Transitional funding. Turnaround work often requires an infusion of resources for academic interventions, building improvements to support a positive school climate, and initial planning and
hiring. Providing funding to cover these short-term expenses makes it both more affordable, and more attractive, for a successful CMO to come to a district or venture into turnaround work.
• Access to public funds. According to an analysis of 2011 funding data, charter schools in Davidson County, Tennessee, received almost $2,000 less per pupil from all funding sources, compared to district-run schools—a difference of nearly 15 percent.20 MNPS should work with the state to close that gap and give charters access to the full amount of funding that district schools receive.
• Access to district resources. Especially in the conversion model, the district should ensure that the charter has full access to all of the resources and tools it needs—from

Expanding District Capacity to Turn Around Failing Schools 33
data systems to building keys. The district should also help the CMO retain possession of district resources in the building—including library books, computers, and band equipment—as long as the CMO serves the district’s students. While this was certainly the intention at the start of the Cameron conversion, often personnel within the district delayed access to or took these resources from CCP.
• Feeder patterns. CMOs that are already operating within a district may want to provide a pathway for students to attend their other schools as they move through the school system.
In addition, Tennessee’s charter law already provides two other conditions that CMOs often seek. The law allows a single charter governing board to manage multiple charter schools while preserving accountability for the performance of individual schools. It also provides pre-authori-zation for high-performing CMOs to open mul-tiple schools over time, making it more feasible for CMOs to develop and implement multiyear growth plans and invest in internal operations before they are at scale.
Accord ing to inter v iews w ith CMOs engaged in turnaround work, they are also look-ing for strong, clear systems that will survive the departure of any individual in the district office. And they welcome opportunities to participate in and shape policy discussions that relate to their work and provide an opportunity to have a broader impact on the district.
4. set clear expectations for the turnaround
Whether the turnaround is district-led or man-aged by a CMO or other external provider, it is
critical that the district set clear performance expectations. The million-dollar question, of course, is what those metrics should be.
A common pitfall in turnaround work is for the provider to focus too singularly on building a strong school culture in the first year, largely giving a pass to student performance. AUSL used to “baby” their turnarounds and would not expect them to demonstrate academic gains in the first year, its leadership told us. But over time, they realized that it is essential to develop both a strong school culture and a high level of academic rigor from the start and that academic gains are absolutely feasible in the first year. In fact, according to many of the turnaround pro-viders we interviewed for this report, school turnarounds offer much low-hanging fruit; sim-ply establishing structures and systems where few once existed generally leads to a bump in student performance.
Research in this area has not revealed any magic growth numbers, though. Rather, the district should demand marked improvement from the school turnaround beginning in the first year. Improvements do not necessarily have to happen across the board at first; instead, the provider should identify priorities that can serve as big wins and build momentum for the next stage of the school turnaround, spurring even greater gains in the years that follow. The district should also establish clear consequences if the turnaround efforts fail to make appropri-ate gains, even pursuing a different turnaround strategy or provider.
In addition to academic goals and account-ability measures, the district should establish clear expectations for how the district and the provider will work together. These expecta-tions should include a clear explanation of the resources and services the district will provide, as well as the provider’s responsibilities. In a con-

34 Expanding District Capacity to Turn Around Failing Schools
version, the district also must identify specific ways the two schools should collaborate.
5. over-communicate
All of the turnaround providers we interviewed stressed the importance of communicating effec-tively in a school turnaround setting. Often, a lack of information sparks rumors and anxi-ety, undermining the work underway. Districts should work with turnaround operators to com-municate clearly and often about why the school turnaround is happening, how it will benefit stu-dents, what will change as a result of the turn-around, goals for the turnaround and progress toward those goals, and what teachers, students, and parents can expect along the way.
In addition, the district should seek out and encourage opportunities to engage different stakeholders in conversation about the school turnaround. Finally, the district should work with providers and school staff to develop shared language describing the school turnaround, so that community members hear a consistent mes-sage that allows all involved to work together.
conclusion
W hen MNPS decided to convert Cameron Middle School into a zoned charter school, the idea was almost unheard of. But the students liv-ing within Cameron’s enrollment area needed a better option, and MNPS and LEAD were will-ing to forge new ground to give them one. There
were clearly obstacles along the way, some that the operators were able to overcome together with staff, parents, and students, and others that the district and its charter partners will have to continue to address in subsequent efforts. As the conversion wraps up in fall 2014, however, it is clear that Cameron students were better off at the end of our study than they were at the begin-ning, and that Cameron’s conversion story offers many important lessons for any district that may want to pursue a similar strategy in the future.

Expanding District Capacity to Turn Around Failing Schools 35
appendix. additional performance data
Table 1A. Percentage of Students Proficient or Advanced on the TCAP, 2009–10 through 2013–14
Reading Math
Grade(baseline) 2009–10 2010–11 2011–12 2012–13 2013–14
(baseline) 2009–10 2010–11 2011–12 2012–13 2013–14
5th 19.8% 25.4% 28.2% 18.3% 28.9% 8.5% 23.6% 22.5% 27.0% 53.4%
6th 29.2% 22.0% 21.9% 32.9% 31.6% 13.4% 18.4% 17.5% 36.2% 33.8%
7th 16.3% 28.6% 19.4% 21.2% 35.3% 22.8% 26.1% 37.9% 26.2% 69.5%
8th 13.8% 17.5% 21.4% 21.5% 30.1% 9.9% 17.2% 33.3% 31.1% 50.0%
CMS 19.8% 23.3% 20.8% 21.4% 30.1% 13.0% 21.2% 29.9% 28.9% 50.0%
CCP — — 28.2% 25.8% 31.8% — — 22.5% 31.8% 52.0%
All 19.8% 23.3% 22.9% 23.7% 31.4% 13.0% 21.2% 27.8% 30.4% 51.6%
CMS CCPSource: Includes both Math and Algebra I data. Calculated by Public Impact using 2009–2013 data retrieved from Tennessee Department of Education. Base accountability file, School-level. Retrieved from http://www.tn.gov/education/data/download_data.shtml. 2013–14 data sent from MNPS via email on 9/19/14.
Table 2A. Percentage of Students Below Basic on the TCAP, 2009–10 through 2013–14
Reading Math
Grade(baseline) 2009–10 2010–11 2011–12 2012–13 2013–14
(baseline) 2009–10 2010–11 2011–12 2012–13 2013–14
5th 37.3% 22.1% 21.1% 29.6% 19.1% 48.0% 26.0% 26.8% 36.1% 15.8%
6th 32.6% 33.3% 28.1% 22.8% 33.1% 49.3% 42.6% 37.7% 21.5% 32.4%
7th 36.6% 29.4% 34.7% 44.1% 22.4% 48.8% 34.5% 24.2% 35.7% 13.1%
8th 28.9% 27.5% 22.2% 26.6% 21.9% 53.1% 51.6% 33.3% 31.1% 23.7%
CMS 33.9% 28.3% 28.5% 34.7% 21.9% 49.3% 38.8% 31.5% 33.2% 23.7%
CCP — — 21.1% 26.1% 24.7% — — 26.8% 28.5% 20.4%
All 33.9% 28.3% 26.4% 30.1% 24.1% 49.3% 38.8% 30.2% 30.8% 21.1%
CMS CCPSource: Includes both Math and Algebra I data. Calculated by Public Impact using 2009–2013 data retrieved from Tennessee Department of Education. Base accountability file, School-level. Retrieved from http://www.tn.gov/education/data/download_data.shtml. 2013–14 data sent from MNPS via email on 9/19/14.

36 Expanding District Capacity to Turn Around Failing Schools
Table 3A. Percentage of Students Below Basic, by Student Cohort
RLA Math
CM
S C
ohor
t 1 (C
lass
of
’11)
CM
S C
ohor
t 2 (C
lass
of
’12)
CM
S C
ohor
t 3 (C
lass
of
’13)
CM
S C
ohor
t 4 (C
lass
of
’14)
100%
75%
50%
25%
0%
100%
75%
50%
25%
0%
100%
75%
50%
25%
0%
100%
75%
50%
25%
0%
100%
75%
50%
25%
0%
100%
75%
50%
25%
0%
100%
75%
50%
25%
0%
100%
75%
50%
25%
0%
7th 8th 7th 8th
6th 7th 8th
5th 6th 7th 8th 5th 6th 7th 8th
6th 7th 8th
36.6%
32.6%
37.3% 33.3% 34.7% 26.6%48.0% 42.6%
24.2% 31.1%
29.4% 22.2%
49.3%
34.5% 33.3%
27.5%48.8% 51.6%
5th 6th 7th 8th 5th 6th 7th 8th
22.1% 28.1%
44.1%
21.9% 26.0%37.7% 35.7%
23.7%

Expanding District Capacity to Turn Around Failing Schools 37
Table 3A. Percentage of Students Below Basic, by Student Cohort
RLA Math
CC
P C
ohor
t 1 (C
lass
of
’15)
CC
P C
ohor
t 2 (C
lass
of
’16)
Note: Darker shade represents baseline year for conversion.
Source: Includes both Math and Algebra I data when applicable. Calculated by Public Impact using 2009–2013 data retrieved from Tennessee Department of Education. Base accountability file, School-level. Retrieved from http://www.tn.gov/education/data/download_data.shtml. 2013–14 data sent from MNPS via email on 9/19/14.
100%
75%
50%
25%
0%
100%
75%
50%
25%
0%
100%
75%
50%
25%
0%
100%
75%
50%
25%
0%
7th 8th 7th 8th
6th 7th 8th 6th 7th 8th
29.6%
21.1% 22.8% 22.4% 26.8% 21.5% 13.1%
33.1%36.1% 32.4%

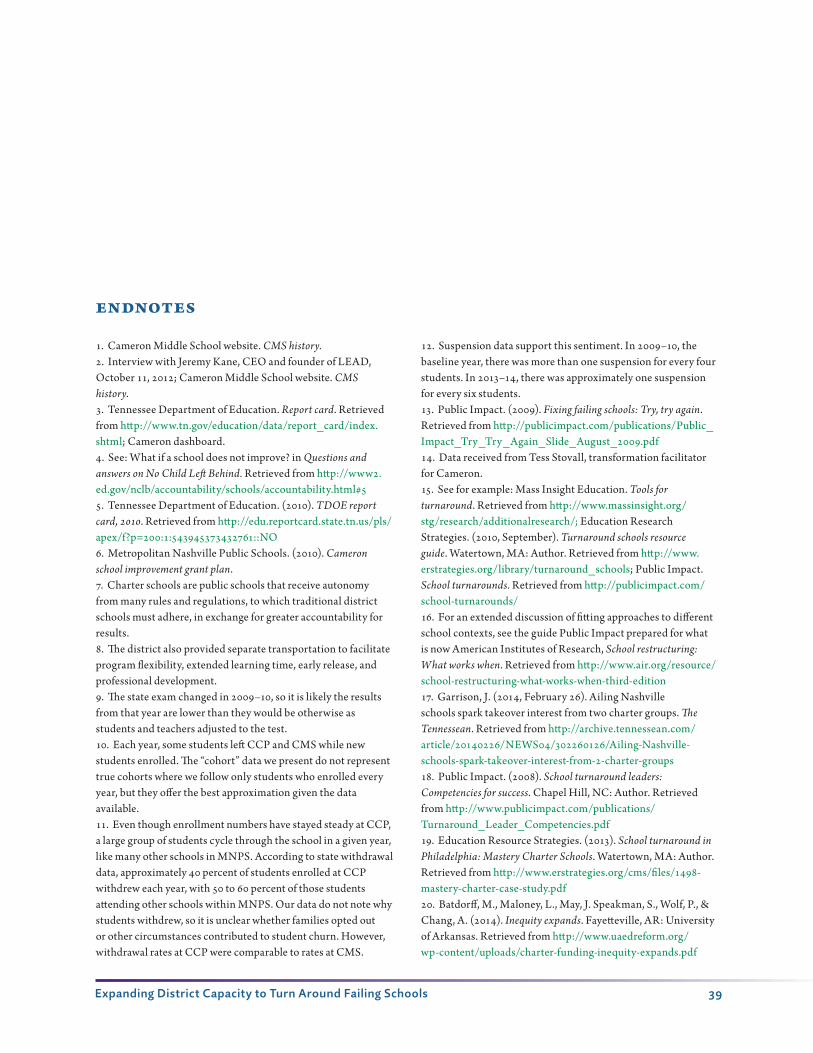
Expanding District Capacity to Turn Around Failing Schools 39
endnotes
1. Cameron Middle School website. CMS history. 2. Interview with Jeremy Kane, CEO and founder of LEAD, October 11, 2012; Cameron Middle School website. CMS history. 3. Tennessee Department of Education. Report card. Retrieved from http://www.tn.gov/education/data/report_card/index.shtml; Cameron dashboard.4. See: What if a school does not improve? in Questions and answers on No Child Left Behind. Retrieved from http://www2.ed.gov/nclb/accountability/schools/accountability.html#55. Tennessee Department of Education. (2010). TDOE report card, 2010. Retrieved from http://edu.reportcard.state.tn.us/pls/apex/f?p=200:1:543945373432761::NO 6. Metropolitan Nashville Public Schools. (2010). Cameron school improvement grant plan. 7. Charter schools are public schools that receive autonomy from many rules and regulations, to which traditional district schools must adhere, in exchange for greater accountability for results.8. The district also provided separate transportation to facilitate program flexibility, extended learning time, early release, and professional development.9. The state exam changed in 2009–10, so it is likely the results from that year are lower than they would be otherwise as students and teachers adjusted to the test.10. Each year, some students left CCP and CMS while new students enrolled. The “cohort” data we present do not represent true cohorts where we follow only students who enrolled every year, but they offer the best approximation given the data available.11. Even though enrollment numbers have stayed steady at CCP, a large group of students cycle through the school in a given year, like many other schools in MNPS. According to state withdrawal data, approximately 40 percent of students enrolled at CCP withdrew each year, with 50 to 60 percent of those students attending other schools within MNPS. Our data do not note why students withdrew, so it is unclear whether families opted out or other circumstances contributed to student churn. However, withdrawal rates at CCP were comparable to rates at CMS.
12. Suspension data support this sentiment. In 2009–10, the baseline year, there was more than one suspension for every four students. In 2013–14, there was approximately one suspension for every six students.13. Public Impact. (2009). Fixing failing schools: Try, try again. Retrieved from http://publicimpact.com/publications/Public_Impact_Try_Try_Again_Slide_August_2009.pdf 14. Data received from Tess Stovall, transformation facilitator for Cameron.15. See for example: Mass Insight Education. Tools for turnaround. Retrieved from http://www.massinsight.org/stg/research/additionalresearch/; Education Research Strategies. (2010, September). Turnaround schools resource guide. Watertown, MA: Author. Retrieved from http://www.erstrategies.org/library/turnaround_schools; Public Impact. School turnarounds. Retrieved from http://publicimpact.com/school-turnarounds/ 16. For an extended discussion of fitting approaches to different school contexts, see the guide Public Impact prepared for what is now American Institutes of Research, School restructuring: What works when. Retrieved from http://www.air.org/resource/school-restructuring-what-works-when-third-edition17. Garrison, J. (2014, February 26). Ailing Nashville schools spark takeover interest from two charter groups. The Tennessean. Retrieved from http://archive.tennessean.com/article/20140226/NEWS04/302260126/Ailing-Nashville-schools-spark-takeover-interest-from-2-charter-groups 18. Public Impact. (2008). School turnaround leaders: Competencies for success. Chapel Hill, NC: Author. Retrieved from http://www.publicimpact.com/publications/Turnaround_Leader_Competencies.pdf 19. Education Resource Strategies. (2013). School turnaround in Philadelphia: Mastery Charter Schools. Watertown, MA: Author. Retrieved from http://www.erstrategies.org/cms/files/1498-mastery-charter-case-study.pdf20. Batdorff, M., Maloney, L., May, J. Speakman, S., Wolf, P., & Chang, A. (2014). Inequity expands. Fayetteville, AR: University of Arkansas. Retrieved from http://www.uaedreform.org/wp-content/uploads/charter-funding-inequity-expands.pdf


![Failing Schools[1]](https://img.dokumen.tips/doc/110x75/577d2db41a28ab4e1eae1fd8/failing-schools1.jpg)