Embed Size (px)
Citation preview

Exhibit (d)
This description of the Province ofOntario is dated December 13, 2006and appears as Exhibit (d) to theProvince of Ontario's Annual Report onForm 18-K to the U.S. Securities andExchange Commission for the Ñscalyear ended March 31, 2006.

THE DELIVERY OF THIS DOCUMENT AT ANY TIME DOES NOT IMPLY THAT THE INFORMATIONHEREIN IS CORRECT AS OF ANY TIME SUBSEQUENT TO ITS DATE. THIS DOCUMENT (OTHERWISETHAN AS PART OF A PROSPECTUS CONTAINED IN A REGISTRATION STATEMENT FILED UNDERTHE U.S. SECURITIES ACT OF 1933, AS AMENDED) IS FOR INFORMATION PURPOSES ONLY AND ISNOT INTENDED TO BE USED OR RELIED UPON IN CONNECTION WITH THE PURCHASE OR SALE OFANY SECURITIES OF THE PROVINCE OF ONTARIO, IS NOT A PROSPECTUS, INFORMATIONMEMORANDUM OR SIMILAR DOCUMENT AND IS NOT AN OFFER TO SELL OR THE SOLICITATIONOF AN OFFER TO BUY ANY SECURITIES OF THE PROVINCE OF ONTARIO.
TABLE OF CONTENTS
Page Page
PROVINCE OF ONTARIO SUMMARY INFORMATION 3 REVENUEÏÏÏÏÏÏÏÏÏÏÏÏÏÏÏÏÏÏÏÏÏÏÏÏÏÏÏÏÏÏ 211. OVERVIEW ÏÏÏÏÏÏÏÏÏÏÏÏÏÏÏÏÏÏÏÏÏÏÏÏÏÏÏÏÏÏ 4 EXPENSE ÏÏÏÏÏÏÏÏÏÏÏÏÏÏÏÏÏÏÏÏÏÏÏÏÏÏÏÏÏÏ 262. ECONOMY ÏÏÏÏÏÏÏÏÏÏÏÏÏÏÏÏÏÏÏÏÏÏÏÏÏÏÏÏÏÏ 6 OUTLINE OF PRINCIPAL PROVINCIAL
INSTITUTIONS ÏÏÏÏÏÏÏÏÏÏÏÏÏÏÏÏÏÏÏÏÏÏÏÏ 29MAJOR ECONOMIC INDICATORS ÏÏÏÏÏÏÏÏÏÏÏ 6SINKING FUNDS ÏÏÏÏÏÏÏÏÏÏÏÏÏÏÏÏÏÏÏÏÏÏÏÏ 29RECENT ECONOMIC DEVELOPMENTS ÏÏÏÏÏÏÏ 8
4. PUBLIC DEBTÏÏÏÏÏÏÏÏÏÏÏÏÏÏÏÏÏÏÏÏÏÏÏÏÏÏÏÏ 30STRUCTURE OF THE ECONOMYÏÏÏÏÏÏÏÏÏÏÏÏ 9DEBT ÏÏÏÏÏÏÏÏÏÏÏÏÏÏÏÏÏÏÏÏÏÏÏÏÏÏÏÏÏÏÏÏÏ 30LABOUR FORCE ÏÏÏÏÏÏÏÏÏÏÏÏÏÏÏÏÏÏÏÏÏÏÏÏ 11ASSETS AND LIABILITIES ÏÏÏÏÏÏÏÏÏÏÏÏÏÏÏÏÏ 31SOCIAL SECURITY SYSTEM ÏÏÏÏÏÏÏÏÏÏÏÏÏÏÏ 12CONSOLIDATED DEBT OF THE ONTARIOGOVERNMENT RESPONSIBILITIES AND
PUBLIC SECTOR ÏÏÏÏÏÏÏÏÏÏÏÏÏÏÏÏÏÏÏÏÏÏ 41RELATIONSHIPSÏÏÏÏÏÏÏÏÏÏÏÏÏÏÏÏÏÏÏÏÏÏÏ 13SELECTED DEBT STATISTICSÏÏÏÏÏÏÏÏÏÏÏÏÏÏ 423. PUBLIC FINANCE ÏÏÏÏÏÏÏÏÏÏÏÏÏÏÏÏÏÏÏÏÏÏÏÏÏ 15FINANCIAL TABLES ÏÏÏÏÏÏÏÏÏÏÏÏÏÏÏÏÏÏÏÏÏÏ 43FINANCIAL REPORTINGÏÏÏÏÏÏÏÏÏÏÏÏÏÏÏÏÏÏÏ 15
FISCAL POSITION ÏÏÏÏÏÏÏÏÏÏÏÏÏÏÏÏÏÏÏÏÏÏÏ 19
In this document, unless otherwise speciÑed or the context otherwise requires, all dollar amounts areexpressed in Canadian dollars. All foreign currency conversions are reported at statement date exchangerates, unless otherwise speciÑed. The inverse of the noon buying rate in New York City on December 13,2006 for cable transfers in Canadian dollars, as certiÑed for customs purposes by the Federal ReserveBank of New York was $1.00 • $0.8663 (U.S.). See ""4. Public Debt Ì (4) Selected Debt Statistics ÌThe Canadian Dollar.''
In this document, statistics for the economy of the Province of Ontario (""Ontario'' or the ""Province'')are set forth on a calendar year basis at market prices, except as otherwise indicated. Economic statisticsfor recent years frequently are estimates or preliminary Ñgures which are subject to adjustment. Financialstatistics for the Province are set forth on a Ñscal year basis (from April 1 to March 31 of the succeedingyear), unless otherwise noted.
In this document, unless otherwise speciÑed, references to average growth rates refer to the averageannual compound rate of growth. This is computed by expressing the amount of growth during the periodas a constant annual rate of growth compounded annually. The computational procedure used is thegeometric average of the annual rates from the Ñrst to the last year's observation of the variables.
This document appears as an exhibit to the Province's Annual Report to the U.S. Securities andExchange Commission on Form 18-K for the Ñscal year ended March 31, 2006. Additional informationwith respect to the Province is available in such Annual Report and in amendments thereto. Such AnnualReport, exhibits and amendments are available to the public on the Internet on the SEC's web site locatedat http://www.sec.gov. and can be read and copied at the public reference facilities maintained by theCommission at 100 F Street, N.E., Room 1580, Washington, D.C. 20549. Please call the SEC at1-800-SEC-0330 for more information about the public reference room and the applicable copy charges.Copies of such documents may also be obtained without charge from the Province of Ontario, OntarioFinancing Authority, Capital Markets Division, One Dundas Street West, 14th Floor, Toronto, OntarioM5G 1Z3, telephone (416) 325-8128.
2
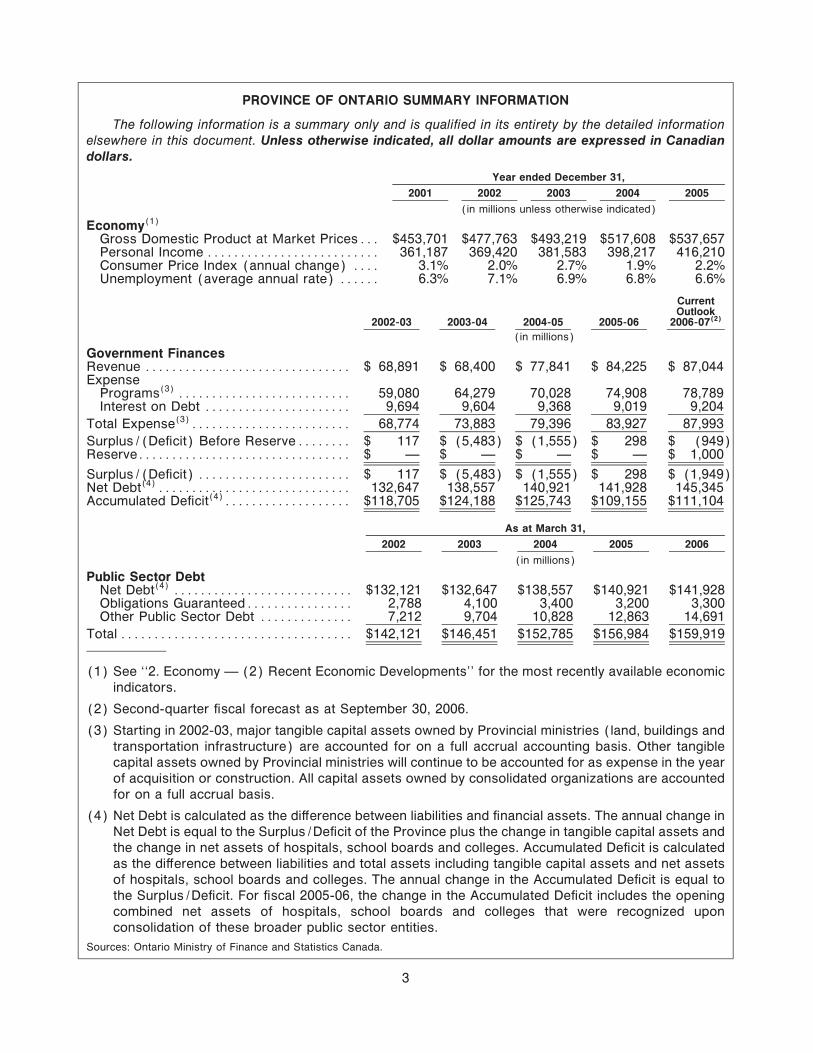
PROVINCE OF ONTARIO SUMMARY INFORMATION
The following information is a summary only and is qualiÑed in its entirety by the detailed informationelsewhere in this document. Unless otherwise indicated, all dollar amounts are expressed in Canadiandollars.
Year ended December 31,
2001 2002 2003 2004 2005
(in millions unless otherwise indicated)
Economy(1)
Gross Domestic Product at Market PricesÏÏÏ $453,701 $477,763 $493,219 $517,608 $537,657Personal Income ÏÏÏÏÏÏÏÏÏÏÏÏÏÏÏÏÏÏÏÏÏÏÏÏÏÏ 361,187 369,420 381,583 398,217 416,210Consumer Price Index (annual change) ÏÏÏÏ 3.1% 2.0% 2.7% 1.9% 2.2%Unemployment (average annual rate) ÏÏÏÏÏÏ 6.3% 7.1% 6.9% 6.8% 6.6%
CurrentOutlook
2002-03 2003-04 2004-05 2005-06 2006-07(2)
(in millions)
Government FinancesRevenue ÏÏÏÏÏÏÏÏÏÏÏÏÏÏÏÏÏÏÏÏÏÏÏÏÏÏÏÏÏÏÏ $ 68,891 $ 68,400 $ 77,841 $ 84,225 $ 87,044Expense
Programs(3) ÏÏÏÏÏÏÏÏÏÏÏÏÏÏÏÏÏÏÏÏÏÏÏÏÏÏ 59,080 64,279 70,028 74,908 78,789Interest on Debt ÏÏÏÏÏÏÏÏÏÏÏÏÏÏÏÏÏÏÏÏÏÏ 9,694 9,604 9,368 9,019 9,204
Total Expense(3)ÏÏÏÏÏÏÏÏÏÏÏÏÏÏÏÏÏÏÏÏÏÏÏÏ 68,774 73,883 79,396 83,927 87,993
Surplus/(DeÑcit) Before ReserveÏÏÏÏÏÏÏÏ $ 117 $ (5,483) $ (1,555) $ 298 $ (949)ReserveÏÏÏÏÏÏÏÏÏÏÏÏÏÏÏÏÏÏÏÏÏÏÏÏÏÏÏÏÏÏÏÏ $ Ì $ Ì $ Ì $ Ì $ 1,000
Surplus/(DeÑcit) ÏÏÏÏÏÏÏÏÏÏÏÏÏÏÏÏÏÏÏÏÏÏÏ $ 117 $ (5,483) $ (1,555) $ 298 $ (1,949)Net Debt(4)ÏÏÏÏÏÏÏÏÏÏÏÏÏÏÏÏÏÏÏÏÏÏÏÏÏÏÏÏÏ 132,647 138,557 140,921 141,928 145,345Accumulated DeÑcit(4)ÏÏÏÏÏÏÏÏÏÏÏÏÏÏÏÏÏÏÏ $118,705 $124,188 $125,743 $109,155 $111,104
As at March 31,
2002 2003 2004 2005 2006
(in millions)
Public Sector DebtNet Debt(4) ÏÏÏÏÏÏÏÏÏÏÏÏÏÏÏÏÏÏÏÏÏÏÏÏÏÏÏ $132,121 $132,647 $138,557 $140,921 $141,928Obligations GuaranteedÏÏÏÏÏÏÏÏÏÏÏÏÏÏÏÏ 2,788 4,100 3,400 3,200 3,300Other Public Sector Debt ÏÏÏÏÏÏÏÏÏÏÏÏÏÏ 7,212 9,704 10,828 12,863 14,691
Total ÏÏÏÏÏÏÏÏÏÏÏÏÏÏÏÏÏÏÏÏÏÏÏÏÏÏÏÏÏÏÏÏÏÏÏ $142,121 $146,451 $152,785 $156,984 $159,919
(1) See ""2. Economy Ì (2) Recent Economic Developments'' for the most recently available economicindicators.
(2) Second-quarter Ñscal forecast as at September 30, 2006.
(3) Starting in 2002-03, major tangible capital assets owned by Provincial ministries (land, buildings andtransportation infrastructure) are accounted for on a full accrual accounting basis. Other tangiblecapital assets owned by Provincial ministries will continue to be accounted for as expense in the yearof acquisition or construction. All capital assets owned by consolidated organizations are accountedfor on a full accrual basis.
(4) Net Debt is calculated as the diÅerence between liabilities and Ñnancial assets. The annual change inNet Debt is equal to the Surplus/DeÑcit of the Province plus the change in tangible capital assets andthe change in net assets of hospitals, school boards and colleges. Accumulated DeÑcit is calculatedas the diÅerence between liabilities and total assets including tangible capital assets and net assetsof hospitals, school boards and colleges. The annual change in the Accumulated DeÑcit is equal tothe Surplus/DeÑcit. For Ñscal 2005-06, the change in the Accumulated DeÑcit includes the openingcombined net assets of hospitals, school boards and colleges that were recognized uponconsolidation of these broader public sector entities.
Sources: Ontario Ministry of Finance and Statistics Canada.
3
1. OVERVIEW
Area and Population
The Province of Ontario covers an area of approximately 1,076,395 square kilometers(415,598 square miles), about 10.8% of Canada, and is about 11.0% as large as the United States. Theestimated population of Ontario on July 1, 2006 was 12.7 million, or 38.9% of Canada's population of32.6 million. Since 1992, the populations of Ontario and Canada have increased at average annual ratesof 1.3% and 1.0%, respectively. Although it constitutes only 12% of the area of the Province, SouthernOntario contains approximately 93.6% of the Province's population. The population of the GreaterToronto Area, the largest metropolitan area in Canada, was estimated to be 5.76 million on July 1, 2005.
Government
Canada is a federation with a parliamentary system of government. Constitutional responsibilities aredivided between the federal government, the 10 provinces and the 3 territories.
The Premier of the Province of Ontario (""Premier'') is traditionally the leader of the political partywith the greatest number of members elected to the legislative assembly of the Province (""LegislativeAssembly''). The Cabinet through the Lieutenant Governor, who represents the Crown, formallyexercises executive power. Cabinet ministers are usually nominated from among members of thePremier's party.
The Legislative Assembly consists of 103 seats, each representing a speciÑed territorial division ofthe Province, and is elected for a Ñve-year term. A dissolution of the Legislative Assembly prior to the endof the Ñve-year term may be requested by the Premier at the Premier's own volition or if the governmentloses the conÑdence of the Legislative Assembly by being defeated on an important vote.
The last Provincial election was held on October 2, 2003. Present party standings in the LegislativeAssembly are: Liberal Party of Ontario, 68 seats; Progressive Conservative Party of Ontario, 23 seats;New Democratic Party of Ontario, 9 seats and vacant, 3 seats. The current government of the Province isformed by the Liberal Party.
Economic Setting
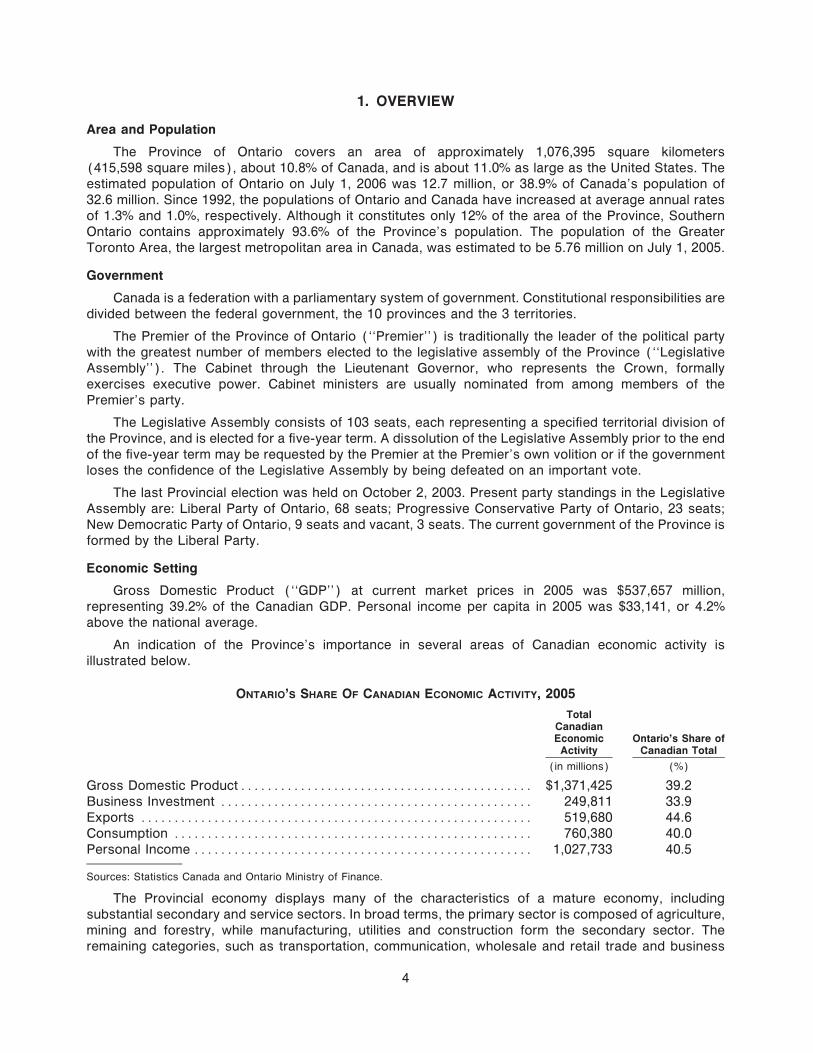
Gross Domestic Product (""GDP'') at current market prices in 2005 was $537,657 million,representing 39.2% of the Canadian GDP. Personal income per capita in 2005 was $33,141, or 4.2%above the national average.
An indication of the Province's importance in several areas of Canadian economic activity isillustrated below.
ONTARIO'S SHARE OF CANADIAN ECONOMIC ACTIVITY, 2005
TotalCanadianEconomic Ontario's Share ofActivity Canadian Total
(in millions) (%)
Gross Domestic ProductÏÏÏÏÏÏÏÏÏÏÏÏÏÏÏÏÏÏÏÏÏÏÏÏÏÏÏÏÏÏÏÏÏÏÏÏÏÏÏÏÏÏÏÏ $1,371,425 39.2Business Investment ÏÏÏÏÏÏÏÏÏÏÏÏÏÏÏÏÏÏÏÏÏÏÏÏÏÏÏÏÏÏÏÏÏÏÏÏÏÏÏÏÏÏÏÏÏÏÏ 249,811 33.9Exports ÏÏÏÏÏÏÏÏÏÏÏÏÏÏÏÏÏÏÏÏÏÏÏÏÏÏÏÏÏÏÏÏÏÏÏÏÏÏÏÏÏÏÏÏÏÏÏÏÏÏÏÏÏÏÏÏÏÏÏ 519,680 44.6Consumption ÏÏÏÏÏÏÏÏÏÏÏÏÏÏÏÏÏÏÏÏÏÏÏÏÏÏÏÏÏÏÏÏÏÏÏÏÏÏÏÏÏÏÏÏÏÏÏÏÏÏÏÏÏÏ 760,380 40.0Personal Income ÏÏÏÏÏÏÏÏÏÏÏÏÏÏÏÏÏÏÏÏÏÏÏÏÏÏÏÏÏÏÏÏÏÏÏÏÏÏÏÏÏÏÏÏÏÏÏÏÏÏÏ 1,027,733 40.5
Sources: Statistics Canada and Ontario Ministry of Finance.
The Provincial economy displays many of the characteristics of a mature economy, includingsubstantial secondary and service sectors. In broad terms, the primary sector is composed of agriculture,mining and forestry, while manufacturing, utilities and construction form the secondary sector. Theremaining categories, such as transportation, communication, wholesale and retail trade and business
4

and public service, make up the service sector. Ontario shows a stronger concentration in manufacturingthan both the United States and the whole of Canada.
PERCENTAGE DISTRIBUTION OF REAL GROSS DOMESTIC PRODUCT BY INDUSTRY, 2005
(at 1997 Prices)
Ontario Canada United States(1)
(%) (%) (%)
Goods(2) ÏÏÏÏÏÏÏÏÏÏÏÏÏÏÏÏÏÏÏÏÏÏÏÏÏÏÏÏÏÏÏÏÏÏÏÏÏÏÏÏÏÏÏÏÏÏÏÏÏÏÏÏÏ 29.1 31.0 21.3Of which: Primary ÏÏÏÏÏÏÏÏÏÏÏÏÏÏÏÏÏÏÏÏÏÏÏÏÏÏÏÏÏÏÏÏÏÏÏÏÏÏÏÏÏÏÏÏ 1.7 5.9 2.7
Manufacturing ÏÏÏÏÏÏÏÏÏÏÏÏÏÏÏÏÏÏÏÏÏÏÏÏÏÏÏÏÏÏÏÏÏÏÏÏÏÏ 19.9 16.5 12.0Services ÏÏÏÏÏÏÏÏÏÏÏÏÏÏÏÏÏÏÏÏÏÏÏÏÏÏÏÏÏÏÏÏÏÏÏÏÏÏÏÏÏÏÏÏÏÏÏÏÏÏÏÏÏ 70.8 69.0 78.7
Total(3) ÏÏÏÏÏÏÏÏÏÏÏÏÏÏÏÏÏÏÏÏÏÏÏÏÏÏÏÏÏÏÏÏÏÏÏÏÏÏÏÏÏÏÏÏÏÏÏÏÏÏÏÏÏÏ 100.0 100.0 100.0
Sources: Ontario Ministry of Finance, Statistics Canada and the United States Department of Commerce.
(1) GDP in current dollars.
(2) Consists of primary, utilities, construction and manufacturing industries.
(3) Components may not add to total due to rounding.
Foreign Relations
The Province has no direct diplomatic relations with foreign countries, but has developed a highdegree of international activity in order to facilitate investment in Ontario.
5

2. ECONOMY
(1) Major Economic Indicators
Overview
Ontario's GDP at current market prices in 2005 was $537,657 million. GDP in constant 1997 dollars(""Real GDP'') was $483,962 million in 2005, an increase of 2.8% over 2004. The Ñve-year averageannual growth rate of real GDP from 2001 to 2005 was 2.4%. Real GDP in 2005 increased at a quarterlyrate of 0.4% in the Ñrst quarter, 0.5% in the second quarter, 0.4% in the third quarter and 0.3% in thefourth quarter.
Ontario's economy grew by 2.8% in 2005, following growth of 3.2% in 2004. Economic growth wasfuelled by strong domestic demand in 2005. Consumer spending grew by 3.7% while housingconstruction advanced 1.8%. Business investment in machinery and equipment was up a strong 11.1%,partially oÅset by slower non-residential construction investment which declined by 0.8%. Despite a highCanadian dollar, Ontario exports increased for the second straight year in 2005, growing by 1.7% after a5.3% advance in 2004.
The following table provides a summary of major economic indicators for Ontario from 2001 to 2005.For the most recently available economic indicators, See ""2. Economy Ì (2) Recent EconomicDevelopments''.
MAJOR ECONOMIC INDICATORS
AverageAnnualRate of
Year ended December 31, Growth2001 2002 2003 2004 2005 2001-2005
(in millions unless otherwise indicated) (%)
Personal Expenditure on ConsumerGoods and ServicesÏÏÏÏÏÏÏÏÏÏÏÏÏÏÏ $250,261 $264,488 $276,609 $288,945 $ 304,230 4.9
Government Expenditure on Goodsand Services ÏÏÏÏÏÏÏÏÏÏÏÏÏÏÏÏÏÏÏÏÏ 87,206 92,844 100,842 105,256 111,646 6.3
Business Gross Fixed CapitalFormation ÏÏÏÏÏÏÏÏÏÏÏÏÏÏÏÏÏÏÏÏÏÏÏÏ 70,520 72,717 74,911 79,768 84,598 4.4
Exports of Goods and Services ÏÏÏÏÏÏ 315,422 322,731 310,800 326,428 329,094 0.5Imports of Goods and Services ÏÏÏÏÏÏ 267,797 275,265 270,408 284,620 296,631 1.6Adjustment for Inventory ChangesÏÏÏÏ ¿1,446 407 1,039 1,678 4,148 ÌStatistical Discrepancy and Other
Transactions ÏÏÏÏÏÏÏÏÏÏÏÏÏÏÏÏÏÏÏÏÏ ¿461 ¿159 ¿576 153 573 Ì
Gross Domestic Product at MarketPricesÏÏÏÏÏÏÏÏÏÏÏÏÏÏÏÏÏÏÏÏÏÏÏÏÏÏÏÏ 453,701 477,763 493,219 517,608 537,657 4.1
Gross Domestic Product in Constant1997 Prices ÏÏÏÏÏÏÏÏÏÏÏÏÏÏÏÏÏÏÏÏÏÏ 436,762 450,341 456,178 470,568 483,962 2.4
Gross Domestic Product PriceDeÖator (Index) ÏÏÏÏÏÏÏÏÏÏÏÏÏÏÏÏÏÏ 103.9 106.1 108.1 110.0 111.1 1.6
Personal Income (Ontario) ÏÏÏÏÏÏÏÏÏÏ 361,187 369,420 381,583 398,217 416,210 3.7Personal Income (Canada)ÏÏÏÏÏÏÏÏÏÏ 876,471 898,843 932,486 979,012 1,027,733 4.1Personal Income per Capita
(July Population):Ontario (in dollars) ÏÏÏÏÏÏÏÏÏÏÏÏÏÏÏ 30,358 30,525 31,118 32,071 33,141 2.2Canada (in dollars) ÏÏÏÏÏÏÏÏÏÏÏÏÏÏÏ 28,254 28,651 29,438 30,604 31,819 3.0
Population (July in thousands):OntarioÏÏÏÏÏÏÏÏÏÏÏÏÏÏÏÏÏÏÏÏÏÏÏÏÏÏÏ 11,898 12,102 12,263 12,417 12,559 1.4Canada ÏÏÏÏÏÏÏÏÏÏÏÏÏÏÏÏÏÏÏÏÏÏÏÏÏÏ 31,021 31,373 31,676 31,989 32,299 1.0
6

Year ended December 31, Average2001 2002 2003 2004 2005 2001-2005
Consumer Price Index(annual Change):Ontario ÏÏÏÏÏÏÏÏÏÏÏÏÏÏÏÏÏÏÏÏÏÏÏÏÏ 3.1% 2.0% 2.7% 1.9% 2.2% 2.4%CanadaÏÏÏÏÏÏÏÏÏÏÏÏÏÏÏÏÏÏÏÏÏÏÏÏÏ 2.6% 2.2% 2.8% 1.9% 2.2% 2.3%
Unemployment(average annual Rate):Ontario ÏÏÏÏÏÏÏÏÏÏÏÏÏÏÏÏÏÏÏÏÏÏÏÏÏ 6.3% 7.1% 6.9% 6.8% 6.6% 6.7%CanadaÏÏÏÏÏÏÏÏÏÏÏÏÏÏÏÏÏÏÏÏÏÏÏÏÏ 7.2% 7.7% 7.6% 7.2% 6.8% 7.3%
Totals may not add due to rounding.
Sources: Ontario Ministry of Finance and Statistics Canada.
Personal Expenditure
In 2005, personal expenditure on consumer goods and services, the largest component of GDP,increased 5.3% over 2004. From 2001 through 2005, personal expenditure increased at an averageannual rate of 4.9%.
Government Expenditure
Expenditure by the federal, provincial and municipal governments in Ontario (excluding transferpayments and subsidies) comprised 20.8% of provincial output in 2005.(1) From 2001 through 2005,government expenditure increased at an average annual rate of 6.3%.
Capital Expenditure
In 2005, total capital expenditure was $97,653 million, or 18.2% of GDP, up 5.8% from $92,286 millionin 2004. The major sources of total capital expenditure were housing (31.8%), trade, Ñnance, commercialand information and cultural industries (27.5%), institutional services and government departments(15.3%), manufacturing (10.5%), transportation, warehousing and utilities (8.5%), primary andconstruction industries (4.9%) and professional, scientiÑc and technical services (1.5%). From 2001through 2005, total capital expenditure increased at an average annual rate of 4.7%.
Business gross Ñxed capital formation in 2005 was $84,598 million. This accounted for 86.6% of totalcapital expenditure and 15.7% of GDP at current market prices.
Exports and Imports
In 2005, Ontario's exports of goods and services totaled $329,094 million, the equivalent of 61.2% ofOntario's nominal GDP, of which 70.5% were international exports and 29.5% were interprovincialexports. By comparison, Ontario international exports represented 44.6% of Canada's total exports.Ontario's imports of goods and services totaled $296,631 million in 2005, resulting in a positive overalltrade balance of $32,463 million.
Ontario's international goods exports include: motor vehicles and parts, which accounted for 44.1%of its total value of merchandise exports in 2005; capital equipment such as machinery, electrical andelectronic goods, and scientiÑc and professional equipment, which accounted for 20.5%; industrialmaterials such as steel, chemicals, plastics and rubber, which accounted for 19.2%; agricultural, forestry,energy and mining-related products, which accounted for 9.7%; and consumer goods such as furniture,drugs and clothing, which accounted for 4.2%.
Ontario's leading interprovincial exports include Ñnancial, insurance and real estate services,wholesale trade, food products, transportation equipment, chemicals and electrical equipment.
(1) The National Income and Expenditure Accounts as produced by Statistics Canada deÑnesgovernment expenditure to exclude transfer payments and subsidies.
7

Under the Free Trade Agreement (""FTA''), which came into force on January 1, 1989, tariÅsbetween the United States and Canada were phased out entirely on January 1, 1999. The North AmericanFree Trade Agreement (""NAFTA'') between Canada, Mexico and the United States, which came intoeÅect on January 1, 1994, liberalizes trade with Mexico and improves on many of the provisions of theFTA. A bilateral free-trade agreement between Canada and Chile came into force on July 5, 1997.Canada-Chile agreement, which provides for the liberalization of trade and investment between the twocountries, was negotiated to serve as an interim step to bridge Chile's accession to NAFTA. In addition, anew World Trade Organization Agreement (""WTO'') (formerly the General Agreement on Trade andTariÅs) was implemented on January 1, 1995. It has resulted in a 40% reduction in average tariÅsworldwide and makes major advances in rules governing trade in agriculture, services and intellectualproperty.
(2) Recent Economic Developments
Real output in the Ontario economy grew by 0.2% (0.8% annualized) in the second quarter of 2006,measured in 1997 dollars, down from a 0.4% pace (1.4% annualized) in the Ñrst quarter of 2006. Incurrent dollars, nominal GDP grew by 0.5% to reach an annualized level of $550.7 billion.
Real economic growth in the second quarter was supported by a 1.5% increase in businessinvestment and by Ontario consumer spending which grew by 0.9%. Final domestic demand increased by0.7% (3.0% annualized) in real terms.
Over the Ñrst ten months of 2006, Ontario employment is up by 96,400 jobs or 1.5%, compared to thesame period in 2005. The unemployment rate was 6.4% in October.
In September 2006, the Ontario Consumer Price Index (""CPI'') inÖation rate was 0.2%.
Economic Outlook: 2006 to 2009
The 2006 Ontario Economic Outlook and Fiscal Review, released on October 26, 2006, presented theforecast for the Ontario economy for 2006 to 2009. The economic forecast underlying the Ñscal plan isintended to be prudent, taking into account external developments and continuing risks. The Ministry ofFinance is projecting real GDP growth of 1.6% for 2006, 2.0% for 2007, 3.0% for 2008 and 3.1% for 2009.These projections are below the average private-sector forecast in every year. Ontario's nominal GDPgrowth is expected to be 3.0% in 2006, followed by 3.7% in 2007, 4.7% in 2008 and 4.8% in 2009.
Ontario's CPI inÖation rate is expected to average 1.9% in 2006. Ontario's CPI inÖation rate isexpected to fall to 1.6% in 2007, reÖecting lower energy prices, the impact of the 1% GST reduction and agradual slowing in home-replacement costs. Once the impact of the GST cut no longer aÅects year-to-year prices changes and energy prices stabilize, CPI inÖation is projected to rise to an average of 1.8% inboth 2008 and 2009. Ontario's unemployment rate is expected to trend down, declining from 6.3% in 2006to 6.1% in 2009.
External factors have a signiÑcant bearing on the performance of the Ontario economy anddeviations from their projected path can cause the province's growth to be slower or faster. As a result,the 2006 Ontario Economic Outlook and Fiscal Review is based on assumptions about key features of theexternal environment, including interest rates, oil prices, the exchange rate and the U.S. economy.
The Canadian three-month treasury bill rate is projected to average 4.0% in 2006, 4.2% in 2007, 4.5%in 2008 and 4.6% in 2009. Ten-year Government of Canada bond yields are forecast to average 4.3% in2006, 4.4% in 2007, 4.9% in 2008 and 5.2% in 2009. These interest rate assumptions are in line withprivate-sector forecasts. For planning purposes, crude oil prices are projected to average $67.50 US perbarrel in 2006, easing to $65 US in 2007, $64 US in 2008 and $60 US in 2009. The exchange rate isforecast to average 88.5 cents US in 2006 and 89.0 cents US in 2007, 2008 and 2009.
The strength and composition of the U.S. expansion are key determinants of the pace of growth inOntario. The U.S. economy is Ontario's largest export market. Economists project U.S. real GDP growthof 3.4 per cent in 2006, 2.6 per cent in 2007 and 3.1 per cent in 2008.
8
(3) Structure of the Economy
Secondary Industries
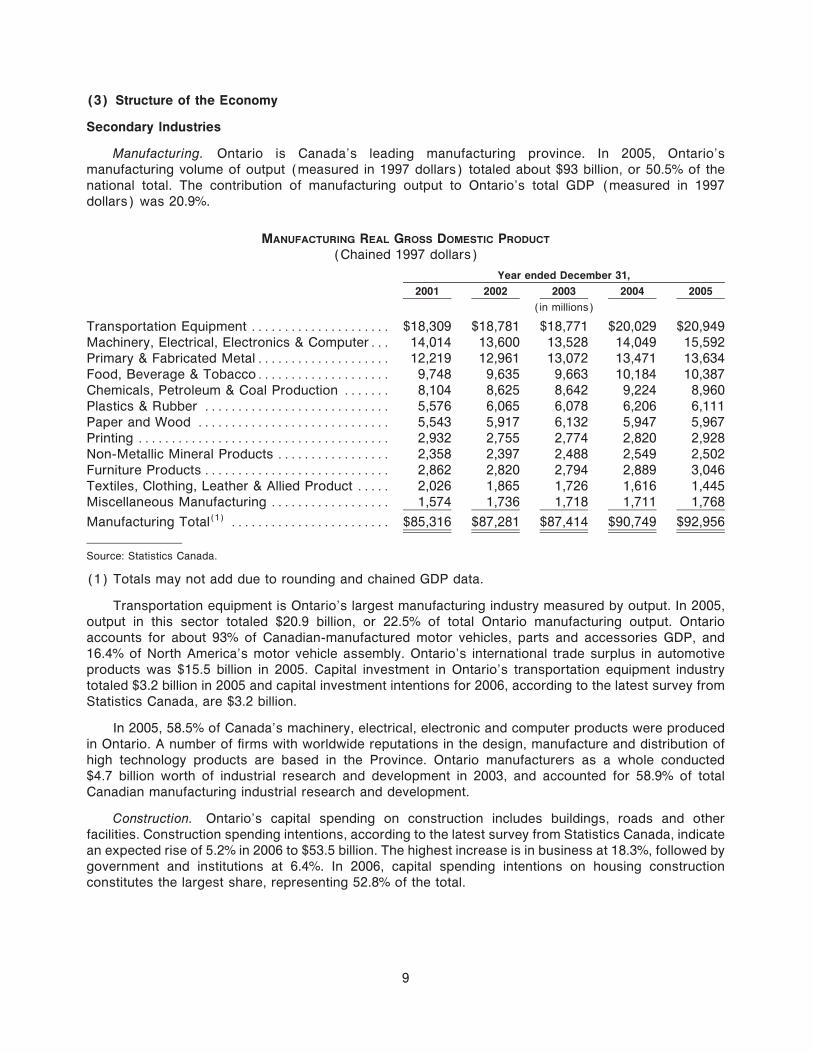
Manufacturing. Ontario is Canada's leading manufacturing province. In 2005, Ontario'smanufacturing volume of output (measured in 1997 dollars) totaled about $93 billion, or 50.5% of thenational total. The contribution of manufacturing output to Ontario's total GDP (measured in 1997dollars) was 20.9%.
MANUFACTURING REAL GROSS DOMESTIC PRODUCT
(Chained 1997 dollars)
Year ended December 31,
2001 2002 2003 2004 2005
(in millions)
Transportation Equipment ÏÏÏÏÏÏÏÏÏÏÏÏÏÏÏÏÏÏÏÏÏ $18,309 $18,781 $18,771 $20,029 $20,949Machinery, Electrical, Electronics & ComputerÏÏÏ 14,014 13,600 13,528 14,049 15,592Primary & Fabricated MetalÏÏÏÏÏÏÏÏÏÏÏÏÏÏÏÏÏÏÏÏ 12,219 12,961 13,072 13,471 13,634Food, Beverage & TobaccoÏÏÏÏÏÏÏÏÏÏÏÏÏÏÏÏÏÏÏÏ 9,748 9,635 9,663 10,184 10,387Chemicals, Petroleum & Coal Production ÏÏÏÏÏÏÏ 8,104 8,625 8,642 9,224 8,960Plastics & Rubber ÏÏÏÏÏÏÏÏÏÏÏÏÏÏÏÏÏÏÏÏÏÏÏÏÏÏÏÏ 5,576 6,065 6,078 6,206 6,111Paper and Wood ÏÏÏÏÏÏÏÏÏÏÏÏÏÏÏÏÏÏÏÏÏÏÏÏÏÏÏÏÏ 5,543 5,917 6,132 5,947 5,967Printing ÏÏÏÏÏÏÏÏÏÏÏÏÏÏÏÏÏÏÏÏÏÏÏÏÏÏÏÏÏÏÏÏÏÏÏÏÏÏ 2,932 2,755 2,774 2,820 2,928Non-Metallic Mineral Products ÏÏÏÏÏÏÏÏÏÏÏÏÏÏÏÏÏ 2,358 2,397 2,488 2,549 2,502Furniture Products ÏÏÏÏÏÏÏÏÏÏÏÏÏÏÏÏÏÏÏÏÏÏÏÏÏÏÏÏ 2,862 2,820 2,794 2,889 3,046Textiles, Clothing, Leather & Allied Product ÏÏÏÏÏ 2,026 1,865 1,726 1,616 1,445Miscellaneous Manufacturing ÏÏÏÏÏÏÏÏÏÏÏÏÏÏÏÏÏÏ 1,574 1,736 1,718 1,711 1,768
Manufacturing Total(1) ÏÏÏÏÏÏÏÏÏÏÏÏÏÏÏÏÏÏÏÏÏÏÏÏ $85,316 $87,281 $87,414 $90,749 $92,956
Source: Statistics Canada.
(1) Totals may not add due to rounding and chained GDP data.
Transportation equipment is Ontario's largest manufacturing industry measured by output. In 2005,output in this sector totaled $20.9 billion, or 22.5% of total Ontario manufacturing output. Ontarioaccounts for about 93% of Canadian-manufactured motor vehicles, parts and accessories GDP, and16.4% of North America's motor vehicle assembly. Ontario's international trade surplus in automotiveproducts was $15.5 billion in 2005. Capital investment in Ontario's transportation equipment industrytotaled $3.2 billion in 2005 and capital investment intentions for 2006, according to the latest survey fromStatistics Canada, are $3.2 billion.
In 2005, 58.5% of Canada's machinery, electrical, electronic and computer products were producedin Ontario. A number of Ñrms with worldwide reputations in the design, manufacture and distribution ofhigh technology products are based in the Province. Ontario manufacturers as a whole conducted$4.7 billion worth of industrial research and development in 2003, and accounted for 58.9% of totalCanadian manufacturing industrial research and development.
Construction. Ontario's capital spending on construction includes buildings, roads and otherfacilities. Construction spending intentions, according to the latest survey from Statistics Canada, indicatean expected rise of 5.2% in 2006 to $53.5 billion. The highest increase is in business at 18.3%, followed bygovernment and institutions at 6.4%. In 2006, capital spending intentions on housing constructionconstitutes the largest share, representing 52.8% of the total.
9

ONTARIO CONSTRUCTION CAPITAL EXPENDITURE
Year ended December 31,
2001 2002 2003 2004 2005 2006(1)
(in millions)
Housing ÏÏÏÏÏÏÏÏÏÏÏÏÏÏÏÏÏÏÏÏÏÏÏÏÏÏÏ $20,554 $23,387 $25,233 $27,471 $28,552 $28,252
Business ÏÏÏÏÏÏÏÏÏÏÏÏÏÏÏÏÏÏÏÏÏÏÏÏÏÏ 10,999 11,220 11,344 12,262 12,603 14,914
Government and InstitutionsÏÏÏÏÏÏÏÏÏ 7,443 8,755 9,739 9,259 9,729 10,353
Total ÏÏÏÏÏÏÏÏÏÏÏÏÏÏÏÏÏÏÏÏÏÏÏÏÏÏÏÏÏÏ $38,996 $43,362 $46,316 $48,992 $50,884 $53,518
Source: Statistics Canada.
(1) 2006 intentions.
Primary Industries
Agriculture. Ontario has a large and highly diversiÑed agricultural sector. Agricultural activity can befound in most areas of the Province, but production is concentrated in southwestern Ontario, which islocated at roughly the same latitude as Northern California and has a climate moderated by the GreatLakes. Provincial agricultural production, based on farm cash receipts, was valued at $8.21 billion in2005, or 25.7% of the Canadian total. Of this, total livestock receipts were $4.56 billion, and crop receiptswere $3.65 billion.
AGRICULTURAL PRODUCTION
Year ended December 31,
2001 2002 2003 2004 2005
(in millions)
Agricultural Production(1) ÏÏÏÏÏÏÏÏÏÏÏÏÏÏÏÏÏÏÏÏÏÏÏÏÏÏÏ $7,777 $7,880 $7,896 $7,936 $8,211
Source: Statistics Canada.
(1) Farm cash receipts; excluding government program payments.
Mining. Ontario's value of mineral production was $7,215 million in 2005. Ontario accounted for30.0% of Canadian mineral production in 2005, excluding oil and gas. The Province's most importantminerals in terms of 2005 value of production were: nickel, $2,116 million; gold, $1,227 million; copper$797 million, cement, $659 million; stone, $552 million and sand and gravel, $463 million. Ontario's valueof mineral production was more than $7 billion for the second year in a row due to higher prices for nickeland other metals.
MINERAL PRODUCTION
Year ended December 31,
2001 2002 2003 2004 2005
(in millions)
Mineral Production ÏÏÏÏÏÏÏÏÏÏÏÏÏÏÏÏÏÏÏÏÏÏÏÏÏÏÏÏÏÏÏÏÏ $5,635 $5,937 $5,690 $7,222 $7,215
Source: Natural Resources Canada.
Forestry. Ontario has about 557,000 square kilometers of productive forestland representing 63%of Ontario's total land area. Timber harvests amounted to approximately 25.2 million cubic meters in2004. This supported various wood and paper industries in the Province whose value of shipmentstotaled $16.7 billion in 2005, and equaled 25.6% of the Canadian total.
Energy
In 2003, the composition of Ontario's primary energy consumption was: crude oil 30.8%, natural gasand liquids 34.8%, coal 15.1%, nuclear 6.5%, hydro-generated electricity 3.8%, biomass 2.5%, and netinÖow of secondary energy 6.4%.
10

Total primary energy consumption in 2003 was 3,435 Petajoules, an increase of 1.1% from 3,396Petajoules in 2002. There were small declines in the use of crude oil and coal, and no change in the use ofnatural gas and natural gas liquids. Net secondary inÖows increased from 165 Petajoules to221 Petajoules. Secondary inÖows consist mainly of automotive fuels of which Ontario is a net importer,plus adjustments such as inventory changes.
Service Sector
The service sector is the largest component of Ontario's economy, accounting for approximately 70%of Ontario's GDP (measured in 1997 dollars) in 2005. Ontario has a modern and diversiÑed servicessector. It includes a wide variety of industries serving businesses, individuals and governments.
SERVICES PRODUCING INDUSTRIES REAL GROSS DOMESTIC PRODUCT
(measured in 1997 dollars)
Year ended December 31,
2001 2002 2003 2004 2005
(in millions)
Finance, Insurance and Real Estate(1) ÏÏÏÏ $ 55,999 $ 57,150 $ 58,064 $ 60,414 $ 62,481Wholesale and Retail Trade ÏÏÏÏÏÏÏÏÏÏÏÏÏÏ 47,376 49,685 51,564 53,769 56,837Professional, ScientiÑc & Technical
ServicesÏÏÏÏÏÏÏÏÏÏÏÏÏÏÏÏÏÏÏÏÏÏÏÏÏÏÏÏÏÏ 20,996 21,335 21,756 22,034 22,280Information and Cultural Industries ÏÏÏÏÏÏÏ 17,289 17,753 18,082 18,164 18,846Transportation and Warehousing ÏÏÏÏÏÏÏÏÏ 16,615 16,637 16,735 17,358 17,944Administrative & Other Support Services ÏÏ 9,635 10,576 11,040 11,279 11,574Accommodation and Food Services ÏÏÏÏÏÏ 8,775 8,864 8,115 8,265 8,264Arts, Entertainment and RecreationÏÏÏÏÏÏÏ 3,774 3,834 4,010 4,018 4,010Health Care and Social Assistance ÏÏÏÏÏÏÏ 21,699 22,233 23,127 23,715 24,131Government ServicesÏÏÏÏÏÏÏÏÏÏÏÏÏÏÏÏÏÏÏÏ 19,674 20,222 21,006 21,396 21,844Educational Services ÏÏÏÏÏÏÏÏÏÏÏÏÏÏÏÏÏÏÏÏ 17,069 17,409 17,554 17,853 18,594Owner-Occupied HousingÏÏÏÏÏÏÏÏÏÏÏÏÏÏÏÏ 31,305 32,247 33,413 34,297 35,410Other ServicesÏÏÏÏÏÏÏÏÏÏÏÏÏÏÏÏÏÏÏÏÏÏÏÏÏÏ 9,433 9,843 9,919 10,049 10,202
Total(2)ÏÏÏÏÏÏÏÏÏÏÏÏÏÏÏÏÏÏÏÏÏÏÏÏÏÏÏÏÏÏÏÏÏ $279,639 $287,788 $294,385 $302,610 $312,417
Source: Statistics Canada.
(1) Excluding owner-occupied housing.
(2) Totals may not add due to rounding.
Finance, insurance and real estate are the largest component of Ontario's service sector output. In2005, Ontario's share accounted for 48.9% of Canada's Ñnance, insurance and real estate output, thehighest share of any province.
Ontario's sizable Ñnancial services sector is a by-product of the large number of head oÇces ofindustrial and Ñnancial companies located in the Toronto area. The Toronto Stock Exchange (""TSX'') isCanada's premiere stock exchange with a value of trading of just over one trillion dollars in 2005.
Ontario also has strong professional, scientiÑc and technical services output, accounting for 48.5% ofthe Canadian total. Wholesale and retail trade help support the spending of business and consumers,including investment and imports. Ontario accounts for 43.9% of Canada's wholesale and retail tradeoutput and 42.7% of Canada's information and cultural services.
(4) Labour Force
From 2000 to 2005, Ontario's labour force increased at an average annual rate of 2.2%, whileCanada's increased at an average annual rate of 1.8%. During 2005, the Ontario labour force averagedapproximately 6.8 million persons. In 2005, the Ontario participation rate of 68.0% was 0.8 percentagepoints higher than the Canadian rate. ReÖecting the industrial structure of the Province, 98.5% of
11
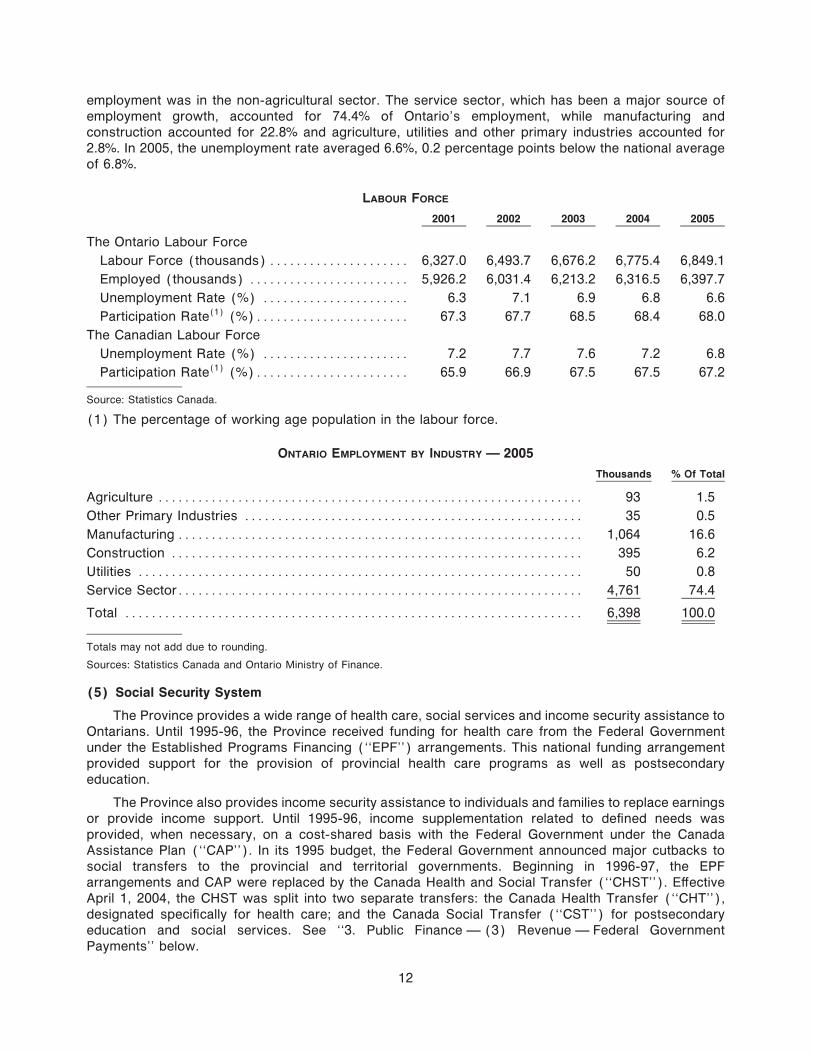
employment was in the non-agricultural sector. The service sector, which has been a major source ofemployment growth, accounted for 74.4% of Ontario's employment, while manufacturing andconstruction accounted for 22.8% and agriculture, utilities and other primary industries accounted for2.8%. In 2005, the unemployment rate averaged 6.6%, 0.2 percentage points below the national averageof 6.8%.
LABOUR FORCE
2001 2002 2003 2004 2005
The Ontario Labour Force
Labour Force (thousands) ÏÏÏÏÏÏÏÏÏÏÏÏÏÏÏÏÏÏÏÏÏ 6,327.0 6,493.7 6,676.2 6,775.4 6,849.1
Employed (thousands) ÏÏÏÏÏÏÏÏÏÏÏÏÏÏÏÏÏÏÏÏÏÏÏÏ 5,926.2 6,031.4 6,213.2 6,316.5 6,397.7
Unemployment Rate (%) ÏÏÏÏÏÏÏÏÏÏÏÏÏÏÏÏÏÏÏÏÏÏ 6.3 7.1 6.9 6.8 6.6
Participation Rate(1) (%)ÏÏÏÏÏÏÏÏÏÏÏÏÏÏÏÏÏÏÏÏÏÏÏ 67.3 67.7 68.5 68.4 68.0
The Canadian Labour Force
Unemployment Rate (%) ÏÏÏÏÏÏÏÏÏÏÏÏÏÏÏÏÏÏÏÏÏÏ 7.2 7.7 7.6 7.2 6.8
Participation Rate(1) (%)ÏÏÏÏÏÏÏÏÏÏÏÏÏÏÏÏÏÏÏÏÏÏÏ 65.9 66.9 67.5 67.5 67.2
Source: Statistics Canada.
(1) The percentage of working age population in the labour force.
ONTARIO EMPLOYMENT BY INDUSTRY Ì 2005
Thousands % Of Total
Agriculture ÏÏÏÏÏÏÏÏÏÏÏÏÏÏÏÏÏÏÏÏÏÏÏÏÏÏÏÏÏÏÏÏÏÏÏÏÏÏÏÏÏÏÏÏÏÏÏÏÏÏÏÏÏÏÏÏÏÏÏÏÏÏÏÏ 93 1.5
Other Primary Industries ÏÏÏÏÏÏÏÏÏÏÏÏÏÏÏÏÏÏÏÏÏÏÏÏÏÏÏÏÏÏÏÏÏÏÏÏÏÏÏÏÏÏÏÏÏÏÏÏÏÏÏ 35 0.5
Manufacturing ÏÏÏÏÏÏÏÏÏÏÏÏÏÏÏÏÏÏÏÏÏÏÏÏÏÏÏÏÏÏÏÏÏÏÏÏÏÏÏÏÏÏÏÏÏÏÏÏÏÏÏÏÏÏÏÏÏÏÏÏÏ 1,064 16.6
Construction ÏÏÏÏÏÏÏÏÏÏÏÏÏÏÏÏÏÏÏÏÏÏÏÏÏÏÏÏÏÏÏÏÏÏÏÏÏÏÏÏÏÏÏÏÏÏÏÏÏÏÏÏÏÏÏÏÏÏÏÏÏÏ 395 6.2
Utilities ÏÏÏÏÏÏÏÏÏÏÏÏÏÏÏÏÏÏÏÏÏÏÏÏÏÏÏÏÏÏÏÏÏÏÏÏÏÏÏÏÏÏÏÏÏÏÏÏÏÏÏÏÏÏÏÏÏÏÏÏÏÏÏÏÏÏÏ 50 0.8
Service SectorÏÏÏÏÏÏÏÏÏÏÏÏÏÏÏÏÏÏÏÏÏÏÏÏÏÏÏÏÏÏÏÏÏÏÏÏÏÏÏÏÏÏÏÏÏÏÏÏÏÏÏÏÏÏÏÏÏÏÏÏÏ 4,761 74.4
Total ÏÏÏÏÏÏÏÏÏÏÏÏÏÏÏÏÏÏÏÏÏÏÏÏÏÏÏÏÏÏÏÏÏÏÏÏÏÏÏÏÏÏÏÏÏÏÏÏÏÏÏÏÏÏÏÏÏÏÏÏÏÏÏÏÏÏÏÏÏ 6,398 100.0
Totals may not add due to rounding.
Sources: Statistics Canada and Ontario Ministry of Finance.
(5) Social Security System
The Province provides a wide range of health care, social services and income security assistance toOntarians. Until 1995-96, the Province received funding for health care from the Federal Governmentunder the Established Programs Financing (""EPF'') arrangements. This national funding arrangementprovided support for the provision of provincial health care programs as well as postsecondaryeducation.
The Province also provides income security assistance to individuals and families to replace earningsor provide income support. Until 1995-96, income supplementation related to deÑned needs wasprovided, when necessary, on a cost-shared basis with the Federal Government under the CanadaAssistance Plan (""CAP''). In its 1995 budget, the Federal Government announced major cutbacks tosocial transfers to the provincial and territorial governments. Beginning in 1996-97, the EPFarrangements and CAP were replaced by the Canada Health and Social Transfer (""CHST''). EÅectiveApril 1, 2004, the CHST was split into two separate transfers: the Canada Health Transfer (""CHT''),designated speciÑcally for health care; and the Canada Social Transfer (""CST'') for postsecondaryeducation and social services. See ""3. Public Finance Ì (3) Revenue Ì Federal GovernmentPayments'' below.
12

The Federal Government also administers the Employment Insurance (""EI'') program, a national,contributory unemployment insurance scheme, and the Canada Pension Plan (""CPP''), a national,contributory earnings-related pension system. CPP beneÑts include retirement pensions, disabilitypensions, survivor beneÑts, orphans' beneÑts and death beneÑts. In 2005, Ontario residents receivedabout $12.4 billion in beneÑts from the CPP and about $4.3 billion in total beneÑts from EI. Both of theseprograms are Ñnanced through payroll taxes paid by employers and employees. The EI Account isincluded in the federal budget and is administered through a federal ministry. The CPP Account isseparate from the federal budget, managed independently by the CPP Investment Board and invested inmarketable and non-marketable securities.
The Federal Government also provides universal and income-tested support for senior citizensthrough Old Age Security (""OAS'') pensions, the Guaranteed Income Supplement (""GIS'') program andSpouse's Allowance. The Ontario government provides an income-tested supplement for seniors, theGuaranteed Annual Income System (""GAINS''), which is paid to GIS recipients with low incomes. In2005, seniors in Ontario received a total of about $10.6 billion from these federal programs and about$100 million from GAINS.
In addition, the federal and provincial governments provide cash transfers to families raising children.The federally administered Canada Child Tax BeneÑt (""CCTB'') and National Child BeneÑt (""NCB'')Supplement provide basic beneÑts to most families with children and targeted beneÑts to low-incomefamilies with children. In 2004 Ontario families received about $3.1 billion in beneÑts from theseprograms. The Ontario government provides children's beneÑts through the Ontario Child CareSupplement (""OCCS'') for Working Families. The OCCS provides approximately $200 million annually intax-free beneÑts to low- to middle-income working families with young children.
The Ontario government and municipalities jointly share responsibility for providing income supportto individuals and families whose income is insuÇcient to meet their basic needs. In 2005-06, theProvince provided an estimated $4.9 billion through social assistance and related programs. Twenty percent of the expenditure in respect of Ñnancial assistance for persons with disabilities and drug beneÑtsfor all recipients was recovered from municipalities in the same year.
(6) Government Responsibilities and Relationships
Constitutional Framework
Canada is a federation and its constitution (""Constitution'') provides for a division of responsibilitiesbetween the federal and provincial governments. Each province and the Federal Government havesupremacy within its respective sphere of assigned responsibilities. Jurisdiction over the establishmentand operation of municipalities is granted exclusively to the provinces.
The Federal Government is empowered to raise money by any mode or system of taxation. It hasexclusive jurisdiction over such matters as the regulation of trade and commerce, currency and coinage,banks and banking, national defence, foreign aÅairs, postal services, railways and navigation, as well asthose areas not exclusively assigned to the provinces. Each province has authority to raise revenuethrough direct taxation within the province. Areas of provincial constitutional authority include health care,education, social services, municipal institutions, property and civil rights and natural resources.
The Constitution of Canada was amended in 1982. The Constitution Act, 1982 (""Constitution Act'')established a Charter of Rights and Freedoms and a procedure for amending the Constitution. Nothing inthe Constitution Act diminishes the taxing or spending authority of the provinces.
Operational Framework
Ontario administers its constitutional responsibilities through government ministries and provinciallycreated bodies such as government-owned corporations (""Crown corporations''), agencies, boards,commissions, municipalities, school boards and hospital boards. The use of these quasi-independentbodies decentralizes the administration of provincial responsibilities. However, the Province has electedto centralize the Ñnancing of these bodies by retaining the major taxing and borrowing powers at theprovincial level. Some municipalities borrow in their own names in various capital markets (See ""4. PublicDebt Ì (3) Consolidated Debt of the Ontario Public Sector'' below) as did Ontario Hydro prior to its
13

restructuring in April 1999 (See ""4. Public Debt Ì (2) Assets and Liabilities, (iii) Liabilities Ì OntarioElectricity Industry'' below).
Implications for Provincial Financial Statements
The provinces have been assisted with their responsibilities in areas such as health, postsecondaryeducation and social assistance by transfer payment arrangements between the federal and provincialgovernments. Through these arrangements, the Federal Government provides revenues to provincialgovernments to Ñnance programs under provincial jurisdiction.
Federal-provincial funding arrangements create extensive Ñnancial interrelationships between theProvince, the Federal Government and provincially-created bodies. These Ñnancial interrelationships areimportant in understanding the revenue, expense and Ñnancing activity of the Province. For example, inÑscal 2006-07, approximately 16.1% of the Province's revenue is expected to come from the FederalGovernment.
Investing in provincially-created bodies has an impact on the reporting of assets. As at March 31,2006, approximately 36.2% (2005, 29.8%) of the Financial Assets of the Province could be attributed tothese intermediary activities. (See ""4. Public Debt Ì (2) Assets and Liabilities'' below).
14

3. PUBLIC FINANCE
(1) Financial Reporting
Annually, the Province publishes its Public Accounts, which include the Annual Report andConsolidated Financial Statements for the Ñscal year ended March 31, together with ministry statements,detailed schedules of ministry expenses, Ñnancial statements of signiÑcant provincial corporations,boards and commissions that are part of the government reporting entity and other miscellaneousÑnancial statements. The Auditor General of Ontario examines the Public Accounts of the Province andprovides an opinion on the Consolidated Financial Statements to the Legislative Assembly. In addition,the Auditor General of Ontario is required to submit an annual report to the Legislative Assembly.
Summary of SigniÑcant Accounting Policies
Basis of Accounting
The Consolidated Financial Statements are prepared in accordance with the accounting principles forgovernments recommended by the Public Sector Accounting Board (""PSAB'') of the Canadian Instituteof Chartered Accountants (""CICA'') and, where applicable, the recommendations of the AccountingStandards Board (""AcSB'') of the CICA.
Reporting Entity
The Consolidated Financial Statements report the activities of the Consolidated Revenue Fundcombined with those organizations that are controlled by the government as deÑned in PSAB standards.
Commencing April 1, 2005 public hospitals, specialty psychiatric hospitals, school boards, schoolauthorities and colleges, collectively referred to as the ""Broader Public Sector (BPS) organizations'', areincluded in the government reporting entity under the revised PSAB accounting standard. The BPSorganizations are consolidated on a sector basis in the Ñnancial statements.
Other organizations that are controlled by the Province are individually consolidated provided theymeet one of the following criteria: i) their revenues, expenses, assets or liabilities are greater than$50 million, or ii) their outside sources of revenues, deÑcit or surplus are greater than $10 million.
The activities of smaller organizations that do not meet the above criteria are reÖected in the Ñnancialstatements through the accounts of the ministries responsible for them. Trusts administered by thegovernment on behalf of other parties are excluded from the reporting entity.
Principles of Consolidation
Government organizations, except for government business enterprises and broader public sectororganizations, are consolidated on a line-by-line basis with the Consolidated Revenue Fund in theConsolidated Financial Statements. Where necessary, adjustments are made to present the accounts ofthese organizations on a basis consistent with the accounting policies described below, and to eliminatesigniÑcant inter-organization accounts and transactions.
Government business enterprises are deÑned as those government organizations that i) have theÑnancial and operating authority to carry on a business, ii) have as their principal activity and source ofrevenue the selling of goods and services to individuals and non-government organizations and iii) areable to maintain their operations and meet their obligations from revenues generated outside thegovernment reporting entity. The activities of government business enterprises are recorded in theÑnancial statements using the modiÑed equity method. Under this method, their combined net assets areincluded in the Ñnancial statements as Investment in Government Business Enterprises on theConsolidated Statement of Financial Position and their combined net income is shown as a separate item,Income from Investment in Government Business Enterprises, on the Consolidated Statement ofOperations. Government business enterprises are reported in accordance with the accounting principlesgenerally accepted for business enterprises.
Broader Public Sector organizations are recorded in the Ñnancial statements using the modiÑedequity method. Under the modiÑed equity method, their combined net assets are included in the
15
Consolidated Statement of Financial Position as Net Assets of Broader Public Sector Organizations.Their combined net expenses, that is, the total annual expenses of all BPS organizations net of revenuesthey receive from sources other than the Province, are included on a sector basis in Expenses on theConsolidated Statement of Operations. The combined net expenses of hospitals are included with Healthexpenses, school board net expenses are included with Education expenses, and college net expensesare included in Training, Colleges and Universities expenses in the Consolidated Statement ofOperations. SigniÑcant gains and losses resulting from inter-organizational transactions occurring fromwithin the government reporting entity are eliminated upon consolidation. BPS organizations are reportedin accordance with the accounting principles generally accepted for their sector, except that the schoolboards sector has been adjusted to a full accrual basis of accounting upon consolidation.
Measurement Uncertainty
Uncertainty in the determination of the amount at which an item is recognized in the Ñnancialstatements is known as measurement uncertainty. Such uncertainty exists when it is reasonably possiblethat there could be a material variance between the recognized amount and another reasonably possibleamount.
Measurement uncertainty in the Ñnancial statements and notes thereto exists in the valuation of thepower purchase contracts, the accruals for pensions and other employee future beneÑts obligations, thevalue of tangible capital assets, and the accruals for personal income and corporations tax revenues.
The nature of the uncertainty in the valuation of the power purchase contracts arises fromÖuctuations in market prices that would impact this liability. The uncertainty related to pensions and otheremployee future beneÑts accruals arises because actual results may diÅer signiÑcantly from theProvince's best estimate of expected results (for example, diÅerence between actual results andactuarial assumptions regarding return on investment of pension fund assets and health care cost trendrates for retiree beneÑts). Uncertainty in the value of tangible capital assets exists because estimates ofhistorical cost are used when actual cost is unknown and because of diÅerences between estimateduseful lives and actual useful lives. Uncertainty related to the accrual for personal income tax andcorporations tax revenues arises because of the possible diÅerences between the estimated and actualeconomic growth and the impact of future tax assessments on taxes receivable.
Estimates are based on the best information available at the time of preparation of the Ñnancialstatements and are reviewed annually to reÖect new information as it becomes available.
Revenues
Revenues are recognized in the Ñscal year that the events giving rise to the revenues occur and theyare earned. Amounts received prior to the end of the year, which relate to revenues that will be earned ina subsequent Ñscal year, are deferred and reported as liabilities.
Expenses
Expenses are recognized in the Ñscal year that the events giving rise to the expense occur andresources are consumed. Expenses include:
‚ The incurrence of liabilities for goods or services consumed,
‚ Transfer payments authorized and owing to recipients,
‚ Interest accruing on debt,
‚ Pension and other employee future beneÑts,
‚ The amortization of tangible capital assets, and
‚ Losses in the value of assets.
Transfer payments are recognized in the year during which the payment is authorized, all eligibilitycriteria are met and a reasonable estimate of the amount can be made.
Interest on Debt includes the following: i) interest on outstanding debt net of interest income oninvestments and loans; ii) amortization of foreign exchange gains or losses; iii) amortization of debt
16

discounts, premiums and commissions; iv) amortization of deferred hedging gains and losses; andv) servicing and other costs.
Employee future beneÑts such as pensions, other retirement beneÑts and entitlements upontermination are recognized as expenses over the years in which the beneÑts are earned by employees.These expenses are the government's share of the cost of beneÑts including the current year's cost ofbeneÑts, interest on the net beneÑts liability or surplus, amortization of actuarial gains or losses, cost ofor gain on plan amendment and other adjustments.
Other employee future beneÑts are either recognized in the period the event that obligates thegovernment occurs or when the beneÑts are earned and accumulated by employees.
The costs of buildings and transportation infrastructure owned by the Province are amortized andrecognized as expenses over their estimated useful lives on a straight-line basis. Amortization of tangiblecapital assets owned by government organizations consolidated in the Ñnancial statements is alsoincluded in expenses.
The Province is phasing in the implementation of PSAB recommendations on tangible capital assets.Consequently, the costs of acquisition of other tangible capital assets owned by the Province, such asfurniture and vehicles, are recorded as expenses. Also, for signiÑcant capital leases entered into by theProvince, an amount equal to the present value of the minimum lease payments required over the term ofthe lease continues to be recorded as an expense at the inception of the lease, with an oÅsetting liabilityrecorded for the lease obligation.
Liabilities
Liabilities are recorded to the extent that they represent present obligations of the government tooutside parties as a result of events and transactions occurring prior to the end of the Ñscal year. Thesettlement of liabilities will result in sacriÑce of economic beneÑts in the future.
Liabilities include probable losses on loan guarantees issued by the government, and contingencieswhen it is likely that a loss will be realized and the amount can be reasonably determined.
Liabilities also include obligations to government business enterprises.
Debt
Debt is comprised of treasury bills, commercial paper, medium and long-term notes, savings bonds,debentures and loans.
Debt denominated in foreign currencies that has been hedged is recorded at the Canadian dollarequivalent using the rates of exchange established by the terms of the hedge agreements. Other foreigncurrency debt, liabilities and assets are translated to Canadian dollars at year-end rates of exchange andany exchange gains or losses are amortized over the remaining term to maturity.
The Province uses derivative Ñnancial instruments (derivatives) for the purposes of minimizinginterest costs and to manage risk. The Province does not use derivatives for speculative purposes.Derivatives are Ñnancial contracts, the value of which is derived from underlying instruments. Gains orlosses arising from derivative transactions are deferred and amortized over the remaining life of therelated debt issue.
Pensions and Other Employee Future BeneÑts
The liabilities for pensions and other employee future beneÑts are calculated on an actuarial basisusing the government's best estimates of future inÖation rates, investment returns, employee salarylevels and other underlying assumptions, and where applicable, the government's borrowing rate. Whenactual plan experience of pensions, other retirement beneÑts and termination pay diÅers from thatexpected, or when assumptions are revised, actuarial gains and losses arise. These gains and losses areamortized over the expected average remaining service life of plan members.
The liabilities for Employee Future BeneÑts such as pensions, other retirement beneÑts andtermination pay represent the government's share of the actuarial present values of beneÑts attributed toservices rendered by employees and former employees, less its share of the assets of the plans. In
17

addition, the liability includes the Province's share of the unamortized balance of actuarial gains orlosses, and other adjustments primarily for diÅerences between the Ñscal year-ends of the pension plansand the Province.
Assets
Assets are resources controlled by the government from which it will derive future beneÑts. Assetsare recognized in the year the events giving rise to the government's control of the beneÑt occur.
Financial Assets
Financial assets are resources that can be used to discharge existing liabilities or Ñnance futureoperations. They include cash, temporary investments, accounts receivable, loans receivable, advances,and investments in government business enterprises.
Temporary investments are recorded at the lower of cost or fair value.
Accounts receivables are recorded at cost. Valuation allowances are made when collectibility isconsidered doubtful.
Loans receivable with signiÑcant concessionary terms are considered in part as grants and arerecorded on the date of issuance at face value discounted by the amount of the grant portion. The grantportion is recognized as an expense at the date of issuance of the loan. The amount of the loan discountis amortized to revenue over the term of the loan. Loans receivable include amounts owing fromgovernment business enterprises.
Investment in Government Business Enterprises represents the net assets of government businessenterprises recorded on the modiÑed equity basis as described under Principles of Consolidation.
Net Assets of Broader Public Sector Organizations
The net assets of the broader public sector (BPS) organizations are comprised of tangible capitalassets and Ñnancial assets of BPS organizations net of their liabilities. While the assets of BPSorganizations are consolidated, they are owned, managed and operated by members of the BPSorganizations. Tangible capital assets of hospitals and colleges are recorded at historical cost in theirÑnancial statements. Although school boards do not presently record tangible capital assets in theirÑnancial statements, their Ñnancial information has been adjusted upon consolidation to recognize theestimated historical cost of their land and building assets.
Tangible Capital Assets
Tangible capital assets are recorded at historical cost. Historical cost includes the costs directlyrelated to the acquisition, design, construction, development, improvement or betterment of tangiblecapital assets. Cost includes overheads directly attributable to construction and development butexcludes interest. Estimated historical cost was used to record existing tangible capital assets if actualcost was unknown when the Province Ñrst implemented tangible capital assets accounting.
As the Province is phasing in the implementation of PSAB recommendations on provincially ownedtangible capital assets, the following categories are included under tangible capital assets and recordedat historical cost: land, buildings and transportation infrastructure owned by the Province; and all tangiblecapital assets owned by government organizations that are consolidated in the Ñnancial statements. Theremaining other tangible capital assets comprised primarily of leased assets, computers, equipment,vehicles and furniture are expensed as acquired. The Province intends to apply PSAB'srecommendations on the remaining other tangible capital assets in 2008-09.
Maintenance and repair costs are recognized as an expense when incurred. Betterments orimprovements that signiÑcantly increase or prolong the service life or capacity of a tangible capital assetare capitalized.
Trust Funds
Trust funds that have been deposited into the Consolidated Revenue Fund are included in OtherLiabilities on the Consolidated Statement of Financial Position.
18

The Budget
Traditionally, a Budget is tabled each year by the Ontario Minister of Finance in the LegislativeAssembly, setting out the expense and revenue forecast for activities to be undertaken for Provincialpurposes. In addition, a publication entitled ""Ontario Finances'' provides a quarterly update to reÖectin-year developments, budget performance and policy actions and the ""Ontario Economic Outlook andFiscal Review'' traditionally provides a more comprehensive update of second quarter numbers.
(2) Fiscal Position
The following table provides an overview of the Province's revenue and expense for each of theÑscal years in the Ñve-year period ending March 31, 2006 plus the current outlook for 2006-07 aspresented in the 2006 Ontario Economic Outlook and Fiscal Review. Beginning with the 2006 OntarioBudget, the presentation of expense changed to provide details on a total expense basis, rather thandiÅerentiating between operating and capital expense. This change in presentation is consistent withPublic Sector Accounting Board principles.
ONTARIO'S FISCAL POSITION
Current Rate of GrowthActual Outlook(1) 2005-06 to
2001-02 2002-03 2003-04 2004-05 2005-06 2006-07 2006-07
(%)(in millions)
RevenueTaxation RevenueÏÏÏÏÏÏÏÏÏÏÏÏ $48,025 $49,551 $49,148 $55,975 $59,917 $61,559 2.7
Government of CanadaÏÏÏÏÏ 7,754 8,894 9,893 11,882 13,251 14,038 5.9Income from Investment In
Government BusinessEnterprises ÏÏÏÏÏÏÏÏÏÏÏÏÏÏ 3,345 3,942 3,070 3,578 4,308 3,920 (9.0)
Other Revenue ÏÏÏÏÏÏÏÏÏÏÏÏ 7,410 6,504 6,289 6,406 6,749 7,527 11.5
Total Revenue ÏÏÏÏÏÏÏÏÏÏÏÏÏÏÏ 66,534 68,891 68,400 77,841 84,225 87,044 3.3
ExpensePrograms(2) ÏÏÏÏÏÏÏÏÏÏÏÏÏÏÏ 55,822 59,080 64,279 70,028 74,908 78,789 5.2Interest on Debt ÏÏÏÏÏÏÏÏÏÏÏ 10,337 9,694 9,604 9,368 9,019 9,204 2.1
Total Expense(2) ÏÏÏÏÏÏÏÏÏÏÏÏÏ 66,159 68,774 73,883 79,396 83,927 87,993 4.8
Surplus/(DeÑcit) BeforeReserveÏÏÏÏÏÏÏÏÏÏÏÏÏÏÏÏÏÏÏ 375 117 (5,483) (1,555) 298 (949) n/a
ReserveÏÏÏÏÏÏÏÏÏÏÏÏÏÏÏÏÏÏÏÏÏ Ì Ì Ì Ì Ì 1,000 n/aSurplus/(DeÑcit) ÏÏÏÏÏÏÏÏÏÏÏÏ $ 375 $ 117 $(5,483)$(1,555)$ 298 $(1,949) n/a
Source: Ontario Ministry of Finance.
Note: Starting in 2005-06, the Province's Ñnancial reporting was expanded to include hospitals, schoolboards and colleges of applied arts and technology using one-line consolidation. Total expenseprior to 2005-06 has not been restated to reÖect expanded reporting.
(1) Second-quarter Ñscal forecast as at September 30, 2006.
(2) Starting in 2002-03, major tangible capital assets owned by Provincial ministries (land, buildings andtransportation infrastructure) are accounted for on a full accrual accounting basis. Other tangiblecapital assets owned by Provincial ministries will continue to be accounted for as expense in the yearof acquisition or construction. All capital assets owned by consolidated organizations are accountedfor on a full accrual basis.
Fiscal Outlook 2006-07
As at September 30, 2006, Ontario is projecting a deÑcit of $1,949 million for 2006-07. Thisrepresents an in-year improvement of $401 million from the deÑcit target of $2,350 million set out in the2006 Ontario Budget. The current 2006-07 Ñscal outlook maintains a $1,000 million reserve to protect the
19
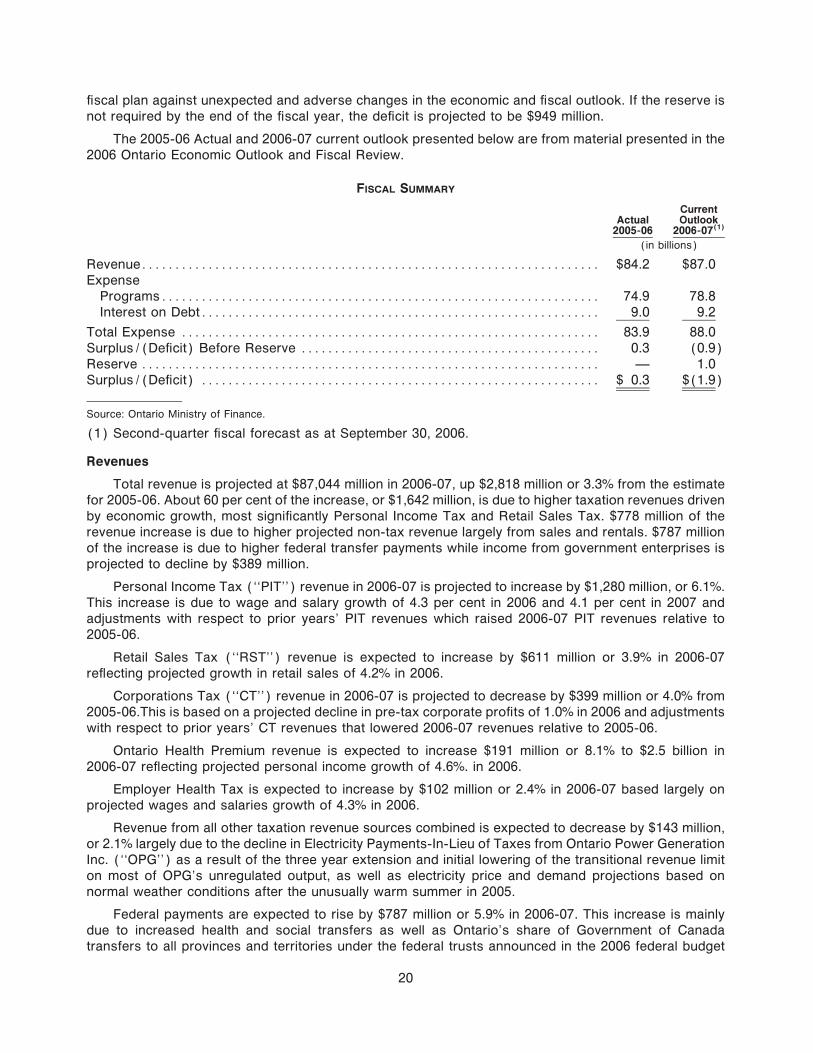
Ñscal plan against unexpected and adverse changes in the economic and Ñscal outlook. If the reserve isnot required by the end of the Ñscal year, the deÑcit is projected to be $949 million.
The 2005-06 Actual and 2006-07 current outlook presented below are from material presented in the2006 Ontario Economic Outlook and Fiscal Review.
FISCAL SUMMARY
CurrentActual Outlook
2005-06 2006-07(1)
(in billions)
RevenueÏÏÏÏÏÏÏÏÏÏÏÏÏÏÏÏÏÏÏÏÏÏÏÏÏÏÏÏÏÏÏÏÏÏÏÏÏÏÏÏÏÏÏÏÏÏÏÏÏÏÏÏÏÏÏÏÏÏÏÏÏÏÏÏÏÏÏÏÏ $84.2 $87.0Expense
ProgramsÏÏÏÏÏÏÏÏÏÏÏÏÏÏÏÏÏÏÏÏÏÏÏÏÏÏÏÏÏÏÏÏÏÏÏÏÏÏÏÏÏÏÏÏÏÏÏÏÏÏÏÏÏÏÏÏÏÏÏÏÏÏÏÏÏÏ 74.9 78.8Interest on DebtÏÏÏÏÏÏÏÏÏÏÏÏÏÏÏÏÏÏÏÏÏÏÏÏÏÏÏÏÏÏÏÏÏÏÏÏÏÏÏÏÏÏÏÏÏÏÏÏÏÏÏÏÏÏÏÏÏÏÏÏ 9.0 9.2
Total Expense ÏÏÏÏÏÏÏÏÏÏÏÏÏÏÏÏÏÏÏÏÏÏÏÏÏÏÏÏÏÏÏÏÏÏÏÏÏÏÏÏÏÏÏÏÏÏÏÏÏÏÏÏÏÏÏÏÏÏÏÏÏÏÏ 83.9 88.0Surplus/(DeÑcit) Before Reserve ÏÏÏÏÏÏÏÏÏÏÏÏÏÏÏÏÏÏÏÏÏÏÏÏÏÏÏÏÏÏÏÏÏÏÏÏÏÏÏÏÏÏÏÏÏ 0.3 (0.9)Reserve ÏÏÏÏÏÏÏÏÏÏÏÏÏÏÏÏÏÏÏÏÏÏÏÏÏÏÏÏÏÏÏÏÏÏÏÏÏÏÏÏÏÏÏÏÏÏÏÏÏÏÏÏÏÏÏÏÏÏÏÏÏÏÏÏÏÏÏÏÏ Ì 1.0Surplus/(DeÑcit) ÏÏÏÏÏÏÏÏÏÏÏÏÏÏÏÏÏÏÏÏÏÏÏÏÏÏÏÏÏÏÏÏÏÏÏÏÏÏÏÏÏÏÏÏÏÏÏÏÏÏÏÏÏÏÏÏÏÏÏÏ $ 0.3 $(1.9)
Source: Ontario Ministry of Finance.
(1) Second-quarter Ñscal forecast as at September 30, 2006.
Revenues
Total revenue is projected at $87,044 million in 2006-07, up $2,818 million or 3.3% from the estimatefor 2005-06. About 60 per cent of the increase, or $1,642 million, is due to higher taxation revenues drivenby economic growth, most signiÑcantly Personal Income Tax and Retail Sales Tax. $778 million of therevenue increase is due to higher projected non-tax revenue largely from sales and rentals. $787 millionof the increase is due to higher federal transfer payments while income from government enterprises isprojected to decline by $389 million.
Personal Income Tax (""PIT'') revenue in 2006-07 is projected to increase by $1,280 million, or 6.1%.This increase is due to wage and salary growth of 4.3 per cent in 2006 and 4.1 per cent in 2007 andadjustments with respect to prior years' PIT revenues which raised 2006-07 PIT revenues relative to2005-06.
Retail Sales Tax (""RST'') revenue is expected to increase by $611 million or 3.9% in 2006-07reÖecting projected growth in retail sales of 4.2% in 2006.
Corporations Tax (""CT'') revenue in 2006-07 is projected to decrease by $399 million or 4.0% from2005-06.This is based on a projected decline in pre-tax corporate proÑts of 1.0% in 2006 and adjustmentswith respect to prior years' CT revenues that lowered 2006-07 revenues relative to 2005-06.
Ontario Health Premium revenue is expected to increase $191 million or 8.1% to $2.5 billion in2006-07 reÖecting projected personal income growth of 4.6%. in 2006.
Employer Health Tax is expected to increase by $102 million or 2.4% in 2006-07 based largely onprojected wages and salaries growth of 4.3% in 2006.
Revenue from all other taxation revenue sources combined is expected to decrease by $143 million,or 2.1% largely due to the decline in Electricity Payments-In-Lieu of Taxes from Ontario Power GenerationInc. (""OPG'') as a result of the three year extension and initial lowering of the transitional revenue limiton most of OPG's unregulated output, as well as electricity price and demand projections based onnormal weather conditions after the unusually warm summer in 2005.
Federal payments are expected to rise by $787 million or 5.9% in 2006-07. This increase is mainlydue to increased health and social transfers as well as Ontario's share of Government of Canadatransfers to all provinces and territories under the federal trusts announced in the 2006 federal budget
20
and conÑrmed by the recently released federal Ñnancial results for 2005-06. The 2006-07 forecast forfederal payments also includes funding under the 2005 Canada-Ontario Agreement.
Income from Investment in Government Business Enterprises is expected to decrease by$389 million in 2006-07, or 9.0%. This is due mainly to a decrease in projected net incomes from theOntario Lottery and Gaming Corporation (""OLGC''), and the combined incomes of OPG and Hydro OneInc. (""Hydro One''). The OLGC decline is largely due to continued competitive pressures on bordercasinos. The combined OPG and Hydro One decrease is due to higher-than-expected net income in2005-06, which was the result of higher electricity prices and demand during the unusually hot summer. Inaddition, OPG net income is also expected to decline as a result of the government's strategic decision toimprove electricity price stability for Ontario electricity consumers by extending for three years, andinitially lowering, the revenue limit on most of OPG's unregulated output.
Other Non-Tax Revenue is expected to rise by $778 million, or 11.5% in 2006-07. This is due primarilyto a $573 million increase in sales and rentals revenue reÖecting the expected gross amount of theProvince's share of proceeds related to the Teranet Income Fund initial public oÅering announced onJune 16, 2006 and reÖected in the 2006 Ontario Economic Outlook and Fiscal Review. Other factorsinclude higher reimbursements from municipalities related to provincial expenditures on social servicesand an increase in royalties following a one-time $70 million retroactive reduction in 2005-06 Crownstumpage fees to assist the forestry sector.
Expense
Total expense for 2006-07 is projected to be $87,993 million, an increase of $4,066 million from the2005-06 actual results of $83,927 million. This increase in expense is primarily due to higher levels ofspending on health care, education, postsecondary education and social services as well as higherinterest-on-debt expense.
(3) Revenue
Overview
The following table sets forth historical revenue information for each of the Ñscal years in the Ñve-year period ended March 31, 2006 and 2006-07 forecast information presented in the 2006 OntarioBudget and updated in the 2006 Ontario Economic Outlook and Fiscal Review.
Total revenue in Ñscal 2006-07 is projected to be $87,044 million. Tax revenue is projected at$61,559 million or 70.7% of total revenue. Federal transfers, at $14,038 million, are 16.1% of total revenue.Income from Investment in Government Business Enterprises is projected to be $3,920 million, 4.5% oftotal revenue. All Other Non-Tax Revenues are projected to be $7,527 million, 8.6% of total revenue.
21

ONTARIO'S REVENUE
Current % of TotalActual Outlook Revenue
2001-02 2002-03 2003-04 2004-05 2005-06 2006-07(1) 2006-07
(in millions)
Taxation RevenuePersonal Income Tax ÏÏÏÏÏÏÏÏÏÏÏÏÏÏÏÏÏÏÏÏÏÏÏÏÏ $19,097 $18,195 $18,301 $19,320 $21,041 $22,321 25.6Retail Sales Tax ÏÏÏÏÏÏÏÏÏÏÏÏÏÏÏÏÏÏÏÏÏÏÏÏÏÏÏÏÏÏ 13,803 14,183 14,258 14,855 15,554 16,165 18.6Corporations Tax ÏÏÏÏÏÏÏÏÏÏÏÏÏÏÏÏÏÏÏÏÏÏÏÏÏÏÏÏÏ 6,646 7,459 6,658 9,883 9,984 9,585 11.0Employer Health TaxÏÏÏÏÏÏÏÏÏÏÏÏÏÏÏÏÏÏÏÏÏÏÏÏÏÏ 3,502 3,589 3,753 3,886 4,197 4,299 4.9Ontario Health Premium ÏÏÏÏÏÏÏÏÏÏÏÏÏÏÏÏÏÏÏÏÏÏÏ Ì Ì Ì 1,737 2,350 2,541 2.9Gasoline & Fuel Taxes ÏÏÏÏÏÏÏÏÏÏÏÏÏÏÏÏÏÏÏÏÏÏÏÏ 2,851 2,988 2,945 3,004 3,010 3,045 3.5Tobacco Tax ÏÏÏÏÏÏÏÏÏÏÏÏÏÏÏÏÏÏÏÏÏÏÏÏÏÏÏÏÏÏÏÏÏ 703 1,183 1,350 1,453 1,379 1,405 1.6Land Transfer Tax ÏÏÏÏÏÏÏÏÏÏÏÏÏÏÏÏÏÏÏÏÏÏÏÏÏÏÏÏ 665 814 909 1,043 1,159 1,125 1.3ElectricityPayments-In-Lieu of Taxes ÏÏÏÏÏÏÏÏÏÏÏÏÏÏÏÏÏÏÏÏ 387 711 627 511 951 790 0.9Other Taxation ÏÏÏÏÏÏÏÏÏÏÏÏÏÏÏÏÏÏÏÏÏÏÏÏÏÏÏÏÏÏÏ 371 429 347 283 292 283 0.3
48,025 49,551 49,148 55,975 59,917 61,559 70.7Government of Canada
Canada Health and Social Transfer (CHST) ÏÏÏÏ 5,831 7,346 7,345 Ì Ì Ì ÌCanada Health Transfer (CHT) ÏÏÏÏÏÏÏÏÏÏÏÏÏÏÏÏ Ì Ì Ì 5,640 7,148 7,619 8.8Canada Social Transfer (CST)(2) ÏÏÏÏÏÏÏÏÏÏÏÏÏÏ Ì Ì Ì 2,912 3,324 3,420 3.9CHST Supplements ÏÏÏÏÏÏÏÏÏÏÏÏÏÏÏÏÏÏÏÏÏÏÏÏÏÏÏ 380 191 577 775 584 Ì ÌOther Federal PaymentsÏÏÏÏÏÏÏÏÏÏÏÏÏÏÏÏÏÏÏÏÏÏÏ 1,543 1,357 1,971 2,555 2,195 2,999 3.4
7,754 8,894 9,893 11,882 13,251 14,038 16.1Income from Investment In Government Business
EnterprisesÏÏÏÏÏÏÏÏÏÏÏÏÏÏÏÏÏÏÏÏÏÏÏÏÏÏÏÏÏÏÏÏÏÏÏ 3,345 3,942 3,070 3,578 4,308 3,920 4.5
Other RevenueReimbursementsÏÏÏÏÏÏÏÏÏÏÏÏÏÏÏÏÏÏÏÏÏÏÏÏÏÏÏÏÏÏ 1,592 1,111 1,206 1,241 1,295 1,358 1.6Electricity Debt Retirement Charge ÏÏÏÏÏÏÏÏÏÏÏÏÏ Ì 889 1,000 997 1,021 1,027 1.2Vehicle and Driver Registration Fees ÏÏÏÏÏÏÏÏÏÏÏ 941 982 985 976 763 1,021 1.2Power SalesÏÏÏÏÏÏÏÏÏÏÏÏÏÏÏÏÏÏÏÏÏÏÏÏÏÏÏÏÏÏÏÏÏÏ 815 635 510 610 779 988 1.1Other Fees and Licences ÏÏÏÏÏÏÏÏÏÏÏÏÏÏÏÏÏÏÏÏÏÏ 474 606 594 506 550 556 0.6Liquor Licence RevenueÏÏÏÏÏÏÏÏÏÏÏÏÏÏÏÏÏÏÏÏÏÏÏ 530 530 488 489 516 453 0.5Net Reduction of Power Purchase Contract
Liability ÏÏÏÏÏÏÏÏÏÏÏÏÏÏÏÏÏÏÏÏÏÏÏÏÏÏÏÏÏÏÏÏÏÏÏÏ Ì 161 104 236 396 412 0.5Sales and Rentals ÏÏÏÏÏÏÏÏÏÏÏÏÏÏÏÏÏÏÏÏÏÏÏÏÏÏÏÏ 344 560 532 352 465 969 1.1RoyaltiesÏÏÏÏÏÏÏÏÏÏÏÏÏÏÏÏÏÏÏÏÏÏÏÏÏÏÏÏÏÏÏÏÏÏÏÏÏ 224 304 248 278 191 243 0.3Miscellaneous Other Non-Tax RevenueÏÏÏÏÏÏÏÏÏ 2,490 726 622 721 773 500 0.6
7,410 6,504 6,289 6,406 6,749 7,527 8.6Total RevenueÏÏÏÏÏÏÏÏÏÏÏÏÏÏÏÏÏÏÏÏÏÏÏÏÏÏÏÏÏÏÏÏÏÏ $66,534 $68,891 $68,400 $77,841 $84,225 $87,044 100.0
Source: Ontario Ministry of Finance.
Totals may not add due to rounding.
(1) Second-quarter Ñscal forecast as at September 30, 2006.
(2) Includes 2005 federal budget additional Early Learning and Child Care revenues of $272 million in2005-06 and $254 million in 2006-07.
Taxation
The Constitution provides for a division of taxation authority between the federal and provincialgovernments. Local governments derive their taxing powers from the Province. In accordance with itspolicy of centralized Ñnancing, the Province has delegated its taxing powers respecting real propertytaxes to local governments.
Personal Income Tax. Ontario and the Federal Government impose a personal income tax (""PIT'')on individuals resident in Ontario. This tax is the Province's largest single source of revenue.
Ontario basic PIT is calculated as a percentage of taxable income. It is collected by the FederalGovernment on Ontario's behalf. The tax rates for 2006 are as follows: 6.05% of the Ñrst $34,758 of
22

taxable income plus 9.15% of the portion of taxable income between $34,758 and $69,517, plus 11.16% ofthe portion of taxable income over $69,517. Ontario non-refundable tax credits are provided to recognizeindividual and family circumstances (e.g., basic amount, spouse, medical expenses), at the rate of 6.05%in 2006 (and 11.16% for charitable donations in excess of $200), before calculating the provincial surtaxor Ontario Tax Reduction.
Ontario also applies a surtax on taxpayers with higher incomes. For the 2006 taxation year, thesurtax is equal to 20% of basic Ontario PIT in excess of $4,016, plus an additional 36% of basic OntarioPIT in excess of $5,065. For taxpayers with low or moderate incomes, the Ontario Tax Reduction reducesor eliminates Ontario PIT.
The Ontario Health Premium (""OHP'') is payable by individuals resident in Ontario on the last day oftheir taxation year and is based on taxable income. There are Ñve OHP levels, with phase-in ratesbetween levels. No one with taxable income of $20,000 or less pays the OHP. For 2006, the initial OHPlevel of $300 is phased in at the rate of 6% of taxable income in excess of $20,000, reaching the fullamount at a taxable income of $25,000. The increase to the second OHP level of $450 is phased in at arate of 6% of taxable income from $36,000 to $38,500. Each subsequent increase to the next OHP level isphased in at the rate of 25% over the Ñrst $600 of taxable income in the range. The maximum annual OHPamount of $900 is reached at a taxable income of $200,600.
Retail Sales Tax. Ontario applies an 8% retail sales tax on the purchase of most tangible personalproperty and certain services. For admission fees to a place of amusement that exceed $4.00 andalcoholic beverages sold at licensed establishments the rate is 10%. Alcoholic beverages sold throughretail outlets are taxed at 12%. On transient accommodation, the rate is 5%. Insurance premiums aregenerally taxed at 8%; however, individual life and health insurance premiums are exempt. The sales taxon motor vehicle insurance premiums and on repairs and replacements made under warranty waseliminated as of April 1, 2004. There are a number of exemptions from retail sales tax, including those forbasic groceries, prescription drugs, energy, children's clothing, farm equipment, farm building materialsand production machinery and equipment.
Under the Retail Sales Tax Act, the Tax for Fuel Conservation is applied to the purchase or lease of anew passenger vehicle or sport utility vehicle and is based on the highway fuel eÇciency rating of thevehicle. Trucks, buses and vans are not subject to this tax. The tax applies to all passenger vehicles witha highway fuel eÇciency rating of 6.0 or more litres of gasoline or diesel fuel per 100 kilometres and allsport utility vehicles with a highway fuel eÇciency rating of 8.0 or more litres of gasoline or diesel fuel per100 kilometres, and increases as fuel eÇciency of the vehicle declines. A $100 tax credit is given to thepurchaser of a new passenger car with a highway fuel consumption rating of less than 6.0 litres ofgasoline or diesel fuel per 100 kilometres.
Corporate Income Tax. The Province taxes corporate income allocated to Ontario. The generalcorporate income tax rate is 14% and the M&P tax rate is 12%. The M&P tax rate is the tax rate on incomefrom manufacturing and processing, mining, logging, Ñshing and farming.
The tax rate for small businesses is 5.5%. The income threshold for this special rate is $400,000.
Ontario provides assistance for scientiÑc research and experimental development (""SR&ED'')activities through: (1) a 10% refundable innovation tax credit for qualiÑed SR&ED expenses; (2) a fulldeduction for qualiÑed expenses in the year they are incurred; (3) a 20% refundable tax credit for SR&EDdone through speciÑed research institutions; and (4) a tax exemption for the federal SR&ED investmenttax credit that relates to SR&ED incurred in Ontario.
Ontario provides a number of refundable tax credits on expenses for certain other corporateactivities carried out in Ontario: a 25% to 30% apprenticeship tax credit for hiring qualifying apprentices(eÅective May 19, 2004), a 10% to 15% co-operative education tax credit for hiring qualifying co-opstudents; a 30% book publishing tax credit; a 20% computer animation and special eÅects tax credit; a30% tax credit for producing domestic Ñlm and television productions (40% for Ñrst-time producers), withan additional 10% bonus for qualifying regional productions; an 18% Ñlm and television productionservices tax credit for foreign-based and non-certiÑed domestic productions; a 20% to 30% interactivedigital media tax credit; and a 20% sound recording tax credit.
23

The tax credit rate for domestic Ñlm and television productions increased from 20% to 30% eÅectiveJanuary 1, 2005 to December 31, 2009. The 10% regional bonus continues and Ñrst-time producers areeligible for an enhanced rate of 40%. Also, the tax credit rate for foreign-based and non-certiÑed domesticÑlm and television productions increased from 11% to 18% eÅective January 1, 2005 to March 31, 2007. A3% regional bonus was eliminated eÅective January 1, 2005.
Ontario also provides additional deductions from income equal to 30% of the capital cost of pollutioncontrol equipment and also for the acquisition of new school buses purchased before January 1, 2006.
Corporations or a group of associated corporations with total assets over $5 million or grossrevenues over $10 million are subject to a corporate minimum tax (""CMT''). The CMT is applied at a rateof 4% on accounting income less certain deductions, such as dividend income. The CMT is reduced byregular corporate income tax payable in the year.
Insurance Premiums Tax. Insurance companies pay a 2% tax on net premiums in respect ofaccident, sickness and life insurance for persons resident in Ontario. A 3% tax is levied on net premiumsin respect of property and any other contract of insurance in Ontario. Contracts in respect of propertyinsurance also bear an additional 0.5% tax on net premiums. A 2% premiums tax is also payable byemployers in respect of uninsured beneÑt arrangements.
Life insurance companies are subject to a special additional tax of 1.25% on taxable paid-up capitalin Ontario. The Ñrst $10 million in paid-up capital is exempt from tax. This tax is reduced by regularincome tax and any corporate minimum tax payable in the year.
Capital Tax. The Province levies a capital tax on paid-up capital allocated to Ontario. Insurancecompanies do not pay this tax. The general capital tax rate is 0.3%. Deposit-taking Ñnancial institutionsare subject to a capital tax of 0.6% on the Ñrst $400 million of taxable capital and 0.9% on taxable capitalin excess of $400 million. Non-deposit taking Ñnancial institutions are subject to a capital tax of 0.6% onthe Ñrst $400 million of taxable capital and 0.72% on taxable capital in excess of $400 million. Ontariocredit unions, Caisses Populaires and family farm/Ñshing corporations are exempt from capital tax.Regular corporations and Ñnancial institutions are entitled to a $7.5 million deduction from taxable capitalin 2005 and $10 million in 2006.
The 2004 Ontario Budget announced a plan to gradually eliminate the capital tax by 2012. StartingJanuary 1, 2005, the $5 million deduction from taxable capital will be increased by $2.5 million each yearuntil the deduction reaches $15 million on January 1, 2008. Starting January 1, 2009, capital tax rates willbe reduced each year until the capital tax is fully eliminated on January 1, 2012.
The 2006 Ontario Budget built on the government's original plan by accelerating the capital tax ratecut. EÅective January 1, 2007 every corporation still paying capital tax will have its rate in eÅect for 2006reduced by 5% Ì two years earlier than the Ñrst scheduled rate cut under the original plan. On January 1,2009, capital tax rates that were in eÅect for 2006 will be further reduced by 20%. In the remaining years,capital tax rates that were in eÅect for 2006 will be further reduced by 25% annually until capital tax iseliminated in 2012.
A capital tax credit is available to Ñnancial institutions that make eligible capital investments in orprovide low interest rate loans to Ontario small businesses.
Mining Tax. The Mining Tax Act levies a tax on proÑts from the extraction of minerals in Ontario. Thetax is levied on the operator's proÑt in excess of $500,000. EÅective January 1, 2004, the mining tax rateis 10%. There is a three-year or $10 million proÑt exemption available to new or expanded mines. Toassist mines in remote areas of the Province, the three-year exemption is extended to ten years for newremote mines. As well, the proÑts from remote mines are taxed at a rate of 5% after the 10-year or$10 million proÑt exemption.
Employer Health Tax. Ontario levies a payroll tax on Ontario remuneration. Employers with totalannual Ontario remuneration of $200,000 or less calculate tax payable at a rate of 0.98%; employers withtotal annual Ontario remuneration between $200,000 and $400,000 calculate this tax at graduated ratesbetween 0.98% and 1.95%; and employers with total annual Ontario remuneration in excess of $400,000
24
calculate tax at a rate of 1.95%. A tax exemption is provided for the Ñrst $400,000 of total annual Ontarioremuneration of private-sector employers.
Land Transfer Tax. Ontario levies a land transfer tax on the value of consideration of mostregistered conveyances and unregistered dispositions of beneÑcial interest in land in Ontario. The landtransfer tax applies at graduated rates ranging from 0.5% on the value of consideration of $55,000 orless, 1.0% on the value of consideration between $55,000 and $250,000 and 1.5% on the value ofconsideration exceeding $250,000. Where the value of consideration exceeds $400,000 and the propertycontains one or two single-family residences, there is an additional 0.5% (in addition to the 1.5%) taxlevied on the amount exceeding $400,000. As part of the 2000 Budget, the land transfer tax refundprogram for Ñrst-time buyers of newly constructed homes was made permanent. Eligible purchasers areentitled to a refund of up to $2,000 under the program.
Other SigniÑcant Taxes. Taxes are applied to the purchases of gasoline (Gasoline Tax Act) and useof diesel fuel (Fuel Tax Act). The taxes apply to gasoline and diesel fuel used in on-road motor vehiclesand certain oÅ-road uses (i.e. recreational boats, snowmobiles, lawn mowers). Under the Gasoline TaxAct, the tax rate for gasoline is 14.7 cents per litre; 4.3 cents per litre for propane; and 2.7 cents per litrefor fuel used to power aircraft. Under the Fuel Tax Act, the tax rate for diesel fuel is 14.3 cents per litre and4.5 cents per litre for diesel fuel used to power railroad locomotives.
Tobacco Tax. Since February 1, 2006, Ontario's tobacco tax rate is 12.35 cents per cigarette or pergram or part gram of cut tobacco. The tax on cigars is 56.6% of the retail price.
Race Tracks Tax. Ontario also levies a racetracks tax on wagers on horse races at 0.5% on all bets.
Federal Government Payments
Approximately 16.1% of the Province's revenue in Ñscal 2006-07, or $14,038 million, will be receivedthrough cash payments from the Federal Government. These payments increased by $787 million, from$13,251 million in 2005-06. Federal payments are intended to assist the Province in providing necessaryservices in areas of provincial jurisdiction.
Canada Health Transfer (""CHT'') and Canada Social Transfer (""CST''). The largest cash transfersfrom the Federal Government, in the form of CHT and CST payments, are to assist the Province inproviding health care, postsecondary education and other social programs. In Ñscal year 2005-06, CHTand CST payments to Ontario were $10,472 million, including $7,148 million in CHT and $3,324 million inCST. An additional $584 million in CHST Supplements was also received in 2005-06. In 2006-07, CHT andCST payments to Ontario are expected to total $11,039 million, including $7,619 million in CHT and$3,420 million in CST.
The CHT and CST were created April 1, 2004, when the Government of Canada split the CanadaHealth and Social Transfer (""CHST'') into two separate transfers: the CHT, designated speciÑcally forhealth care, and the CST for postsecondary education and social programs. The CHST was a block fundcontribution by the Federal Government in respect of social programs under the Federal-Provincial FiscalArrangements Act. It replaced both the Established Programs Financing (""EPF'') and CanadaAssistance Plan (""CAP'') in 1996-97. To receive the CHST cash contribution, provinces must complywith the Canada Health Act and may not impose a residency requirement in determining eligibility forsocial assistance.
CHT and CST total entitlements include both cash and tax entitlements. CHT and CST taxentitlements are the value of 13.5 of each province's personal income tax (""PIT'') points and onecorporate income tax (""CIT'') point transferred to provinces in 1977-78 under the EPF arrangements.
CHST Supplements. At the February 2003 First Ministers' Meeting (""FMM''), the federalgovernment announced a $2.5 billion CHST Health Supplement, which was allocated on a per capitabasis. Ontario recorded its share, $967 million, over three years: $386 million in 2003-04, $387 million in2004-05, and $194 million in 2005-06, according to the federal draw down schedule.
At the same FMM, a one-time $2 billion CHST ""Top-Up'' was created, which the federal governmentwas expected to make available in 2003-04. The $2 billion CHST top-up was provided at the January2004 FMM. Ontario's annual allocation was $388 million in 2004-05 and $390 million in 2005-06.
25
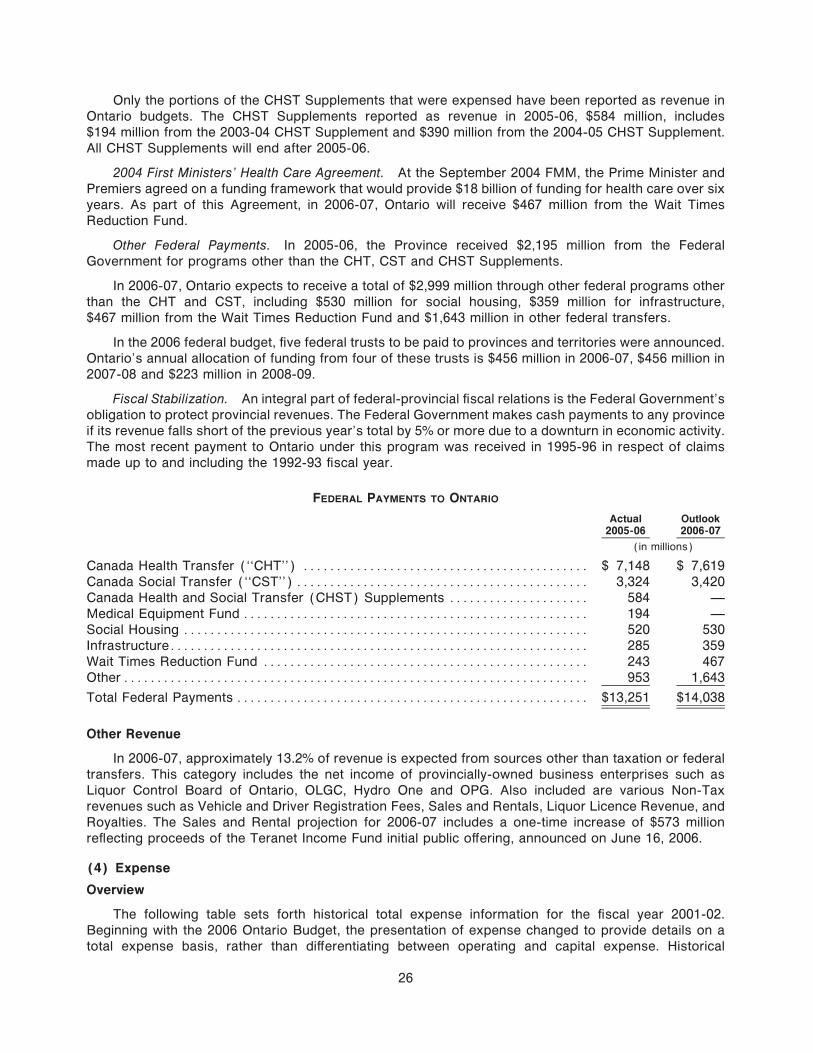
Only the portions of the CHST Supplements that were expensed have been reported as revenue inOntario budgets. The CHST Supplements reported as revenue in 2005-06, $584 million, includes$194 million from the 2003-04 CHST Supplement and $390 million from the 2004-05 CHST Supplement.All CHST Supplements will end after 2005-06.
2004 First Ministers' Health Care Agreement. At the September 2004 FMM, the Prime Minister andPremiers agreed on a funding framework that would provide $18 billion of funding for health care over sixyears. As part of this Agreement, in 2006-07, Ontario will receive $467 million from the Wait TimesReduction Fund.
Other Federal Payments. In 2005-06, the Province received $2,195 million from the FederalGovernment for programs other than the CHT, CST and CHST Supplements.
In 2006-07, Ontario expects to receive a total of $2,999 million through other federal programs otherthan the CHT and CST, including $530 million for social housing, $359 million for infrastructure,$467 million from the Wait Times Reduction Fund and $1,643 million in other federal transfers.
In the 2006 federal budget, Ñve federal trusts to be paid to provinces and territories were announced.Ontario's annual allocation of funding from four of these trusts is $456 million in 2006-07, $456 million in2007-08 and $223 million in 2008-09.
Fiscal Stabilization. An integral part of federal-provincial Ñscal relations is the Federal Government'sobligation to protect provincial revenues. The Federal Government makes cash payments to any provinceif its revenue falls short of the previous year's total by 5% or more due to a downturn in economic activity.The most recent payment to Ontario under this program was received in 1995-96 in respect of claimsmade up to and including the 1992-93 Ñscal year.
FEDERAL PAYMENTS TO ONTARIO
Actual Outlook2005-06 2006-07
(in millions)
Canada Health Transfer (""CHT'') ÏÏÏÏÏÏÏÏÏÏÏÏÏÏÏÏÏÏÏÏÏÏÏÏÏÏÏÏÏÏÏÏÏÏÏÏÏÏÏÏÏÏÏ $ 7,148 $ 7,619Canada Social Transfer (""CST'') ÏÏÏÏÏÏÏÏÏÏÏÏÏÏÏÏÏÏÏÏÏÏÏÏÏÏÏÏÏÏÏÏÏÏÏÏÏÏÏÏÏÏÏÏ 3,324 3,420Canada Health and Social Transfer (CHST) Supplements ÏÏÏÏÏÏÏÏÏÏÏÏÏÏÏÏÏÏÏÏÏ 584 ÌMedical Equipment Fund ÏÏÏÏÏÏÏÏÏÏÏÏÏÏÏÏÏÏÏÏÏÏÏÏÏÏÏÏÏÏÏÏÏÏÏÏÏÏÏÏÏÏÏÏÏÏÏÏÏÏÏÏ 194 ÌSocial Housing ÏÏÏÏÏÏÏÏÏÏÏÏÏÏÏÏÏÏÏÏÏÏÏÏÏÏÏÏÏÏÏÏÏÏÏÏÏÏÏÏÏÏÏÏÏÏÏÏÏÏÏÏÏÏÏÏÏÏÏÏÏ 520 530InfrastructureÏÏÏÏÏÏÏÏÏÏÏÏÏÏÏÏÏÏÏÏÏÏÏÏÏÏÏÏÏÏÏÏÏÏÏÏÏÏÏÏÏÏÏÏÏÏÏÏÏÏÏÏÏÏÏÏÏÏÏÏÏÏÏ 285 359Wait Times Reduction Fund ÏÏÏÏÏÏÏÏÏÏÏÏÏÏÏÏÏÏÏÏÏÏÏÏÏÏÏÏÏÏÏÏÏÏÏÏÏÏÏÏÏÏÏÏÏÏÏÏÏ 243 467OtherÏÏÏÏÏÏÏÏÏÏÏÏÏÏÏÏÏÏÏÏÏÏÏÏÏÏÏÏÏÏÏÏÏÏÏÏÏÏÏÏÏÏÏÏÏÏÏÏÏÏÏÏÏÏÏÏÏÏÏÏÏÏÏÏÏÏÏÏÏÏ 953 1,643
Total Federal Payments ÏÏÏÏÏÏÏÏÏÏÏÏÏÏÏÏÏÏÏÏÏÏÏÏÏÏÏÏÏÏÏÏÏÏÏÏÏÏÏÏÏÏÏÏÏÏÏÏÏÏÏÏÏ $13,251 $14,038
Other Revenue
In 2006-07, approximately 13.2% of revenue is expected from sources other than taxation or federaltransfers. This category includes the net income of provincially-owned business enterprises such asLiquor Control Board of Ontario, OLGC, Hydro One and OPG. Also included are various Non-Taxrevenues such as Vehicle and Driver Registration Fees, Sales and Rentals, Liquor Licence Revenue, andRoyalties. The Sales and Rental projection for 2006-07 includes a one-time increase of $573 millionreÖecting proceeds of the Teranet Income Fund initial public oÅering, announced on June 16, 2006.
(4) Expense
Overview
The following table sets forth historical total expense information for the Ñscal year 2001-02.Beginning with the 2006 Ontario Budget, the presentation of expense changed to provide details on atotal expense basis, rather than diÅerentiating between operating and capital expense. Historical
26

program expense Ñgures for the Province of Ontario have been restated to reÖect changes in thegovernment's ministry structure that occurred in Ñscal year 2005-06.
ONTARIO'S TOTAL EXPENSE
Ministry 2001-02
(in millions)
Agriculture, Food and Rural AÅairsÏÏÏÏÏÏÏÏÏÏÏÏÏÏÏÏÏÏÏÏÏÏÏÏÏÏÏÏÏÏÏÏÏÏÏÏÏÏÏÏÏÏÏÏÏÏÏÏÏÏÏÏ 485One-Time and Extraordinary Assistance ÏÏÏÏÏÏÏÏÏÏÏÏÏÏÏÏÏÏÏÏÏÏÏÏÏÏÏÏÏÏÏÏÏÏÏÏÏÏÏÏÏÏÏÏÏ 319
Attorney General ÏÏÏÏÏÏÏÏÏÏÏÏÏÏÏÏÏÏÏÏÏÏÏÏÏÏÏÏÏÏÏÏÏÏÏÏÏÏÏÏÏÏÏÏÏÏÏÏÏÏÏÏÏÏÏÏÏÏÏÏÏÏÏÏÏÏÏÏ 1,041Board of Internal Economy ÏÏÏÏÏÏÏÏÏÏÏÏÏÏÏÏÏÏÏÏÏÏÏÏÏÏÏÏÏÏÏÏÏÏÏÏÏÏÏÏÏÏÏÏÏÏÏÏÏÏÏÏÏÏÏÏÏÏÏ 124Children and Youth ServicesÏÏÏÏÏÏÏÏÏÏÏÏÏÏÏÏÏÏÏÏÏÏÏÏÏÏÏÏÏÏÏÏÏÏÏÏÏÏÏÏÏÏÏÏÏÏÏÏÏÏÏÏÏÏÏÏÏÏ 2,250Citizenship and Immigration ÏÏÏÏÏÏÏÏÏÏÏÏÏÏÏÏÏÏÏÏÏÏÏÏÏÏÏÏÏÏÏÏÏÏÏÏÏÏÏÏÏÏÏÏÏÏÏÏÏÏÏÏÏÏÏÏÏÏ 61Community and Social ServicesÏÏÏÏÏÏÏÏÏÏÏÏÏÏÏÏÏÏÏÏÏÏÏÏÏÏÏÏÏÏÏÏÏÏÏÏÏÏÏÏÏÏÏÏÏÏÏÏÏÏÏÏÏÏÏ 5,837Community Safety and Correctional Services ÏÏÏÏÏÏÏÏÏÏÏÏÏÏÏÏÏÏÏÏÏÏÏÏÏÏÏÏÏÏÏÏÏÏÏÏÏÏÏÏÏÏ 1,601Culture ÏÏÏÏÏÏÏÏÏÏÏÏÏÏÏÏÏÏÏÏÏÏÏÏÏÏÏÏÏÏÏÏÏÏÏÏÏÏÏÏÏÏÏÏÏÏÏÏÏÏÏÏÏÏÏÏÏÏÏÏÏÏÏÏÏÏÏÏÏÏÏÏÏÏÏÏÏ 293Democratic Renewal Secretariat ÏÏÏÏÏÏÏÏÏÏÏÏÏÏÏÏÏÏÏÏÏÏÏÏÏÏÏÏÏÏÏÏÏÏÏÏÏÏÏÏÏÏÏÏÏÏÏÏÏÏÏÏÏÏ ÌEconomic Development and Trade ÏÏÏÏÏÏÏÏÏÏÏÏÏÏÏÏÏÏÏÏÏÏÏÏÏÏÏÏÏÏÏÏÏÏÏÏÏÏÏÏÏÏÏÏÏÏÏÏÏÏÏÏ 89Education ÏÏÏÏÏÏÏÏÏÏÏÏÏÏÏÏÏÏÏÏÏÏÏÏÏÏÏÏÏÏÏÏÏÏÏÏÏÏÏÏÏÏÏÏÏÏÏÏÏÏÏÏÏÏÏÏÏÏÏÏÏÏÏÏÏÏÏÏÏÏÏÏÏÏÏ 8,439
Teachers' Pension Plan ÏÏÏÏÏÏÏÏÏÏÏÏÏÏÏÏÏÏÏÏÏÏÏÏÏÏÏÏÏÏÏÏÏÏÏÏÏÏÏÏÏÏÏÏÏÏÏÏÏÏÏÏÏÏÏÏÏÏÏÏ 42EnergyÏÏÏÏÏÏÏÏÏÏÏÏÏÏÏÏÏÏÏÏÏÏÏÏÏÏÏÏÏÏÏÏÏÏÏÏÏÏÏÏÏÏÏÏÏÏÏÏÏÏÏÏÏÏÏÏÏÏÏÏÏÏÏÏÏÏÏÏÏÏÏÏÏÏÏÏÏÏ 417Environment ÏÏÏÏÏÏÏÏÏÏÏÏÏÏÏÏÏÏÏÏÏÏÏÏÏÏÏÏÏÏÏÏÏÏÏÏÏÏÏÏÏÏÏÏÏÏÏÏÏÏÏÏÏÏÏÏÏÏÏÏÏÏÏÏÏÏÏÏÏÏÏÏ 285Executive OÇces ÏÏÏÏÏÏÏÏÏÏÏÏÏÏÏÏÏÏÏÏÏÏÏÏÏÏÏÏÏÏÏÏÏÏÏÏÏÏÏÏÏÏÏÏÏÏÏÏÏÏÏÏÏÏÏÏÏÏÏÏÏÏÏÏÏÏÏÏ 19Finance Ì Own Account ÏÏÏÏÏÏÏÏÏÏÏÏÏÏÏÏÏÏÏÏÏÏÏÏÏÏÏÏÏÏÏÏÏÏÏÏÏÏÏÏÏÏÏÏÏÏÏÏÏÏÏÏÏÏÏÏÏÏÏÏÏ 1,193
Interest on Debt ÏÏÏÏÏÏÏÏÏÏÏÏÏÏÏÏÏÏÏÏÏÏÏÏÏÏÏÏÏÏÏÏÏÏÏÏÏÏÏÏÏÏÏÏÏÏÏÏÏÏÏÏÏÏÏÏÏÏÏÏÏÏÏÏÏÏÏ 10,337Community Reinvestment Fund/Ontario Municipal Partnership Fund ÏÏÏÏÏÏÏÏÏÏÏÏÏÏÏÏÏÏÏ 557Community Reinvestment Fund One-Time Transition Funding ÏÏÏÏÏÏÏÏÏÏÏÏÏÏÏÏÏÏÏÏÏÏÏÏÏ ÌElectricity Consumer Price Protection Fund ÏÏÏÏÏÏÏÏÏÏÏÏÏÏÏÏÏÏÏÏÏÏÏÏÏÏÏÏÏÏÏÏÏÏÏÏÏÏÏÏÏÏ ÌPower PurchasesÏÏÏÏÏÏÏÏÏÏÏÏÏÏÏÏÏÏÏÏÏÏÏÏÏÏÏÏÏÏÏÏÏÏÏÏÏÏÏÏÏÏÏÏÏÏÏÏÏÏÏÏÏÏÏÏÏÏÏÏÏÏÏÏÏÏ 815Contingency Fund ÏÏÏÏÏÏÏÏÏÏÏÏÏÏÏÏÏÏÏÏÏÏÏÏÏÏÏÏÏÏÏÏÏÏÏÏÏÏÏÏÏÏÏÏÏÏÏÏÏÏÏÏÏÏÏÏÏÏÏÏÏÏÏÏÏ Ì
Government Services ÏÏÏÏÏÏÏÏÏÏÏÏÏÏÏÏÏÏÏÏÏÏÏÏÏÏÏÏÏÏÏÏÏÏÏÏÏÏÏÏÏÏÏÏÏÏÏÏÏÏÏÏÏÏÏÏÏÏÏÏÏÏÏÏ 474Pension and Other Employee Future BeneÑts ÏÏÏÏÏÏÏÏÏÏÏÏÏÏÏÏÏÏÏÏÏÏÏÏÏÏÏÏÏÏÏÏÏÏÏÏÏÏÏÏ 63
Health and Long-Term Care ÏÏÏÏÏÏÏÏÏÏÏÏÏÏÏÏÏÏÏÏÏÏÏÏÏÏÏÏÏÏÏÏÏÏÏÏÏÏÏÏÏÏÏÏÏÏÏÏÏÏÏÏÏÏÏÏÏÏ 23,998SARS-Related and Major One-Time Health Costs ÏÏÏÏÏÏÏÏÏÏÏÏÏÏÏÏÏÏÏÏÏÏÏÏÏÏÏÏÏÏÏÏÏÏÏÏ Ì
Health Promotion ÏÏÏÏÏÏÏÏÏÏÏÏÏÏÏÏÏÏÏÏÏÏÏÏÏÏÏÏÏÏÏÏÏÏÏÏÏÏÏÏÏÏÏÏÏÏÏÏÏÏÏÏÏÏÏÏÏÏÏÏÏÏÏÏÏÏÏÏ 143Intergovernmental AÅairsÏÏÏÏÏÏÏÏÏÏÏÏÏÏÏÏÏÏÏÏÏÏÏÏÏÏÏÏÏÏÏÏÏÏÏÏÏÏÏÏÏÏÏÏÏÏÏÏÏÏÏÏÏÏÏÏÏÏÏÏÏ 6Labour ÏÏÏÏÏÏÏÏÏÏÏÏÏÏÏÏÏÏÏÏÏÏÏÏÏÏÏÏÏÏÏÏÏÏÏÏÏÏÏÏÏÏÏÏÏÏÏÏÏÏÏÏÏÏÏÏÏÏÏÏÏÏÏÏÏÏÏÏÏÏÏÏÏÏÏÏÏ 110Municipal AÅairs and Housing ÏÏÏÏÏÏÏÏÏÏÏÏÏÏÏÏÏÏÏÏÏÏÏÏÏÏÏÏÏÏÏÏÏÏÏÏÏÏÏÏÏÏÏÏÏÏÏÏÏÏÏÏÏÏÏÏ 1,148Natural ResourcesÏÏÏÏÏÏÏÏÏÏÏÏÏÏÏÏÏÏÏÏÏÏÏÏÏÏÏÏÏÏÏÏÏÏÏÏÏÏÏÏÏÏÏÏÏÏÏÏÏÏÏÏÏÏÏÏÏÏÏÏÏÏÏÏÏÏÏ 508Northern Development and MinesÏÏÏÏÏÏÏÏÏÏÏÏÏÏÏÏÏÏÏÏÏÏÏÏÏÏÏÏÏÏÏÏÏÏÏÏÏÏÏÏÏÏÏÏÏÏÏÏÏÏÏÏÏ 446OÇce of Francophone AÅairsÏÏÏÏÏÏÏÏÏÏÏÏÏÏÏÏÏÏÏÏÏÏÏÏÏÏÏÏÏÏÏÏÏÏÏÏÏÏÏÏÏÏÏÏÏÏÏÏÏÏÏÏÏÏÏÏÏ 5Public Infrastructure Renewal(1) ÏÏÏÏÏÏÏÏÏÏÏÏÏÏÏÏÏÏÏÏÏÏÏÏÏÏÏÏÏÏÏÏÏÏÏÏÏÏÏÏÏÏÏÏÏÏÏÏÏÏÏÏÏÏ 3Capital Contingency Fund ÏÏÏÏÏÏÏÏÏÏÏÏÏÏÏÏÏÏÏÏÏÏÏÏÏÏÏÏÏÏÏÏÏÏÏÏÏÏÏÏÏÏÏÏÏÏÏÏÏÏÏÏÏÏÏÏÏÏÏÏ ÌResearch and Innovation ÏÏÏÏÏÏÏÏÏÏÏÏÏÏÏÏÏÏÏÏÏÏÏÏÏÏÏÏÏÏÏÏÏÏÏÏÏÏÏÏÏÏÏÏÏÏÏÏÏÏÏÏÏÏÏÏÏÏÏÏÏ 150Secretariat for Aboriginal AÅairs ÏÏÏÏÏÏÏÏÏÏÏÏÏÏÏÏÏÏÏÏÏÏÏÏÏÏÏÏÏÏÏÏÏÏÏÏÏÏÏÏÏÏÏÏÏÏÏÏÏÏÏÏÏÏ 16Tourism ÏÏÏÏÏÏÏÏÏÏÏÏÏÏÏÏÏÏÏÏÏÏÏÏÏÏÏÏÏÏÏÏÏÏÏÏÏÏÏÏÏÏÏÏÏÏÏÏÏÏÏÏÏÏÏÏÏÏÏÏÏÏÏÏÏÏÏÏÏÏÏÏÏÏÏÏ 139Training, Colleges and UniversitiesÏÏÏÏÏÏÏÏÏÏÏÏÏÏÏÏÏÏÏÏÏÏÏÏÏÏÏÏÏÏÏÏÏÏÏÏÏÏÏÏÏÏÏÏÏÏÏÏÏÏÏÏ 3,264Transportation ÏÏÏÏÏÏÏÏÏÏÏÏÏÏÏÏÏÏÏÏÏÏÏÏÏÏÏÏÏÏÏÏÏÏÏÏÏÏÏÏÏÏÏÏÏÏÏÏÏÏÏÏÏÏÏÏÏÏÏÏÏÏÏÏÏÏÏÏÏÏ 1,482Year-End Savings ÏÏÏÏÏÏÏÏÏÏÏÏÏÏÏÏÏÏÏÏÏÏÏÏÏÏÏÏÏÏÏÏÏÏÏÏÏÏÏÏÏÏÏÏÏÏÏÏÏÏÏÏÏÏÏÏÏÏÏÏÏÏÏÏÏÏÏ Ì
Total Expense ÏÏÏÏÏÏÏÏÏÏÏÏÏÏÏÏÏÏÏÏÏÏÏÏÏÏÏÏÏÏÏÏÏÏÏÏÏÏÏÏÏÏÏÏÏÏÏÏÏÏÏÏÏÏÏÏÏÏÏÏÏÏÏÏÏÏÏÏÏÏ 66,159
Source: Ontario Ministry of Finance.
(1) Credit expense amounts relate to consolidation adjustments between Ontario Realty Corporation(ORC) and ministries to reÖect the net capital spending for the year.
27

The following table provides an overview of the Province's expense information for each of the Ñscalyears from 2002-03 to 2006-07. Beginning with the 2006 Ontario Budget, the presentation of expensechanged to provide details on a total expense basis, rather than diÅerentiating between operating andcapital expense. Historical program expense Ñgures for the Province of Ontario have been restated toreÖect changes in the government's ministry structure that occurred in Ñscal year 2005-06.
ONTARIO'S TOTAL EXPENSE
% of TotalActual Outlook(1) Expense
TOTAL EXPENSE 2002-03 2003-04 2004-05 2005-06 2006-07 2006-07
($ millions)
Agriculture, Food and Rural AÅairs ÏÏÏÏÏÏÏÏÏÏÏÏ 666 843 799 865 880 1.0One-Time and Extraordinary Assistance ÏÏÏÏÏ 18 64 601 282 192 0.2
Attorney General ÏÏÏÏÏÏÏÏÏÏÏÏÏÏÏÏÏÏÏÏÏÏÏÏÏÏÏÏ 1,103 1,231 1,209 1,291 1,301 1.5Board of Internal Economy ÏÏÏÏÏÏÏÏÏÏÏÏÏÏÏÏÏÏÏ 146 196 145 150 169 0.2Children and Youth ServicesÏÏÏÏÏÏÏÏÏÏÏÏÏÏÏÏÏÏ 2,457 2,660 2,851 3,330 3,279 3.7Citizenship and Immigration ÏÏÏÏÏÏÏÏÏÏÏÏÏÏÏÏÏÏ 55 55 64 93 91 0.1Community and Social ServicesÏÏÏÏÏÏÏÏÏÏÏÏÏÏÏ 5,844 5,990 6,379 6,737 7,070 8.0Community Safety and Correctional ServicesÏÏÏ 1,713 1,704 1,749 1,767 1,887 2.1CultureÏÏÏÏÏÏÏÏÏÏÏÏÏÏÏÏÏÏÏÏÏÏÏÏÏÏÏÏÏÏÏÏÏÏÏÏÏÏ 373 327 344 475 366 0.4Democratic Renewal Secretariat ÏÏÏÏÏÏÏÏÏÏÏÏÏÏ Ì Ì 2 2 10 0.0Economic Development and Trade ÏÏÏÏÏÏÏÏÏÏÏÏ 104 89 84 202 353 0.4Education ÏÏÏÏÏÏÏÏÏÏÏÏÏÏÏÏÏÏÏÏÏÏÏÏÏÏÏÏÏÏÏÏÏÏÏ 345 352 368 418 446 0.5
School Boards(2) ÏÏÏÏÏÏÏÏÏÏÏÏÏÏÏÏÏÏÏÏÏÏÏÏÏÏ 8,739 9,400 10,251 10,886 11,219 12.7Teachers' Pension Plan (TPP) ÏÏÏÏÏÏÏÏÏÏÏÏÏ 238 235 240 295 408 0.5
EnergyÏÏÏÏÏÏÏÏÏÏÏÏÏÏÏÏÏÏÏÏÏÏÏÏÏÏÏÏÏÏÏÏÏÏÏÏÏÏ 190 169 194 207 242 0.3EnvironmentÏÏÏÏÏÏÏÏÏÏÏÏÏÏÏÏÏÏÏÏÏÏÏÏÏÏÏÏÏÏÏÏÏ 250 265 307 275 302 0.3Executive OÇces ÏÏÏÏÏÏÏÏÏÏÏÏÏÏÏÏÏÏÏÏÏÏÏÏÏÏÏÏ 20 24 19 19 19 0.0Finance ÏÏÏÏÏÏÏÏÏÏÏÏÏÏÏÏÏÏÏÏÏÏÏÏÏÏÏÏÏÏÏÏÏÏÏÏÏ 1,082 1,229 1,067 1,034 1,167 1.3
Interest on Debt ÏÏÏÏÏÏÏÏÏÏÏÏÏÏÏÏÏÏÏÏÏÏÏÏÏÏÏ 9,694 9,604 9,368 9,019 9,204 10.5Community Reinvestment Fund/Ontario
Municipal Partnership FundÏÏÏÏÏÏÏÏÏÏÏÏÏÏÏ 622 651 626 714 731 0.8Community Reinvestment Fund One-Time
Transition Funding ÏÏÏÏÏÏÏÏÏÏÏÏÏÏÏÏÏÏÏÏÏÏÏ Ì Ì 233 Ì Ì ÌElectricity Consumer Price Protection Fund ÏÏ 665 253 Ì Ì Ì ÌPower Purchases ÏÏÏÏÏÏÏÏÏÏÏÏÏÏÏÏÏÏÏÏÏÏÏÏÏÏ 786 797 840 803 988 1.1Contingency Fund ÏÏÏÏÏÏÏÏÏÏÏÏÏÏÏÏÏÏÏÏÏÏÏÏÏ Ì Ì Ì Ì 1,292 1.5
Government Services ÏÏÏÏÏÏÏÏÏÏÏÏÏÏÏÏÏÏÏÏÏÏÏÏ 331 467 898 562 811 0.9Pensions and Other Employee Future
BeneÑtsÏÏÏÏÏÏÏÏÏÏÏÏÏÏÏÏÏÏÏÏÏÏÏÏÏÏÏÏÏÏÏÏÏ 102 309 458 729 594 0.7Health and Long-Term Care(3) ÏÏÏÏÏÏÏÏÏÏÏÏÏÏÏÏ 14,758 16,232 17,572 17,722 18,687 21.2
Hospitals(2),(3) ÏÏÏÏÏÏÏÏÏÏÏÏÏÏÏÏÏÏÏÏÏÏÏÏÏÏÏÏÏ 11,241 12,830 13,759 14,816 16,463 18.7Health Promotion ÏÏÏÏÏÏÏÏÏÏÏÏÏÏÏÏÏÏÏÏÏÏÏÏÏÏÏÏ 175 204 241 296 363 0.4Intergovernmental AÅairs ÏÏÏÏÏÏÏÏÏÏÏÏÏÏÏÏÏÏÏÏÏ 9 6 13 10 9 0.0LabourÏÏÏÏÏÏÏÏÏÏÏÏÏÏÏÏÏÏÏÏÏÏÏÏÏÏÏÏÏÏÏÏÏÏÏÏÏÏ 123 117 129 141 150 0.2Municipal AÅairs and Housing ÏÏÏÏÏÏÏÏÏÏÏÏÏÏÏÏ 656 635 772 928 693 0.8Natural Resources ÏÏÏÏÏÏÏÏÏÏÏÏÏÏÏÏÏÏÏÏÏÏÏÏÏÏÏ 526 627 563 632 806 0.9Northern Development and Mines ÏÏÏÏÏÏÏÏÏÏÏÏÏ 302 189 320 337 347 0.4OÇce of Francophone AÅairsÏÏÏÏÏÏÏÏÏÏÏÏÏÏÏÏÏ 3 3 3 4 4 0.0Public Infrastructure Renewal(4)ÏÏÏÏÏÏÏÏÏÏÏÏÏÏÏ 93 (35) 41 107 120 0.1
Contingency Fund ÏÏÏÏÏÏÏÏÏÏÏÏÏÏÏÏÏÏÏÏÏÏÏÏÏ Ì Ì Ì Ì 169 0.2Research and Innovation ÏÏÏÏÏÏÏÏÏÏÏÏÏÏÏÏÏÏÏÏÏ 158 194 263 370 345 0.4Secretariat for Aboriginal AÅairs ÏÏÏÏÏÏÏÏÏÏÏÏÏÏ 18 15 21 50 21 0.0TourismÏÏÏÏÏÏÏÏÏÏÏÏÏÏÏÏÏÏÏÏÏÏÏÏÏÏÏÏÏÏÏÏÏÏÏÏÏ 155 212 167 210 161 0.2Training, Colleges and Universities ÏÏÏÏÏÏÏÏÏÏÏÏ 2,473 2,834 3,316 3,529 3,876 4.4
Colleges(2) ÏÏÏÏÏÏÏÏÏÏÏÏÏÏÏÏÏÏÏÏÏÏÏÏÏÏÏÏÏÏÏÏ 987 1,090 1,289 1,185 1,359 1.5TransportationÏÏÏÏÏÏÏÏÏÏÏÏÏÏÏÏÏÏÏÏÏÏÏÏÏÏÏÏÏÏÏ 1,554 1,816 1,831 2,203 2,093 2.4
Move OntarioÏÏÏÏÏÏÏÏÏÏÏÏÏÏÏÏÏÏÏÏÏÏÏÏÏÏÏÏÏÏ Ì Ì Ì 1,232 6 0.0Year-End Savings ÏÏÏÏÏÏÏÏÏÏÏÏÏÏÏÏÏÏÏÏÏÏÏÏÏÏÏ Ì Ì Ì Ì (700) (0.8)
Total Expense ÏÏÏÏÏÏÏÏÏÏÏÏÏÏÏÏÏÏÏÏÏÏÏÏÏÏÏÏÏÏ 68,774 73,883 79,396 83,927 87,993 100
Source: Ontario Ministry of Finance.
28
(1) Second-quarter Ñscal forecast as at September 30, 2006.
(2) Starting in 2005-06, the Province's Ñnancial reporting was expanded to include hospitals, schoolboards and colleges using one-line consolidation. Prior to 2005-06, historical Ñgures reÖect grants tothese entities for comparison purposes.
(3) The 2003-04 expenses for Health and Long-Term Care and Hospitals include $824 million ofSARS-related and major one-time health costs.
(4) Credit expense amounts relate to consolidation adjustments between the Ontario Realty Corporation(""ORC'') and ministries to reÖect net spending for the year.
Health Sector. The health sector is comprised of the Ministry of Health and Long-Term Care and theMinistry of Health Promotion. The Health sector is the largest single component of Provincial expense,accounting for a projected 40.4% of total expense in 2006-07. Ontario's health care system is primarily fundedby Provincial revenues. Major components of health expense include the net expense of operating publichospitals, payments to physicians and other health care practitioners, and prescription drug programs.
Education Sector. The Education sector consists of the Ministry of Education. The largest costcomponent is the net expense of school boards which receive substantial grants from the Province.Additional funding for public education is provided through local property taxes. Education Sectorexpense is projected to be 13.7% of total expense in 2006-07.
Postsecondary Education and Training Sector. This sector consists of the Ministry of Training,Colleges and Universities. Major components of expense include operating grants to Universities, as wellas the net expense of Colleges of Applied Arts and Technology. The Postsecondary Education andTraining Sector is projected to be 5.9% of total expense in 2006-07.
Social Services Sector. This sector is comprised of the Ministry of Community and Social Services andthe Ministry of Children and Youth Services. The Province provides a wide range of social services, includingsocial assistance, childcare, child welfare services, housing assistance and drug benefits for social assistancerecipients. The Social Services Sector is projected to be 11.8% of total expense in 2006-07.
Justice Sector. The Justice Sector is comprised of the Ministry of the Attorney General and theMinistry of Community Safety and Correctional Services. The Justice Sector is projected to be 3.6% oftotal expense in 2006-07.
Other Programs Sector. All other expenses Ì excluding Interest on Debt Ì are included in theOther Program Sector, representing a projected 14.1% of total expense in 2006-07.
Interest on Debt represents a projected 10.5% of total expense in 2006-07.
(5) Outline of Principal Provincial Institutions
The Province has established a number of Crown corporations, which are primarily intended toprovide goods and services needed to implement approved government policy and programs or toprovide a regulatory function for operations authorized by government legislation. Among the moreprominent Ontario Crown corporations are the Liquor Control Board of Ontario, Ontario FinancingAuthority, the OLGC, the Ontario Securities Commission, the Ontario Strategic Infrastructure FinancingAuthority (formerly, the Ontario Municipal Economic Infrastructure Financing Authority) and the OntarioNorthland Transportation Commission.
Until its restructuring in April 1999 and its continuation as Ontario Electricity Financial Corporation(""OEFC''), Ontario Hydro had a mandate to generate and supply power in Ontario. For a description ofOntario Hydro, its restructuring and the operations of its successor companies, See ""4. Public Debt Ì(2) Assets and Liabilities, (iii) Liabilities Ì Ontario Electricity Industry'' below.
(6) Sinking Funds
The Province of Ontario does not have a sinking funds system.
29

4. PUBLIC DEBT
(1) Debt
The Province has met its Ñnancing requirements through a combination of public borrowing, non-public borrowing and increases in cash and temporary investments. There is no constitutional limit onborrowing.
Publicly Held Debt
The majority of Ontario's borrowing requirements are met through public market borrowing.See ""4. Public Debt Ì (2) Assets and Liabilities Ì (iii) Liabilities Ì Publicly Held Debt'' below.
Non-Publicly Held Debt
The Public Service Pension Plan (""PSPP''), the Ontario Public Service Employees Union (""OPSEU'')Pension Plan and the Ontario Teachers' Pension Plan (""OTPP''). Prior to January 1, 1990, PSPP andOTPP were required to invest their net cash Öow in debt issued by the Province. Legislation now allowsthese Plans to invest in public capital markets, and they are no longer a source of direct Ñnancing for theProvince. The OPSEU Pension Plan was created in June 1994 through legislation dividing the PSPP andcreating a separate plan for OPSEU members and for certain other unionized non-managementemployees. See ""4. Public Debt Ì (2) Assets and Liabilities Ì (iii) Liabilities Ì Non-Publicly HeldDebt'' below.
The Canada Pension Plan Investment Fund (""CPP''). CPP obtains monies from a compulsorynational contributory pension plan in which all provinces other than Quebec participate. Each month, thenet cash Öow is invested in non-marketable securities issued by participating provinces, agents of theCrown and the Government of Canada. The amount available to a province is based on the proportion oftotal contributions coming from that province.
BORROWING PROGRAM
CurrentActual Outlook
2003-04(1) 2004-05(1) 2005-06(1) 2006-07(2)
(in millions)
Debt IssuesÏÏÏÏÏÏÏÏÏÏÏÏÏÏÏÏÏÏÏÏÏÏÏÏÏÏÏÏÏÏÏÏÏÏÏÏÏÏÏ $28,178 $26,141 $19,955 $19,369Retirements:
Publicly Held DebtÏÏÏÏÏÏÏÏÏÏÏÏÏÏÏÏÏÏÏÏÏÏÏÏÏÏÏÏÏÏÏ 15,625 15,861 18,855 13,856Canada Pension Plan Investment FundÏÏÏÏÏÏÏÏÏÏÏÏ 1,201 1,133 1,214 351Ontario Teachers' Pension Plan ÏÏÏÏÏÏÏÏÏÏÏÏÏÏÏÏÏÏ 900 821 1,070 1,185Public Service Pension PlanÏÏÏÏÏÏÏÏÏÏÏÏÏÏÏÏÏÏÏÏÏÏ 147 166 180 204Ontario Public Service Employees' Union
(""OPSEU'') Pension FundÏÏÏÏÏÏÏÏÏÏÏÏÏÏÏÏÏÏÏÏÏ 70 79 86 97Municipal Employee Retirement Fund ÏÏÏÏÏÏÏÏÏÏÏÏÏ 164 Ì Ì 103Other ÏÏÏÏÏÏÏÏÏÏÏÏÏÏÏÏÏÏÏÏÏÏÏÏÏÏÏÏÏÏÏÏÏÏÏÏÏÏÏÏÏÏ 34 13 19 47
18,141 18,073 21,424 15,843
Net Debt Retirements/(Issues) ÏÏÏÏÏÏÏÏÏÏÏÏÏÏÏÏÏÏÏÏ (10,037) (8,068) 1,469 (3,526)Other Items(3)ÏÏÏÏÏÏÏÏÏÏÏÏÏÏÏÏÏÏÏÏÏÏÏÏÏÏÏÏÏÏÏÏÏÏÏÏÏ 3,240 (281) 5,005 1,295Acquisition less Amortization of Tangible Capital
Assets ÏÏÏÏÏÏÏÏÏÏÏÏÏÏÏÏÏÏÏÏÏÏÏÏÏÏÏÏÏÏÏÏÏÏÏÏÏÏÏÏÏ 427 550 856 282Increase/(Decrease) in Cash, Cash Equivalents and
Temporary Investments(4)ÏÏÏÏÏÏÏÏÏÏÏÏÏÏÏÏÏÏÏÏÏÏÏÏ 887 6,244 (7,032) Ì
Surplus/(DeÑcit) ÏÏÏÏÏÏÏÏÏÏÏÏÏÏÏÏÏÏÏÏÏÏÏÏÏÏÏÏÏÏÏÏÏ $(5,483) $(1,555) $ 298 $(1,949)
Source: Ontario Ministry of Finance.
30
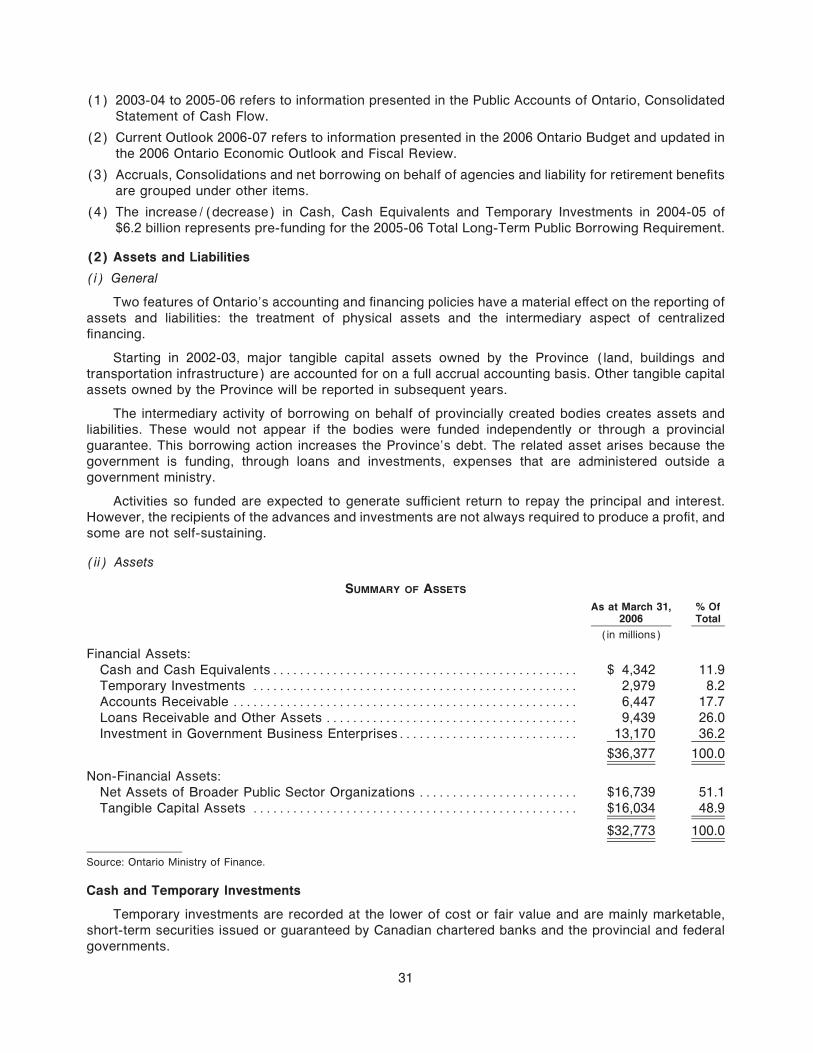
(1) 2003-04 to 2005-06 refers to information presented in the Public Accounts of Ontario, ConsolidatedStatement of Cash Flow.
(2) Current Outlook 2006-07 refers to information presented in the 2006 Ontario Budget and updated inthe 2006 Ontario Economic Outlook and Fiscal Review.
(3) Accruals, Consolidations and net borrowing on behalf of agencies and liability for retirement beneÑtsare grouped under other items.
(4) The increase/(decrease) in Cash, Cash Equivalents and Temporary Investments in 2004-05 of$6.2 billion represents pre-funding for the 2005-06 Total Long-Term Public Borrowing Requirement.
(2) Assets and Liabilities
(i) General
Two features of Ontario's accounting and Ñnancing policies have a material eÅect on the reporting ofassets and liabilities: the treatment of physical assets and the intermediary aspect of centralizedÑnancing.
Starting in 2002-03, major tangible capital assets owned by the Province (land, buildings andtransportation infrastructure) are accounted for on a full accrual accounting basis. Other tangible capitalassets owned by the Province will be reported in subsequent years.
The intermediary activity of borrowing on behalf of provincially created bodies creates assets andliabilities. These would not appear if the bodies were funded independently or through a provincialguarantee. This borrowing action increases the Province's debt. The related asset arises because thegovernment is funding, through loans and investments, expenses that are administered outside agovernment ministry.
Activities so funded are expected to generate suÇcient return to repay the principal and interest.However, the recipients of the advances and investments are not always required to produce a proÑt, andsome are not self-sustaining.
(ii) Assets
SUMMARY OF ASSETS
As at March 31, % Of2006 Total
(in millions)
Financial Assets:Cash and Cash EquivalentsÏÏÏÏÏÏÏÏÏÏÏÏÏÏÏÏÏÏÏÏÏÏÏÏÏÏÏÏÏÏÏÏÏÏÏÏÏÏÏÏÏÏÏÏÏÏ $ 4,342 11.9Temporary Investments ÏÏÏÏÏÏÏÏÏÏÏÏÏÏÏÏÏÏÏÏÏÏÏÏÏÏÏÏÏÏÏÏÏÏÏÏÏÏÏÏÏÏÏÏÏÏÏÏÏ 2,979 8.2Accounts Receivable ÏÏÏÏÏÏÏÏÏÏÏÏÏÏÏÏÏÏÏÏÏÏÏÏÏÏÏÏÏÏÏÏÏÏÏÏÏÏÏÏÏÏÏÏÏÏÏÏÏÏÏÏ 6,447 17.7Loans Receivable and Other Assets ÏÏÏÏÏÏÏÏÏÏÏÏÏÏÏÏÏÏÏÏÏÏÏÏÏÏÏÏÏÏÏÏÏÏÏÏÏÏ 9,439 26.0Investment in Government Business EnterprisesÏÏÏÏÏÏÏÏÏÏÏÏÏÏÏÏÏÏÏÏÏÏÏÏÏÏÏ 13,170 36.2
$36,377 100.0
Non-Financial Assets:Net Assets of Broader Public Sector Organizations ÏÏÏÏÏÏÏÏÏÏÏÏÏÏÏÏÏÏÏÏÏÏÏÏ $16,739 51.1Tangible Capital Assets ÏÏÏÏÏÏÏÏÏÏÏÏÏÏÏÏÏÏÏÏÏÏÏÏÏÏÏÏÏÏÏÏÏÏÏÏÏÏÏÏÏÏÏÏÏÏÏÏÏ $16,034 48.9
$32,773 100.0
Source: Ontario Ministry of Finance.
Cash and Temporary Investments
Temporary investments are recorded at the lower of cost or fair value and are mainly marketable,short-term securities issued or guaranteed by Canadian chartered banks and the provincial and federalgovernments.
31
Between April 1, 2005 and March 31, 2006, the month-end level of cash and temporary investmentsvaried from a low of approximately $5,887 million to a high of approximately $13,275 million. The cashand temporary investments are used to accommodate diÅerences in revenue and expense Öows duringeach Ñscal year and to provide Öexibility for debt management.
Accounts Receivable
Accounts receivable comprise taxes receivable, receivables from the Government of Canada andother receivables. Accounts receivables are recorded at cost less a provision for doubtful accounts whencollectibility is considered doubtful.
Loans Receivable and Other Assets
Loans receivable with signiÑcant concessionary terms are recorded at the date of issuance at facevalue discounted by the amount of the grant portion. The grant portion is recognized as an expense at thedate of issuance of the loan. The amount of the loan discount is amortized to revenue over the term of theloan. Loans receivable include amounts owing from government business enterprises.
Investment in Government Business Enterprises
Investment in Government Business Enterprises represents the net assets of government businessenterprises recorded on the modiÑed equity basis as described under Principles of Consolidation.
Government business enterprises are deÑned as those Crown corporations, boards andcommissions which have the Ñnancial and operating authority to carry on a business, have as theirprincipal activity and source of revenue the selling of goods and services to individual and non-government organizations and are able to maintain their operations and meet their obligations fromrevenues generated outside the government reporting entity.
The activities of government business enterprises are recorded in the Ñnancial statements under themodiÑed equity method. Under this method, government business enterprises are reported in accordancewith accounting principles generally accepted for business enterprises. Their combined net assets areincluded in the Ñnancial statements as Investment in Government Business Enterprises on theConsolidated Statement of Financial Position and their combined net income is shown as a separate itemon the Consolidated Statement of Operations. This method does not require the elimination of inter-organizational balances.
Net Assets of Broader Public Sector Organizations
The net assets of the broader public sector (BPS) organizations are comprised of tangible capitalassets and Ñnancial assets of BPS organizations net of their liabilities. While the assets of BPSorganizations are consolidated, they are owned, managed and operated by members of the BPSorganizations. Tangible capital assets of hospitals and colleges are recorded at historical cost in theirÑnancial statements. Although school boards do not presently record tangible capital assets in theirÑnancial statements, their Ñnancial information has been adjusted upon consolidation to recognize theestimated historical cost of their land and building assets.
Tangible Capital Assets
Tangible capital assets are recorded at historical cost. Historical cost includes the costs directlyrelated to the acquisition, design, construction, development, improvement or betterment of tangiblecapital assets. Cost includes overheads directly attributable to construction and development butexcludes interest. Estimated historical cost was used to record existing tangible capital assets if actualcost was unknown when the Province Ñrst implemented tangible capital assets accounting.
(iii) Liabilities
Overview
Liabilities include debt issued for Provincial purposes and for Ontario Electricity FinancialCorporation, accounts payable and accrued liabilities, pension liabilities for the Public Service Pension
32

Plan, the Ontario Public Service Employees' Union (""OPSEU'') Pension Plan, the Ontario Teachers'Pension Plan, Power Purchase Contracts, Nuclear Funding Liability and other liabilities.
SUMMARY OF LIABILITIES
March 31, 2006 % of Total
(in millions)
Liabilities:Publicly Held Debt(1) ÏÏÏÏÏÏÏÏÏÏÏÏÏÏÏÏÏÏÏÏÏÏÏÏÏÏÏÏÏÏÏÏÏÏÏÏÏÏÏÏÏÏÏÏÏÏÏÏÏÏÏÏ $130,760 73.3
Non-Publicly Held DebtCanada Pension Plan Investment Fund ÏÏÏÏÏÏÏÏÏÏÏÏÏÏÏÏÏÏÏÏÏÏÏÏÏÏÏÏÏÏÏÏÏ 10,233 5.8Ontario Teachers' Pension PlanÏÏÏÏÏÏÏÏÏÏÏÏÏÏÏÏÏÏÏÏÏÏÏÏÏÏÏÏÏÏÏÏÏÏÏÏÏÏÏÏ 7,596 4.3Canada Mortgage and Housing Corporation ÏÏÏÏÏÏÏÏÏÏÏÏÏÏÏÏÏÏÏÏÏÏÏÏÏÏÏÏ 960 0.5Public Service Pension Plan ÏÏÏÏÏÏÏÏÏÏÏÏÏÏÏÏÏÏÏÏÏÏÏÏÏÏÏÏÏÏÏÏÏÏÏÏÏÏÏÏÏÏÏ 2,705 1.5Ontario Public Service Employees' Union (""OPSEU'') Pension Fund ÏÏÏÏÏ 1,285 0.7Other ÏÏÏÏÏÏÏÏÏÏÏÏÏÏÏÏÏÏÏÏÏÏÏÏÏÏÏÏÏÏÏÏÏÏÏÏÏÏÏÏÏÏÏÏÏÏÏÏÏÏÏÏÏÏÏÏÏÏÏÏÏÏÏÏ 1,367 0.8
24,146 13.6
Total Debt IssuedÏÏÏÏÏÏÏÏÏÏÏÏÏÏÏÏÏÏÏÏÏÏÏÏÏÏÏÏÏÏÏÏÏÏÏÏÏÏÏÏÏÏÏÏÏÏÏÏÏÏÏÏÏÏÏ 154,906 86.9Accounts Payable and Other Liabilities ÏÏÏÏÏÏÏÏÏÏÏÏÏÏÏÏÏÏÏÏÏÏÏÏÏÏÏÏÏÏÏÏÏÏÏ 17,556 9.9Power Purchase Contracts ÏÏÏÏÏÏÏÏÏÏÏÏÏÏÏÏÏÏÏÏÏÏÏÏÏÏÏÏÏÏÏÏÏÏÏÏÏÏÏÏÏÏÏÏÏÏ 3,389 1.9Nuclear Funding LiabilitiesÏÏÏÏÏÏÏÏÏÏÏÏÏÏÏÏÏÏÏÏÏÏÏÏÏÏÏÏÏÏÏÏÏÏÏÏÏÏÏÏÏÏÏÏÏÏÏ 768 0.4Pensions and Other Employee Future BeneÑts ÏÏÏÏÏÏÏÏÏÏÏÏÏÏÏÏÏÏÏÏÏÏÏÏÏÏÏÏ 1,686 0.9
Total Liabilities ÏÏÏÏÏÏÏÏÏÏÏÏÏÏÏÏÏÏÏÏÏÏÏÏÏÏÏÏÏÏÏÏÏÏÏÏÏÏÏÏÏÏÏÏÏÏÏÏÏÏÏÏÏÏÏÏÏ $178,305 100.0
Total obligations guaranteed(2) ÏÏÏÏÏÏÏÏÏÏÏÏÏÏÏÏÏÏÏÏÏÏÏÏÏÏÏÏÏÏÏÏÏÏÏÏÏÏÏÏÏÏ $ 3,300 100.0
Source: Ontario Ministry of Finance.
(1) All balances are expressed in Canadian dollars. The balances above reÖect the eÅect of relatedderivatives contracts entered into by the Province. See ""4. Public Debt Ì (5) Financial Tables Ì I.Summary of Net Debt and Accumulated DeÑcit Ì Risk Management and Derivative FinancialInstruments''.
(2) These are outstanding loans guaranteed and other contingencies as at March 31, 2006. In addition tothe above reported obligations, the Province has entered into the following agreements:
Social Housing Loan Insurance Agreements.
For all non-proÑt housing projects in the provincial portfolio, the Province is liable to indemnify andreimburse the Canada Mortgage and Housing Corporation (""CMHC'') for any net costs, includingany environmental liabilities, incurred as a result of project defaults, directly or indirectly, through theMinistry of Municipal AÅairs and Housing or the Ontario Housing Corporation. At March 31, 2006,there were $8.6 billion (2005, $8.8 billion) of mortgage loans outstanding. As operating subsidiesprovided are suÇcient to ensure that all mortgage payments can be made when due, default isunlikely. To date, there have been no claims for defaults on insured mortgage loans.
Ontario Nuclear Funds Agreement.
See ""4. Public Debt Ì (2) Assets and Liabilities, (iii) Liabilities Ì Ontario Electricity Industry'' below.
Publicly Held Debt
Publicly held debt is debt issued to the general public. As at March 31, 2006, the total publicly helddebt issued was $130,760 million, $103,360 million of which was issued in Canadian dollars (includes$5,214 million of treasury bills), $19,118 million in U.S. dollars (which includes $706 million inU.S. commercial paper), $1,596 million in Japanese yen, $3,426 million in euros and $3,260 million inother currencies.
From April 1, 2006 through November 16, 2006, the Province announced public oÅerings of bondsand notes totaling approximately $12.9 billion of which $11.6 billion were for provincial purposes and
33

$1.3 billion was debt incurred for the OEFC. The tables below provide a summary of the publicly held debtissued by the Province from April 1, 2006 through November 7, 2006 for provincial purposes.
DEBT ISSUED BY THE PROVINCE FOR PROVINCIAL PURPOSES
PrincipalDate of Issue Date of Maturity Interest Rate % Funds (in millions) References
27-Apr-2006 27-Apr-2016 5.450 U.S.$ 1,000.0 (2) (13)
01-May-2006 02-Jun-2018 5.500 Canadian$ 25.0 (1) (22)
03-May-2006 02-Dec-2011 4.400 Canadian$ 500.0 (1)
05-May-2006 02-Jun-2018 5.500 Canadian$ 100.0 (1) (22)
05-May-2006 02-Jun-2018 5.500 Canadian$ 35.0 (1) (22)
05-May-2006 02-Jun-2018 5.500 Canadian$ 60.0 (1) (22)
05-May-2006 02-Jun-2018 5.500 Canadian$ 25.0 (1) (22)
10-May-2006 02-Jun-2037 4.700 Canadian$ 500.0 (1) (4)
19-May-2006 02-Jun-2045 4.500 Canadian$ 25.0 (1) (5)
24-May-2006 02-Jun-2046 4.850 Canadian$ 25.0 (8)
07-Jun-2006 02-Jun-2037 4.700 Canadian$ 500.0 (1) (4)
09-Jun-2006 15-Dec-2008 5.700 Canadian$ 57.5 (1)
15-Jun-2006 19-May-2010 4.000 Canadian$ 500.0 (1) (6)
21-Jun-2006 Variable Variable Canadian$ 1,384.3 (7)
11-Jul-2006 02-Jun-2046 4.850 Canadian$ 25.0 (1) (8)
11-Jul-2006 11-Jul-2008 5.500 U.S.$ 500.0 (2) (9)
13-Jul-2006 02-Jun-2043 5.750 Canadian$ 25.0 (1) (10)
14-Jul-2006 08-Mar-2016 4.400 Canadian$ 250.0 (1) (11)
26-Jul-2006 02-Jun-2037 4.700 Canadian$ 500.0 (1) (4)
10-Aug-2006 02-Dec-2011 4.400 Canadian$ 500.0 (1) (12)
21-Aug-2006 08-Mar-2016 4.400 Canadian$ 200.0 (1) (11)
24-Aug-2006 01-Dec-2008 5.700 Canadian$ 57.5 (1) (14)
24-Aug-2006 02-Jun-2046 4.850 Canadian$ 29.7 (1) (8)
01-Sep-2006 02-June-2037 4.700 Canadian$ 300.0 (1) (4)
11-Sep-2006 02-Jun-2035 5.600 Canadian$ 50.0 (1) (16)
12-Sep-2006 02-Jun-2020 4.850 Canadian$ 100.0 (1) (17)
13-Sep-2006 02-Jun-2044 4.600 Canadian$ 27.0 (1)
18-Sep-2006 08-Mar-2016 4.400 Canadian$ 500.0 (1) (11)
19-Sep-2006 02-Jun-2020 4.850 Canadian$ 25.0 (1) (17)
20-Sep-2006 20-Sep-2016 9.000 South African Rand 300.0 (2) (21)
26-Sep-2006 01-Oct-2008 3 CBA°0.03 Canadian$ 250.0 (3) (18)
27-Sep-2006 02-Jun-2037 4.700 Canadian$ 500.0 (1) (4)
29-Sep-2006 01-Oct-2008 3 CBA°0.03 Canadian$ 100.0 (3) (18)
29-Sep-2006 01-Oct-2008 3 CBA°0.03 Canadian$ 50.0 (3) (18)
29-Sep-2006 01-Oct-2008 3 CBA°0.03 Canadian$ 200.0 (3) (18)
02-Oct-2006 01-Oct-2008 3 CBA°0.03 Canadian$ 100.0 (3) (18)
02-Oct-2006 01-Oct-2008 3 CBA°0.03 Canadian$ 50.0 (3) (18)
06-Oct-2006 02-Jun-2046 4.850 Canadian$ 25.0 (1) (8)
10-Oct-2006 02-Jun-2035 5.600 Canadian$ 50.0 (1) (16)
11-Oct-2006 19-May-2009 4.000 Canadian$ 500.0 (1) (19)
18-Oct-2006 18-Oct-2011 5.000 U.S.$ 1,000.0 (1) (20)
02-Nov-2006 02-Jun-2037 4.700 Canadian$ 500.0 (1) (4)
07-Nov-2006 02-Jun-2046 4.850 Canadian$ 50.0 (1) (8)
07-Nov-2006 02-Dec-2041 6.200 Canadian$ 50.0 (1) (15)
* 3 CBA is 3-month Canadian Bankers' Acceptances Rate.
(1) Interest paid semi-annually.
34
(2) Interest paid annually.
(3) Interest paid quarterly.
(4) During the 2006-07 Ñscal year, Series DMTN164 was re-opened seven times, bringing the totalissue size to $3,500 million, including $200 million to OEFC.
(5) During the 2006-07 Ñscal year, Series DMTN153 was re-opened once, bringing the total issue sizeto $175 million.
(6) During the 2006-07 Ñscal year, Series DMTN144 was re-opened once, bringing the total issue sizeto $1,000 million.
(7) Ontario Savings Bonds Series 2006 were available in various types, maturities and interest rates.This was the twelfth issue of provincial savings bonds. The total proceeds from this issue were$1,384.3 million.
(8) During the 2006-07 Ñscal year, Series DMTN166 was re-opened four times, bringing the total issuesize to $154.7 million.
(9) The Province entered into currency exchange agreements that eÅectively converted theseU.S. dollar obligations to Canadian dollar obligations at an exchange rate of 1.113. In addition, theProvince entered into interest rate agreements that eÅectively converted the interest rate obligationto a Ñxed rate of 4.64%.
(10) During the 2006-07 Ñscal year, Series DMTN62 was reopened once, bringing the total issue size to$75 million.
(11) During the 2006-07 Ñscal year, Series DMTN163 was reopened six times, bringing the total issuesize to $2,500 million, including $1,300 million for OEFC.
(12) During the 2006-07 Ñscal year, Series DMTN165 was reopened once, bringing the total issue size to$1,000 million.
(13) The Province entered into currency exchange agreements that eÅectively converted theseU.S. dollar obligations to Canadian dollar obligations at an exchange rate of 1.1377. In addition, theProvince entered into interest rate agreements that eÅectively converted the interest rate obligationto a Ñxed rate of 4.89%.
(14) During the 2006-07 Ñscal year, the Series LZ was re-opened once, bringing the total issue size to$1,607.5 million.
(15) During the 2006-07 Ñscal year, the Series DMTN10 was re-opened once, bringing the total issuesize to $340 million.
(16) During the 2006-07 Ñscal year, the bondholders of Series DMTN168 exercised the option toexchange $100 million to Series DMTN119.
(17) During the 2006-07 Ñscal year, Series DMTN140 was re-opened twice, bringing the total issue sizeto $553 million, including $29 million for OEFC.
(18) During the 2006-07 Ñscal year, Series DMTN85 was re-opened six times bringing the total issue size$3,096 million, including $736 million for OEFC. The Province entered into interest rate agreementsthat eÅectively converted the interest rate obligations on $1,310 million of this debt to a Ñxed rate of3.85% and $550 million to a Öoating one month CBA minus 0.025%.
(19) During the 2006-07 Ñscal year, Series DMTN 106 was re-opened once, bringing the total issue sizeto $1,775 million, including $525 million for OEFC.
(20) The Province entered into currency exchange agreements that eÅectively converted these US dollarobligations to Canadian dollar obligations at an exchange rate of 1.13564. In addition, the Provinceentered into interest rate agreements that eÅectively converted the interest rate obligation to a Ñxedrate of 4.28%.
(21) The Province entered into currency exchange agreement that eÅectively converted this SouthAfrican rand obligation to a Canadian dollar obligation at an Exchange rate of 0.15000. In addition,the Province entered into interest rate agreements that eÅectively converted the interest rateobligation to a Ñxed rate of 4.52%.
35

(22) During the 2006-07 Ñscal year, Series DMTN79 was reopened Ñve times, bringing the total issuesize to $715 million, including $110 million for OEFC.
DEBT ISSUED BY THE PROVINCE FOR ONTARIO ELECTRICITY FINANCIAL CORPORATION (""OEFC'')
PrincipalDate of Issue Date of Maturity Interest Rate % Funds (in millions) References
09-May-2006 02-Jun-2018 5.500 Canadian$ 50.0 (1)
19-May-2006 08-Mar-2016 4.400 Canadian$ 500.0 (1)
05-Jul-2006 05-Jul-2011 8.000 South African Rand 300.0 (2) (3)
14-Jul-2006 08-Mar-2016 4.400 Canadian$ 250.0 (1)
21-Aug-2006 08-Mar-2016 4.400 Canadian$ 300.0 (1)
01-Sep-2006 02-Jun-2037 4.700 Canadian$ 200.0 (1)
(1) Interest paid semi-annually.
(2) Interest paid annually.
(3) The Province entered into currency exchange agreements that eÅectively converted these SouthAfrican rand obligations to Canadian dollar obligations at an exchange rate of 0.17556. In addition,the Province entered into interest rate agreements that eÅectively converted the interest rateobligation to a Ñxed rate of 5.04%.
Ontario Electricity Industry
Ontario Electricity Financial Corporation (""OEFC''), a Crown agency, is the continuation of OntarioHydro and is responsible for the management of that corporation's debt and other liabilities that were nottransferred to successor companies as part of the restructuring of Ontario Hydro in 1999, including theadministration of certain power purchase agreements with non-utility generators. As at March 31, 2006,OEFC had total debt of $28.033 billion (2005, $27.518 billion), excluding short-term overnight lendingfrom the Province. $17.7 billion of OEFC's debt as at March 31, 2006 (2005, $16.8 billion) is held by theProvince and included in total debt and other liabilities.
Ontario Hydro's successor companies include Ontario Power Generation Inc., (""OPG''), ageneration business, and Hydro One Inc., (""Hydro One''), a transmission and distribution business, bothof which are wholly-owned by the Province. In addition, the Independent Electricity System Operator(""IESO'') is the electricity system and market operator and the Electrical Safety Authority is responsiblefor electricity safety inspection. Pursuant to various transfer orders (""Transfer Orders''), assets of theformer Ontario Hydro were transferred to OPG, Hydro One and the IESO in exchange for debt. TheProvince assumed a portion of OPG's and Hydro One's debt in exchange for equity, in order to providethem with commercially acceptable capital structures. As of March 31, 2006, OEFC held notes receivablein the amount of $3.4 billion from OPG, $78 million from the IESO and $8.9 billion from the Province.
Subject to a deductible of $10 million, OEFC has agreed to indemnify Hydro One in respect of (i) thefailure of the Transfer Orders to transfer any asset, right or thing, or any interest therein related to itsbusiness; (ii) any adverse claims or interests, including those of the Crown, subject to certain exclusions,or any deÑciency or lack of title in respect of any asset, right or thing or any interest therein, which wasintended to be transferred; and (iii) the creation, treatment, payment to or from or other dealing with anyequity account of Ontario Hydro, including with respect to certain litigation relating thereto. The Provincehas guaranteed the obligations of OEFC under the indemnity. A similar indemnity provided to OPG wasterminated as of May 31, 2006.
The Electricity Act, 1998 (""Electricity Act'') deÑnes ""stranded debt'' as the amount of OEFC's debtand other liabilities that, in the opinion of the Minister of Finance, cannot reasonably be serviced andretired in a competitive electricity market. As of April 1, 1999, the Ministry of Finance estimated thestranded debt to be approximately $20.9 billion. OEFC's unfunded liability is the net deÑciency of OEFC'sassets over its liabilities. Unfunded liability represents the stranded debt adjusted for $1.5 billion ofadditional assets transferred to OEFC on April 1, 1999, at which time the unfunded liability was$19.433 billion. OEFC's unfunded liability at March 31, 2006 is $19.293 billion.
36

As part of the restructuring of the electricity sector, a long-term plan provides for certain dedicatedrevenue streams to service and retire OEFC's debt and other liabilities. These revenue streams areestablished under the Electricity Act and include payments-in-lieu of property taxes and federal andprovincial corporate income and capital taxes paid by OPG, Hydro One and the municipal electric utilities.
The Province receives dividend payments on its investments in OPG and Hydro One. Pursuant to thegovernment's commitment to keep electricity income in the electricity sector, the cumulative combinednet income of OPG and Hydro One in excess of the Province's cumulative interest expenditure on itsinvestment in the companies is allocated to OEFC for purposes of debt retirement.
Residual stranded debt is the portion of OEFC's stranded debt that cannot be serviced by theforegoing dedicated revenue streams. The residual stranded debt was estimated at $7.8 billion on April 1,1999. The Electricity Act provides for a debt retirement charge of 0.7 cents per kilowatt hour to be leviedon Ontario electricity users. This charge, collected by the IESO, distributors and retailers, is payable toOEFC until its residual stranded debt is retired.
The Electricity Act and the Ontario Energy Board Act, 1998 set out the legislative framework forOntario's electricity market and restructuring of Ontario Hydro. Open, non-discriminatory access totransmission and distribution systems commenced May 1, 2002. Since 2005, electricity prices payable byconsumers reÖect a blend of market prices, contract prices, and regulated prices for OPG's output fromits price-regulated nuclear and large hydroelectric plants. As of April 1, 2005, the Ontario Energy Board(""OEB'') assumed responsibility for setting the commodity price payable by low volume and designatedconsumers under the Regulated Price Plan (""RPP''). The Ontario Power Authority (""OPA'') Ñnancesany shortfall arising from diÅerences between prices under the RPP and the actual supply cost ofelectricity, with any shortfall to be recovered through the setting of RPP prices in the following period.
The Province, OPG and certain subsidiaries of OPG entered into the Ontario Nuclear FundsAgreement (""ONFA'') as of April 1, 1999, to establish, fund and manage segregated funds to ensure thatsuÇcient funds are available to pay for costs of managing and disposing of nuclear waste anddecommissioning OPG's nuclear generating stations. Under ONFA, OPG is required to make quarterlypayments to the funds that, together with income earned and a contribution made by OEFC, would coverall currently estimated costs. The Province is liable to make payments should the cost estimate fornuclear used fuel management rise above speciÑed thresholds, for a Ñxed volume of used fuel. TheProvince is also obligated under ONFA to make additional contributions to the used fuel fund if that fundearns less than 3.25% over the Ontario consumer price index. If the earnings on the assets in the fundexceed the speciÑed rate, the Province is entitled to the excess.
EÅective July 31, 2003, two agreements came into eÅect to satisfy the Canadian Nuclear SafetyCommission (""CNSC'') licensing requirements for Ñnancial guarantees in respect of OPG's nucleardecommissioning and waste management obligations. One agreement, between the Province, OPG andthe CNSC, gives the CNSC access to the segregated funds established under ONFA. The Province alsoprovided a direct provincial guarantee to the CNSC of the cost of OPG's nuclear decommissioning andwaste management in an amount up to $1.51 billion. OPG pays the Province a guarantee fee of 0.5% ofthe amount guaranteed by the Province on an annual basis.
Non-Publicly Held Debt
Non-publicly held debt is debt issued to certain public sector pension plans or the FederalGovernment and its agencies. As of March 31, 2006, approximately 13.6% of total liabilities were in theform of non-publicly held debt. Non-publicly held debt is composed almost exclusively of debt to pensionplans, the two largest components being Ontario Teachers' Pension Fund debt ( 4.3% of total liabilities)and CPP debt (5.8% of total liabilities).
Accounts Payable and Accrued Liabilities
Accounts payable and accrued liabilities comprise transfer payments, interest on publicly held debt,salaries, wages, beneÑts, materials, supplies, and deferred revenue.
37

Pensions and Other Employee Future BeneÑts
As at March 31,
Pensions and Other Employee Future BeneÑts Liability (Asset) 2006 2005
(in millions)
Obligation for beneÑts ÏÏÏÏÏÏÏÏÏÏÏÏÏÏÏÏÏÏÏÏÏÏÏÏÏÏÏÏÏÏÏÏÏÏÏÏÏÏÏÏÏÏÏÏÏÏÏÏÏÏÏÏÏ $ 64,512 $ 59,566Less: plan fund assetsÏÏÏÏÏÏÏÏÏÏÏÏÏÏÏÏÏÏÏÏÏÏÏÏÏÏÏÏÏÏÏÏÏÏÏÏÏÏÏÏÏÏÏÏÏÏÏÏÏÏÏÏÏ (64,746) (60,389)Unamortized actuarial gains/(losses) ÏÏÏÏÏÏÏÏÏÏÏÏÏÏÏÏÏÏÏÏÏÏÏÏÏÏÏÏÏÏÏÏÏÏÏÏÏÏ 446 1,170Adjustments(1) ÏÏÏÏÏÏÏÏÏÏÏÏÏÏÏÏÏÏÏÏÏÏÏÏÏÏÏÏÏÏÏÏÏÏÏÏÏÏÏÏÏÏÏÏÏÏÏÏÏÏÏÏÏÏÏÏÏÏÏÏ 1,474 1,400
Total ÏÏÏÏÏÏÏÏÏÏÏÏÏÏÏÏÏÏÏÏÏÏÏÏÏÏÏÏÏÏÏÏÏÏÏÏÏÏÏÏÏÏÏÏÏÏÏÏÏÏÏÏÏÏÏÏÏÏÏÏÏÏÏÏÏÏÏÏÏ $ 1,686 $ 1,747
(1) Adjustments consist of: i) diÅerences for amounts reported by the pension plans at December 31,instead of the Province's year- end of March 31; ii) unamortized diÅerence between employer andemployee contributions for jointly sponsored pension plans; iii) unamortized employee contributionreductions for solely sponsored plans; iv) unamortized initial unfunded liabilities of jointly sponsoredplans; and v) amounts payable by the Province that are reÖected as contributions in the pension planassets.
Pensions
The Province sponsors several pension plans. It is the sole sponsor of the Public Service PensionPlan (""PSPP'') and joint sponsor of the Ontario Public Service Employees Union (""OPSEU'') PensionPlan, and the Ontario Teachers' Pension Plan (""OTPP'').
These three plans are contributory deÑned beneÑt plans that provide Ontario government employeesand elementary and secondary school teachers and administrators with a guaranteed amount ofretirement income. BeneÑts are based primarily on the best Ñve-year average salary of members andtheir length of service, and are indexed to changes in the Consumer Price Index to provide protectionagainst inÖation. Plan members normally contribute between 7 and 9 per cent of their salary to theseplans. The Province matches these contributions.
Funding of these plans is based on statutory actuarial funding valuations undertaken at least everythree years. The Province contributed $740 million to the OTPP in 2005-06 (2004-05, $708 million),$136 million to the PSPP (2004-05, $124 million) and $143 million to the OPSEU Pension Plan (2004-05,$135 million). During calendar year 2005, the OTPP paid beneÑts, including transfers to other plans of$3.6 billion (2004, $3.4 billion), the PSPP paid $793 million (2004, $799 million) and the OPSEU PensionPlan paid $524 million (2004, $493 million). Under agreements between the Province and OPSEU, andbetween the Province and the Ontario Teachers' Federation (OTF), gains and losses arising fromstatutory actuarial funding valuations are shared by the co-sponsors.
The government's best estimate of the future annual inÖation rate used in the pension and otheremployee future beneÑts calculations is 2.5 per cent, the salary escalation rate is 3.5 per cent, thediscount rate and the expected rate of return on pension plan assets are 6.75 (2005, 7 per cent) per centfor OTPP, 6.5 per cent for PSPP and 6.75 per cent for OPSEU Pension Plan. Actuarial gains or losses areamortized over periods of 10 to 13 years.
The Province is also responsible for sponsoring the Ontario Teachers' Retirement CompensationArrangement and the Public Service Supplementary BeneÑts Plan. Expenses and liabilities of these plansare included in the Pensions Expense and Pensions Liability reported in the Ñnancial statements.
Other Employee Future BeneÑts
Other Employee Future BeneÑts includes non-pension retirement beneÑts, post-employmentbeneÑts and compensated absences. The discount rate used in the Other Employee Future BeneÑts(except retirement beneÑts) calculation for 2005-06 is 4.65 per cent (2004-05, 5.25 per cent).
38

Retirement BeneÑts
The Province provides dental, basic life insurance, supplementary health and hospital beneÑts toretired employees through a self-insured, unfunded deÑned beneÑt plan. The Province paid $119 millionfor beneÑts under the plan in 2005-06 (2004-05, $95 million). The liability for non-pension retirementbeneÑts of $2.5 billion as at March 31, 2006 (2005, $2.1 billion) is included in the Other Employee FutureBeneÑts Liability. The expense for 2005-06 of $502 million (2004-05, $221 million) is included in theOther Employee Future BeneÑts Expense.
The discount rate used in the other retirement beneÑts calculation for 2005-06 is 5.15 per cent (2004-05, 5.75 per cent).
During the year, the Province entered into an agreement with OPSEU to change varioussupplemental health beneÑts. The cost of these changes of $211 million will be included in the 2005-06Other Employee Future BeneÑts Expense.
Post-Employment BeneÑts
The Province provides employees who have completed 5 years of service, termination pay equal toone week's salary for each year of service up to a maximum of 50 per cent of their annual salary.Employees who have completed one year of service but less than 5 years are also entitled to terminationpay in the event of death, retirement or release from employment. The termination pay beneÑts areunfunded and are administered by the Province. The Province paid out $49 million in termination pay in2005-06 (2004-05, $43 million). The liability for termination pay of $805 million as at March 31, 2006(2005, $777 million) is included in the Other Employee Future BeneÑts Liability. The expense for 2005-06of $76 million (2004-05, $39 million), including a $112 million reduction in the liability as a result of achange in estimation method, is included in the Other Employee Future BeneÑts Expense.
The Province also provides on a self-insured basis workers' compensation beneÑts, long-termdisability beneÑts and regular beneÑts to employees who are on workers' compensation and/or long-term disability. The liability for workers' compensation of $360 million as at March 31, 2006 (2005,$349 million) net of deposits of $3 million (2005, $3 million) is included in the Other Employee FutureBeneÑts Liability. The expense for 2005-06 of $53 million (2004-05, $120 million) including a $41 millionpayment made in 2005-06 (2004-05, $39 million) is included in the Other Employee Future BeneÑtsExpense. The 2004-05 expense included a $92 million increase in the liability as a result of a change inestimation method.
The unfunded liability for long-term disability beneÑts of $209 million as at March 31, 2006 (2005,$183 million) is net of deposits of $322 million (2005, $321 million), and is included in the OtherEmployee Future BeneÑts Liability. The 2005-06 expense of $82 million (2004-05, $232 million includingthe impact of compliance with PSAB recommendation on long-term disability beneÑts) is included in theOther Employee Future BeneÑts Expense. A $56 million payment for long-term disability beneÑts wasmade in 2005-06 (2004-05, $47 million).
Other Liabilities
Other Liabilities include deferred revenues, pension and beneÑt funds related to the ProvincialJudges' Pension Fund and the Deputy Ministers' Supplementary BeneÑt Account, externally restrictedfunds and other miscellaneous liabilities.
Claims Against the Crown
Of the claims outstanding against the Crown in Right of Ontario as at March 31, 2006, 86 were foramounts over $50 million each Ì See ""Public Accounts, 2005-2006 Ì Volume 1 Ì IV. CLAIMSAGAINST THE CROWN'' (94 including claims over $50 million against Crown agencies as reported in theConsolidated Financial Statements contained in the 2005-2006 Public Accounts of Ontario). These claimsarise from legal action, either in progress or threatened, in respect of aboriginal land claims, breach ofcontract, damages to persons and property and like items. As of December 5, 2006 there were 94 claimsoutstanding against the Crown in Right of Ontario, which were for amounts over $50 million each. Thecost to the Province, if any, cannot be determined because the outcome of these actions is uncertain.
39

DEBT
SELECTED CHARACTERISTICS BY TYPE OF ISSUE
As at March 31, 2006
AverageAverage Annual Cost Average Annual
As a Percentage Term to to the Rate of Growthof Total Maturity Province 2002-2006
(%) (Years) (%) (%)
DebtPublicly Held Debt
Debentures & Bonds(1)ÏÏÏÏÏÏÏÏÏÏÏÏÏÏÏÏÏÏÏÏÏÏÏÏ 70.4 10.9 5.6 4.6Treasury Bills ÏÏÏÏÏÏÏÏÏÏÏÏÏÏÏÏÏÏÏÏÏÏÏÏÏÏÏÏÏÏÏÏ 2.9 0.2 4.6 1.6
Non-Publicly Held Debt Canada Pension PlanInvestment FundÏÏÏÏÏÏÏÏÏÏÏÏÏÏÏÏÏÏÏÏÏÏÏÏÏÏÏÏÏÏ 5.8 10.8 7.8 (4.2)Ontario Teacher's Pension PlanÏÏÏÏÏÏÏÏÏÏÏÏÏÏÏÏ 4.3 2.8 11.5 (8.0)Ontario Public Service Employees' Union
(""OPSEU'') Pension Fund ÏÏÏÏÏÏÏÏÏÏÏÏÏÏÏÏÏÏ 0.7 5.3 12.1 (4.7)Public Service Pension Plan ÏÏÏÏÏÏÏÏÏÏÏÏÏÏÏÏÏÏÏ 1.5 5.3 12.1 (4.7)Canada Mortgage and Housing Corporation ÏÏÏÏ 0.5 8.7 7.3 (3.5)Ontario Municipal Employees' Retirement Fund 0.1 0.8 9.8 (29.0)Other ÏÏÏÏÏÏÏÏÏÏÏÏÏÏÏÏÏÏÏÏÏÏÏÏÏÏÏÏÏÏÏÏÏÏÏÏÏÏÏÏ 0.7 12.9 4.4 70.4
86.9 10.0 6.1
Other LiabilitiesÏÏÏÏÏÏÏÏÏÏÏÏÏÏÏÏÏÏÏÏÏÏÏÏÏÏÏÏÏÏÏÏÏ 13.1 N/A Ì (3.7)
TotalÏÏÏÏÏÏÏÏÏÏÏÏÏÏÏÏÏÏÏÏÏÏÏÏÏÏÏÏÏÏÏÏÏÏÏÏÏÏÏÏÏÏÏ 100.0 N/A N/A 1.6
(1) All balances are expressed in Canadian dollars. The balances above reÖect the eÅect of relatedderivatives contracts entered into by the Province. See ""4. Public Debt Ì (5) Financial Tables ÌI. Summary of Net Debt and Accumulated DeÑcit Ì Risk Management and Derivative FinancialInstruments''.
Debt Record
The Province has never defaulted on the payment of principal or interest on any of its obligations.Payments have been made when due, subject during wartime to any applicable laws and regulationsforbidding such payments.
Debt Maturity and Interest Charges
As at March 31, 2006, approximately 47.9% of the total debt issued for provincial purposes andOEFC Program was scheduled to mature within the next Ñve years and 67.3% within the next 10 years.Interest charges on total debt for 2005-06 was $9,019 million and are estimated to be $9,204 million forÑscal 2006-07 on an accrual and consolidation basis of accounting.
40

DEBT MATURITY SCHEDULE
As at March 31, 2006
Total Debt(1)
Publicly Held Non-PubliclyYear Ending March 31, Debt Held Debt Total % Of Total
(in millions)
2007 ÏÏÏÏÏÏÏÏÏÏÏÏÏÏÏÏÏÏÏÏÏÏÏÏÏÏÏÏÏÏÏÏÏÏÏÏÏÏÏÏÏÏÏÏ $ 19,378 $ 2,043 $ 21,421 13.82008 ÏÏÏÏÏÏÏÏÏÏÏÏÏÏÏÏÏÏÏÏÏÏÏÏÏÏÏÏÏÏÏÏÏÏÏÏÏÏÏÏÏÏÏÏ 11,186 2,833 14,019 9.12009 ÏÏÏÏÏÏÏÏÏÏÏÏÏÏÏÏÏÏÏÏÏÏÏÏÏÏÏÏÏÏÏÏÏÏÏÏÏÏÏÏÏÏÏÏ 16,853 2,563 19,416 12.52010 ÏÏÏÏÏÏÏÏÏÏÏÏÏÏÏÏÏÏÏÏÏÏÏÏÏÏÏÏÏÏÏÏÏÏÏÏÏÏÏÏÏÏÏÏ 10,153 2,962 13,115 8.52011 ÏÏÏÏÏÏÏÏÏÏÏÏÏÏÏÏÏÏÏÏÏÏÏÏÏÏÏÏÏÏÏÏÏÏÏÏÏÏÏÏÏÏÏÏ 4,236 2,018 6,254 4.0
2007-2011 ÏÏÏÏÏÏÏÏÏÏÏÏÏÏÏÏÏÏÏÏÏÏÏÏÏÏÏÏÏÏÏÏÏÏÏÏÏÏÏ 61,806 12,419 74,225 47.92012-16 ÏÏÏÏÏÏÏÏÏÏÏÏÏÏÏÏÏÏÏÏÏÏÏÏÏÏÏÏÏÏÏÏÏÏÏÏÏÏÏÏÏ 24,361 5,619 29,980 19.42017-21 ÏÏÏÏÏÏÏÏÏÏÏÏÏÏÏÏÏÏÏÏÏÏÏÏÏÏÏÏÏÏÏÏÏÏÏÏÏÏÏÏÏ 2,512 2,182 4,694 3.02022-26 ÏÏÏÏÏÏÏÏÏÏÏÏÏÏÏÏÏÏÏÏÏÏÏÏÏÏÏÏÏÏÏÏÏÏÏÏÏÏÏÏÏ 8,800 2,966 11,766 7.62027-31 ÏÏÏÏÏÏÏÏÏÏÏÏÏÏÏÏÏÏÏÏÏÏÏÏÏÏÏÏÏÏÏÏÏÏÏÏÏÏÏÏÏ 12,618 225 12,843 8.32032-56 ÏÏÏÏÏÏÏÏÏÏÏÏÏÏÏÏÏÏÏÏÏÏÏÏÏÏÏÏÏÏÏÏÏÏÏÏÏÏÏÏÏ 20,663 735 21,398 13.8
$130,760 $24,146 $154,906 100.0
(1) All balances are expressed in Canadian dollars. The balances above reÖect the eÅect of relatedderivatives contracts entered into by the Province. See ""4. Public Debt Ì (5) Financial Tables ÌI. Summary of Net Debt and Accumulated DeÑcit Ì Risk Management and Derivative FinancialInstruments''.
(3) Consolidated Debt of the Ontario Public Sector
Overview
While centralized Ñnancing is prominent in Ontario, not all funding of the public sector is shown onthe Province's Ñnancial statements. Since the responsibilities assigned to the Canadian provinces by theConstitution are uniform (although not all provinces have chosen to assume the same set ofresponsibilities), interprovincial comparisons are more clearly facilitated by the presentation of theconsolidated debt. This method of presenting public sector debt is not aÅected by the degree ofcentralization or decentralization of Provincial public sector Ñnancing. Included in the total is the debt ofmunicipalities with separate revenue sources, and all of the sector's revenue sources under provincialjurisdiction.
CONSOLIDATED DEBT OF THE ONTARIO PUBLIC SECTOR
As atMarch 31, 2006 % Of Total
(in millions)
Net Debt(1) ÏÏÏÏÏÏÏÏÏÏÏÏÏÏÏÏÏÏÏÏÏÏÏÏÏÏÏÏÏÏÏÏÏÏÏÏÏÏÏÏÏÏÏÏÏÏÏÏÏÏÏÏÏÏÏÏÏÏÏÏ $141,928 88.8Obligations Guaranteed(2) ÏÏÏÏÏÏÏÏÏÏÏÏÏÏÏÏÏÏÏÏÏÏÏÏÏÏÏÏÏÏÏÏÏÏÏÏÏÏÏÏÏÏÏÏÏÏÏ 3,300 2.0Other Public Sector Debt(3) ÏÏÏÏÏÏÏÏÏÏÏÏÏÏÏÏÏÏÏÏÏÏÏÏÏÏÏÏÏÏÏÏÏÏÏÏÏÏÏÏÏÏÏÏÏ 14,691 9.2
Total Consolidated Debt of the Ontario Public SectorÏÏÏÏÏÏÏÏÏÏÏÏÏÏÏÏÏÏÏÏÏÏ $159,919 100.00
Source: Ontario Ministry of Finance.
(1) Net debt represents the diÅerence between liabilities and Ñnancial assets. Net debt does not takeinto account net assets of Broader Public Sector Organizations of $16,739 million and tangiblecapital assets of $16,034 million as at March 31, 2006 (2005, $15,178 million) as these assets areused to provide services and are not available to discharge liabilities.
41

(2) A provision of $504 million as at March 31, 2006 (2005, $409 million) based on an estimate of thelikely loss arising from guarantees under the Ontario Student Support Program has been expensedand is reÖected in the accrued liabilities for transfer payments.
(3) Other Public Sector Debt comprises local government debt of $6,941 million and schools', colleges',universities' and hospitals' debt of $7,750 million.
(4) Selected Debt Statistics
The following table examines the Consolidated Debt of the Ontario Public Sector in absolute termsand in relation to certain provincial economic indicators.
CONSOLIDATED DEBT OF THE ONTARIO PUBLIC SECTOR
AverageAnnualRate ofGrowth
As at March 31, 2002-20062002 2003 2004 2005 2006 %
(in millions unless otherwise indicated)
Consolidated DebtÏÏÏÏÏÏÏÏÏÏÏÏÏÏÏÏÏ $142,121 $146,451 $151,661 $156,984 $159,919 2.3
Consolidated Debt per Capita ÏÏÏÏÏÏ 11,945 12,101 12,370 12,653 12,752 0.9
Consolidated Debt/Personal Income(%)ÏÏÏÏÏÏÏÏÏÏÏÏÏÏÏÏÏÏÏÏÏÏÏÏÏÏÏÏ 39.3 39.5 39.6 39.2 38.1 (1.4)
Consolidated Debt/GDP (%)ÏÏÏÏÏÏÏ 31.3 30.6 30.8 30.3 29.7 (1.7)
Sources: Ontario Ministry of Finance.
THE CANADIAN DOLLAR
Recent high and low exchange rates for the Canadian dollar in terms of United States cents are asfollows:
Jan 1-Nov 16
2001 2002 2003 2004 2005 2006
HighÏÏÏÏÏÏÏÏÏÏÏÏÏÏÏÏÏÏÏÏÏÏÏÏÏÏÏÏÏÏÏÏÏÏÏÏÏÏÏÏÏÏÏÏ 66.95 66.18 77.38 84.93 86.90 90.99Low ÏÏÏÏÏÏÏÏÏÏÏÏÏÏÏÏÏÏÏÏÏÏÏÏÏÏÏÏÏÏÏÏÏÏÏÏÏÏÏÏÏÏÏÏ 62.42 61.99 63.31 71.59 78.72 85.28
Source: Bank of Canada.
42

(5) Financial Tables
I. Summary of Net Debt and Accumulated DeÑcitAs at March 31,
2002 2003 2004 2005 2006
(in millions)
Non-Publicly Held DebtCanada Pension Plan Investment Fund ÏÏÏÏ $ 11,944 $ 10,746 $ 10,233 $ 10,233 $ 10,233Ontario Teachers' Pension Plan ÏÏÏÏÏÏÏÏÏÏÏ 11,043 10,387 9,487 8,666 7,596Canada Mortgage and Housing Corporation 1,116 1,078 1,047 1,003 960Public Service Pension Plan ÏÏÏÏÏÏÏÏÏÏÏÏÏÏ 3,331 3,200 3,052 2,886 2,705Ontario Public Service Employees' Union
(""OPSEU'') Pension Fund ÏÏÏÏÏÏÏÏÏÏÏÏÏ 1,582 1,520 1,450 1,371 1,285Other ÏÏÏÏÏÏÏÏÏÏÏÏÏÏÏÏÏÏÏÏÏÏÏÏÏÏÏÏÏÏÏÏÏÏÏ 581 356 1,096 1,231 1,367
$ 29,597 $ 27,287 $ 26,365 $ 25,390 $ 24,146
Publicly Held DebtDebentures and Bonds(1)ÏÏÏÏÏÏÏÏÏÏÏÏÏÏÏÏÏ $ 99,990 $102,958 $116,732 $125,279 $ 123,130Treasury BillsÏÏÏÏÏÏÏÏÏÏÏÏÏÏÏÏÏÏÏÏÏÏÏÏÏÏÏÏ 5,108 6,274 3,359 3,747 5,214U.S. Commercial Paper(1) ÏÏÏÏÏÏÏÏÏÏÏÏÏÏÏÏ 1,566 1,515 1,156 269 706Ontario Infrastructure Projects Corporation
(""OIPC'')(2) ÏÏÏÏÏÏÏÏÏÏÏÏÏÏÏÏÏÏÏÏÏÏÏÏÏÏÏ Ì Ì 323 1,288 1,323Other ÏÏÏÏÏÏÏÏÏÏÏÏÏÏÏÏÏÏÏÏÏÏÏÏÏÏÏÏÏÏÏÏÏÏÏ 447 438 422 404 387Deposits with the Province of Ontario
Savings OÇce (""POSO'')(3) ÏÏÏÏÏÏÏÏÏÏÏÏ 2,438 Ì Ì Ì Ì
$109,549 $111,185 $121,992 $130,987 $ 130,760
Total DebtÏÏÏÏÏÏÏÏÏÏÏÏÏÏÏÏÏÏÏÏÏÏÏÏÏÏÏÏÏÏÏÏÏ $139,146 $138,472 $148,357 $156,377 $ 154,906(6)
Cash and Temporary Investments ÏÏÏÏÏÏÏÏÏÏÏ (5,773) (7,252) (8,139) (14,353) (7,321)Other Net (Assets)/Liabilities(4) ÏÏÏÏÏÏÏÏÏÏÏÏ (1,252) 1,427 (1,661) (1,103) (5,657)
Net Debt ÏÏÏÏÏÏÏÏÏÏÏÏÏÏÏÏÏÏÏÏÏÏÏÏÏÏÏÏÏÏÏÏÏÏ $132,121 $132,647 $138,557 $140,921 $ 141,928
Non-Financial Assets(5)ÏÏÏÏÏÏÏÏÏÏÏÏÏÏÏÏÏÏÏÏÏ Ì (13,942) (14,369) (15,178) (32,773)
Accumulated DeÑcit ÏÏÏÏÏÏÏÏÏÏÏÏÏÏÏÏÏÏÏÏÏÏÏÏ $132,121 $118,705 $124,188 $125,743 $(109,155)
Source: Ontario Ministry of Finance
(1) All balances are expressed in Canadian dollars. The balances above reÖect the eÅect of relatedderivative contracts. See ""4. Public Debt Ì (5) Financial Tables Ì I. Summary of Net Debt andAccumulated DeÑcit Ì Risk Management and Derivative Financial Instruments''.
(2) Under the Ontario Infrastructure Projects Corporation Act, 2006, Ontario Infrastructure ProjectsCorporation (""OIPC'') and Ontario Strategic Infrastructure Financing Authority (""OSIFA'') wereamalgamated under the name of Ontario Infrastructure Projects Corporation.
(3) The Province of Ontario Savings OÇce was sold for $48.5 million on March 31, 2003.
(4) Other Net (Assets)/Liabilities include Accounts Receivable, Loan Receivable (including municipalloans by OIPC), Advances and Investments in Government business enterprises, Accounts Payable,Accrued Liabilities, Pensions, and the liability for Power Purchase Agreements with non-utilitygenerators.
(5) Non-Financial Assets include tangible capital assets of $16,034 million and starting with Ñscal year2005-06 net assets of Broader Public Sector Organizations of $16,739 million.
(6) See ""4. Public Debt Ì (5) Financial Tables Ì Public Accounts, 2005-2006 Ì Volume 1 ÌII. Outstanding Debt Issued'' for details of individual debt issues.
43
Risk Management and Derivative Financial Instruments
The Province employs various risk management strategies and operates within deÑned riskexposure limits to ensure exposure to risk is managed in a prudent and cost eÅective manner. A variety ofstrategies are used, including the use of derivative Ñnancial instruments (""derivatives'').
Derivatives are Ñnancial contracts, the value of which is derived from underlying instruments. TheProvince uses derivatives to hedge and to minimize interest costs. Hedges are created primarily throughswaps, which are legal arrangements under which the Province agrees with another party to exchangecash Öows based upon one or more notional amounts using stipulated reference interest rates for aspeciÑed period. Swaps allow the Province to oÅset its existing obligations and thereby eÅectivelyconvert them into obligations with more desirable characteristics. Other derivative instruments used bythe Province include forward foreign exchange contracts, forward rate agreements, futures, options,caps and Öoors.
Foreign exchange or currency risk is the risk that foreign currency debt principal and interestpayments and foreign currency transactions will vary in Canadian dollar terms due to Öuctuations inforeign exchange rates. To manage currency risk, the Province uses derivative contracts includingforeign exchange forward contracts, futures, options and swaps to convert foreign currency cash Öowsinto Canadian dollar denominated cash Öows. Most of the derivative contracts hedge the underlying debtby matching all the critical terms to achieve eÅectiveness. In the instances where the term of foreignexchange forward contracts used for hedging is shorter than the term of the underlying debt, theeÅectiveness is maintained by continuously rolling the foreign exchange forward contract over theremaining term of the underlying debt, or until replaced with a long-term derivative contract.
The current policy allows the net of unhedged foreign currency debt principal and foreign currencyholdings to reach a maximum of 5 per cent of Debt Issued for Provincial Purposes and OEFC debt. AtMarch 31, 2006, the respective unhedged levels were 0.8 and nil per cent (2005, 0.8 and 0.1 per cent).For every one-cent increase in the Canadian dollar versus the U.S. dollar, there would be an increase indebt amount of $3 million (2005, $3 million) and an increase in Interest on Debt of $1.7 million (2005,$1.4 million). For every one Japanese yen decrease versus the Canadian dollar, there would be anincrease in debt amount of $7 million (2005, $9 million) and an increase in Interest on Debt of $2.0 million(2005, $2.1 million). Total foreign exchange gains recognized in the Statement of Operations for 2005-06were $112 million (2004-05, $56 million).
Interest on debt expense may also vary as a result of changes in interest rates. In respect of DebtIssued for Provincial Purposes, the risk is measured as interest rate resetting risk which is the net ofÖoating rate exposure, liquid reserves and Ñxed rate debt maturing within the next 12-month period as apercentage of Debt Issued for Provincial Purposes. In respect of OEFC debt, the risk is the Öoating rateexposure as a percentage of OEFC debt. Depending on market conditions, the Province creates orreduces its exposure to interest rate changes by issuing or retiring short-term debt, or by entering into orclosing out derivative positions. The current policy limits interest rate resetting risk for Debt Issued forProvincial Purposes to a maximum of 25 per cent and Öoating rate risk for OEFC debt to a maximum of20 per cent.
As at March 31, 2006, interest rate resetting risk for Debt Issued for Provincial Purposes was14.1 per cent (2005, 10.2 per cent) while Öoating rate risk for OEFC debt was 9.6 per cent (2005, 8.5 percent). Based on Öoating rate interest-bearing Ñnancial instruments on hand at the balance sheet dateplus planned issues for the coming year, a one per cent (100 basis points) increase in interest rateswould result in an increase in Interest on Debt of $250 million (2005, $250 million).
Liquidity risk is the risk that the Province will not be able to meet its current short-term Ñnancialobligations. To reduce liquidity risk, the Province maintains liquid reserves, that is, cash and temporaryinvestments, at levels that will meet future cash requirements and will give the Province Öexibility in thetiming of issuing debt. In addition, the Province has short-term note programs as alternative sources ofliquidity.
44
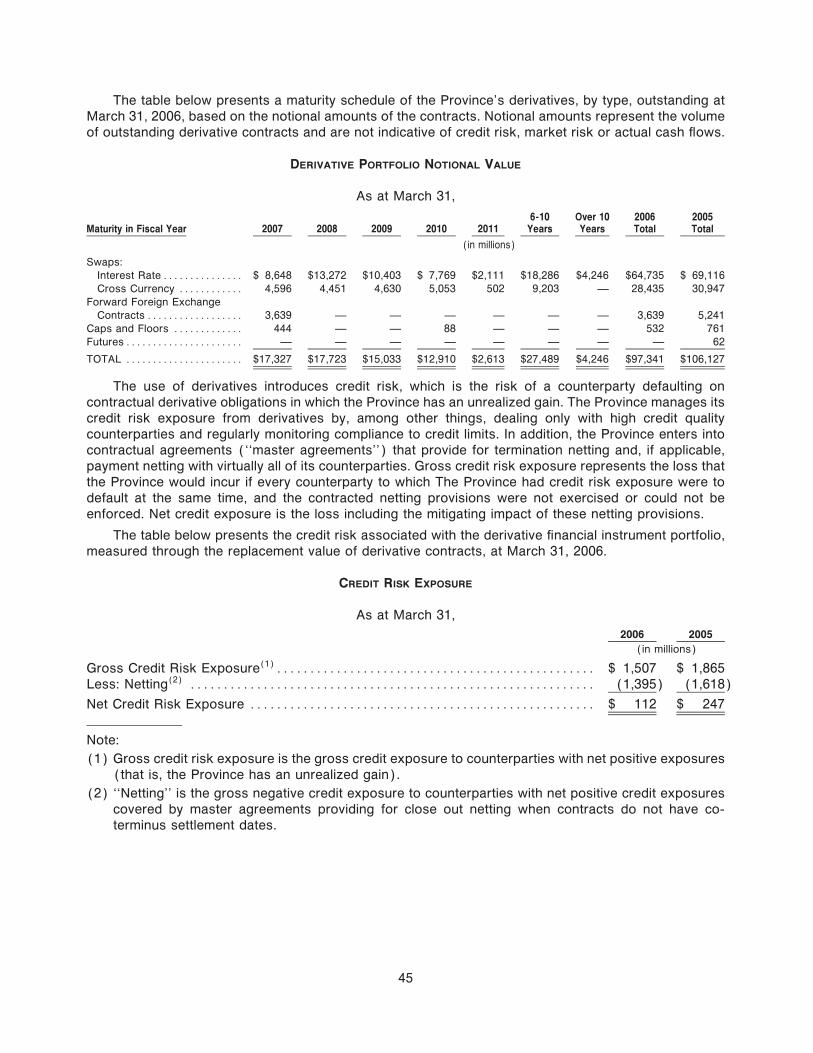
The table below presents a maturity schedule of the Province's derivatives, by type, outstanding atMarch 31, 2006, based on the notional amounts of the contracts. Notional amounts represent the volumeof outstanding derivative contracts and are not indicative of credit risk, market risk or actual cash Öows.
DERIVATIVE PORTFOLIO NOTIONAL VALUE
As at March 31,
6-10 Over 10 2006 2005Maturity in Fiscal Year 2007 2008 2009 2010 2011 Years Years Total Total
(in millions)
Swaps:Interest Rate ÏÏÏÏÏÏÏÏÏÏÏÏÏÏÏ $ 8,648 $13,272 $10,403 $ 7,769 $2,111 $18,286 $4,246 $64,735 $ 69,116Cross Currency ÏÏÏÏÏÏÏÏÏÏÏÏ 4,596 4,451 4,630 5,053 502 9,203 Ì 28,435 30,947
Forward Foreign ExchangeContracts ÏÏÏÏÏÏÏÏÏÏÏÏÏÏÏÏÏÏ 3,639 Ì Ì Ì Ì Ì Ì 3,639 5,241
Caps and Floors ÏÏÏÏÏÏÏÏÏÏÏÏÏ 444 Ì Ì 88 Ì Ì Ì 532 761FuturesÏÏÏÏÏÏÏÏÏÏÏÏÏÏÏÏÏÏÏÏÏÏ Ì Ì Ì Ì Ì Ì Ì Ì 62
TOTAL ÏÏÏÏÏÏÏÏÏÏÏÏÏÏÏÏÏÏÏÏÏÏ $17,327 $17,723 $15,033 $12,910 $2,613 $27,489 $4,246 $97,341 $106,127
The use of derivatives introduces credit risk, which is the risk of a counterparty defaulting oncontractual derivative obligations in which the Province has an unrealized gain. The Province manages itscredit risk exposure from derivatives by, among other things, dealing only with high credit qualitycounterparties and regularly monitoring compliance to credit limits. In addition, the Province enters intocontractual agreements (""master agreements'') that provide for termination netting and, if applicable,payment netting with virtually all of its counterparties. Gross credit risk exposure represents the loss thatthe Province would incur if every counterparty to which The Province had credit risk exposure were todefault at the same time, and the contracted netting provisions were not exercised or could not beenforced. Net credit exposure is the loss including the mitigating impact of these netting provisions.
The table below presents the credit risk associated with the derivative Ñnancial instrument portfolio,measured through the replacement value of derivative contracts, at March 31, 2006.
CREDIT RISK EXPOSURE
As at March 31,
2006 2005
(in millions)
Gross Credit Risk Exposure(1)ÏÏÏÏÏÏÏÏÏÏÏÏÏÏÏÏÏÏÏÏÏÏÏÏÏÏÏÏÏÏÏÏÏÏÏÏÏÏÏÏÏÏÏÏÏÏÏÏ $ 1,507 $ 1,865Less: Netting(2) ÏÏÏÏÏÏÏÏÏÏÏÏÏÏÏÏÏÏÏÏÏÏÏÏÏÏÏÏÏÏÏÏÏÏÏÏÏÏÏÏÏÏÏÏÏÏÏÏÏÏÏÏÏÏÏÏÏÏÏÏÏ (1,395) (1,618)
Net Credit Risk Exposure ÏÏÏÏÏÏÏÏÏÏÏÏÏÏÏÏÏÏÏÏÏÏÏÏÏÏÏÏÏÏÏÏÏÏÏÏÏÏÏÏÏÏÏÏÏÏÏÏÏÏÏÏ $ 112 $ 247
Note:
(1) Gross credit risk exposure is the gross credit exposure to counterparties with net positive exposures(that is, the Province has an unrealized gain).
(2) ""Netting'' is the gross negative credit exposure to counterparties with net positive credit exposurescovered by master agreements providing for close out netting when contracts do not have co-terminus settlement dates.
45

PUBLIC ACCOUNTS, 2005-2006 Ì VOLUME 1
II. OUTSTANDING DEBT ISSUED
As at March 31, 2006
Date of Date of InterestMaturity Issue Series Rate Outstanding Reference
% $
Debt Issued for Provincial Purposes
PAYABLE IN CANADA IN CANADIAN DOLLARSNON-PUBLICLY HELD DEBTTo Ontario Teachers' Pension Fund:
Year ending March 312007 1985-1991 TI 10.26 to 13.01 1,185,000,0002008 1983-1991 TI 10.15 to 15.38 1,945,000,0002009 1986-1991 TI 10.98 to 11.50 1,465,000,0002010 1986-1991 TI 10.22 to 11.24 1,236,000,0002011 1987 TI 10.11 to 10.32 560,000,0002012 1988-1991 TI 10.68 to 11.24 580,000,0002013 1989-1991 TI 11.06 to 11.31 625,000,000
7,596,000,000
To Canada Pension Plan Investment Fund:Year ending March 31
2007 1987 CPP 9.36 to 10.17 232,269,0002008 1988 CPP 10.79 42,300,0002012 1992 CPP 9.81 to 10.04 987,249,0002013 1993 CPP 9.17 to 9.45 700,137,0002019 1999 CPP 5.18 to 5.84 45,270,0002020 1999 CPP 5.50 to 6.91 869,889,0002021 2000 CPP 6.33 to 6.67 609,834,0002022 2001 CPP 6.22 to 6.47 330,994,0002024 2004 CPP 5.26 to 5.97 688,007,0002025 2005 CPP 5.15 to 5.79 1,133,182,0002026 2006 CPP 4.67 to 5.19 574,612,000
6,213,743,000 (5)
To Canada Pension Plan Investment Board:Year ending March 31
2014 2005 CPP 4.17 44,887,0002036 2006 CPP 4.64-4.73 594,003,000
638,890,000 (5)
To Public Service Pension Fund:Year ending March 31
2007 1997 OPB 11.16 to 13.33 94,383,2332008 1997 OPB 15.38 218,362,9032009 1997 OPB 12.79 264,512,8862010 1997 OPB 12.88 273,669,4522011 1997 OPB 13.33 282,994,5582012 1997 OPB 11.55 336,229,1082013 1997 OPB 10.38 374,479,8042014 1997 OPB 11.10 409,677,0312015 1997 OPB 11.19 450,938,707
2,705,247,683 (65)
46
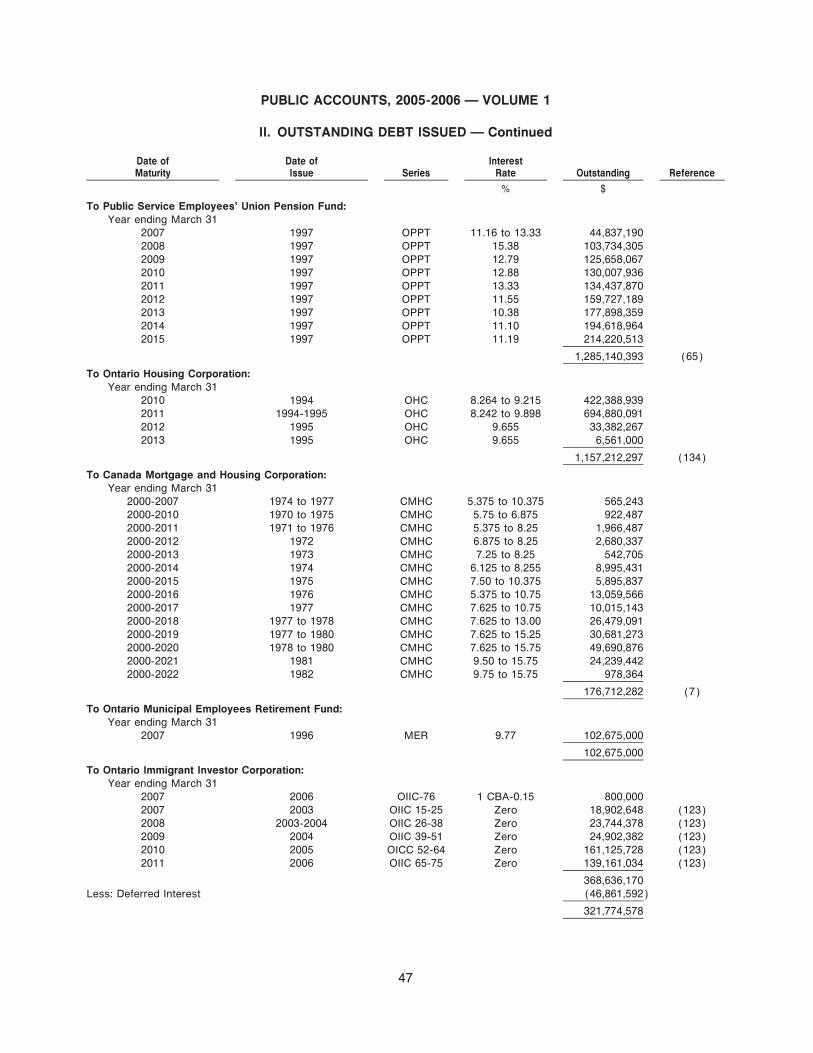
PUBLIC ACCOUNTS, 2005-2006 Ì VOLUME 1
II. OUTSTANDING DEBT ISSUED Ì Continued
Date of Date of InterestMaturity Issue Series Rate Outstanding Reference
% $
To Public Service Employees' Union Pension Fund:Year ending March 31
2007 1997 OPPT 11.16 to 13.33 44,837,1902008 1997 OPPT 15.38 103,734,3052009 1997 OPPT 12.79 125,658,0672010 1997 OPPT 12.88 130,007,9362011 1997 OPPT 13.33 134,437,8702012 1997 OPPT 11.55 159,727,1892013 1997 OPPT 10.38 177,898,3592014 1997 OPPT 11.10 194,618,9642015 1997 OPPT 11.19 214,220,513
1,285,140,393 (65)
To Ontario Housing Corporation:Year ending March 31
2010 1994 OHC 8.264 to 9.215 422,388,9392011 1994-1995 OHC 8.242 to 9.898 694,880,0912012 1995 OHC 9.655 33,382,2672013 1995 OHC 9.655 6,561,000
1,157,212,297 (134)
To Canada Mortgage and Housing Corporation:Year ending March 31
2000-2007 1974 to 1977 CMHC 5.375 to 10.375 565,2432000-2010 1970 to 1975 CMHC 5.75 to 6.875 922,4872000-2011 1971 to 1976 CMHC 5.375 to 8.25 1,966,4872000-2012 1972 CMHC 6.875 to 8.25 2,680,3372000-2013 1973 CMHC 7.25 to 8.25 542,7052000-2014 1974 CMHC 6.125 to 8.255 8,995,4312000-2015 1975 CMHC 7.50 to 10.375 5,895,8372000-2016 1976 CMHC 5.375 to 10.75 13,059,5662000-2017 1977 CMHC 7.625 to 10.75 10,015,1432000-2018 1977 to 1978 CMHC 7.625 to 13.00 26,479,0912000-2019 1977 to 1980 CMHC 7.625 to 15.25 30,681,2732000-2020 1978 to 1980 CMHC 7.625 to 15.75 49,690,8762000-2021 1981 CMHC 9.50 to 15.75 24,239,4422000-2022 1982 CMHC 9.75 to 15.75 978,364
176,712,282 (7)
To Ontario Municipal Employees Retirement Fund:Year ending March 31
2007 1996 MER 9.77 102,675,000
102,675,000
To Ontario Immigrant Investor Corporation:Year ending March 31
2007 2006 OIIC-76 1 CBA-0.15 800,0002007 2003 OIIC 15-25 Zero 18,902,648 (123)2008 2003-2004 OIIC 26-38 Zero 23,744,378 (123)2009 2004 OIIC 39-51 Zero 24,902,382 (123)2010 2005 OICC 52-64 Zero 161,125,728 (123)2011 2006 OIIC 65-75 Zero 139,161,034 (123)
368,636,170Less: Deferred Interest (46,861,592)
321,774,578
47

PUBLIC ACCOUNTS, 2005-2006 Ì VOLUME 1
II. OUTSTANDING DEBT ISSUED Ì Continued
Date of Date of InterestMaturity Issue Series Rate Outstanding Reference
% $
To Colleges of Applied Arts & Technology Pension Plan:Year ending March 31
2007 1996 CAAT 9.77 18,625,000
18,625,000
To Ryerson Retirement Pension Plan:Year ending March 31
2007 1995 RRPF 9.64 1,618,485
1,618,485
TOTAL NON-PUBLICLY HELD DEBT ÏÏÏÏÏÏÏÏÏÏÏÏÏÏÏÏÏÏÏÏÏÏÏÏÏÏÏÏÏÏÏÏÏÏÏÏÏÏÏÏÏÏÏÏÏÏÏÏÏÏÏÏ 20,217,638,718
PAYABLE IN CANADA IN CANADIAN DOLLARSPUBLICLY HELD DEBT
May 1, 2006 September 22, 2004 DMTN76 3 CBA 650,000,000May 3, 2006 May 3, 2004 DMTN108 Step-up 25,000,000 (132)May 5, 2006 May 5, 2004 DMTN107 Step-up 60,000,000 (133)May 30, 2006 October 2, 2003 DMTN86 3 CBA 58,000,000 (16)July 2, 2006 July 2, 2004 DMTN115 Step-up 35,000,000 (102)July 7, 2006 July 7, 2004 DMTN114 Step-up 26,000,000 (100)July 24, 2006 July 24, 1996 KE 7.75 700,000,000July 26, 2006 January 26, 2004 DMTN91 Step-up 25,000,000 (75)
August 12, 2006 February 12, 2004 DMTN98 Step-up 25,000,000 (78)September 7, 2006 September 7, 2004 DMTN118 Step-up 31,000,000 (85)September 8, 2006 August 17, 2004 DMTN78 3.50 500,000,000September 19, 2006 March 19, 2004 DMTN101 Step-up 30,000,000 (87)September 20, 2006 September 20, 2004 DMTN121 Step-up 25,000,000 (120)September 22, 2006 September 22, 2004 DMTN122 3 CBA-0.02 50,000,000 (113)September 27, 2006 September 27, 2004 DMTN124 1 CBA-0.01 250,000,000 (86)
October 1, 2006 October 1, 2004 DMTN123 Step-up 25,000,000 (76)October 14, 2006 October 14, 2004 DMTN127 Step-up 25,000,000 (33)October 27, 2006 October 27, 2004 DMTN125 Step-up 25,000,000 (99)October 27, 2006 October 27, 2004 DMTN128 Step-up 25,000,000 (2)October 29, 2006 October 29, 2004 DMTN129 Step-up 35,000,000 (3)
November 20, 2006 November 20, 2001 DMTN24 Step-up 100,000,000 (95)December 5, 2006 December 5, 2001 DMTN30 Step-up 50,000,000 (110)December 15, 2006 December 15, 2003 DMTN90 3 CBA°0.12 50,000,000 (103)January 12, 2007 January 12, 1995 JF 9.50 132,950,000 (21)January 19, 2007 January 19, 2005 DMTN134 Step-up 35,000,000 (48)January 28, 2007 January 31, 2007 DMTN137 Step-up 30,000,000 (26)January 29, 2007 January 29, 2004 DMTN97 3 CBA°0.155 155,000,000 (104)February 25, 2007 February 25, 2005 DMTN139 Step-up 25,000,000 (81)
March 8, 2007 September 11, 2001 DMTN16 5.20 2,000,000,000March 26, 2007 March 26, 2004 DMTN103 Step-up 30,000,000 (101)June 17, 2007 June 17, 2005 DMTN147 Step-up 40,000,000 (18)June 18, 2007 January 26, 2004 DMTN96 3 CBA 150,000,000 (106)June 20, 2007 June 20, 2005 DMTN146 Step-up 35,000,000 (22)June 21, 2007 June 21, 2005 DMTN145 Step-up 25,000,000 (25)June 21, 2007 June 21, 2005 DMTN148 Step-up 25,000,000 (31)
August 22, 2007 August 22, 2005 DMTN151 Step-up 45,000,000 (39)September 12, 2007 September 12, 1997 LE 6.125 1,660,000,000 (130)September 21, 2007 September 21, 2005 DMTN154 Step-up 35,000,000 (49)September 22, 2007 September 22, 2005 DMTN155 Step-up 25,000,000 (58)September 26, 2007 September 26, 2005 DMTN156 Step-up 25,000,000 (63)October 31, 2007 October 31, 2005 DMTN159 Step-up 50,000,000 (70)November 4, 2007 November 4, 2005 DMTN160 Step-up 35,000,000 (73)December 7, 2007 December 7, 2005 DMTN162 Step-up 25,000,000 (77)
48

PUBLIC ACCOUNTS, 2005-2006 Ì VOLUME 1
II. OUTSTANDING DEBT ISSUED Ì Continued
Date of Date of InterestMaturity Issue Series Rate Outstanding Reference
% $
December 10, 2007 December 10, 1997 LH 5.875 66,475,000January 25, 2008 January 25, 2005 DMTN136 3 CBA°0.19 50,000,000 (50)March 8, 2008 November 21, 2005 DMTN161 3.875 1,000,000,000May 30, 2008 May 30, 2003 DMTN70 3 CBA°0.03 1,025,000,000 (53)June 3, 2008 June 3, 1999 MN 5.75 50,000,000 (46)July 15, 2008 February 6, 1998 LM 5.50 75,000,000
September 4, 2008 September 4, 1998 LW 6.30 50,000,000October 1, 2008 October 1, 2003 DMTN85 3 CBA°0.03 1,610,000,000 (68)(107)
November 19, 2008 November 12, 2003 DMTN87 4.40 750,000,000 (82)December 1, 2008 September 15, 1998 LZ 5.70 1,550,000,000
March 2, 2009 March 2, 2004 DMTN100 3 CBA°0.025 275,000,000March 8, 2009 March 11, 2004 DMTN102 Step-up 174,000,000 (128)April 6, 2009 March 24, 2005 DMTN143 3 CBA°0.01 550,000,000 (6)May 19, 2009 April 20, 2004 DMTN106 4.00 750,000,000 (89)
August 13, 2009 March 2, 2004 DMTN99 3.21 98,468,331 (124)November 7, 2009 November 9, 2004 DMTN130 3 CBA 900,000,000November 19, 2009 March 19, 1999 MU 6.20 900,000,000December 14, 2009 March 14, 2005 DMTN142 3 CBA°0.25 88,000,000 (108)
May 19, 2010 April 4, 2005 DMTN144 4.00 500,000,000July 5, 2010 July 5, 2005 DMTN150 Step-up 75,500,000 (36)
November 19, 2010 November 24, 2000 NK 6.10 1,620,000,000 (111)December 2, 2011 February 27, 2002 DMTN08 6.10 1,000,000,000 (97)
July 7, 2012 May 8, 2002 DMTN46 Zero 5,649,312 (60)(98)December 2, 2012 December 2, 2002 DMTN53 5.375 2,000,000,000
June 2, 2013 September 22, 2003 DMTN69 4.75 1,030,000,000September 8, 2013 July 23, 2004 DMTN116 Step-up 100,000,000 (56)
March 8, 2014 January 12, 2004 DMTN93 5.00 2,500,000,000 (109)December 2, 2014 December 2, 2004 MW 6.80 11,450,000 (34)
March 8, 2015 March 9, 2005 DMTN135 4.50 2,500,000,000 (72)September 1, 2015 September 1, 2000 DMTN1 6.25 34,000,000 (45)
March 8, 2016 February 14, 2006 DMTN163 4.40 250,000,000 (105)June 2, 2016 June 29, 2005 DMTN149 Step-up 200,000,000 (32)
December 2, 2016 August 22, 2005 DMTN152 Step-up 300,000,000 (40)December 2, 2016 December 7, 2004 DMTN132 4.875 200,000,000
June 2, 2018 August 28, 2003 DMTN79 5.50 360,000,000 (10)June 2, 2019 April 19, 2004 DMTN105 5.35 100,000,000June 2, 2020 February 22, 2005 DMTN140 4.85 399,000,000 (92)
September 4, 2020 September 4, 1998 LY 6.30 50,000,000July 13, 2022 July 13, 1992 HC 9.50 1,590,438,000
September 8, 2023 September 8, 1993 HP 8.10 940,570,000 (59)June 2, 2025 December 20, 1994 JE 9.50 460,000,000 (71)
December 2, 2025 October 5, 1995 JQ 8.50 1,000,000,000February 6, 2026 February 6, 1996 JY 8.00 12,500,000
June 2, 2026 December 21, 1995 JU 8.00 1,000,000,000December 2, 2026 February 13, 1997 KR 8.00 386,500,000December 2, 2026 January 20, 1999 MH 7.00 124,584,000 (90)February 3, 2027 August 5, 1997 KN 7.50 58,220,000February 3, 2027 August 5, 1997 KT 6.95 8,726,000February 3, 2027 August 1, 1997 KY 7.50 11,549,000February 3, 2027 December 4, 1998 LA 7.50 5,507,000February 4, 2027 February 4, 1998 KQ 7.375 990,000
June 2, 2027 October 17, 1996 KJ 7.60 4,734,700,000 (61)August 25, 2028 February 25, 1998 LQ 6.25 2,020,000March 8, 2029 January 8, 1998 LK 6.50 4,727,000,000
January 13, 2031 September 8, 1995 JN 9.50 125,000,000January 15, 2031 March 8, 2005 DMTN141 5.20 230,000,000
49
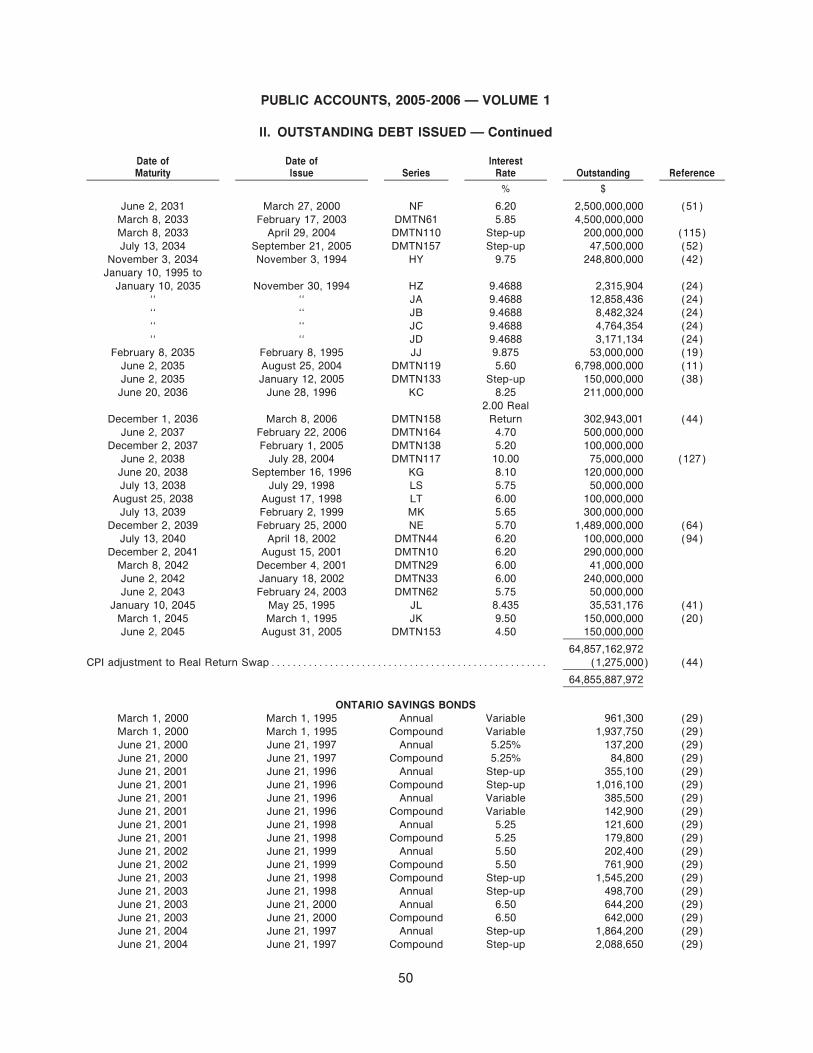
PUBLIC ACCOUNTS, 2005-2006 Ì VOLUME 1
II. OUTSTANDING DEBT ISSUED Ì Continued
Date of Date of InterestMaturity Issue Series Rate Outstanding Reference
% $
June 2, 2031 March 27, 2000 NF 6.20 2,500,000,000 (51)March 8, 2033 February 17, 2003 DMTN61 5.85 4,500,000,000March 8, 2033 April 29, 2004 DMTN110 Step-up 200,000,000 (115)July 13, 2034 September 21, 2005 DMTN157 Step-up 47,500,000 (52)
November 3, 2034 November 3, 1994 HY 9.75 248,800,000 (42)January 10, 1995 to
January 10, 2035 November 30, 1994 HZ 9.4688 2,315,904 (24)"" "" JA 9.4688 12,858,436 (24)"" "" JB 9.4688 8,482,324 (24)"" "" JC 9.4688 4,764,354 (24)"" "" JD 9.4688 3,171,134 (24)
February 8, 2035 February 8, 1995 JJ 9.875 53,000,000 (19)June 2, 2035 August 25, 2004 DMTN119 5.60 6,798,000,000 (11)June 2, 2035 January 12, 2005 DMTN133 Step-up 150,000,000 (38)June 20, 2036 June 28, 1996 KC 8.25 211,000,000
2.00 RealDecember 1, 2036 March 8, 2006 DMTN158 Return 302,943,001 (44)
June 2, 2037 February 22, 2006 DMTN164 4.70 500,000,000December 2, 2037 February 1, 2005 DMTN138 5.20 100,000,000
June 2, 2038 July 28, 2004 DMTN117 10.00 75,000,000 (127)June 20, 2038 September 16, 1996 KG 8.10 120,000,000July 13, 2038 July 29, 1998 LS 5.75 50,000,000
August 25, 2038 August 17, 1998 LT 6.00 100,000,000July 13, 2039 February 2, 1999 MK 5.65 300,000,000
December 2, 2039 February 25, 2000 NE 5.70 1,489,000,000 (64)July 13, 2040 April 18, 2002 DMTN44 6.20 100,000,000 (94)
December 2, 2041 August 15, 2001 DMTN10 6.20 290,000,000March 8, 2042 December 4, 2001 DMTN29 6.00 41,000,000June 2, 2042 January 18, 2002 DMTN33 6.00 240,000,000June 2, 2043 February 24, 2003 DMTN62 5.75 50,000,000
January 10, 2045 May 25, 1995 JL 8.435 35,531,176 (41)March 1, 2045 March 1, 1995 JK 9.50 150,000,000 (20)June 2, 2045 August 31, 2005 DMTN153 4.50 150,000,000
64,857,162,972CPI adjustment to Real Return SwapÏÏÏÏÏÏÏÏÏÏÏÏÏÏÏÏÏÏÏÏÏÏÏÏÏÏÏÏÏÏÏÏÏÏÏÏÏÏÏÏÏÏÏÏÏÏÏÏÏÏÏÏ (1,275,000) (44)
64,855,887,972
ONTARIO SAVINGS BONDSMarch 1, 2000 March 1, 1995 Annual Variable 961,300 (29)March 1, 2000 March 1, 1995 Compound Variable 1,937,750 (29)June 21, 2000 June 21, 1997 Annual 5.25% 137,200 (29)June 21, 2000 June 21, 1997 Compound 5.25% 84,800 (29)June 21, 2001 June 21, 1996 Annual Step-up 355,100 (29)June 21, 2001 June 21, 1996 Compound Step-up 1,016,100 (29)June 21, 2001 June 21, 1996 Annual Variable 385,500 (29)June 21, 2001 June 21, 1996 Compound Variable 142,900 (29)June 21, 2001 June 21, 1998 Annual 5.25 121,600 (29)June 21, 2001 June 21, 1998 Compound 5.25 179,800 (29)June 21, 2002 June 21, 1999 Annual 5.50 202,400 (29)June 21, 2002 June 21, 1999 Compound 5.50 761,900 (29)June 21, 2003 June 21, 1998 Compound Step-up 1,545,200 (29)June 21, 2003 June 21, 1998 Annual Step-up 498,700 (29)June 21, 2003 June 21, 2000 Annual 6.50 644,200 (29)June 21, 2003 June 21, 2000 Compound 6.50 642,000 (29)June 21, 2004 June 21, 1997 Annual Step-up 1,864,200 (29)June 21, 2004 June 21, 1997 Compound Step-up 2,088,650 (29)
50

PUBLIC ACCOUNTS, 2005-2006 Ì VOLUME 1
II. OUTSTANDING DEBT ISSUED Ì Continued
Date of Date of InterestMaturity Issue Series Rate Outstanding Reference
% $
June 21, 2004 June 21, 1997 Annual Variable 122,900 (29)June 21, 2004 June 21, 1997 Compound Variable 114,300 (29)June 21, 2004 June 21, 1999 Compound Step-up 2,404,700 (29)June 21, 2004 June 21, 1999 Annual Step-up 1,283,800 (29)June 21, 2004 June 21, 2001 Compound 5.50 3,607,900 (29)June 21, 2004 June 21, 2001 Annual 5.50 1,437,600 (29)June 21, 2005 June 21, 1998 Annual Variable 1,326,000 (29)June 21, 2005 June 21, 1998 Compound Variable 3,434,400 (29)June 21, 2005 June 21, 2000 Annual Step-up 4,381,400 (29)June 21, 2005 June 21, 2000 Compound Step-up 6,836,600 (29)June 21, 2005 June 21, 2002 Annual 3.45 6,971,700 (29)June 21, 2005 June 21, 2002 Compound 3.45 10,929,300 (29)June 21, 2006 June 21, 1999 Compound Variable 35,185,400 (67)June 21, 2006 June 21, 1999 Annual Variable 19,610,400 (67)June 21, 2006 June 21, 2001 Annual Step-up 877,592,100 (66)June 21, 2006 June 21, 2001 Compound Step-up 1,008,410,500 (66)June 21, 2006 June 21, 2003 Annual 3.45 282,257,000 (30)June 21, 2006 June 21, 2003 Compound 3.45 229,529,900 (30)June 21, 2007 June 21, 2000 Compound Variable 47,772,700 (67)June 21, 2007 June 21, 2000 Annual Variable 25,826,800 (67)June 21, 2007 June 21, 2002 Annual Step-up 205,534,300 (66)June 21, 2007 June 21, 2002 Compound Step-up 222,674,300 (66)June 21, 2007 June 21, 2004 Annual 3.30 105,065,100 (30)June 21, 2007 June 21, 2004 Compound 3.30 92,470,100 (30)June 21, 2008 June 21, 2001 Annual Variable 23,930,200 (67)June 21, 2008 June 21, 2001 Compound Variable 36,090,300 (67)June 21, 2008 June 21, 2003 Annual Step-up 557,870,700 (66)June 21, 2008 June 21, 2003 Compound Step-up 621,244,800 (66)June 21, 2008 June 21, 2005 Annual 3.10 213,174,800 (30)June 21, 2008 June 21, 2005 Compound 3.10 191,804,900 (30)June 21, 2009 June 21, 2002 Annual Variable 33,714,200 (67)June 21, 2009 June 21, 2002 Compound Variable 43,196,300 (67)June 21, 2009 June 21, 2004 Annual Step-up 352,275,300 (66)June 21, 2009 June 21, 2004 Compound Step-up 362,154,100 (66)June 21, 2010 June 21, 2003 Annual Variable 72,214,700 (67)June 21, 2010 June 21, 2003 Compound Variable 71,651,200 (67)June 21, 2010 June 21, 2005 Annual Step-up 179,801,100 (66)June 21, 2010 June 21, 2005 Compound Step-up 224,107,800 (66)June 21, 2011 June 21, 2004 Annual Variable 12,093,700 (67)June 21, 2011 June 21, 2004 Compound Variable 11,477,700 (67)June 21, 2012 June 21, 2005 Annual Variable 97,400,200 (67)June 21, 2012 June 21, 2005 Compound Variable 61,955,500 (67)
6,374,506,000 (62)
TOTAL PAYABLE IN CANADA IN CANADIAN DOLLARSÏÏÏÏÏÏÏÏÏÏÏÏÏÏÏÏÏÏÏÏÏÏÏÏÏÏÏÏÏÏÏÏÏÏ 71,230,393,972
GLOBAL MARKET PAYABLE IN CANADIAN DOLLARSFebruary 7, 2024 February 7, 1994 HS 7.50 1,106,700,000
TOTAL PAYABLE IN CANADIAN DOLLARS ÏÏÏÏÏÏÏÏÏÏÏÏÏÏÏÏÏÏÏÏÏÏÏÏÏÏÏÏÏÏÏÏÏÏÏÏÏÏÏÏÏÏÏÏÏ 1,106,700,000
PAYABLE IN EUROPE IN CANADIAN DOLLARSAugust 9, 2006 August 9, 2001 EMTN049 5.75 100,000,000
September 10, 2007 September 10, 2002 EMTN052 4.375 750,000,000December 31, 2007 January 16, 2002 EMTN051 5.125 350,000,000
April 17, 2008 April 17, 2003 EMTN58 4.50 1,000,000,000January 22, 2009 January 22, 2004 EMTN62 4.00 500,000,000
51

PUBLIC ACCOUNTS, 2005-2006 Ì VOLUME 1
II. OUTSTANDING DEBT ISSUED Ì Continued
Date of Date of InterestMaturity Issue Series Rate Outstanding Reference
% $
January 22, 2009 January 27, 1999 EMTN042 5.00 350,000,000December 1, 2010 November 15, 2005 EMTN74 4.00 200,000,000
July 27, 2011 July 27, 2004 EMTN64 4.75 250,000,000November 30, 2011 November 30, 2001 EMTN050 5.25 450,000,000
April 17, 2013 April 17, 2003 EMTN56 5.50 275,000,000 (74)December 21, 2015 October 21, 2005 EMTN73 3 CBA°0.03 250,000,000
July 13, 2034 July 13, 1994 EMTN005 9.40 300,000,000
TOTAL PAYABLE IN EUROPE IN CANADIAN DOLLARSÏÏÏÏÏÏÏÏÏÏÏÏÏÏÏÏÏÏÏÏÏÏÏÏÏÏÏÏÏÏÏÏÏÏ 4,775,000,000
PAYABLE IN THE UNITED STATES IN CANADIAN DOLLARSFebruary 18, 2013 February 18, 1993 HJ 9.24 250,000,000 (96)
TOTAL PAYABLE IN THE UNITED STATES IN CANADIAN DOLLARS ÏÏÏÏÏÏÏÏÏÏÏÏÏÏÏÏÏÏÏÏÏ 250,000,000
GLOBAL MARKET PAYABLE IN U.S. DOLLARSDecember 15, 2006 November 26, 2003 PA 2.65 1,000,000,000
July 16, 2007 July 16, 2004 PB 3.35 1,000,000,000September 17, 2007 September 17, 2002 NR 3.50 1,000,000,000January 15, 2008 November 26, 2004 PD 3.375 1,000,000,000
May 2, 2008 May 5, 2003 NY 3.125 500,000,000October 1, 2008 October 1, 1998 MB 5.50 1,750,000,000October 21, 2009 October 21, 2004 PC 3.625 1,000,000,000
December 15, 2009 October 1, 2002 NS 3.75 300,000,000July 17, 2012 July 17, 2002 NQ 5.125 750,000,000
February 15, 2013 February 7, 2003 NU 4.375 500,000,000February 3, 2015 February 3, 2005 PE 4.50 500,000,000January 19, 2016 January 18, 2006 PJ 4.75 1,000,000,000
TOTAL PAYABLE IN GLOBAL MARKET IN U.S. DOLLARS ÏÏÏÏÏÏÏÏÏÏÏÏÏÏÏÏÏÏÏÏÏÏÏÏÏÏÏÏÏÏÏ 10,300,000,000
CANADIAN DOLLAR EQUIVALENT EXCHANGE RATE OF $1.30138 ÏÏÏÏÏÏÏÏÏÏÏÏÏÏÏÏÏÏÏÏÏÏÏ 13,404,173,632 (43)
PAYABLE IN CANADA IN U.S. DOLLARSJuly 26, 2006 April 26, 2004 DMTN109 3 LIBOR°0.053 68,000,000
November 18, 2014 November 18, 2004 DMTN131 4.50 300,000,000
TOTAL PAYABLE IN CANADA IN U.S. DOLLARS ÏÏÏÏÏÏÏÏÏÏÏÏÏÏÏÏÏÏÏÏÏÏÏÏÏÏÏÏÏÏÏÏÏÏÏÏÏÏÏÏ 368,000,000
CANADIAN DOLLAR EQUIVALENT EXCHANGE RATE OF $1.22224 ÏÏÏÏÏÏÏÏÏÏÏÏÏÏÏÏÏÏÏÏÏÏÏ 449,786,000 (9)
PAYABLE IN EUROPE IN U.S. DOLLARSNovember 26, 2008 November 26, 2004 EMTN68 Step-up 30,000,000
TOTAL PAYABLE IN EUROPE IN U.S. DOLLARS ÏÏÏÏÏÏÏÏÏÏÏÏÏÏÏÏÏÏÏÏÏÏÏÏÏÏÏÏÏÏÏÏÏÏÏÏÏÏÏÏ 30,000,000
CANADIAN DOLLAR EQUIVALENT EXCHANGE RATE OF $1.15030 ÏÏÏÏÏÏÏÏÏÏÏÏÏÏÏÏÏÏÏÏÏÏÏ 34,509,000 (17)
PAYABLE IN JAPAN IN JAPANESE YENMarch 16, 2007 March 18, 1997 KU 3.10 5,000,000,000 (54)March 16, 2007 March 18, 1997 KV 3.25 15,000,000,000 (55)July 18, 2007 July 18, 1997 YL012 2.615 10,000,000,000
November 12, 2009 November 12, 1999 YL014 2.00 10,000,000,000July 28, 2014 July 28, 2003 YL015 0.76 5,000,000,000
TOTAL PAYABLE IN JAPAN IN JAPANESE YEN ÏÏÏÏÏÏÏÏÏÏÏÏÏÏÏÏÏÏÏÏÏÏÏÏÏÏÏÏÏÏÏÏÏÏÏÏÏÏÏÏÏ 45,000,000,000
CANADIAN DOLLAR EQUIVALENT EXCHANGE RATE OF $0.010865ÏÏÏÏÏÏÏÏÏÏÏÏÏÏÏÏÏÏÏÏÏÏ 488,916,363 (14)
GLOBAL MARKET PAYABLE IN JAPANESE YENJanuary 25, 2010 January 25, 2000 ND 1.875 50,000,000,000
TOTAL PAYABLE IN GLOBAL MARKET IN JAPANESE YEN ÏÏÏÏÏÏÏÏÏÏÏÏÏÏÏÏÏÏÏÏÏÏÏÏÏÏÏÏÏÏ 50,000,000,000
CANADIAN DOLLAR EQUIVALENT EXCHANGE RATE OF $0.010366ÏÏÏÏÏÏÏÏÏÏÏÏÏÏÏÏÏÏÏÏÏÏ 518,312,136 (122)
52
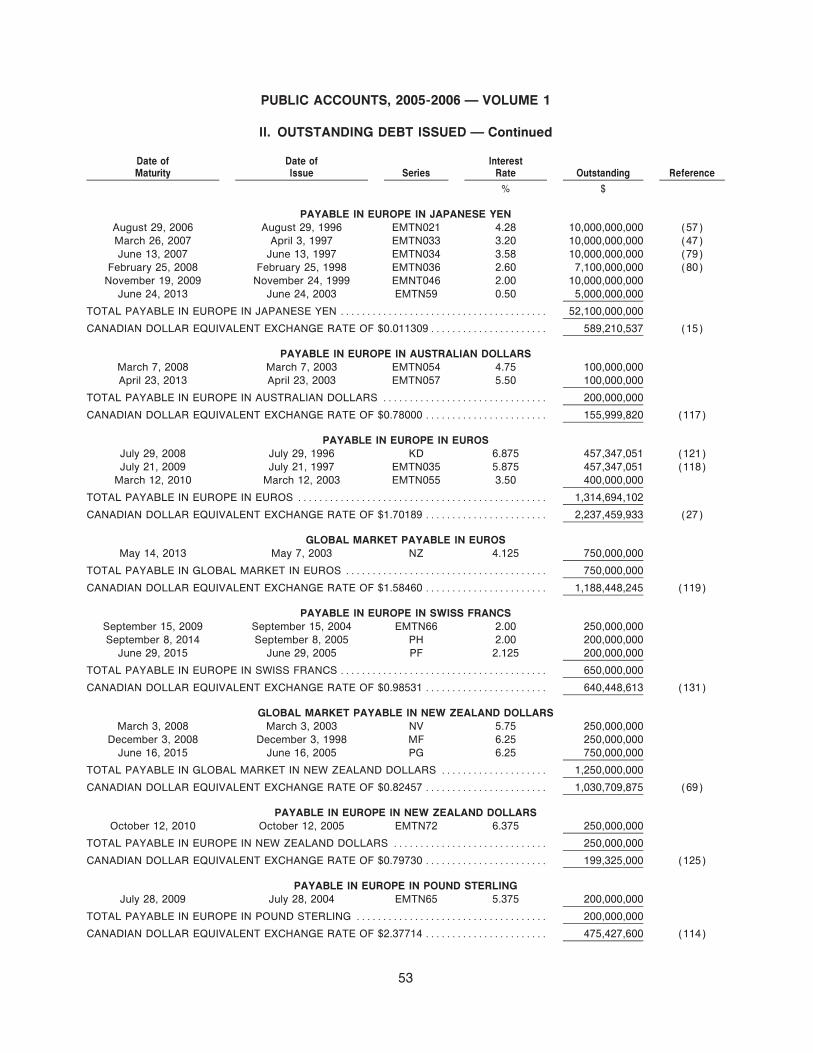
PUBLIC ACCOUNTS, 2005-2006 Ì VOLUME 1
II. OUTSTANDING DEBT ISSUED Ì Continued
Date of Date of InterestMaturity Issue Series Rate Outstanding Reference
% $
PAYABLE IN EUROPE IN JAPANESE YENAugust 29, 2006 August 29, 1996 EMTN021 4.28 10,000,000,000 (57)March 26, 2007 April 3, 1997 EMTN033 3.20 10,000,000,000 (47)June 13, 2007 June 13, 1997 EMTN034 3.58 10,000,000,000 (79)
February 25, 2008 February 25, 1998 EMTN036 2.60 7,100,000,000 (80)November 19, 2009 November 24, 1999 EMNT046 2.00 10,000,000,000
June 24, 2013 June 24, 2003 EMTN59 0.50 5,000,000,000
TOTAL PAYABLE IN EUROPE IN JAPANESE YEN ÏÏÏÏÏÏÏÏÏÏÏÏÏÏÏÏÏÏÏÏÏÏÏÏÏÏÏÏÏÏÏÏÏÏÏÏÏÏÏ 52,100,000,000
CANADIAN DOLLAR EQUIVALENT EXCHANGE RATE OF $0.011309ÏÏÏÏÏÏÏÏÏÏÏÏÏÏÏÏÏÏÏÏÏÏ 589,210,537 (15)
PAYABLE IN EUROPE IN AUSTRALIAN DOLLARSMarch 7, 2008 March 7, 2003 EMTN054 4.75 100,000,000April 23, 2013 April 23, 2003 EMTN057 5.50 100,000,000
TOTAL PAYABLE IN EUROPE IN AUSTRALIAN DOLLARS ÏÏÏÏÏÏÏÏÏÏÏÏÏÏÏÏÏÏÏÏÏÏÏÏÏÏÏÏÏÏÏ 200,000,000
CANADIAN DOLLAR EQUIVALENT EXCHANGE RATE OF $0.78000 ÏÏÏÏÏÏÏÏÏÏÏÏÏÏÏÏÏÏÏÏÏÏÏ 155,999,820 (117)
PAYABLE IN EUROPE IN EUROSJuly 29, 2008 July 29, 1996 KD 6.875 457,347,051 (121)July 21, 2009 July 21, 1997 EMTN035 5.875 457,347,051 (118)
March 12, 2010 March 12, 2003 EMTN055 3.50 400,000,000
TOTAL PAYABLE IN EUROPE IN EUROS ÏÏÏÏÏÏÏÏÏÏÏÏÏÏÏÏÏÏÏÏÏÏÏÏÏÏÏÏÏÏÏÏÏÏÏÏÏÏÏÏÏÏÏÏÏÏÏ 1,314,694,102
CANADIAN DOLLAR EQUIVALENT EXCHANGE RATE OF $1.70189 ÏÏÏÏÏÏÏÏÏÏÏÏÏÏÏÏÏÏÏÏÏÏÏ 2,237,459,933 (27)
GLOBAL MARKET PAYABLE IN EUROSMay 14, 2013 May 7, 2003 NZ 4.125 750,000,000
TOTAL PAYABLE IN GLOBAL MARKET IN EUROS ÏÏÏÏÏÏÏÏÏÏÏÏÏÏÏÏÏÏÏÏÏÏÏÏÏÏÏÏÏÏÏÏÏÏÏÏÏÏ 750,000,000
CANADIAN DOLLAR EQUIVALENT EXCHANGE RATE OF $1.58460 ÏÏÏÏÏÏÏÏÏÏÏÏÏÏÏÏÏÏÏÏÏÏÏ 1,188,448,245 (119)
PAYABLE IN EUROPE IN SWISS FRANCSSeptember 15, 2009 September 15, 2004 EMTN66 2.00 250,000,000September 8, 2014 September 8, 2005 PH 2.00 200,000,000
June 29, 2015 June 29, 2005 PF 2.125 200,000,000
TOTAL PAYABLE IN EUROPE IN SWISS FRANCS ÏÏÏÏÏÏÏÏÏÏÏÏÏÏÏÏÏÏÏÏÏÏÏÏÏÏÏÏÏÏÏÏÏÏÏÏÏÏÏ 650,000,000
CANADIAN DOLLAR EQUIVALENT EXCHANGE RATE OF $0.98531 ÏÏÏÏÏÏÏÏÏÏÏÏÏÏÏÏÏÏÏÏÏÏÏ 640,448,613 (131)
GLOBAL MARKET PAYABLE IN NEW ZEALAND DOLLARSMarch 3, 2008 March 3, 2003 NV 5.75 250,000,000
December 3, 2008 December 3, 1998 MF 6.25 250,000,000June 16, 2015 June 16, 2005 PG 6.25 750,000,000
TOTAL PAYABLE IN GLOBAL MARKET IN NEW ZEALAND DOLLARS ÏÏÏÏÏÏÏÏÏÏÏÏÏÏÏÏÏÏÏÏ 1,250,000,000
CANADIAN DOLLAR EQUIVALENT EXCHANGE RATE OF $0.82457 ÏÏÏÏÏÏÏÏÏÏÏÏÏÏÏÏÏÏÏÏÏÏÏ 1,030,709,875 (69)
PAYABLE IN EUROPE IN NEW ZEALAND DOLLARSOctober 12, 2010 October 12, 2005 EMTN72 6.375 250,000,000
TOTAL PAYABLE IN EUROPE IN NEW ZEALAND DOLLARS ÏÏÏÏÏÏÏÏÏÏÏÏÏÏÏÏÏÏÏÏÏÏÏÏÏÏÏÏÏ 250,000,000
CANADIAN DOLLAR EQUIVALENT EXCHANGE RATE OF $0.79730 ÏÏÏÏÏÏÏÏÏÏÏÏÏÏÏÏÏÏÏÏÏÏÏ 199,325,000 (125)
PAYABLE IN EUROPE IN POUND STERLINGJuly 28, 2009 July 28, 2004 EMTN65 5.375 200,000,000
TOTAL PAYABLE IN EUROPE IN POUND STERLING ÏÏÏÏÏÏÏÏÏÏÏÏÏÏÏÏÏÏÏÏÏÏÏÏÏÏÏÏÏÏÏÏÏÏÏÏ 200,000,000
CANADIAN DOLLAR EQUIVALENT EXCHANGE RATE OF $2.37714 ÏÏÏÏÏÏÏÏÏÏÏÏÏÏÏÏÏÏÏÏÏÏÏ 475,427,600 (114)
53

PUBLIC ACCOUNTS, 2005-2006 Ì VOLUME 1
II. OUTSTANDING DEBT ISSUED Ì Continued
Date of Date of InterestMaturity Issue Series Rate Outstanding Reference
% $
PAYABLE IN EUROPE IN HONG KONG DOLLARSJune 26, 2013 June 12, 2003 EMTN61 4.10 500,000,000
TOTAL PAYABLE IN EUROPE IN HONG KONG DOLLARSÏÏÏÏÏÏÏÏÏÏÏÏÏÏÏÏÏÏÏÏÏÏÏÏÏÏÏÏÏÏÏÏ 500,000,000
CANADIAN DOLLAR EQUIVALENT EXCHANGE RATE OF $0.17410 ÏÏÏÏÏÏÏÏÏÏÏÏÏÏÏÏÏÏÏÏÏÏÏ 87,051,195 (13)
PAYABLE IN EUROPE IN SOUTH AFRICAN RANDAugust 17, 2015 August 17, 2005 EMTN71 7.75 300,000,000
TOTAL PAYABLE IN EUROPE IN SOUTH AFRICAN RAND ÏÏÏÏÏÏÏÏÏÏÏÏÏÏÏÏÏÏÏÏÏÏÏÏÏÏÏÏÏÏÏ 300,000,000
CANADIAN DOLLAR EQUIVALENT EXCHANGE RATE OF $0.18027 ÏÏÏÏÏÏÏÏÏÏÏÏÏÏÏÏÏÏÏÏÏÏÏ 54,082,160 (126)
TOTAL DEBENTURES AND BONDSÏÏÏÏÏÏÏÏÏÏÏÏÏÏÏÏÏÏÏÏÏÏÏÏÏÏÏÏÏÏÏÏÏÏÏÏÏÏÏÏÏÏÏÏÏÏÏÏÏÏÏÏÏ 98,915,954,081
TREASURY BILLS ÏÏÏÏÏÏÏÏÏÏÏÏÏÏÏÏÏÏÏÏÏÏÏÏÏÏÏÏÏÏÏÏÏÏÏÏÏÏÏÏÏÏÏÏÏÏÏÏÏÏÏÏÏÏÏÏÏÏÏÏÏÏÏÏÏÏÏÏÏ 4,188,644,000 (84)
U.S. COMMERCIAL PAPER (in U.S. Dollars) ÏÏÏÏÏÏÏÏÏÏÏÏÏÏÏÏÏÏÏÏÏÏÏÏÏÏÏÏÏÏÏÏÏÏÏÏÏÏÏÏÏÏÏÏ 522,000,000 (91)
CANADIAN DOLLAR EQUIVALENT EXCHANGE RATE OF $1.24167 ÏÏÏÏÏÏÏÏÏÏÏÏÏÏÏÏÏÏÏÏÏÏÏ 648,153,501
TOTAL PUBLICLY HELD DEBT ÏÏÏÏÏÏÏÏÏÏÏÏÏÏÏÏÏÏÏÏÏÏÏÏÏÏÏÏÏÏÏÏÏÏÏÏÏÏÏÏÏÏÏÏÏÏÏÏÏÏÏÏÏÏÏÏÏ 103,752,751,582
OTHER DEBTSCHOOL BOARD TRUST DEBT
Year ending March 312037 2004 5.90 891,000,000
Less: Sinking Fund ÏÏÏÏÏÏÏÏÏÏÏÏÏÏÏÏÏÏÏÏÏÏÏÏÏÏÏÏÏÏÏÏÏÏÏÏÏÏÏÏÏÏÏÏÏÏÏÏÏÏÏÏÏÏÏÏÏÏÏÏÏÏÏÏÏÏÏÏ (28,121,708)
862,878,292 (23)
TOTAL DEBT ISSUED FOR PROVINCIAL PURPOSES ÏÏÏÏÏÏÏÏÏÏÏÏÏÏÏÏÏÏÏÏÏÏÏÏÏÏÏÏÏÏÏÏÏÏÏÏ 124,833,268,592Consolidation and other adjustments ÏÏÏÏÏÏÏÏÏÏÏÏÏÏÏÏÏÏÏÏÏÏÏÏÏÏÏÏÏÏÏÏÏÏÏÏÏÏÏÏÏÏÏÏÏÏÏÏÏÏÏÏ 2,039,512,280
TOTAL DEBT ISSUED FOR PROVINCIAL PURPOSES AFTER CONSOLIDATION ANDOTHER ADJUSTMENTSÏÏÏÏÏÏÏÏÏÏÏÏÏÏÏÏÏÏÏÏÏÏÏÏÏÏÏÏÏÏÏÏÏÏÏÏÏÏÏÏÏÏÏÏÏÏÏÏÏÏÏÏÏÏÏÏÏÏÏÏÏÏÏÏ 126,872,780,872 (83)
DEBT ISSUED FOR INVESTMENT PURPOSE*ONTARIO POWER GENERATION INCÏÏÏÏÏÏÏÏÏÏÏÏÏÏÏÏÏÏÏÏÏÏÏÏÏÏÏÏÏÏÏÏÏÏÏÏÏÏÏÏÏÏÏÏÏÏÏÏÏ 5,126,000,000HYDRO ONE INCÏÏÏÏÏÏÏÏÏÏÏÏÏÏÏÏÏÏÏÏÏÏÏÏÏÏÏÏÏÏÏÏÏÏÏÏÏÏÏÏÏÏÏÏÏÏÏÏÏÏÏÏÏÏÏÏÏÏÏÏÏÏÏÏÏÏÏÏ 3,759,000,000
TOTAL DEBT ISSUED FOR INVESTMENT PURPOSESÏÏÏÏÏÏÏÏÏÏÏÏÏÏÏÏÏÏÏÏÏÏÏÏÏÏÏÏÏÏÏÏÏÏÏÏ 8,885,000,000
* Debt for Investment Purposes, as a result of a debt for equity swap between the Province and Ontario Power General Inc. andHydro One Inc., is eliminated upon consolidation.
54

PUBLIC ACCOUNTS, 2005-2006 Ì VOLUME 1
II. OUTSTANDING DEBT ISSUED Ì Continued
Date of Date of InterestMaturity Issue Series Rate Outstanding Reference
% $
Debt Issued for Ontario Electricity Financial Corporation (OEFC)PAYABLE IN CANADA IN CANADIAN DOLLARS
NON-PUBLICLY HELD DEBTCanada Pension Plan Investment Fund
2007 1986 CPP 9.64 119,000,0002008 1988 CPP 9.13 to 9.72 388,715,0002009 1989 CPP 9.62 to 10.31 589,319,0002010 1990 CPP 9.61 to 10.31 650,712,0002021 2001 CPP 6.08 19,375,0002022 2002 CPP 6.17 to 6.29 172,961,0002023 2003 CPP 6.16 38,130,000
TOTAL NON-PUBLIC PAYABLE IN CANADA IN CANADIAN DOLLARS ÏÏÏÏÏÏÏÏÏÏÏÏÏÏÏÏÏÏÏÏ 1,978,212,000 (5)
PAYABLE IN CANADA IN CANADIAN DOLLARSPUBLICLY HELD DEBT
May 1, 2006 August 1, 2003 DMTN76 3CBA 720,000,000June 1, 2006 November 25, 2003 DMNT89 3CBA 100,000,000June 2, 2006 April 29, 2004 DMTN111 3CBA°0.15 110,500,000 (4)
September 8, 2006 September 16, 2003 DMTN78 3.50 1,000,000,000September 27, 2006 September 27, 2004 DMTN124 1CBA-0.01 100,000,000
October 1, 2008 February 13, 2004 DMTN85 3CBA°0.03 736,000,000 (28)(107)December 1, 2008 January 22, 1999 HC-LZ 5.70 650,000,000
May 19, 2009 April 30, 2004 DMTN112 4.00 30,000,000 (8)May 19, 2009 May 4, 2004 DMTN113 Step-up 25,000,000 (12)May 19, 2009 May 24, 2005 DMTN106 4.00 500,000,000
August 13, 2009 February 13, 2004 DMTN99 3.21 492,341,653 (124)October 1, 2009 October 5, 2004 DMTN126 3CBA°0.03 350,000,000
November 19, 2009 July 26, 2000 CH-MU 6.20 500,000,000November 19, 2010 September 1, 2000 HC-NK 6.10 500,000,000
March 15, 2011 March 15, 2001 DMTN3 Step-up 50,000,000 (37)December 2, 2011 July 20, 2001 DMTN8 6.10 500,000,000December 2, 2012 May 12, 2003 DMTN53 5.375 500,000,000
June 2, 2013 May 28, 2003 DMTN69 4.75 500,000,000March 8, 2014 January 28, 2004 DMTN93 5.00 1,000,000,000 (109)March 8, 2015 January 24, 2005 DMTN135 4.50 500,000,000March 8, 2016 February 14, 2006 DMTN163 4.40 250,000,000 (105)June 2, 2018 June 6, 2005 DMTN79 5.50 60,000,000 (10)June 2, 2020 February 22, 2005 DMTN140 4.85 29,000,000 (92)
September 8, 2023 November 29, 2004 HP 8.10 50,000,000 (59)June 2, 2027 February 4, 2000 HC-KJA 7.60 100,500,000 (61)
August 25, 2028 April 6, 1999 HC-LQA 6.25 78,600,000June 2, 2031 February 24, 2000 HC-NF 6.20 500,000,000 (51)
2.00 RealDecember 1, 2036 October 4, 2005 DMTN158 Return 706,867,000 (44)
10,638,808,653
PAYABLE IN EUROPE IN CANADIAN DOLLARSApril 17, 2013 June 3, 2003 EMTN56 5.50 150,000,000July 8, 2014 July 8, 2004 EMTN63 3CBA°0.07 500,000,000
February 17, 2015 February 17, 2005 EMTN69 4.50 200,000,000
850,000,000
PAYABLE IN EUROPE IN SWISS FRANCSJuly 8, 2013 July 8, 2003 EMTN60 2.50 300,000,000
CANADIAN DOLLAR EQUIVALENT EXCHANGE RATE OF $1.02348 ÏÏÏÏÏÏÏÏÏÏÏÏÏÏÏÏÏÏÏÏÏÏÏ 307,045,455 (35)
55
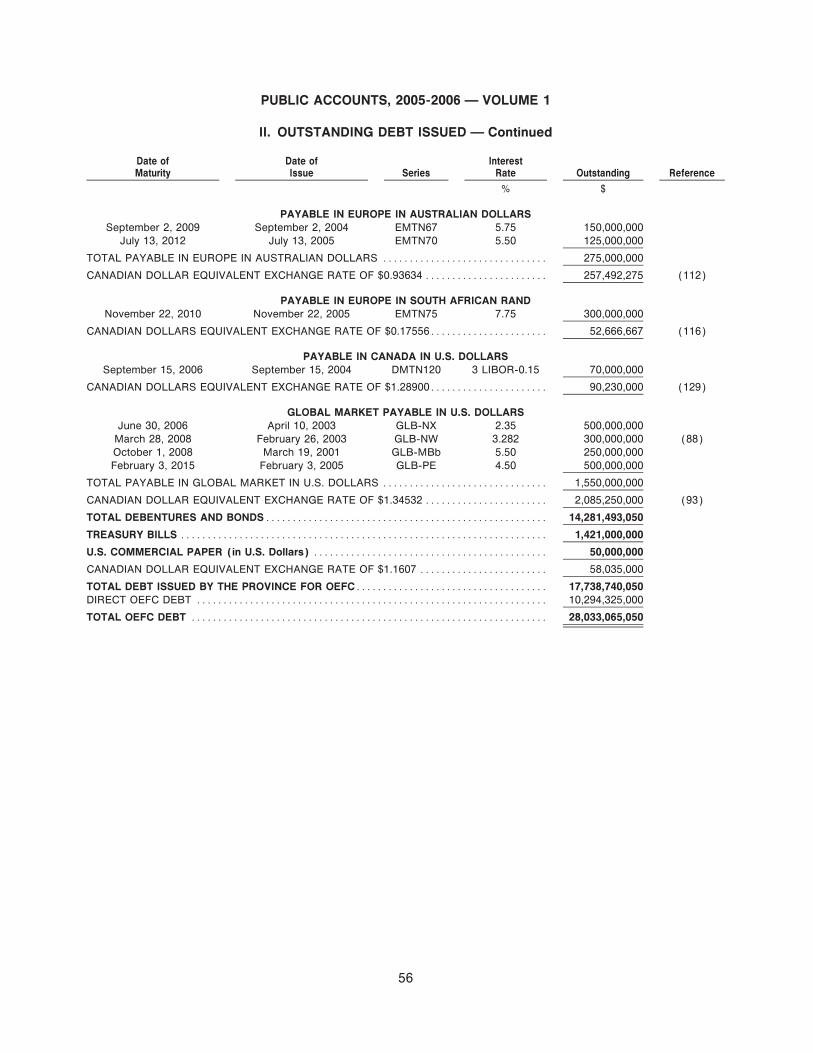
PUBLIC ACCOUNTS, 2005-2006 Ì VOLUME 1
II. OUTSTANDING DEBT ISSUED Ì Continued
Date of Date of InterestMaturity Issue Series Rate Outstanding Reference
% $
PAYABLE IN EUROPE IN AUSTRALIAN DOLLARSSeptember 2, 2009 September 2, 2004 EMTN67 5.75 150,000,000
July 13, 2012 July 13, 2005 EMTN70 5.50 125,000,000
TOTAL PAYABLE IN EUROPE IN AUSTRALIAN DOLLARS ÏÏÏÏÏÏÏÏÏÏÏÏÏÏÏÏÏÏÏÏÏÏÏÏÏÏÏÏÏÏÏ 275,000,000
CANADIAN DOLLAR EQUIVALENT EXCHANGE RATE OF $0.93634 ÏÏÏÏÏÏÏÏÏÏÏÏÏÏÏÏÏÏÏÏÏÏÏ 257,492,275 (112)
PAYABLE IN EUROPE IN SOUTH AFRICAN RANDNovember 22, 2010 November 22, 2005 EMTN75 7.75 300,000,000
CANADIAN DOLLARS EQUIVALENT EXCHANGE RATE OF $0.17556ÏÏÏÏÏÏÏÏÏÏÏÏÏÏÏÏÏÏÏÏÏÏ 52,666,667 (116)
PAYABLE IN CANADA IN U.S. DOLLARSSeptember 15, 2006 September 15, 2004 DMTN120 3 LIBOR-0.15 70,000,000
CANADIAN DOLLARS EQUIVALENT EXCHANGE RATE OF $1.28900ÏÏÏÏÏÏÏÏÏÏÏÏÏÏÏÏÏÏÏÏÏÏ 90,230,000 (129)
GLOBAL MARKET PAYABLE IN U.S. DOLLARSJune 30, 2006 April 10, 2003 GLB-NX 2.35 500,000,000March 28, 2008 February 26, 2003 GLB-NW 3.282 300,000,000 (88)October 1, 2008 March 19, 2001 GLB-MBb 5.50 250,000,000February 3, 2015 February 3, 2005 GLB-PE 4.50 500,000,000
TOTAL PAYABLE IN GLOBAL MARKET IN U.S. DOLLARS ÏÏÏÏÏÏÏÏÏÏÏÏÏÏÏÏÏÏÏÏÏÏÏÏÏÏÏÏÏÏÏ 1,550,000,000
CANADIAN DOLLAR EQUIVALENT EXCHANGE RATE OF $1.34532 ÏÏÏÏÏÏÏÏÏÏÏÏÏÏÏÏÏÏÏÏÏÏÏ 2,085,250,000 (93)
TOTAL DEBENTURES AND BONDSÏÏÏÏÏÏÏÏÏÏÏÏÏÏÏÏÏÏÏÏÏÏÏÏÏÏÏÏÏÏÏÏÏÏÏÏÏÏÏÏÏÏÏÏÏÏÏÏÏÏÏÏÏ 14,281,493,050
TREASURY BILLS ÏÏÏÏÏÏÏÏÏÏÏÏÏÏÏÏÏÏÏÏÏÏÏÏÏÏÏÏÏÏÏÏÏÏÏÏÏÏÏÏÏÏÏÏÏÏÏÏÏÏÏÏÏÏÏÏÏÏÏÏÏÏÏÏÏÏÏÏÏ 1,421,000,000
U.S. COMMERCIAL PAPER (in U.S. Dollars) ÏÏÏÏÏÏÏÏÏÏÏÏÏÏÏÏÏÏÏÏÏÏÏÏÏÏÏÏÏÏÏÏÏÏÏÏÏÏÏÏÏÏÏÏ 50,000,000
CANADIAN DOLLAR EQUIVALENT EXCHANGE RATE OF $1.1607 ÏÏÏÏÏÏÏÏÏÏÏÏÏÏÏÏÏÏÏÏÏÏÏÏ 58,035,000
TOTAL DEBT ISSUED BY THE PROVINCE FOR OEFCÏÏÏÏÏÏÏÏÏÏÏÏÏÏÏÏÏÏÏÏÏÏÏÏÏÏÏÏÏÏÏÏÏÏÏÏ 17,738,740,050DIRECT OEFC DEBT ÏÏÏÏÏÏÏÏÏÏÏÏÏÏÏÏÏÏÏÏÏÏÏÏÏÏÏÏÏÏÏÏÏÏÏÏÏÏÏÏÏÏÏÏÏÏÏÏÏÏÏÏÏÏÏÏÏÏÏÏÏÏÏÏÏÏ 10,294,325,000
TOTAL OEFC DEBT ÏÏÏÏÏÏÏÏÏÏÏÏÏÏÏÏÏÏÏÏÏÏÏÏÏÏÏÏÏÏÏÏÏÏÏÏÏÏÏÏÏÏÏÏÏÏÏÏÏÏÏÏÏÏÏÏÏÏÏÏÏÏÏÏÏÏÏ 28,033,065,050
56

PUBLIC ACCOUNTS, 2005-2006 Ì VOLUME 1
II. OUTSTANDING DEBT ISSUED Ì Continued
References:
1. All debt is non-callable, except as noted below. CBA is Canadian Bankers' Acceptance Rate; 3 CBAis a three month Öoating rate; LIBOR is London Inter-bank OÅered Rate. All foreign currency debthas been converted into Canadian dollars at the rates of the currency exchange agreements if thedebt is hedged, or at year end exchange rates if unhedged. The exchange rates of foreigncurrencies to Canadian dollars as at March 31, 2006 are: Australian dollar 0.8362, Euro 1.4169,Hong Kong dollar 0.150402, Japanese yen 0.009933, New Zealand dollar 0.7193, South Africanrand 0.1896, Swiss franc 0.8960, and United States dollar 1.1671, U.K. pound 2.0299.
2. DMTN128: Bonds are extendible at the option of the Province on the initial maturity date ofOctober 27, 2006 and on each extended maturity date thereafter to the Ñnal maturity date ofOctober 27, 2011. Interest is payable semi-annually at 4.0% in year 1-2, 4.2% in year 3, 4.5% inyear 4, 4.9% in year 5, 5.35% in year 6, 5.8% in the Ñnal year. In addition, the Province entered intointerest rate agreements that eÅectively converted the interest rate obligation on this debt to a Ñxedrate of 3.14%.
3. DMTN129: Bonds are extendible at the option of the Province on the initial maturity date ofOctober 29, 2006 and on each extended maturity date thereafter to the Ñnal maturity date ofOctober 29, 2014. Interest is payable monthly at 4.2% in year 1, 4.25% in year 2, 4.35% in year 3,4.5% in year 4, 4.65% in year 5, 4.85% in year 6, 5.25% in year 7, 5.5% in year 8, 6.0% in year 9 and7.0% in the Ñnal year. In addition, the Province entered into interest rate agreements that eÅectivelyconverted the interest rate obligation on this debt to a Ñxed rate of 3.09%.
4. DMTN111 (OEFC): Maximum reset interest rate on this debt is 4.0%.
5. CPP: Securities sold to the Canada Pension Plan Investment Fund are payable 20 years after theirrespective dates of issue, are not negotiable and not transferable or assignable but are redeemablein whole or in part before maturity at the option of the Minister of Finance of Canada, on six months'prior notice, when the Minister deems it necessary in order to meet the requirements of the CanadaPension Plan. In the case of redemption before maturity, the Ontario Securities are to be redeemedin the order in which they were issued and the amount of Ontario Securities to be redeemed at anytime shall be proportionate to the amount of all securities then held to the credit of the said fundrepresented by Ontario Securities.
EÅective July 1, 2005, under a side-letter agreement signed between the Canada Pension PlanInvestment Board (CPPIB) and the Province, CPPIB is oÅering the Province upon maturity of thedebentures held to the credit of the Canada Pension Plan Investment Fund that were issued beforeJanuary 1, 1998, an option of issuing new replacement debentures to the CPPIB with a maximumterm of 30 years as of July 1, 2005 (minimum term of 5 years and with subsequent roll over optionssubject to the 30 years maximum from the date of issue of the Ñrst replacement debenture). Thesedebentures are not negotiable or transferable and are assignable only to a wholly-owned subsidiaryof the Canada Pension Plan Investment Board.
6. DMTN143: During the 2005-06 Ñscal year, Series DMTN143 was re-opened once, bringing the totalissue size to $550 million. In addition, the Province entered into interest rate agreements thateÅectively converted the interest rate obligation on this debt to a Ñxed rate of 4.56%.
7. CMHC: The terms of these debentures require that equal payments be made each year until theirmaturity. Each payment consists of blended principal and interest.
8. DMTN112 (OEFC): Bonds are callable in full but not in part at the option of the Province on May 19,2006 and bonds may be exchangeable for Series DMTN106 in whole or in part at the option of thebond holders on May 26, 2006.
9. Domestic USD Bonds: The Province entered into currency exchange agreements that eÅectivelyconverted these U.S. dollar obligations to Canadian dollar obligations at an exchange rate of
57

PUBLIC ACCOUNTS, 2005-2006 Ì VOLUME 1
II. OUTSTANDING DEBT ISSUED Ì Continued
1.22224. In addition, the Province entered into interest rate agreements that eÅectivelyconverted the interest rate obligation to a Ñxed rate of 4.41%.
10. DMTN79: During the 2005-06 Ñscal year, Series DMTN79 was re-opened seven times, bringing thetotal issue size to $420 million including $60 million for OEFC. In addition, the Province entered intointerest rate agreements that eÅectively converted $125 million of this interest rate obligation to aÑxed rate of 4.84%.
11. DMTN119: During the 2005-06 Ñscal year, Series DMTN119 was re-opened seven times, bringingthe total issue size to $6,798 million. Province also purchased $202 million of these bonds forcancellation.
12. DMTN113 (OEFC): Interest is payable semi-annually at 3.5% in 1-2 years and thereafter at 4.0%until the maturity date.
13. EMTN61: The Province entered into currency exchange agreements that eÅectively converted theseHong Kong dollar obligations to Canadian dollar obligations at an exchange rate of 0.17410. Inaddition, the Province entered into interest rate agreements that eÅectively converted the interestrate obligation to a Ñxed rate of 4.99%.
14. Japan JPY: The Province entered into currency exchange agreements that eÅectively converted30 billion of these Japanese yen obligations to Canadian dollar obligations at an exchange rate of0.011331. In addition, the Province entered into interest rate agreements that eÅectively convertedthe interest rate obligation on $120 million of these debt to a Ñxed rate of 6.18%, $220 million to athree-month Canadian BA rate minus 0.051% and the remaining debt of $149 million is at a couponrate of 1.59%.
15. EMTN JPY Bonds: The Province entered into currency exchange agreements that eÅectivelyconverted 37.1 billion of these Japanese yen obligations to Canadian dollar obligations at anexchange rate of 0.011866. In addition, the Province entered into interest rate agreements thateÅectively converted the interest rate obligation on $440 million of these debts to a Ñxed rate of6.64%; the remaining debt of $149 million is at a coupon rate of 1.50%.
16. DMTN86: The Province entered into interest rate agreements that eÅectively converted the interestrate obligation to a Ñxed rate of 3.42%.
17. EMTN68: Interest is payable annually at 3.72% in year 1, 3.87% in year 2, 4.02% in year 3 and 4.17%in the Ñnal year. The Province entered into currency exchange agreements that eÅectively convertedthese U.S. dollar obligations to Canadian dollar obligations at an exchange rate of 1.15030. Inaddition, the Province entered into interest rate agreements that eÅectively converted the interestrate obligation to a Öoating three-month US LIBOR rate minus 0.24%.
18. DMTN147: Bonds are extendible at the option of the Province on the initial maturity date of June 17,2007 and on each extended maturity date thereafter to the Ñnal maturity date of June 17, 2017.Interest is payable semi-annually at 4.0% in year 1-2, 4.05% in year 3-4, 4.1% in year 5-6, 4.15% inyear 7-8, 4.2% in year 9, 4.25% in year 10, 4.75% in year 11 and 5.25% in Ñnal year. In addition, theProvince entered into interest rate agreements that eÅectively converted the interest rate obligationon this debt to a Ñxed rate of 3.13%.
19. JJ: Bonds are retractable in whole or in part at the option of the bond holders on February 8, 2007.During the Ñscal year 2005-06, the Province repurchased $20 million of these bonds forcancellation.
20. JK: Bonds are retractable in whole or in part at the option of the bond holders on March 1, 2010.
21. JF: Bonds are exchangeable at the option of the bond holders in whole or in part any time prior toJanuary 12, 2007 at par for Series JG due on January 12, 2035.
22. DMTN146: Bonds are extendible at the option of the Province on the initial maturity date of June 20,2007 and on each extended maturity date thereafter to the Ñnal maturity date of June 20, 2017.
58

PUBLIC ACCOUNTS, 2005-2006 Ì VOLUME 1
II. OUTSTANDING DEBT ISSUED Ì Continued
Interest is payable semi-annually at 4.0% in year 1-3, 4.2% in year 4-5, 4.25% in year 6-7, 4.3% inyear 8-9, 4.5% in year 10, 5.0% in year 11 and 5.5% in Ñnal year. In addition, the Province enteredinto interest rate agreements that eÅectively converted the interest rate obligation on this debt to aÑxed rate of 3.09%.
23. SBT: The School Board Trust was created in June 2003 to permanently reÑnance debt incurred by55 school boards to support their capital projects prior to the introduction of the student focussedfunding model in 1998. The trust issued 30-year sinking fund debentures amounting to $891 millionin June 2003. The Trust provided $882 million of the proceeds to the 55 school boards in exchangefor the irrevocable right to receive future transfer payments from the Province related to this debt.These amounts will be reduced over the 30-year period by the transfer payments made by Ministryof Education to the Trust under the School Board Operating Grant program.
24. Series HZ, JA, JB, JC, JD: The terms of these debentures require unequal payments, consisting ofboth principal and interest, to be made at predetermined irregular intervals. By January 10, 2035,the principal to be repaid on these debentures will be $230.8 million.
25. DMTN145: Bonds are extendible at the option of the Province on the initial maturity date of June 21,2007 and on each extended maturity date thereafter to the Ñnal maturity date of June 21, 2010.Interest is payable semi-annually at 3.1% in year 1-2, 3.3% in year 3, 4.0% in year 4 and 4.7% in Ñnalyear. In addition, the Province entered into interest rate agreements that eÅectively converted theinterest rate obligation on this debt to a Ñxed rate of 3.13%.
26. DMTN137: Bonds are extendible at the option of the Province on the initial maturity date ofJanuary 28, 2007 and on each extended maturity date thereafter to the Ñnal maturity date ofJanuary 28, 2015. Interest is payable semi-annually at 4.1% in year 1-2, 4.15% in year 3, 4.25% inyear 4, 4.35% in year 5, 4.5% in year 6, 4.75% in year 7, 5.0% in year 8, 5.75% in year 9, and 6.5% inthe Ñnal year. In addition, the Province entered into interest rate agreements that eÅectivelyconverted the interest rate obligation on this debt to a Ñxed rate of 3.39%.
27. Euro Bonds: The Province entered into currency exchange agreements that eÅectively convertedthese Euro obligations to Canadian dollar obligations at an exchange rate of 1.70189. In addition,the Province entered into interest rate agreements that eÅectively converted the interest rateobligations on $2,037 million of these debt to a Ñxed rate of 5.96% and $200 million to a three-monthCanadian BA rate plus 0.057%.
28. DMTN85 (OEFC): The Province entered into interest rate agreements that eÅectively converted theinterest rate obligation to a Ñxed rate of 3.60%.
29. OSB: The outstanding amounts represent bonds matured but not yet presented for redemption. Nointerest is earned on these bonds.
30. OSB: The Province issues Ñxed rate Ontario Savings Bonds for a term of three years every year.
31. DMTN148: Bonds are extendible at the option of the Province on the initial maturity date of June 21,2007 and on each extended maturity date thereafter to the Ñnal maturity date of June 21, 2010.Interest is payable semi-annually at 3.05% in year 1-2, 3.7% in year 3, 4.0% in year 4 and 4.5% inÑnal year. In addition, the Province entered into interest rate agreements that eÅectively convertedthe interest rate obligation on this debt to a Ñxed rate of 3.13%.
32. DMTN149: Bonds are extendible at the option of the bond holders on June 2, 2016 to the Ñnalmaturity date of June 2, 2035 and exchange for series DMTN119. Interest is payable semi-annuallyat 3.6% until June 2, 2016 and 4.8% thereafter if extended. In addition, the Province entered intointerest rate agreements that eÅectively converted the interest rate obligation on this debt to a Ñxedrate of 4.67%.
33. DMTN127: Bonds are extendible at the option of the Province on the initial maturity date ofOctober 14, 2006 and on each extended maturity date thereafter to the Ñnal maturity date ofOctober 14, 2009. Interest is payable annually at 4.0% in year 1-2, 4.1% in year 3, 4.4% in year 4,
59

PUBLIC ACCOUNTS, 2005-2006 Ì VOLUME 1
II. OUTSTANDING DEBT ISSUED Ì Continued
5.0% in the Ñnal year. In addition, the Province entered into interest rate agreements that eÅectivelyconverted the interest rate obligation on this debt to a Ñxed rate of 3.13%.
34. MW: Registered holder exercised the right to exchange Series MV Bonds for Series MW Bonds onDecember 2, 2004. In addition, the Province entered into interest rate agreements that eÅectivelyconverted the interest rate obligation on this debt to a Öoating three month Canadian BA rate minus0.45%.
35. EMTN60 (OEFC): The Province entered into currency exchange agreements that eÅectivelyconverted these Swiss francs obligations to Canadian dollar obligations at an exchange rate of1.02348. In addition, the Province entered into interest rate agreements that eÅectively convertedthe interest rate obligation to a Ñxed rate of 4.99%.
36. DMTN150: Bonds are callable at the option of the Province on July 5, 2007. Interest is payable semi-annually at 3.05% in year 1-2 and 4.2% thereafter. In addition, the Province entered into interest rateagreements that eÅectively converted the interest rate obligation to a Ñxed rate of 3.13%.
37. DMTN3 (OEFC): Bonds are retractable in whole or in part at the option of the bond holders onMarch 15, 2005. Interest is payable at 5.50% for the Ñrst four years and 6.80% for the remaining sixyears.
38. DMTN133: Bonds are retractable at the option of the bond holders on December 2, 2014 orexchangeable for series DMTN119 at par on December 15, 2014. Interest is payable at 4.0% untilDecember 2, 2014 and thereafter at 5.35% until Ñnal maturity date. In addition, the Province enteredinto interest rate agreements that eÅectively converted the interest rate obligation on this debt to arate of 5.26%.
39. DMTN151: Bonds are extendible at the option of the Province on the initial maturity date ofAugust 22, 2007 and on each extended maturity date thereafter to Ñnal maturity date of August 22,2017. Interest is payable semi-annually at 4.1% in year 1-2 and 4.2% in year 3, 4.25% in year 4, 4.3%in year 5, 4.4% in year 6, 4.5% in year 7, 4.6% in year 8, 4.75% in year 9, 5.0% in year 10 and 5.5% inÑnal year. In addition, the Province entered into interest rate agreements that eÅectively convertedthe interest rate obligation to a Ñxed rate of 3.25%.
40. DMTN152: Registered bond holder has the right to extend the bond on the maturity date ofDecember 2, 2016 to June 2, 2035 and/or exchange the bond for series DMTN119 at par. Interest ispayable semi-annually at 3.75% until maturity and thereafter at 4.75% if extended. In addition, theProvince entered into interest rate agreements that eÅectively converted the interest rate obligationto a Ñxed rate of 4.77%.
41. JL: The terms of these debentures require unequal payments, consisting of both principal andinterest, to be made at predetermined irregular intervals with the Ñnal payment on January 10, 2045.The total principal and interest to be payable over the life of the debenture is $1,325 million in total.
42. HY: During the Ñscal year 2005-06, the Province repurchased $31.2 million of these bonds forcancellation at a premium of $24.6 million.
43. Global USD Bonds: The Province entered into currency exchange agreements that eÅectivelyconverted 10,050 million of these US dollar obligations to Canadian dollar obligations at anexchange rate of 1.30472. In addition, the Province entered into interest rate agreements thateÅectively converted the interest rate obligations on $13,402 million of these debt to a Ñxed rate of4.77%, $2 million to three month Canadian BA rate plus 0.105%.
44. DMTN158: This Real Return Bond bears interest adjusted in relation to All-Items Consumer PriceIndex for Canada (the ""CPI''), issued with a base index of 127.54839. Principal amount will beindexed to include CPI adjustment on redemption date. The amount outstanding represents theindexed value of the original principal of $300 million for the Province and $700 million on-lent toOEFC. Interest is payable semi-annually at 2.0% on the indexed principal. The Province has entered
60

PUBLIC ACCOUNTS, 2005-2006 Ì VOLUME 1
II. OUTSTANDING DEBT ISSUED Ì Continued
into real return swaps and interest rate swaps that synthetically converted $300 million of thisdebt to a nominal debt at Ñxed rate of 4.66%.
45. DMTN1: The Province entered into interest rate agreements that eÅectively converted the interestrate obligation to a three-month Canadian BA rate minus 0.02%.
46. MN: Interest is payable quarterly at a three-month Canadian BA rate plus 0.85% for the Ñrst twoyears, and thereafter at 5.75% semi-annually. In addition, the Province entered into interest rateagreements that eÅectively converted the interest rate obligation to a three-month Canadian BA rateminus 0.07%.
47. EMTN033: Proceeds of issue and repayment are in Japanese yen. Interest is payable in Australiandollars annually based on a notional principal of Australian dollars $103.2 million at 3.2%. In addition,the Province entered into interest rate agreements that eÅectively converted the interest rateobligation to a Ñxed rate of 6.86%.
48. DMTN134: Bonds are extendible at the option of the Province on the initial maturity date ofJanuary 19, 2007 and on each extended maturity date thereafter to the Ñnal maturity date ofJanuary 19, 2017. Interest is payable semi-annually at 4.2% in year 1-2, 4.5% in year 3-4, 4.75% inyear 5, 5.0% in year 6, 5.25% in year 7, 5.5% in year 8, 5.75% in year 9, 6.0% in year 10, 6.5% in year11 and 7.0% in the Ñnal year. In addition, the Province entered into interest rate agreements thateÅectively converted the interest rate obligation on this debt to a Ñxed rate of 3.39%.
49. DMTN154: Bonds are extendible at the option of the Province on the initial maturity date ofSeptember 21, 2007 and on each extended maturity date thereafter to Ñnal maturity date ofSeptember 21, 2017. Interest is payable semi-annually at 4.0% in year 1-2 and 4.1% in year 3-4,4.2% in year 5-6, 4.3% in year 7-8, 4.5% in year 9, 4.6% in year 10, 5.0% in year 11, 5.25% in Ñnalyear. In addition, the Province entered into interest rate agreements that eÅectively converted theinterest rate obligation to a Ñxed rate of 3.19%.
50. DMTN136: Interest rate on this debt is capped at 3.25% in year 1, 3.90% in year 2 and 4.65% in theÑnal year. In addition, the Province entered into interest rate agreements that eÅectively convertedthe interest rate obligation on this debt to a Ñxed rate of 3.67%.
51. NF: This issue has been on-lent to OEFC until June 2, 2010, after which the issue will be assumedby the Province until the maturity date.
52. DMTN157: Interest is payable semi-annually at 15.0% until January 13, 2006 and thereafter at 5.0%.
53. DMTN70: The Province entered into interest rate agreements that eÅectively converted the interestrate obligation to a Ñxed rate of 4.02%.
54. KU: Proceeds of issue and repayment are in Japanese yen. Interest is payable in Australian dollars,based on a notional principal of AUD 52.5 million at 3.10%. In addition, the Province entered intointerest rate agreements that eÅectively converted the interest rate obligation to a three-monthCanadian BA rate minus 0.051%.
55. KV: Proceeds of issue and repayment are in Japanese yen. Interest is payable in U.S. dollars, basedon a notional principal of USD 120.8 million at 3.25%. In addition, the Province entered into interestrate agreements that eÅectively converted the interest rate obligation to a three-month Canadian BArate minus 0.051%.
56. DMTN116: Bonds are extendible at the option of the bond holders on the initial maturity date ofSeptember 8, 2013 to the Ñnal maturity date of March 8, 2033. Interest is payable semi-annually at4.625% until the initial maturity date and at 5.85% if extended. In addition, the Province entered intointerest rate agreements that eÅectively converted the interest rate obligation on this debt to a rateof 5.08%.
57. EMTN021: Proceeds of issue and repayment are in Japanese yen. Interest is payable in Australiandollars based on a notional principal of AUD 121.1 million at 4.28%. In addition, the Province entered
61
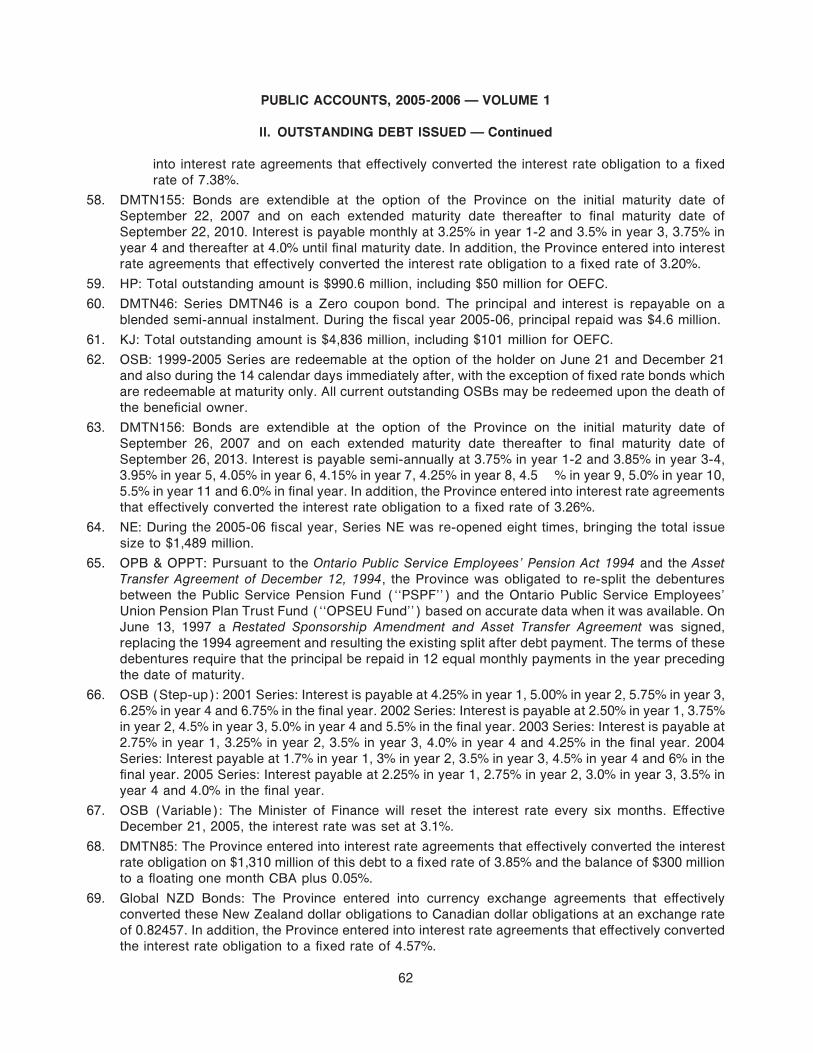
PUBLIC ACCOUNTS, 2005-2006 Ì VOLUME 1
II. OUTSTANDING DEBT ISSUED Ì Continued
into interest rate agreements that eÅectively converted the interest rate obligation to a Ñxedrate of 7.38%.
58. DMTN155: Bonds are extendible at the option of the Province on the initial maturity date ofSeptember 22, 2007 and on each extended maturity date thereafter to Ñnal maturity date ofSeptember 22, 2010. Interest is payable monthly at 3.25% in year 1-2 and 3.5% in year 3, 3.75% inyear 4 and thereafter at 4.0% until Ñnal maturity date. In addition, the Province entered into interestrate agreements that eÅectively converted the interest rate obligation to a Ñxed rate of 3.20%.
59. HP: Total outstanding amount is $990.6 million, including $50 million for OEFC.
60. DMTN46: Series DMTN46 is a Zero coupon bond. The principal and interest is repayable on ablended semi-annual instalment. During the Ñscal year 2005-06, principal repaid was $4.6 million.
61. KJ: Total outstanding amount is $4,836 million, including $101 million for OEFC.
62. OSB: 1999-2005 Series are redeemable at the option of the holder on June 21 and December 21and also during the 14 calendar days immediately after, with the exception of Ñxed rate bonds whichare redeemable at maturity only. All current outstanding OSBs may be redeemed upon the death ofthe beneÑcial owner.
63. DMTN156: Bonds are extendible at the option of the Province on the initial maturity date ofSeptember 26, 2007 and on each extended maturity date thereafter to Ñnal maturity date ofSeptember 26, 2013. Interest is payable semi-annually at 3.75% in year 1-2 and 3.85% in year 3-4,3.95% in year 5, 4.05% in year 6, 4.15% in year 7, 4.25% in year 8, 4.5 % in year 9, 5.0% in year 10,5.5% in year 11 and 6.0% in Ñnal year. In addition, the Province entered into interest rate agreementsthat eÅectively converted the interest rate obligation to a Ñxed rate of 3.26%.
64. NE: During the 2005-06 Ñscal year, Series NE was re-opened eight times, bringing the total issuesize to $1,489 million.
65. OPB & OPPT: Pursuant to the Ontario Public Service Employees' Pension Act 1994 and the AssetTransfer Agreement of December 12, 1994, the Province was obligated to re-split the debenturesbetween the Public Service Pension Fund (""PSPF'') and the Ontario Public Service Employees'Union Pension Plan Trust Fund (""OPSEU Fund'') based on accurate data when it was available. OnJune 13, 1997 a Restated Sponsorship Amendment and Asset Transfer Agreement was signed,replacing the 1994 agreement and resulting the existing split after debt payment. The terms of thesedebentures require that the principal be repaid in 12 equal monthly payments in the year precedingthe date of maturity.
66. OSB (Step-up): 2001 Series: Interest is payable at 4.25% in year 1, 5.00% in year 2, 5.75% in year 3,6.25% in year 4 and 6.75% in the Ñnal year. 2002 Series: Interest is payable at 2.50% in year 1, 3.75%in year 2, 4.5% in year 3, 5.0% in year 4 and 5.5% in the Ñnal year. 2003 Series: Interest is payable at2.75% in year 1, 3.25% in year 2, 3.5% in year 3, 4.0% in year 4 and 4.25% in the Ñnal year. 2004Series: Interest payable at 1.7% in year 1, 3% in year 2, 3.5% in year 3, 4.5% in year 4 and 6% in theÑnal year. 2005 Series: Interest payable at 2.25% in year 1, 2.75% in year 2, 3.0% in year 3, 3.5% inyear 4 and 4.0% in the Ñnal year.
67. OSB (Variable): The Minister of Finance will reset the interest rate every six months. EÅectiveDecember 21, 2005, the interest rate was set at 3.1%.
68. DMTN85: The Province entered into interest rate agreements that eÅectively converted the interestrate obligation on $1,310 million of this debt to a Ñxed rate of 3.85% and the balance of $300 millionto a Öoating one month CBA plus 0.05%.
69. Global NZD Bonds: The Province entered into currency exchange agreements that eÅectivelyconverted these New Zealand dollar obligations to Canadian dollar obligations at an exchange rateof 0.82457. In addition, the Province entered into interest rate agreements that eÅectively convertedthe interest rate obligation to a Ñxed rate of 4.57%.
62

PUBLIC ACCOUNTS, 2005-2006 Ì VOLUME 1
II. OUTSTANDING DEBT ISSUED Ì Continued
70. DMTN159: Bonds are extendible at the option of the Province on the initial maturity date ofOctober 31, 2007 and on each extended maturity date thereafter to Ñnal maturity date of October 31,2017. Interest is payable semi-annually at 4.0% in year 1-2 and 4.1% in year 3, 4.2% in year 4, 4.3%in year 5, 4.4% in year 6, 4.5% in year 7, 4.6% in year 8, 4.75% in year 9, 5.0% in year 10, 5.5% in year11 and 6.0% in Ñnal year. In addition, the Province entered into interest rate agreements thateÅectively converted the interest rate obligation to a Ñxed rate of 3.55%.
71. JE: During the Ñscal year 2005-06, the Province purchased $40 million of these bonds forcancellation at a premium of $22.5 million.
72. DMTN135: During the 2005-06 Ñscal year, Series DMTN135 was re-opened four times, bringing thetotal issue size to $2,500 million. Outstanding amount includes bonds held by Ontario StrategicInfrastructure Financing Authority of $67 million.
73. DMTN160: Bonds are extendible at the option of the Province on the initial maturity date ofNovember 4, 2007 and on each extended maturity date thereafter to Ñnal maturity date ofNovember 4, 2010. Interest is payable semi-annually at 3.7% in year 1-2 and 3.85% in year 3, 4.1% inyear 4, 4.5% in Ñnal year. In addition, the Province entered into interest rate agreements thateÅectively converted the interest rate obligation to a Ñxed rate of 3.55%.
74. EMTN56: During the Ñscal year 2005-06, the Province purchased $45 million of these bonds forcancellation.
75. DMTN91: Bonds were extended at the option of the Province on the initial maturity date ofJanuary 26, 2006, and are extendible on each extended maturity date thereafter to the Ñnal maturitydate of January 26, 2009. Interest is payable semi-annually at 3.75% in years 1-2, 3.90% and 4.05%for the two payments in year 3, 4.20% and 4.45% for the two payments in year 4, and 5.25% and6.00% for the two payments in the Ñnal year. In addition, the Province entered into interest rateagreements that eÅectively converted the interest rate obligation to a 3 month CBA minus 0.08%.
76. DMTN123: Bonds are extendible at the option of the Province on the initial maturity date ofOctober 1, 2006 and on each extended maturity date thereafter to the Ñnal maturity date ofOctober 1, 2010. Interest is payable semi-annually at 4.0% in year 1-2, 4.1% in year 3, 4.3% in year 4,4.9% in year 5, 5.75% in the Ñnal year. In addition, the Province entered into interest rate agreementsthat eÅectively converted the interest rate obligation on this debt to a Ñxed rate of 3.12%.
77. DMTN162: Bonds are extendible at the option of the Province on the initial maturity date ofDecember 7, 2007 and on each extended maturity date thereafter to Ñnal maturity date ofDecember 7, 2017. Interest is payable monthly at 4.2% in year 1-2 and 4.25% in year 3, 4.35% inyear 4, 4.45% in year 5, 4.5% in year 6, 4.6% in year 7, 4.7% in year 8, 4.85% in year 9, 5.0% in year10 and 5.25% in year 11 and 5.5% Ñnal year. In addition, the Province entered into interest rateagreements that eÅectively converted the interest rate obligation to a Ñxed rate of 4.31%.
78. DMTN98: Bonds were extended at the option of the Province on the initial maturity date ofFebruary 12, 2006 and are extendible on each extended maturity date thereafter to the Ñnal maturitydate of February 12, 2009. Interest is payable semi-annually at 3.25% in years 1-2, 3.40% and 3.60%for the two payments in year 3, 3.80% and 4.30% for the two payments in year 4, and 5.00% and6.00% for the two payments in the Ñnal year. In addition, the Province entered into interest rateagreements that eÅectively converted the interest rate obligation to a 3 month CBA minus 0.08%.
79. EMTN34: Proceeds of issue and repayment of principal are in Japanese yen. Interest is payable inU.S. dollars annually based on a notional principal of USD 86.3 million at 3.58%. In addition, theProvince entered into interest rate agreements that eÅectively converted the interest rate obligationto a Ñxed rate of 6.35%.
80. EMTN36: Proceeds of issue and repayment of principal are in Japanese yen. Interest is payable inUS dollars semi-annually based on a notional principal of USD 57.1 million at 2.6%. In addition, the
63

PUBLIC ACCOUNTS, 2005-2006 Ì VOLUME 1
II. OUTSTANDING DEBT ISSUED Ì Continued
Province entered into interest rate agreements that eÅectively converted the interest rate obligationto a Ñxed rate of 5.57%.
81. DMTN139: Bonds are extendible at the option of the Province on the initial maturity date ofFebruary 25, 2007 and on each extended maturity date thereafter to the Ñnal maturity date ofFebruary 25, 2010. Interest is payable annually at 3.25% in year 1-2, 3.6% in year 3, 4.25% in year 4,and 5.0% in the Ñnal year. In addition, the Province entered into interest rate agreements thateÅectively converted the interest rate obligation on this debt to a Ñxed rate of 3.42%.
82. DMTN87: During the 2005-06 Ñscal year, Series DMTN87 was re-opened once, bringing the totalissue size to $750 million.
83. Total Debt Issued for Provincial Purposes after consolidation and other adjustments include thefollowing debt issued by other government organizations: $2,106.1 million by Ontario HousingCorporation, $79 million by Ontario Municipal Improvement Corporation, $387.2 million by TorontoArea Transit Operating Authority (GO Transit), $1,323.4 million by Ontario Strategic InfrastructureFinancing Authority and debt of Royal Ontario Museum of $52 million and oÅset by elimination ofOntario Housing Corporation's debt of $1,157.2 million and Ontario Treasury Bills and Bonds heldby other organizations and agencies of $758.7 million.
84. The Treasury Bills balance includes the following Treasury Bills holdings by governmentorganizations: $192 million held by the Northern Ontario Heritage Fund Corporation, $102 millionheld by Ontario Trillium Foundation, $69 million held by Ontario Reality Corporation, $33 million heldby Ontario Securities Commission and $38 million held by Ministry of Health & Long Term Care.
85. DMTN118: Bonds are extendible at the option of the Province on the initial maturity date ofSeptember 7, 2006 and on each extended maturity date thereafter to the Ñnal maturity date ofSeptember 7, 2011. Interest is payable semi-annually at 4.1% in year 1-2, 4.25% in year 3, 4.6% inyear 4, 4.85% in year 5, 5.0% in year 6 and 6.0% in the Ñnal year. In addition, the Province enteredinto interest rate agreements that eÅectively converted the interest rate obligation on this debt to aÑxed rate of 3.11%.
86. DMTN124: The Province entered into interest rate agreements that eÅectively converted the interestrate obligation on this debt to a Ñxed rate of 3.31%.
87. DMTN101: Bonds were extended at the option of the Province on the initial maturity date ofMarch 19, 2006, and are extendible on each extended maturity date thereafter to the Ñnal maturitydate of March 19, 2011. Interest is payable monthly at 3.25% in years 1-2, 3.30% in year 3, 3.90% inyear 4, 5.00% in year 5, 5.40% in year 6, and 6.35% in the Ñnal year. In addition, the Province enteredinto interest rate agreements that eÅectively converted the interest rate obligation to a 3 month CBAminus 0.09%.
88. NW (OEFC): Bonds are callable in full but not in part at the option of the Province on September 7,2006 and every six months thereafter to Ñnal maturity date of March 28, 2008.
89. DMTN106: During the 2005-06 Ñscal year, Series DMTN106 was re-opened once, bringing the totalissue size to $1,250 million including $500 million for OEFC.
90. MH: The terms of these debentures require that a special one-time interest payment of $31.1 millionbe made at maturity.
91. U.S. Commercial Paper issues are non-interest bearing with maturities up to 92 days.
92. DMTN140: During Ñscal year 2005-06, Series DMTN140 was re-opened six times, bringing the totalissue size to $428 million, including $29 million for OEFC.
93. Global USD Bonds (OEFC): The Province entered into currency exchange agreements thateÅectively converted these U.S. dollar obligations to Canadian dollar obligations at an exchangerate of 1.34532. In addition, the Province entered into interest rate agreements that eÅectively
64
PUBLIC ACCOUNTS, 2005-2006 Ì VOLUME 1
II. OUTSTANDING DEBT ISSUED Ì Continued
converted the interest rate obligations on $1,746 million of these debt to a Ñxed rate of 4.63%and $339 million to a Öoating three month U.S. LIBOR rate minus 0.1%.
94. DMTN44: During the 2005-06 Ñscal year, Series DMTN44 was re-opened once, bringing the totalissue size to $100 million.
95. DMTN24: Bonds were extended at the option of the bond holders on the initial maturity date ofNovember 20, 2002, and are extendible annually on each extended maturity date thereafter to theÑnal maturity date of February 20, 2007. Interest is payable quarterly at a three-month Canadian BArate minus 0.05% in year 1, three-month Canadian BA rate minus 0.01% in year 2, three-monthCanadian BA rate plus 0.03% in year 3, three-month Canadian BA rate plus 0.05% in year 4, andthree-month Canadian BA rate plus 0.07% for the remaining term.
96. HJ: Outstanding amounts include bonds held by Agricorp, a government organization, of $6.8 millionin Series HJ.
97. DMTN08: Outstanding amount includes bonds held by government organizations: Legal Aid of$0.6 million and Agricorp of $9 million.
98. DMTN46: This is a variable payment, zero coupon bond with a yield of 4.53%.
99. DMTN125: Bonds are extendible at the option of the Province on the initial maturity date ofOctober 27, 2006 and on each extended maturity date thereafter to the Ñnal maturity date ofOctober 27, 2014. Interest is payable semi-annually at 4.45% in year 1-2, 4.55% in year 3, 4.65% inyear 4, 4.75% in year 5, 4.85% in year 6, 5.0% in year 7, 5.25% in year 8, 6.0% in year 9 and 7.0% inthe Ñnal year. In addition, the Province entered into interest rate agreements that eÅectivelyconverted the interest rate obligation on this debt to a Ñxed rate of 3.14%.
100. DMTN114: Bonds are extendible at the option of the Province on the initial maturity date of July 7,2006 and on each extended maturity date thereafter to the Ñnal maturity date of July 7, 2009.Interest is payable annually at 4.2% in year 1-2, 4.55% in year 3, 5.0% in year 4, and 5.5% in the Ñnalyear. In addition, the Province entered into interest rate agreements that eÅectively converted theinterest rate obligation on this debt to a Ñxed rate of 3.18%.
101. DMTN103: Bonds were extended at the option of the Province on the initial maturity date ofMarch 26, 2006, and are extendible on each extended maturity date thereafter to the Ñnal maturitydate of March 26, 2014. Interest is payable semi-annually at 4.00% in years 1-2, 4.10% in year 3,4.15% in year 4, 4.30% in year 5, 4.50% in year 6, 4.75% in year 7, 5.00% in year 8, 5.25% in year 9,and 5.75% in the Ñnal year. In addition, the Province entered into interest rate agreements thateÅectively converted the interest rate obligation to a 3 month CBA minus 0.07%.
102. DMTN115: Bonds are extendible at the option of the Province on the initial maturity date of July 2,2006 and on each extended maturity date thereafter to the Ñnal maturity date of July 2, 2010.Interest is payable semi-annually at 4.35% in year 1-2, 4.6% in year 3, 5.0% in year 4, 5.25% in year 5and 5.75% in the Ñnal year. In addition, the Province entered into interest rate agreements thateÅectively converted the interest rate obligation on this debt to a rate of 3.18%.
103. DMTN90: The Province entered into interest rate agreements that eÅectively converted the interestrate obligation to a Ñxed rate of 3.71%.
104. DMTN97: The Province entered into interest rate agreements that eÅectively converted the interestrate obligation to a Ñxed rate of 3.28%.
105. DMTN163: Total issue size is $500 million, including $250 million for OEFC.
106. DMTN96: The Province entered into interest rate agreements that eÅectively converted the interestrate obligation to a Ñxed rate of 3.37%.
107. DMTN85: Total outstanding amount is $2,346 million, including $736 million for OEFC. During theÑscal year 2005-06, the Province repurchased $250 million of these bonds for cancellation.
108. DMTN142: Interest is capped at 5.0%.
65

PUBLIC ACCOUNTS, 2005-2006 Ì VOLUME 1
II. OUTSTANDING DEBT ISSUED Ì Continued
109. DMTN93: Total issue size is $3,500 million, including $1,000 million for OEFC. Outstanding amountincludes bonds held by Ontario Strategic Infrastructure Financing Authority of $250 million.
110. DMTN30: Bonds were extended at the option of the bond holders on the initial maturity date ofDecember 5, 2002, and are extendible annually on each extended maturity date to the Ñnal maturitydate of December 5, 2008. Interest is payable quarterly at a three-month Canadian BA rate minus0.05% in year 1, minus 0.01% in year 2, plus 0.03% in year 3, plus 0.05% in year 4, plus 0.07% inyear 5, and plus 0.08% in the Ñnal two years.
111. NK: Outstanding amount includes bonds held by Agricorp, a government organization, of $11 millionin Series NK.
112. EMTN AUD Bonds (OEFC): The Province entered into exchange rate agreement that eÅectivelyconverted these Australian dollar obligations to Canadian dollar obligations at an exchange rate of0.93634. In addition, the Province entered into interest rate agreement that eÅectively converted theinterest rate obligation of this debt to a Ñxed rate of 4.20%.
113. DMTN122: The Province entered into interest rate agreements that eÅectively converted the interestrate obligation on this debt to a Ñxed rate of 3.28%.
114. EMTN65: The Province entered into currency exchange agreements that eÅectively converted thesepound sterling obligations to Canadian dollar obligations at an exchange rate of 2.37714. In addition,the Province entered into interest rate agreements that eÅectively converted the interest rateobligation on this debt to a Ñxed rate of 4.30%.
115. DMTN110: Bonds are retractable at the option of the holders on March 8, 2012 or exchangeable atpar on March 21, 2012 for the Series DMTN61 maturing on March 8, 2033. Interest is payable semi-annually at 3.25% until March 8, 2012 and 5.85% to March 8, 2033. In addition, the Province enteredinto interest rate agreements that eÅectively converted the interest rate obligation to a rate of 5.72%.
116. EMTN75 (OEFC): The Province entered into exchange rate agreements that eÅectively convertedthis South African rand obligation to Canadian dollar obligations at an exchange rate of $0.17556. Inaddition, the Province entered into interest rate agreements that eÅectively converted the interestrate obligation of this debt to a Ñxed rate of 4.72%.
117. EMTN AUD Bonds: The Province entered into currency exchange agreements that eÅectivelyconverted these Australian dollar obligations to Canadian dollar obligations at an exchange rate of0.7800. In addition, the Province entered into interest rate agreements that eÅectively converted theinterest rate obligation to a Ñxed rate of 5.13%.
118. EMTN35: The amount outstanding in legacy currency is French francs 3 billion. The French francwas converted to euro using conversion rate of one euro equals: 6.55957 French francs inaccordance with Council Regulation (EU) No. 2866/98. In addition, the Province entered intointerest rate agreements that eÅectively converted the interest rate obligation to a rate of 5.65%.
119. NZ: The Province entered into currency exchange agreements that eÅectively converted this euroobligation to Canadian dollar obligation at an exchange rate of 1.58460. In addition, the Provinceentered into interest rate agreements that eÅectively converted the interest rate obligation to a Ñxedrate of 5.23%.
120. DMTN121: Bonds are extendible at the option of the Province on the initial maturity date ofSeptember 20, 2006 and on each extended maturity date thereafter to the Ñnal maturity date ofSeptember 20, 2011. Interest is payable semi-annually at 4.15% in year 1-2, 4.25% in year 3, 4.4% inyear 4, 4.6% in year 5, 4.90% in year 6 and 6.0% in the Ñnal year. In addition, the Province enteredinto interest rate agreements that eÅectively converted the interest rate obligation on this debt to aÑxed rate of 3.12%.
121. KD: The amount outstanding in legacy currency is French francs 3 billion. The French franc wasconverted to euro using conversion rate of one euro equals: 6.55957 French francs in accordance
66
PUBLIC ACCOUNTS, 2005-2006 Ì VOLUME 1
II. OUTSTANDING DEBT ISSUED Ì Continued
with Council Regulation (EU) No. 2866/98. In addition, the Province entered into interest rateagreements that eÅectively converted the interest rate obligation to a Ñxed rate of 6.61%.
122. ND: The Province entered into currency exchange agreements that eÅectively converted 10 billion ofthese Japanese yen obligations to Canadian dollar obligations at an exchange rate of 0.012099. Inaddition, the Province entered into interest rate agreements that eÅectively converted the interestrate obligation on $121 million of this debt to a Ñxed rate of 6.49%; the remaining debt of $397 millionis at a coupon rate of 1.88%.
123. OIIC: These are zero coupon bonds. Outstanding amount represents the amount payable atmaturity.
124. DMTN99: Principal and interest are repayable in semi-annual instalments of $89.9 million startingfrom August 13, 2004. The total outstanding debt is $590.8 million, including $492.3 million forOEFC. The Province entered into interest rate agreements that eÅectively converted the interestrate obligation to a Ñxed rate of 3.32% on $492.3 million for OEFC and the remaining $98.5 million toa rate of 3.08%. Outstanding amount includes bonds held by government organizations, Legal Aid, agovernment organization, of $3.7 million and by Cancer Care Society of $1.3 million, inSeries DMTN99.
125. EMTN72: The Province entered into currency exchange agreements that eÅectively converted thisNew Zealand dollar obligation to Canadian dollar obligation at an exchange rate of 0.79730. Inaddition, the Province entered into interest rate agreements that eÅectively converted the interestrate obligation to Ñxed rate of 4.24%.
126. EMTN71: The Province entered into currency exchange agreements that eÅectively converted thisSouth African rand obligation to Canadian dollar obligation at an exchange rate of 0.18027. Inaddition, the Province entered into interest rate agreements that eÅectively converted the interestrate obligation to a Ñxed rate 4.20%.
127. DMTN117: Bonds were issued at a premium of $47.5 million.
128. DMTN102: Bonds are extendible at the option of the bond holders on March 8, 2009 to the Ñnalmaturity date of March 8, 2033. In addition, the bond holders have the option to exchange this bondfor DMTN61 on March 18, 2009. Interest is payable semi-annually at 3.0% until March 8, 2009 and5.85%, thereafter if extended. In addition, the Province entered into interest rate agreement thateÅectively converted the interest rate obligation to a rate of 4.25%.
129. DMTN120 (OEFC): The Province entered into exchange rate agreement that eÅectively convertedthese U.S. dollar obligations to Canadian dollar obligations at an exchange rate of 1.289. In addition,the Province entered into interest rate agreement that eÅectively converted the interest rateobligation of this debt to a Ñxed rate of 3.30%.
130. LE: Outstanding amount includes bonds held by Agricorp, a government organization, of $15 million.The Province entered into interest rate agreements that eÅectively converted the interest rateobligation on $100 million of this debt to a three-month Canadian BA rate minus 0.125%.
131. Europe CHF Bonds: The Province entered into currency exchange agreements that eÅectivelyconverted 625 million of these Swiss franc obligations to Canadian dollar obligations at an exchangerate of 0.98895. In addition, the Province entered into interest rate agreements that eÅectivelyconverted $596 million of the interest rate obligations to a Ñxed rate of 4.14%.
132. DMTN108: Bonds are extendible at the option of the Province on the initial maturity date of May 3,2006 and on each extended maturity date thereafter to the Ñnal maturity date of May 3, 2010.Interest is payable semi-annually at 3.5% in year 1-2, 3.75% in year 3, 4.25% in year 4, 5.5% in year 5and 6.75% in the Ñnal year. In addition, the Province entered into interest rate agreements thateÅectively converted the interest rate obligation on this debt to a Ñxed rate of 2.71%.
67

PUBLIC ACCOUNTS, 2005-2006 Ì VOLUME 1
II. OUTSTANDING DEBT ISSUED Ì Concluded
133. DMTN107: Bonds are extendible at the option of the Province on the initial maturity date of May 5,2006 and on each extended maturity date thereafter to the Ñnal maturity date of May 5, 2011.Interest is payable semi-annually at 4.0% in year 1-2, 4.15% in year 3, 4.25% in year 4, 4.75% in year5 and 5.0% in year 6 and 6.0% in the Ñnal year. In addition, the Province entered into interest rateagreements that eÅectively converted the interest rate obligation on this debt to a Ñxed rate of2.66%.
134. OHC: Debentures issued to Ontario Housing Corporation (OHC) are not negotiable and nottransferable or assignable but are redeemable in whole of in part at the option of the OHC, on sixmonths prior written notice.
68

PUBLIC ACCOUNTS, 2005-2006 Ì VOLUME 1
III. CONTINGENT LIABILITIES Ì OBLIGATIONS GUARANTEED BYTHE PROVINCE OF ONTARIO
For the year ended March 31, 2006
LOANS GUARANTEED
Year of Rate of OutstandingIssue Interest March 31, 2006 References
% $
MINISTRY OF AGRICULTURE AND FOODCommodity Loan Guarantee Program ÏÏÏÏÏÏÏÏÏ 2005-06 Various 9,222,907 (1)Feeder Cattle Loan Guarantee Program ÏÏÏÏÏÏÏ 2005-06 Various 8,617,524FarmPlus Rural Loan Pool ProgramÏÏÏÏÏÏÏÏÏÏÏ 2005-06 Various 7,862,541 (2)
TOTAL MINISTRY OF AGRICULTURE AND FOOD ÏÏÏÏÏÏÏÏÏÏÏÏÏÏÏÏÏÏÏ 25,702,972
MINISTRY OF COMMUNITY AND SOCIAL SERVICESOntario College of Social Workers and Social
Service Workers ÏÏÏÏÏÏÏÏÏÏÏÏÏÏÏÏÏÏÏÏÏÏÏÏÏÏ 1999 Prime-0.6 3,100,000 (3)
TOTAL MINISTRY OF COMMUNITY AND SOCIAL SERVICES ÏÏÏÏÏÏÏÏ 3,100,000
MINISTRY OF ECONOMIC DEVELOPMENT AND TRADEThe Development Corporations Act
Total guarantees re various companies ÏÏÏÏÏ Various Prime°1 165,116Youth Entrepreneurs Program ÏÏÏÏÏÏÏÏÏÏÏÏÏÏÏÏ 2001-05 Prime°1 1,839,623
TOTAL MINISTRY OF ECONOMIC DEVELOPMENT AND TRADE ÏÏÏÏÏ 2,004,739
MANAGEMENT BOARD SECRETARIATBank of Montreal Ì Employee Corporate
Travel Cards ÏÏÏÏÏÏÏÏÏÏÏÏÏÏÏÏÏÏÏÏÏÏÏÏÏÏÏÏÏÏ 2006 N/A 5,000,000Mortgage Guarantees Dissolution of Ontario
Land CorporationÏÏÏÏÏÏÏÏÏÏÏÏÏÏÏÏÏÏÏÏÏÏÏÏÏÏ 1971-76 N/A 24,858 (4)
TOTAL MANAGEMENT BOARD SECRETARIAT ÏÏÏÏÏÏÏÏÏÏÏÏÏÏÏÏÏÏÏÏÏ 5,024,858
MINISTRY OF MUNICIPAL AFFAIRS AND HOUSINGOntario Housing Corporation ""Homes Now''
Mortgage Financing ProgramÏÏÏÏÏÏÏÏÏÏÏÏÏÏÏ 1989 Various 166,127,703 (5)
TOTAL MINISTRY OF MUNICIPAL AFFAIRS AND HOUSING ÏÏÏÏÏÏÏÏÏ 166,127,703
MINISTRY OF NATURAL RESOURCESFreshwater Fish Marketing Corporation ÏÏÏÏÏÏÏ 1969 Variable 1,000,000
Fibratech Manufacturing, Inc. ÏÏÏÏÏÏÏÏÏÏÏÏÏÏÏÏ 2005 7% 2,000,000
TOTAL MINISTRY OF NATURAL RESOURCES ÏÏÏÏÏÏÏÏÏÏÏÏÏÏÏÏÏÏÏÏÏÏ 3,000,000
MINISTRY OF NORTHERN DEVELOPMENT AND MINESAlgoma Central RailwayÏÏÏÏÏÏÏÏÏÏÏÏÏÏÏÏÏÏÏÏÏÏ 1995 N/A 3,800,000
TOTAL MINISTRY OF NORTHERN DEVELOPMENT AND MINES ÏÏÏÏÏÏÏÏÏ 3,800,000
MINISTRY OF TRAINING, COLLEGES AND UNIVERSITIESOntario Student Loan Plan:Class ""A'' ÏÏÏÏÏÏÏÏÏÏÏÏÏÏÏÏÏÏÏÏÏÏÏÏÏÏÏÏÏÏÏÏÏÏ Various Prime 775,942,238Class ""B'' ÏÏÏÏÏÏÏÏÏÏÏÏÏÏÏÏÏÏÏÏÏÏÏÏÏÏÏÏÏÏÏÏÏÏ Various Prime°1 75,810,384Class ""C'' ÏÏÏÏÏÏÏÏÏÏÏÏÏÏÏÏÏÏÏÏÏÏÏÏÏÏÏÏÏÏÏÏÏÏ Various Prime°1 867,797,776
TOTAL MINISTRY OF TRAINING, COLLEGES AND UNIVERSITIESÏÏÏÏÏÏÏÏ 1,719,550,398
TOTAL LOANS GUARANTEED ÏÏÏÏÏÏÏÏÏÏÏÏÏÏÏÏÏÏÏÏÏÏÏÏÏÏÏÏÏÏÏÏÏÏÏÏÏÏÏÏÏ 1,928,310,670
69

PUBLIC ACCOUNTS, 2005-2006 Ì VOLUME 1
III. CONTINGENT LIABILITIES Ì OBLIGATIONS GUARANTEED BYTHE PROVINCE OF ONTARIO Ì Continued
Year of Rate of OutstandingIssue Interest March 31, 2006 References
% $
OTHERMINISTRY OF FINANCE
GO Transit ReÑnancing (TATOA) ÏÏÏÏÏÏÏÏÏÏÏÏ 1994 N/A 387,292,854 (6)Deposit Insurance Corporation of Ontario ÏÏÏÏÏ 2004 N/A 10,000,000 (9)Ontario Municipal Improvement Corporation ÏÏÏ 1991 N/A 79,021,000 (7)Loan Facility by Woodslee Credit Union loan
from Pelee Island Co-operative Association 2005 N/A 600,000 (10)Former Province of Ontario Savings OÇce
(POSO) Ì Term Deposits ÏÏÏÏÏÏÏÏÏÏÏÏÏÏÏÏÏ 2003 N/A 215,095,378 (8)
TOTAL MINISTRY OF FINANCE ÏÏÏÏÏÏÏÏÏÏÏÏÏÏÏÏÏÏÏÏÏÏÏÏÏÏÏÏÏÏÏÏÏÏÏÏ 692,009,232
TOTAL OTHERÏÏÏÏÏÏÏÏÏÏÏÏÏÏÏÏÏÏÏÏÏÏÏÏÏÏÏÏÏÏÏÏÏÏÏÏÏÏÏÏÏÏÏÏÏÏÏÏÏÏÏÏ 692,009,232
TOTAL CONTINGENT LIABILITIES ÏÏÏÏÏÏÏÏÏÏÏÏÏÏÏÏÏÏÏÏÏÏÏÏÏÏÏÏÏÏÏÏÏ 2,620,319,902
70
PUBLIC ACCOUNTS, 2005-2006 Ì VOLUME 1
III. CONTINGENT LIABILITIES Ì OBLIGATIONS GUARANTEED BYTHE PROVINCE OF ONTARIO Ì Concluded
For the year ended March 31, 2006
References:
1. The Province's maximum liability for the program is $200,000,000.
2. The Province's maximum liability for the program is $50,000,000.
3. Amount represents loan guarantee for the Ontario College of Social Workers and Social ServiceWorkers from the Royal Bank of Canada up to $3,100,000 for a period ending December 31, 2006.
4. The Ministry of Finance assumed the contingent liability arising from the Mortgage Guaranty Fund ofthe Ontario Land Corporation, which was dissolved on March 31, 1987.
5. Loans totaling $1,323 million taken by OHC for ""Homes Now'' from the Federal Government's CPPallotment have been guaranteed by the Province. Starting 1993, most of these loans, except forloans related to Student Housing ($166,127,703), were reÑnanced by the private sector and fundsrealized were loaned to the Ministry of Finance. The Ministry of Finance will report its loan of$1,157 million as a liability therefore this should be excluded from the guarantee amount.
6. The Province has entered into a sale and conditional sale-back arrangement of GO Transit withAsset Finance Bermuda Limited. The deal provided the Province with about $431 million in the initialÑscal year 1993-94 with an option of additional borrowing and to repay in year 2006. GO Transit willmaintain control over its assets and operations and provision will be made within twelve years tobuy back the asset.
7. In accordance with the Capital Investment Plan Act, 1993, the Ontario Municipal ImprovementCorporation's (OMIC) assets and liabilities were transferred to the Ontario Financing Authority(OFA) on November 15, 1993. OMIC received loans from the Canada Pension Plan (CPP) and theProvince, which OMIC used to make loans to municipalities and school boards under similar termsas its debt.
8. Upon the sale of the former Province of Ontario Savings OÇce (POSO) to Desjardins Credit Unionon March 31, 2003, the Province provided a maximum Ñve year guarantee up to March 31, 2008 forPOSO term deposits (principal and interest) purchased up to March 31, 2003. The remainingoutstanding amount of term deposits, guaranteed as at March 31, 2006 is $215 million.
9. The Province has guaranteed the repayment of revolving credit facility made by Canadian ImperialBank of Commerce to the Deposit Insurance Corporation of Ontario (DICO) for a period beginningJanuary 1, 2006 and ending December 31, 2006. The maximum amount guaranteed is $10 millionincluding interest, costs and expenses thereon. DICO will pay the Province a guarantee fee of0.005% of credit facility plus 0.05% of actual borrowings.
10. The Province has guaranteed the repayment of loan facility made by Woodslee Credit Union Limitedto Pelee Island Cooperative Association for a period beginning October 6, 2005 ending October 5,2020. The maximum amount guaranteed is $0.6 million including interest, costs and expensesthereon.
71
PUBLIC ACCOUNTS, 2005-2006 Ì VOLUME 1
IV. CLAIMS AGAINST THE CROWN
As at March 31, 2006
The following are claims arising from legal action either in progress or threatened against the Crownin respect of breach of contract, damages to persons and property and like items. The amounts claimedhave not been speciÑed, but in each case are expected to exceed $50 million.
1. Dudley Abbot et al. (preferred shareholders of Crown Trust) v. HMQRO.
2. Theriault in respect of mining leases to Hemlo Gold Mines v. HMQRO.
3. Chiefs of Ontario v. HMQRO.
4. Mary Lou LaPratte, Roland LaPratte, Sheila Horrell, Arthur Horrell et al v. HMQRO.
5. Monaghan, John Richard v. HMQRO.
6. Alberto Docouto v. HMQRO.
7. Vance Hamilton Egglestone v. HMQRO, Barker and Maier.
8. Arnold Guettler, Neo-Form Corporation and Neo-Form North America Corporation v. HMQRO et al.
9. R. Shawn A. Cantlon v. HMQRO.
10. Anne and Alexander Larcade v. HMQRO.
11. Pearson v. Inco Ltd., HMQRO.
12. Timothy Natyshak v. HMQRO et al.
13. Ayok, Chol v. York University.
14. Frank Defazio, et al. v. HMQRO, Toronto Transit Commission, Pinchen Environmental Consultants,et al.
15. Dumoulin v. Ontario Realty Corporation and HMQRO.
16. Adrian, Shirley et al. v. HMQRC and HMQRO.
17. Palahnuk, Robert E. v. HMQRO.
18. Deutsch, Melvin P. v. HMQRO.
19. Augier, Gideon McGuire v. HMQRO.
20. Mortune, Felicia v. HMQRO.
21. Deep, Dr. Albert Ross v. HMQRO.
22. Mastronardi, Giovanna v. HMQRO.
23. Koumoundouros, Terry v. HMQRO.
24. General Motors Corporation v. HMQRO.
25. West Nile Virus v. HMQRO.
26. Adam's Mine Rail Haul v. HMQRO.
27. Twain, Jim Chief v. HMQRO.
28. Aylmer Meat Packers Inc. v. HMQRO.
29. Williams Andrea v. HMQRO.
30. OÇce & Professional Employees International Union and Ontario Public Service Employees'Union v. HMQRO.
31. Harrison, John Arthur v. HMQRO.
32. Benjamin, Candice Dr. v. HMQRO.
33. Whole World Trade Ltd. v. HMQRO.
34. Shokri-Razghi, Sarah v. HMQRO.
35. Sarazin, Daniel Lynden v. HMQRO.
36. Wong, Anthony v. HMQRO.
37. Pre-1986, Post 1990 Hepatitis C Claims Ì Compensation to victims of hepatitis C blood.
72

PUBLIC ACCOUNTS, 2005-2006 Ì VOLUME 1
IV. CLAIMS AGAINST THE CROWN Ì Continued
38. Foster, Tracey Marie v. HMQRO.
39. Brown, Vincent v. HMQRO.
40. Zoran Djuric v. HMQRO.
41. Glover, Gerald Clayton v. HMQRO.
42. Phaneuf, Sylvie v. HMQRO.
43. Abou-Elmaati, Ahmad v. HMQRO.
44. Bett, L. Brenda & Wells, C. Thomas v. HMQRO.
45. Robyn Wynberg et al. v. HMQRO.
46. Hamilton Kilty Hockey Club Inc. v. HMQRO.
47. Peter Fallis v. HMQRO.
48. Robert Fenn v. HMQRO.
49. Hartley, Mason v. HMQRO.
50. Rigillio v. Ontario v. HMQRO.
51. Kam-Tim Tong and Chatterjee et al. v. HMQRO.
52. Sagharian v. Ontario, Ministries of Education, Community & Social Services, Children & YouthServices and Ministry of Health & Long-Term Care.
53. Anderlis Leasing Enterprises et al. v. HMQRO.
54. Northern Diamond Gaming Services Limited and Diamond Gaming Services Inc. et al v. HMQRO.
55. First Class Casinos and Mr. Casino Inc. v. HMQRO.
56. 1191067 Ontario Inc., Silvo Di Gregorio and Tom Jones v. HMQRO.
57. The Chippewas of Sarnia, the Chippewas of Kettle Point et al. v. HMQRO, Polysar HydrocarbonsLimited et al.
58. Roy Michano et al., for themselves and on behalf of the members of the Pic Heron Bay, Pays Plat,Rocky Bay, Whitesand, Pic Mobert, Red Rock, Sand Point and Long Lake No. 58 Bands ofIndians v. HMQRO.
59. CliÅord Meness et al., for themselves and all other members of the Algonquins of Golden Lake Bandof Indians v. HMQRO.
60. Roger Southwind on behalf of the Lac Seul Indian Band v. HMQRO.
61. Moose Factory First Nation et al. v. Spruce Falls Power and Paper Company Limited.
62. New Post First Nation et al. v. Spruce Falls Power and Paper Company Limited.
63. Beaver House First Nation v. HMQRO.
64. The Chippewas of Saugeen and Nawash First Nations regarding Bruce Peninsula v. HMQRO.
65. Missanabie Cree First Nation v. HMQRO and HMQRC.
66. Chapleau Cree v. HMQRO.
67. Six Nations of the Grand River Band v. HMQRO.
68. Mishkeegogamang First Nation and seventeen others v. HMQRO.
69. Wikwemikong Indian Band v. HMQRO.
70. Chippewas of Sarnia Band v. HMQRO.
71. Mississauga of Alderville, Beausoleil, Chippewas of Georgia Island, Mnjikaning (Rama), CurveLake Hiawatha, and Scugog Island First Nation v. HMQRO.
72. Wesley Big George on behalf of seven Lake of the Woods First Nations v. HMQRO.
73. Big Grassy (Mishkosiimiiniiziibing) First Nation and Ojibways of Onigaming First Nations adjacentto the Lake of the Woods and Winnipeg River area who are signatories to Treaty 3 v. HMQRO.
73

PUBLIC ACCOUNTS, 2005-2006 Ì VOLUME 1
IV. CLAIMS AGAINST THE CROWN Ì Concluded
74. Wauzhushk Onigum First Nation and Ochiichagwe'babig o'ining First Nation and Washagamis BayFirst Nations v. HMQRO.
75. Walpole Island First Nations v. HMQRO.
76. The Begetikong Anishnabe First Nation (aka the Ojibways of Pic River) Chief Roy Michano,Councillor Duncan Michano and Councillor Arthur H. Fisher v. HMQRO.
77. Whitesand First Nation v. HMQRO.
78. Red Rock First Nation v. HMQRO.
79. Moose Deer Point First Nation v. HMQRO.
80. Kinew, Tobasonakwut v. HMQRC and HMQRO.
81. Garden River First Nation Reserve No. 14 v. HMQRO.
82. Mushkegouk Council (Onasburgh) v. HMQRO.
83. Kakeway, George v. HMQRO.
84. Sinclare, Alfred v. HMQRO.
85. Samson Indian Band and Nation v. HMQRO.
86. Long Lake No. 58 First Nation v. HMQRO.
74

O
PRINTED IN CANADAO34129


![[Exhibit A] [Exhibit B]. [Exhibit D] [Exhibit F]](https://img.dokumen.tips/doc/110x75/6294402616e6d749834caeff/exhibit-a-exhibit-b-exhibit-d-exhibit-f.jpg)


