Embed Size (px)
Citation preview

Exhibit 99.1
MANAGEMENT’S DISCUSSION AND ANALYSIS OF
OPERATIONS AND FINANCIAL CONDITION
FOR THE SIX MONTHS ENDED JUNE 30, 2014
TABLE OF CONTENTS Page 1. Core Business 1 2. Highlights 1 3. Outlook and Strategy 4 4. Summary of Financial and Operating Statistics 6 4.1: Financial Statistics 6 4.2: Operating Statistics 7 5. Overview of Results 8 5.1: Overview of Financial Results 8 5.2: Overview of Quarterly Operating Results 14 6. Operating Mines 17 7. Construction, Development and Exploration 27 8. Liquidity, Capital Resources and Contractual Commitments 29 9. Income Taxes 32 10. Economic Trends, Risks and Uncertainties 33 11. Contingencies 39 12. Critical Accounting Policies and Estimates 40 13. Non-GAAP Measures 41 14. Selected Quarterly Financial and Operating Summary 47 15. Disclosures Controls and Procedures 49

1
MANAGEMENT’S DISCUSSION AND ANALYSIS OF OPERATIONS AND FINANCIAL CONDITION (All figures are in United States Dollars unless otherwise specified and are in accordance with International Financial Reporting Standards as issued by the International Accounting Standards Board (“IFRS”). This Management’s Discussion and Analysis of Operations and Financial Condition should be read in conjunction with the Company’s most recently issued annual consolidated financial statements for the year ended December 31, 2013 ("Consolidated Annual Financial Statements"). Cautionary notes regarding forward-looking statements follow this Management’s Discussion and Analysis of Operations and Financial Condition. 1. CORE BUSINESS Yamana Gold Inc. (the “Company” or “Yamana”) is a Canadian-headquartered gold producer engaged in gold mining and related activities including exploration, extraction, processing and reclamation. The Company has significant precious metal properties and land positions throughout the Americas including in Brazil, Chile, Argentina, Mexico and Canada. The Company plans to continue to build on its current production base through existing operating mine expansions and development of new mines, advancement of its exploration properties and by targeting other gold consolidation opportunities with a primary focus in the Americas. Note 34(a) Related Parties to the most recently audited Consolidated Annual Financial Statements lists Yamana’s significant subsidiaries with 100% equity interest. The Company does not have any material off-balance sheet arrangements, except as noted in Note 32 Contractual Commitments to the Consolidated Annual Financial Statements. Yamana is listed on the Toronto Stock Exchange (Symbol: YRI) and the New York Stock Exchange (Symbol: AUY). 2. HIGHLIGHTS The Company’s focus continues to be on ensuring a balance between costs and production, margin preservation and on the generation and protection of cash flow. The Company continues to believe this balanced approach is appropriate and prudent to create value in the prevailing commodity price environment. Financial For the three months ended June 30, 2014
• Revenues of $450.8 million on the sale of 297,467 GEO and 28.7 million pounds of copper(a). • Net earnings of $5.1 million or $0.01 per share. • Adjusted earnings(b) of $43.3 million or $0.05 adjusted earnings per share(b). • Mine operating earnings of $74.8 million. • Cash flows from operating activities after changes in non-cash working capital of $148.5 million and cash flows from
operating activities before changes in non-cash working capital(a) of $144.8 million. Adjusted operating cash flows of $177.2 million.
• In June, the Company added another cornerstone asset, the Canadian Malartic mine located in Canada, through its agreement with Agnico Eagle Mines Limited ("Agnico") with whom it jointly acquired 100% of all issued and outstanding common shares (with each company owning 50%) of Osisko Mining Corporation ("Osisko"). Total consideration paid by the Company was $1.5 billion which consisted of approximately $0.5 billion in cash and $1.0 billion in Yamana shares.
• Issued $500 million of 4.95% Senior Debt Notes due July 15, 2024. The net proceeds from the offering were used to repay in full the Company's $500 million unsecured senior term loan due June 2016. The proceeds of the term loan were used to partly fund Yamana's joint acquisition of Osisko.
• Achieved two investment grade credit ratings and BB+ with a positive outlook from primary rating agencies. For the six months ended June 30, 2014
• Revenues of $804.7 million on the sale of 534,027 GEO and 54.0 million pounds of copper(a). • Net loss of $24.5 million or $0.03 per share. • Adjusted earnings(b) of $55.4 million or $0.07 adjusted earnings per share(b).

2
• Mine operating earnings of $107.9 million. • Cash flows from operating activities after changes in non-cash working capital of $187.5 million and cash flows from
operating activities before changes in non-cash working capital(a) of $238.5 million. Adjusted operating cash flows of $270.8 million. ________________________________________ (a) Excluding attributable sales from Alumbrera. (b) A non-GAAP measure - Refer to Section 13.
Operational For the three months ended June 30, 2014 • Production of 331,765 GEO and commercial production of 310,889 GEO. • Production more than 20% higher than the first quarter. Second quarter production from key assets including Chapada, El
Peñón, Gualcamayo, Mercedes and Canadian Malartic, were 30% higher than the first quarter. GEO production highlights included the following:
◦ Chapada - Production 40% higher than the first quarter; copper production 20% higher than the first quarter. ◦ El Peñón - Production more than 21% higher than the first quarter. ◦ Gualcamayo - Record production and over 37% higher than the first quarter. ◦ Canadian Malartic (acquired June 16, 2014) - attributable production of 11,878 gold ounces. ◦ Jacobina - Production over 26% higher than the first quarter.
• Production during the second quarter is summarized as follows:
For the three months ended
June 30, (In GEO) 2014 2013 Chapada (a) 30,418 26,525 El Peñón (a) 116,003 122,142 Gualcamayo 52,863 27,553 Mercedes (a) 24,671 39,226 Canadian Malartic (d) 11,878 n/a Minera Florida (a) 29,031 26,582 Jacobina 18,776 17,485 Other Producing Mines 27,249 28,278 Commissioning Mines (b) 20,876 7,754 Total 331,765 295,545
• Silver production of 2.4 million ounces. • Copper production from Chapada of 33.0 million pounds. • By-product cash costs(c) of $523 per GEO. Co-product cash costs(c) of $622 per GEO and $1.75 per pound of copper from
Chapada. Co-product cash costs from key assets of $545 per GEO decreased by 7% from the first quarter. • All-in sustaining cash costs(c) of $864 per GEO on a by-product basis and $915 per GEO on a co-product basis. All-in
sustaining cash costs from key assets of $650 per GEO on a by-product basis and $736 per GEO on a co-product basis. • All-in sustaining cash costs on a co-product basis were 9% below the first quarter from key assets. Furthermore, Jacobina
and Minera Florida also contributed to lower consolidated all-in sustaining co-product cash costs with a decrease of 6% from the first quarter.
For the six months ended June 30, 2014 • Production of 603,674 GEO and commercial production of 558,681 GEO. • Production during the first six months is summarized as follows:

3
For the six months ended
June 30, (In GEO) 2014 2013 Chapada (a) 52,128 49,884 El Peñón (a) 212,168 242,826 Gualcamayo 91,344 57,730 Mercedes (a) 50,130 75,801 Canadian Malartic (d) 11,878 n/a Minera Florida (a) 57,346 60,606 Jacobina 33,629 34,851 Other Producing Mines 50,058 53,297 Commissioning Mines (b) 44,993 11,863 Total 603,674 586,858
• Silver production of 4.5 million ounces. • Copper production from Chapada of 60.5 million pounds. • By-product cash costs(c) of $491 per GEO. Co-product cash costs(c) of $630 per GEO and $1.79 per pound of copper from
Chapada. By-product and Co-product cash costs from key assets of $422 per GEO and $563 per GEO, respectively. • All-in sustaining cash costs(c) of $844 per GEO on a by-product basis and $942 per GEO on a co-product basis. All-in
sustaining cash costs from key assets of $657 per GEO on a by-product basis and $767 per GEO on a co-product basis. ______________________________ (a) GEO assumes gold plus the gold equivalent of silver using a ratio of 50:1 for all periods presented. (b) Commissioning production as the mines are not yet in commercial operation. (c) A non-GAAP measure - refer to Section 13. (d) For the period from acquisition on June 16, 2014 to June 30, 2014.
Construction and Development
• Completion of the feasibility study for Cerro Moro with detailed engineering and pre-development work continuing towards
a planned construction decision later in 2014. Long-lead items have been identified. Suppliers for these items are being defined so that the Company's project team will be ready to commence procurement of these critical items upon a construction decision.
• Preparation of an application for an environmental impact study ("EIS") is underway for Suyai. The Company continues with community engagement to demonstrate the benefits of underground mining and offsite processing of ore.
• Continued with the installation of an in-pit crusher at Chapada to be completed in the third quarter. The in-pit crusher will allow throughput levels to be maintained as ore from Corpo Sul is introduced later this year. Pre-stripping at Corpo Sul has begun. Corpo Sul is expected to contribute to higher gold and copper grades.
Exploration
• Cerro Moro, Argentina — Mapping and sampling from the decline ramp and cross cuts of the Escondida fault and associated
veins, breccia, and stockwork systems, which began in the first quarter, was completed during the second quarter and as expected confirmed the values in the mineral resource and mineral reserve models.
• Gualcamayo, Argentina — The drill program to infill and extend mineralization as well as collect fresh sulfide material in the Rodado southwest mineral body was completed during the quarter. Once final assays are received metallurgical testing will begin on the samples.
• El Peñón, Chile — During the second quarter, exploration continued to infill drill the Providencia HW1, HW2 and HW3 cross-cutting structures with positive results. Other drill targets returning positive results include Borde Este, Bonanza Norte and Esmeralda, all exploration and mineral resource expansion related targets.
• Mercedes, Mexico — During the second quarter, exploration concentrated on surface drilling of new targets along the Mercedes to Marianas trend and collaring the first underground exploration holes in the Barrancas Gap area to more efficiently test the prospective structural trend. Early results are encouraging and step-out drilling has confirmed some veins along strike.
• Minera Florida, Chile — During the second quarter, the exploration focus continued to execute the mineral resource upgrade and mineral resource expansion programs in the Mina Este and surrounding target areas. Most holes encountered multiple intercepts of above cut-off grade mineralization that are currently being modeled and considered for mineral resource categorization. Surface mapping and sampling is continuing to support and generate near surface potential above the current mine footprint.

4
3. OUTLOOK AND STRATEGY The Company remains focused on containing costs, protecting and preserving margins and increasing production to generate, maximize and sustain cash flow. By focusing on approaches and measures that best contribute to cash flow generation, and by demonstrating strong financial performance driven from cash flow generation, the Company will deliver value to shareholders. The Company takes a portfolio approach to its assets and looks at internal and external opportunities to optimize its asset portfolio with the objective of cash flow generation and maximization and enhancing returns to shareholders. Consistent with this approach, the Company also focuses on increasing or enhancing returns on certain non-core assets with lower returns. The range of options the Company is evaluating includes operational improvement, whole or partial development, monetization and other strategic alternatives to increase cash return on invested capital. On June 16, 2014, the Company successfully added another high quality, high margin cornerstone asset, the Canadian Malartic mine ("Canadian Malartic"), along with prospective exploration assets to its portfolio through a joint acquisition with Agnico of Osisko. This transaction is in line with the Company’s goals of cash flow generation and maximization . Consistent with the Company's operating focus in the Americas, the joint operation provides the Company a low risk entry into Quebec and Ontario which are established mining friendly jurisdictions. It also firmly positions the Company as an Americas-based company with operations and opportunities not only in South America, which are the Company's roots, but also in North America. Canadian Malartic is expected to generate significant cash flow while continuing to be self-funding of its capital and other requirements. The acquisition provides significant mineral reserve growth and a large mineral resource base at higher average grades. The acquisition furthers the Company's goals of increasing returns to shareholders. Estimated production for Canadian Malartic is forecast to be 510,000 ounces to 530,000 ounces in 2014. Plans to increase future production are under review. Total cash costs for the full year of 2014 are forecast to be approximately $695 per ounce including the new 5% net smelter royalty ("NSR") payable to Osisko Gold Royalties Ltd. for the remainder of the year. Total cash costs are higher in the second half of 2014 largely due to the inclusion of the 5% NSR at approximately $65 per ounce per annum, higher operating costs of approximately C$11.7 million to accelerate the development of the Gouldie pit that will provide for future flexibility in production, higher drilling costs in the north part of the pit to further reduce noise and vibration for the surrounding community of approximately C$6.6 million, and increased cyanide consumption of approximately C$6.7 million as a result of mining in the north part of the pit. Total capital costs for 2014 are estimated at C$169 million including the acceleration of activities at the Gouldie pit to increase mining flexibility in the amount of C$13.0 million and additional capitalized stripping of C$12.0 million. A further C$9.0 million is committed to additional mining equipment that will add to the mining capacity of the operation. These capital expenditures will be fully funded by operating cash flow generated by the mine. The Company, jointly with its partner Agnico, believes that there is good potential to refine and improve the current Canadian Malartic mining operation. Studies are currently underway to fully explore opportunities for optimization of the asset. Potential initiatives include:
• Projects to improve the current crushing and grinding constraints. • The generation of additional ore stockpiles to support the increase in daily throughput through modifications to the
current crushing and grinding circuits. • Savings on procurement of consumables and equipment. • Improvement of drilling and blasting techniques in the open pit (fragmentation). • Reduction in contractor, exploration and head office general and administrative costs. Annual savings of
approximately C$12.0 to C$15.0 million are expected from Osisko's former head office. • Optimization of the mine plan.
Further details on the optimization plan will be presented at the end of the third quarter of 2014. Updated future guidance will be provided early in 2015. Additionally, details on a planned exploration program along with budgets and a strategic plan to develop the Kirkland Lake camp will be released later this fall. Overall, the Company's production for 2014 with production from Canadian Malartic is expected to be over 1.42 million ounces. This updates previous guidance provided in early 2014 and includes production from Canadian Malartic only since its acquisition. The Company has reduced its expectations for production from its commissioning mines in arriving at this guidance amount.

5
The number of ounces from commissioning mines is dependent on the timing of ramp-up and reduction of costs for these mines. The Company is evaluating its various options to determine how to better deliver value for the commissioning mines which may include a further reduction in production from its commissioning mines to balance costs and reduce losses. All-in sustaining cash costs (“AISC”) are expected to be between $825 and $875 per GEO on a by-product basis and $900 and $950 per GEO on a co-product basis. AISC on a by-product basis are calculated after by-product metal credits, which assume a price forecast for copper, the principal by-product produced by the Company, of $3.20 per pound.

6
4. SUMMARY OF FINANCIAL AND OPERATING STATISTICS 4.1 Financial Statistics For the three months ended For the six months ended Jun 30, 2014 Jun 30, 2013 Jun 30, 2014 Jun 30, 2013 Net earnings/(loss) per share attributable to Yamana Gold Inc. equity holders - basic and diluted $ 0.01
$ (0.01 ) $ (0.03 ) $ 0.13
Adjusted earnings per share (i) - basic and diluted $ 0.05 $ 0.07 $ 0.07 $ 0.22 Dividends declared per share $ 0.0375 $ 0.0650 $ 0.0750 $ 0.1300 Dividends paid per share $ 0.0375 $ 0.0650 $ 0.1025 $ 0.1300 Weighted average number of common shares outstanding - basic (in thousands) 772,565
752,533
763,014
752,433
Weighted average number of common shares outstanding - diluted (in thousands) 773,602
752,533
763,926
753,291
(In thousands of United States Dollars; unless otherwise noted) Net earnings/(loss) attributable to Yamana Gold Inc. equity holders $ 5,105
$ (7,898 ) $ (24,503 ) $ 94,197
Adjusted earnings (i) $ 43,306 $ 50,181 $ 55,407 $ 167,161 Revenues $ 450,832 $ 430,471 $ 804,748 $ 965,344 Mine operating earnings $ 74,807 $ 118,646 $ 107,908 $ 326,655 Cash flows from operating activities $ 148,503 $ 195,418 $ 187,480 $ 369,215 Cash flows from operating activities before changes in non-cash working capital (i) $ 144,838
$ 150,918
$ 238,460
$ 365,133
Cash flows used in investing activities $ (658,909 ) $ (304,092 ) $ (806,414 ) $ (581,272 ) Cash flows from financing activities $ 419,276 $ 250,089 $ 516,468 $ 344,440 Average realized gold price per ounce (ii) $ 1,292 $ 1,385 $ 1,293 $ 1,504 Average realized copper price per pound (ii) $ 3.11 $ 3.05 $ 3.18 $ 3.32 Average realized silver price per ounce (ii) $ 19.81 $ 22.55 $ 20.19 $ 26.62 Average market gold price per ounce (iii) $ 1,290 $ 1,417 $ 1,291 $ 1,524 Average market copper price per pound (iii) $ 3.08 $ 3.25 $ 3.14 $ 3.42 Average market silver price per ounce (iii) $ 19.66 $ 23.22 $ 20.05 $ 26.63
_____________________________ (i) A cautionary note regarding non-GAAP measures is included in Section 13 of this Management's Discussion and Analysis. (ii) Realized prices based on gross sales compared to market prices for metals may vary due to infrequent shipments and depending on timing of the
sales. (iii) Source of information: Bloomberg.

7
4.2 Operating Statistics
For the three months ended For the six months ended
June 30, 2014 June 30, 2013 June 30, 2014 June 30, 2013 Gold Equivalent Ounces (GEO) Production (i) Chapada (ii) 30,418 26,525 52,128 49,884 El Peñón (ii) 116,003 122,142 212,168 242,826 Gualcamayo 52,863 27,553 91,344 57,730 Mercedes (ii) 24,671 39,226 50,130 75,801 Canadian Malartic (ii)(iv) 11,878 n/a 11,878 n/a Minera Florida (ii) 29,031 26,582 57,346 60,606 Jacobina 18,776 17,485 33,629 34,851 Other Operating Mines (vii) 27,249 28,278 50,058 53,297 Total commercial GEO production (i) 310,889 287,791 558,681 574,995 Commissioning GEO (i)(v) 20,876 7,754 44,993 11,863 Total GEO production (i) 331,765 295,545 603,674 586,858 By-product Cash Costs per GEO (i) (iv) Chapada (580 ) (490 ) (700 ) (1,102 ) El Peñón 460 451 492 453 Gualcamayo 700 761 716 669 Mercedes 763 363 708 438 Canadian Malartic (iv) 614 n/a 614 n/a Minera Florida 638 915 634 819 Jacobina 1,188 1,270 1,213 1,273 Other Operating Mines (vii) 846 465 418 490 By-product cash costs per GEO produced (i) (iv) 523 476 491 430 Co-product cash costs per GEO produced (i) (iv) 622 577 630 582 Co-product cash costs per pound of copper produced (iv) 1.84 1.88 1.90 1.93 All-in sustaining cash costs per GEO, by-product basis (i) (iv) 864 916 844 884 All-in sustaining cash costs per GEO, co-product basis (i) (iv) 915 950 942 982 Concentrate Production Chapada concentrate production (tonnes) 60,975 55,511 112,546 105,102 Chapada copper contained in concentrate production (millions of lbs) 33.0 30.1 60.5 57.5 Chapada co-product cash costs per pound of copper (iv) 1.75 1.76 1.79 1.82 Alumbrera attributable concentrate production (tonnes) (iii) 11,188 13,129 23,798 24,389 Alumbrera attributable copper contained in concentrate production (millions of lbs) (iii) 6.4
7.2
13.6
13.5
Alumbrera co-product cash costs per lb of copper (iii) (iv) 2.32 2.40 2.36 2.40 Gold Equivalent Ounces Breakdown Gold ounces produced 284,366 257,608 512,737 505,846 Silver ounces produced (millions) 2.4 1.9 4.5 4.1 Sales Included in Revenue Total GEO sales (excluding 12.5% interest in Alumbrera) 297,467 270,207 534,027 554,738 - Total gold sales (ounces) 253,111 233,714 445,697 474,972 - Total silver sales (millions of ounces) 2.2 1.8 4.4 4.0 Chapada concentrate sales (tonnes) 56,010 50,728 104,757 106,554 Chapada payable copper contained in concentrate sales (millions of lbs) 28.7
26.7
54.0
55.8
______________________________ (i) Silver production is treated as a gold equivalent. Gold equivalent ounce calculations are based on an average historical silver to gold ratio (50:1) which
is used and presented solely for quarter-over-quarter comparative purposes. (ii) Three and six month gold production for the periods ended June 30, 2014: El Peñón — 75,727 ounces and 135,396 ounces (2013 - 91,861 and 182,016
ounces); Chapada — 28,875 ounces and 49,330 ounces (2013 - 25,014 ounces and 46,736 ounces), Mercedes — 22,809 ounces and 46,388 ounces (2013 - 35,701 ounces and 68,741 ounces), and Minera Florida — 25,311 ounces and 49,721 ounces (2013 - 23,962 ounces and 50,613 ounces) , respectively; and three and six -month silver production: El Peñón — 2.0 million ounces and 3.8 million ounces (2013 - 1.5 million ounces and 3.0 million ounces); Chapada — 77,148 ounces and 139,877 ounces (2013 - 75,595 ounces and 157,407ounces), Mercedes — 93,057 ounces and 187,099

8
ounces (2013 - 176,205 ounces and 353,006 ounces), Minera Florida — 185,952 ounces and 381,239 ounces (2013 - 131,029 ounces and 499,662 ounces), respectively.
(iii) The Company holds a 12.5% equity interest in Alumbrera. (iv) On June 16, 2014, the Company acquired a 50% interest in Canadian Malartic Corporation which operates the Canadian Malartic mine (Refer to Note 5
to the Condensed Consolidated Interim Financial Statements). Amounts shown are for the period from June 16, 2014 to June 30, 2014. (v) A cautionary note regarding non-GAAP measures and their respective reconciliations are included in Section 13 including a discussion and definition
of Cash Costs. (vi) Commissioning is ongoing at C1 Santa Luz and Pilar comparative periods includes Ernesto/Pau-a-Pique which is now in commercial production as of
May 1, 2014. (vii) Other Producing Mines represents the aggregation of non-core mining interests accounting for less than 10% of production which includes Fazenda
Brasileiro, Ernesto/Pau-a-Pique and Alumbrera. 5. OVERVIEW OF RESULTS 5.1 Overview of Financial Results For the three months ended For the six months ended (In thousands of United States Dollars; unless otherwise noted) Jun 30, 2014 Jun 30, 2013 Jun 30, 2014 Jun 30, 2013 Revenues $ 450,832 $ 430,471 $ 804,748 $ 965,344 Cost of sales excluding depletion, depreciation and amortization (253,483 ) (217,465 ) (462,348 ) (448,207 ) Gross margin 197,349 213,006 342,400 517,137 Depletion, depreciation and amortization (122,542 ) (94,360 ) (234,492 ) (190,482 ) Mine operating earnings 74,807 118,646 107,908 326,655 Other expenses (i) (105,401 ) (69,622 ) (156,387 ) (122,476 ) Equity earnings/(loss) from associate 260 (2,034 ) 1,424 (1,901 ) (Loss)/earnings from operations before income taxes (30,334 ) 46,990 (47,055 ) 202,278 Income tax expense 35,439 (54,888 ) 22,552 (108,081 ) Net earnings/(loss) $ 5,105 $ (7,898 ) $ (24,503 ) $ 94,197 Adjusted Earnings: Net earnings/(loss) 5,105 (7,898 ) (24,503 ) 94,197 Earnings adjustments (ii): Non-cash unrealized foreign exchange (gains)/losses (10,691 ) 33,389 17,059 34,530 Reorganization costs — 2,518 — 2,518 Share-based payments/mark-to-market of deferred share units 4,211 (5,134 ) 9,468 (1,981 ) Transaction costs related to the Osisko acquisition 32,371 — 32,371 — MTM loss on revaluation of convertible debt 126 — 126 —
Impairment of investment in available-for-sale securities and other assets 2,869
31,636
9,074
40,954
Other non-cash and non-recurring losses 6,943 (414 ) 8,437 1,241 Adjusted earnings before income tax effect 40,934 54,097 52,032 171,459 Income tax effect of adjustments 2,372 (3,916 ) 3,375 (4,298 ) Adjusted earnings (ii) $ 43,306 $ 50,181 $ 55,407 $ 167,161 Net earnings/(loss) per share - basic $ 0.01 $ (0.01 ) $ (0.03 ) $ 0.13 Net earnings/(loss) per share - diluted $ 0.01 $ (0.01 ) $ (0.03 ) $ 0.13 Adjusted earnings per share (ii) - basic and diluted $ 0.05 $ 0.07 $ 0.07 $ 0.22 Adjusted Cash Flows: Cash flows from operating activities before non-cash working capital $ 144,838 $ 150,918 $ 238,460 $ 365,133 Transaction costs related to the Osisko acquisition $ 32,371 $ — $ 32,371 $ — Adjusted Cash Flows $ 177,209 $ 150,918 $ 270,831 $ 365,133
______________________________ (i) For the three- and six- month periods ended June 30, 2014, other expenses represent the aggregate of the following expenses: general and administrative
of $36.8 million and $68.3 million (2013 - $37.9 and $74.6 million), exploration and evaluation of $4.3 million and $8.9 million (2013 - $7.8 million and $14.7 million), other expense of $39.4 million and $52.0 million (2013 - $21.0 million and $23.1 million) and net finance expense of $24.9 million and $27.2 million (2013 - expense $3.0 million and $10.0 million).
(ii) A cautionary note regarding non-GAAP measures is included in Section 13 of this Management's Discussion and Analysis.

9
Acquisition of 50% interest of Osisko Mining Corporation On June 16, 2014, the Company and Agnico jointly acquired 100% of all issued and outstanding common shares (with each company owning 50%) of Osisko. Osisko operates the Canadian Malartic mine (“Canadian Malartic”) in the Abitibi Gold Belt, immediately south of the Town of Malartic located in the province of Quebec, Canada. Additionally, Osisko conducts advanced exploration activities at the Kirkland Lake and Hammond Reef properties in Northern Ontario, Canada and additional exploration projects located in the Americas. As of January 1, 2014, the estimated global measured and indicated mineral resources for Canadian Malartic stood at 11.1 million ounces of gold, inclusive of proven and probable mineral reserves of 9.37 million ounces of gold. The estimated gold inferred mineral resources were 1.16 million ounces. The Partnership is in the process of completing a new 43-101 technical report which is expected later in August 2014. Total consideration paid by Yamana was $1.5 billion based on a Yamana share price of $8.18 (C$8.88) per share which consisted of approximately $0.5 billion in cash and $1.0 billion in Yamana shares. Under the terms of the Agreement, each outstanding common share of Osisko was exchanged for: (i) C$2.09 in cash; (ii) 0.26471 of a Yamana common share (a value of C$2.35 based on the closing price of C$8.88 for Yamana shares on the Toronto Stock Exchange as of June 16, 2014); (iii) 0.07264 of an Agnico common share (a value of C$2.64 based on the closing price of C$36.29 for Agnico shares on the Toronto Stock Exchange as of June 16, 2014); and (iv) one common share of a new company, Osisko Gold Royalties Ltd. ("Osisko Gold"), with an implied value of C$1.20 per share. Certain assets of Osisko were transferred to Osisko Gold, the shares of which were distributed to Osisko shareholders as part of the consideration. The following was transferred to Osisko Gold: (i) a 5% net smelter royalty (“NSR”) on the Canadian Malartic mine; (ii) C$157 million cash; (iii) a 2% NSR on the Upper Beaver-Kirkland Lake assets, the Hammond Reef project, and certain other exploration properties; (iv) all assets and liabilities of Osisko in its Guerrero camp; and (v) other investments. The acquisition supports the Company’s strategy, adding another high quality, high margin cornerstone asset that increases the sustainable production level and is expected to contribute significantly to cash flow. The acquisition has been accounted for as a business acquisition using the acquisition method. Ongoing operations of the joint arrangement will be accounted for as a joint operation in accordance with IFRS 11, Joint Arrangements. The preliminary purchase price allocation included in the Condensed Consolidated Interim Balance Sheet as at June 30, 2014, was based on estimates and has not been finalized. The Company is undergoing a detailed valuation of the fair value of assets acquired, liabilities assumed and potential goodwill. The actual fair values of the assets and liabilities may differ materially from the amounts disclosed in the preliminary purchase price allocation and are subject to change. For the three months ended June 30, 2014 Cash flows from operating activities after changes in non-cash working capital items for the three month period ended June 30, 2014 were $148.5 million, compared to $195.4 million for the quarter ended June 30, 2013. Cash flows from operating activities before changes in non-cash working capital (a non-GAAP measure, see Section 13) for the three months ended June 30, 2014 were $144.8 million, compared to $150.9 million generated for the same period of 2013. Lower cash flows from operating activities compared to that of the same quarter in the prior year were due to lower precious metal prices, partly offset by higher sales volume. Cash flows from operating activities for the second quarter also included $32.4 million in transaction costs associated with the acquisition of a 50% interest in Osisko. Adjusted operating cash flows excluding these transactions costs were $177.2 million. Net earnings for the second quarter were $5.1 million or $0.01 per share, compared with a net loss of $7.9 million or $0.01 per share for the three months ended June 30, 2013. Net earnings for the second quarter includes transaction costs in the amount of $32.4 million related to the acquisition of a 50% interest in Osisko. Consistent with IFRS, these transaction costs were expensed in the period incurred; however for purposes of calculating adjusted earnings, these transaction costs have been excluded as they are non-recurring in nature. Adjusted earnings were $43.3 million or $0.05 per share for the three months ended June 30, 2014, compared with $50.2 million or $0.07 per share in the second quarter of 2013. Lower adjusted earnings were attributed to lower realized gold and silver prices of approximately 7% for gold and 12% for silver and higher cost of sales. With only 15 days of operations attributable to the Company, the earnings contribution from Canadian Malartic was not material for the second quarter. Revenues of $450.8 million in the second quarter were higher compared with $430.5 million in the second quarter of 2013 as a result of higher sales volume offset by lower metal prices. Mine operating earnings were $74.8 million, compared with $118.6

10
million in the second quarter of 2013. Lower mine operating earnings were due to higher cost of sales and higher depletion, depreciation and amortization as a result of higher sales volume. Revenues for the three months ended June 30, 2014 were generated from the sale of 253,111 ounces of gold, 2.2 million ounces of silver and 28.7 million pounds of copper, excluding attributable sales from Alumbrera which is accounted for as an equity investment. This compares to sales, excluding Alumbrera, of 233,714 ounces of gold, 1.8 million ounces of silver and 26.7 million pounds of copper for the three months ended June 30, 2013. The average realized price of gold in the second quarter of 2014 was $1,292 per ounce compared to $1,385 per ounce in the same quarter of 2013, representing a decrease of 7%. The average realized price of copper was $3.11 per pound compared to $3.05 per pound in the second quarter of 2013, representing an increase of 2%, and the average realized silver price was $19.81 per ounce compared to $22.55 per ounce in the second quarter of 2013, representing a decrease of 12%. Revenues for the quarter were comprised of the following: For the three months ended June 30, 2014 2013
(In thousands of United States Dollars; unless otherwise noted) Quantity Sold (ii) Realized Price Revenues Revenues
Gold (i) 253,111 oz $ 1,292 $ 327,070 $ 323,667 Silver 2,217,779 oz $ 19.81 43,939 41,143 Total precious metals 297,467 GEO 371,009 364,810 Copper (i) 28,659,744 lbs $ 3.11 89,127 81,582 Gross Revenues $ 460,136 $ 446,392 Add (deduct): - Treatment and refining charges of gold and copper concentrate
$ (7,842 ) $ (3,695 )
- Sales taxes (8,214 ) (7,583 ) - Metal price adjustments related to concentrate revenues 7,747 (5,618 ) - Other adjustments (995 ) 975 Revenues (ii) $ 450,832 $ 430,471
______________________________ (i) Includes payable copper and gold contained in concentrate. (ii) Excludes Alumbrera which is accounted for as an equity investment.
Cost of sales excluding depletion, depreciation and amortization for the three months ended June 30, 2014 was $253.5 million compared with $217.5 million for the same quarter of 2013. Cost of sales excluding depletion, depreciation and amortization was higher than that of the same period in 2013 due to higher sales volume.

11
The following table provides a reconciliation of the co-product cash costs to the cost of sales excluding depletion, depreciation and amortization for the quarter: For the three months ended June 30, 2014 2013
(In thousands of United States Dollars; unless otherwise noted)
GEO or Pounds of Copper Produced
Co-product Cash Cost
per Unit Total Costs Total Costs Chapada — GEO (i) 30,418 oz $ 395 $ 12,015 $ 11,162 Chapada — Copper 32,965,720 lbs 1.75 57,690 52,874 El Peñón — GEO (i) 116,003 oz 460 53,361 55,087 Mercedes — GEO (i) 24,671 oz 763 18,824 14,240 Gualcamayo 52,863 oz 700 37,004 20,979 Canadian Malartic (50% interest) (ii) 11,878 oz 614 $ 7,293 — Minera Florida — GEO (i) 29,031 oz 638 18,525 24,318 Jacobina 18,776 oz 1,188 22,306 22,199 Other operating mines (iii) 18,939 oz 1,018 19,276 14,304 Co-product cash cost of sales (iv) $ 246,294 $ 215,163 Add (deduct): - Inventory movements and adjustments 8,569 1,838 - Chapada concentrate treatment and refining charges (7,735 ) (6,420 ) - Commercial & other costs 1,650 3,597 - Overseas freight for Chapada concentrate 4,705 3,287 Cost of sales excluding depletion, depreciation and amortization
$ 253,483
$ 217,465
______________________________ (i) Silver ounces reported for Chapada, El Peñón, Minera Florida and Mercedes are treated as gold equivalent ounces ("GEO"). (ii) For the period from June 16, 2014 to June 30, 2014. (iii) Excludes Alumbrera which is accounted for as an equity investment. (iv) A cautionary note regarding non-GAAP measures is included in Section 13 of this Management’s Discussion and Analysis of Operations and
Financial Condition. Depletion, depreciation and amortization (“DDA”) expense for the quarter was $122.5 million compared to $94.4 million in the second quarter of 2013. The increase was attributable to higher DDA at Gualcamayo from Amelia Inés (open-pit), QDD Lower West (underground) which started to contribute to production in late 2013 and Ernesto/Pau-a-Pique which completed commissioning in the second quarter. DDA is expected to increase in the second half of the year as a result of the acquisition of a 50% interest in Canadian Malartic which will include DDA on the amount of purchase price which is in excess of book values. Other expenses including of general and administrative, exploration and evaluation, other and net finance expenses were $105.4 million in the quarter, compared to $69.6 million in the three months ended June 30, 2013. The other expenses are discussed below: General and administrative expenses were $36.8 million in the second quarter compared to $37.9 million in the same quarter of 2013 a decrease of 3%. It is expected that general and administrative expenses will continue to be maintained at current levels or lower as a result of the cost containment initiatives undertaken by the Company in 2013. Exploration and evaluation expenses were $4.3 million, compared to $7.8 million incurred in the second quarter of 2013. The decrease in exploration and evaluation expenses is a result of the Company's reduced focus on greenfield exploration relative to the second quarter of 2013. Other expenses were $39.4 million in the quarter compared to $21.0 million in the first quarter of 2013. The increase in other expenses primarily reflects transaction costs associated with the acquisition of 50% of Osisko in the amount of $32.4 million. These transaction costs have been excluded from the calculation of adjusted earnings and adjusted cash flows. Finance expense, net of finance income was $24.9 million in the quarter compared to $3.0 million in the second quarter of 2013. Higher net finance expense was mainly due to net foreign exchange losses that resulted from unfavourable movements in exchange rates of currencies for which the Company settles its mine operating expenses compared to net foreign exchange gains in the comparative period as well as higher interest expense due to additional long-term debt.
12
Equity earnings from Alumbrera were $0.3 million for the quarter compared with losses of $2.0 million for the three months ended June 30, 2013. Higher equity earnings were due to higher sales volumes partly offset by lower metal prices. Cash dividends from the Company’s equity investment in Alumbrera received in the quarter were $10.5 million compared to $7.8 million in the second quarter of 2013. The Company recorded an income tax recovery of $35.4 million in the second quarter of 2014 compared to a tax expense of $54.9 million in the same quarter of 2013. The decrease in the income tax expense for the quarter is a result of lower earnings for the period relative to the same period of prior year and the Company's ability to set up tax losses in Canada due to the recent acquisition. The income tax provision reflects a current income tax expense of $48.3 million and a deferred income tax recovery of $83.7 million versus a current income tax recovery of $1.3 million and a deferred income tax expense of $56.2 million for the three months ended June 30, 2013. During the quarter, the exchange rates of the Brazilian Real increased in value against the US Dollar and the Argentine Peso declined in value against the US Dollar. As a result for local purposes, a recovery of $26.5 million relating to unrealized foreign exchange loss was recorded in the deferred tax expense. The impact of these foreign exchange movements on taxes are non-cash and as such excluded from adjusted earnings. See Note 23 to the Condensed Consolidated Interim Financial Statements for a breakdown of the foreign exchange and interest and penalties charged to the income tax expense. During the first half of 2014, the capacity under the Company's revolving line of credit was increased from $750 million to $1 billion. During the second quarter, the Company received $500 million in a senior unsecured term facility for two years for which the terms and covenants were substantively the same as the existing revolving credit facility. On June 30, 2014, the Company issued $500 million of 4.95% Senior Notes due July 15, 2024. The notes are unsecured, senior obligations of the Company and are unconditionally guaranteed by certain of the Company's subsidiaries that are also guarantors under the Company's unsecured senior credit facility. The net proceeds from the offering were used to repay in full the Company's $500 million unsecured senior term loan due June 2016. The proceeds of the term loan were used to partly fund Yamana's joint acquisition of Osisko. The Company's outstanding net debt position was approximately $1.8 billion as at June 30, 2014. During the quarter the Company also achieved two investment grade credit ratings and BB+ with a positive outlook from primary rating agencies. For the six months ended June 30, 2014 Cash flows from operating activities after changes in non-cash working capital items for the six-month period ended June 30, 2014 were $187.5 million compared to $369.2 million for the six months ended June 30, 2013. Cash flows from operating activities before changes in non-cash working capital (a non-GAAP measure, see Section 13) for the six months ended June 30, 2014 were $238.5 million compared to $365.1 million generated for the same period of 2013. Lower cash flows from operating activities compared to that of the first half of 2013 were due to lower metal prices and lower sale volumes, offset by lower income taxes paid and higher cash distributions from Alumbrera. Additionally, cash flows from operating activities for the first half of 2014 included $32.4 million in transaction costs associated with the acquisition of a 50% interest in Osisko. Adjusted operating cash flows excluding these transactions costs were $270.8 million. Net loss for the first half of 2014 was $24.5 million or $0.03 per share, compared with net earnings of $94.2 million or basic and diluted earnings of $0.13 per share for the six months ended June 30, 2013. Net loss for the first half of the year includes transaction costs in the amount of $32.4 million related to the acquisition of a 50% interest in Osisko. Consistent with IFRS, these transaction costs were expensed in the period incurred; however for purposes of calculating adjusted earnings, these transaction costs have been excluded as they are non-recurring in nature. Adjusted earnings were $55.4 million or $0.07 per share for the six months ended June 30, 2014, compared with $167.2 million or $0.22 per share in the comparative period of 2013. Lower adjusted earnings were attributed to lower realized metal prices of approximately 14% for gold, 24% for silver and 4% for copper, lower volume of metal sales and higher cost of sales. Revenues were $804.7 million in the first half of 2014 compared with $965.3 million in the same period of 2013. Mine operating earnings were $107.9 million, compared with $326.7 million in the first half of 2013. Lower revenues and mine operating earnings were due to lower metal prices and to lower volume of gold and copper sales. Revenues for the six months ended June 30, 2014 were generated from the sale of 445,697 ounces of gold, 4.4 million ounces of silver and 54.0 million pounds of copper, excluding the attributable sales from Alumbrera which is accounted for as an equity investment. This compares to sales, excluding Alumbrera, of 474,972 ounces of gold, 4.0 million ounces of silver and 55.8 million pounds of copper for the six months ended June 30, 2013. The average realized price of gold in the first half of 2014 was $1,293 per ounce compared to $1,504 per ounce in the same period of 2013, representing a decrease of 14%. The average realized price of copper was $3.18 per pound compared to $3.32 per pound

13
in the comparative period of 2013, representing a decrease of 4%, and the average realized silver price was $20.19 per ounce compared to $26.62 per ounce in the comparative period of 2013, representing a decrease of 24%. Revenue for the period was comprised of the following: For the six months ended June 30, 2014 2013
(In thousands of United States Dollars; unless otherwise noted) Quantity Sold (ii)
Realized Price Revenues Revenues
Gold (i) 445,697 oz $ 1,293 $ 576,215 $ 714,431 Silver 4,416,484 oz $ 20.19 89,176 106,156 Total precious metals 534,027 GEO 665,391 820,587 Copper (i) 54,031,111 lbs $ 3.18 171,596 185,611 Gross Revenues $ 836,987 $ 1,006,198 Add (deduct): - Treatment and refining charges of gold and copper concentrate
$ (15,749 ) $ (12,201 )
- Sales taxes (15,834 ) (16,219 ) - Metal price adjustments related to concentrate revenues 432 (12,993 ) - Other adjustments (1,088 ) 559 Revenues (ii) $ 804,748 $ 965,344
______________________________ (i) Includes payable copper and gold contained in concentrate. (ii) Excludes Alumbrera which is accounted for as an equity investment.
Cost of sales excluding depletion, depreciation and amortization for the six months ended June 30, 2014 was $462.3 million compared with $448.2 million for the same period of 2013. Cost of sales excluding depletion, depreciation and amortization was higher than that of the same period in 2013. The following table provides a reconciliation of the co-product cash costs to the cost of sales excluding depletion, depreciation and amortization for the quarter:
For the six months ended June 30, 2014 2013
(In thousands of United States Dollars; unless otherwise noted)
GEO or Pounds of Copper Produced
Co-product Cash Cost
per Unit Total Costs Total Costs Chapada — GEO (i) 52,128 oz 434 22,624 21,987 Chapada — Copper 60,531,749 lbs 1.79 108,352 104,856 El Peñón — GEO (i) 212,168 oz 492 104,387 110,029 Mercedes — GEO (i) 50,130 oz 708 35,492 33,221 Gualcamayo 91,344 oz 716 65,402 38,596 Canadian Malartic (50% interest) (ii) 11,878 oz 614 7,293 — Minera Florida — GEO (i) 57,346 oz 634 36,357 49,624 Jacobina 33,629 oz 1,213 40,792 44,353 Other operating mines (iii) 31,632 oz 994 31,441 29,749 Co-product cash cost of sales (iv) 452,140 432,415 Add (deduct): - Inventory movements and adjustments 6,154 12,781 - Chapada concentrate treatment and refining charges (15,492 ) (14,927 ) - Commercial & other costs 11,064 10,996 - Overseas freight for Chapada concentrate 8,482 6,942 Cost of sales excluding depletion, depreciation and amortization
462,348
448,207
______________________________
(i) Silver ounces reported for Chapada, El Peñón, Minera Florida and Mercedes are treated as gold equivalent ounces ("GEO"). (ii) For the period from June 16, 2014 to June 30, 2014. (iii) Excludes Alumbrera which is accounted for as an equity investment. (iv) A cautionary note regarding non-GAAP measures is included in Section 13 of this Management’s Discussion and Analysis of Operations and
Financial Condition.

14
Depletion, depreciation and amortization (“DDA”) expense for the six month period ended June 30, 2014 was $234.5 million, compared to $190.5 million in the same period of 2013. The increase was attributable to higher DDA at Gualcamayo from Amelia Inés (open-pit), QDD Lower West (underground) which started to contribute to production in late 2013 and Ernesto/Pau-a-Pique which completed commissioning in the second quarter. Other expenses including general and administrative, exploration and evaluation, other and net finance expenses were $156.4 million for the six months ended June 30, 2014, compared to $122.5 million in the six month period ended June 30, 2013. The other expenses are discussed below: General and administrative expenses were $68.3 million in the six month period ended June 30, 2014 compared to $74.6 million in the same period of 2013 a decrease of 8%. It is expected that general and administrative expenses will continue to be maintained at current levels or lower as a result of the cost containment initiatives undertaken by the Company in 2013. Exploration and evaluation expenses were $8.9 million in the six month period ended June 30, 2014, compared to $14.7 million incurred in the same period of 2013. The decrease in exploration and evaluation expenses is a result of the Company's reduced focus on greenfield exploration relative to the comparative period of 2013. Other expenses were $52.0 million in the six month period ended June 30, 2014 compared to $23.1 million in the same period of 2013. The increase in other expenses reflects transaction costs in the amount of $32.4 million related to the acquisition of a 50% interest in Osisko. Net finance expense net was $27.2 million in the first half of 2014 compared to $10.0 million in the first half of 2013. Higher net finance expense was mainly due to higher interest expense due to additional long-term debt. Equity earnings from Alumbrera were $1.4 million for the six months ended June 30, 2014 compared with losses of $1.9 million for the comparative period ended June 30, 2013. Higher equity earnings were due to higher sales volumes partly offset by lower metal prices. Cash dividends from the Company’s equity investment in Alumbrera received were $28.2 million compared to $12.4 million in the first half of 2013. The Company recorded an income tax recovery of $22.6 million in the six month period ended June 30, 2014 compared to a tax expense of $108.1 million in the same period of 2013. The decrease in the income tax expense for the quarter is a result of lower earnings for the period relative to the same period of prior year and the Company's ability to set up tax losses in Canada due to the recent acquisition. The income tax provision reflects a current income tax expense of $71.4 million and a deferred income tax recovery of $93.9 million versus a current income tax expense of $50.9 million and a deferred income tax expense of $57.2 million for the six months ended June 30, 2013. During the first six months ended June 30, 2014, the exchange rates of the Brazilian Real increased in value against the US Dollar and the Argentine Peso declined in value against the US Dollar. As a result for local purposes, a charge of $5.0 million relating to unrealized foreign exchange loss was recorded in the deferred tax expense. The impact of these foreign exchange movements on taxes are non-cash and as such excluded from adjusted earnings. See Note 23 to the Condensed Consolidated Interim Financial Statements for a breakdown of the foreign exchange and interest and penalties charged to the income tax expense. 5.2 Overview of Quarterly Operating Results
For the three months ended June 30, 2014 Total production for the second quarter of 2014 was 331,765 GEO, compared to 295,545 GEO produced in the second quarter of 2013. Total production included production during commissioning of 20,876 ounces of gold. Commercial production for the second quarter was 310,889 GEO compared with 287,791 GEO produced in the second quarter of 2013. Total commercial production comprised of 263,489 of gold and 2.4 million ounces of silver, compared to 249,854 ounces of gold and 1.9 million ounces of silver produced in the same quarter of 2013. Second quarter production was more than 20% higher than the first quarter. Second quarter production from key mines that contribute most significantly to production and operating cash flow including Chapada, El Peñón, Gualcamayo, Mercedes and Canadian Malartic was 30% higher than that of the first quarter. Increases in production from the first quarter included a 37% increase at Gualcamayo with contribution from QDD Lower West, representing quarterly record production for this mine; a 40% increase in gold production at Chapada; a 21% increase in GEO at El Peñón and a 26% increase in gold production at Jacobina. Similar to previous years, the first half of the year production was planned to be the lowest of the year given the rainy season in

15
the first quarter and the ramp-up of new projects. Production is expected to accelerate for the remainder of the year as ordinary course mine sequencing will result in mining of higher grade areas with the largest impact at mines that contribute most significantly to the operating cash flow generation of the Company and with the addition of Canadian Malartic to the Company's portfolio of mining assets. By-product cash costs (a non-GAAP measure, see Section 13) for the second quarter of 2014 averaged $523 per GEO, compared with $476 per GEO in the second quarter of 2013. By-product cash costs were impacted by higher co-product cash costs and a lower copper credit contribution from Chapada and Alumbrera due to the copper price. By-product cash costs for the second quarter from key assets were $419 per GEO compared to $426 per GEO in the first quarter. Co-product cash costs (a non-GAAP measure, see Section 13) for the second quarter averaged $622 per GEO, compared to $577 per GEO for the second quarter of 2013. By-product and co-product cash costs (a non-GAAP measure, see Section 13) were impacted by planned lower grades at certain mines and higher input costs compared to the three months ended June 30, 2013. Co-product cash costs for the second quarter from key assets were $545 per GEO compared to $588 per GEO in the first quarter, representing a decrease of 7% since the previous quarter at mines that contribute most significantly to operating cash flow. All-in sustaining cash costs ("AISC", a non-GAAP measure, see Section 13) were $864 per GEO on a by-product basis, compared to $916 per GEO for the second quarter of 2013. AISC on a by-product basis for the second quarter from key assets were $650 per GEO compared to $665 per GEO in the first quarter, representing a decrease of 2%. On a co-product basis, AISC were $915 per GEO for the second quarter, compared to $950 per GEO for the same period of 2013, and 6% below that of the first quarter with notable improvements at Chapada, El Peñón, Gualcamayo, Minera Florida and Jacobina. AISC on a co-product basis for the second quarter at key assets were $736 per GEO compared to $809 per GEO in the first quarter, representing a decrease of 9% quarter-over-quarter at mines that contribute most significantly to operating cash flow. Copper production for the three month period ended June 30, 2014 was 33.0 million pounds from the Chapada mine, compared to 30.1 million pounds for the same period of 2013. A total of 6.4 million pounds of copper produced from Alumbrera were attributable to the Company, compared with 7.2 million pounds for the three months ended June 30, 2013. Total copper production for the three month period ended June 30, 2014 was 39.4 million pounds, compared with 37.3 million pounds in the same period of 2013. Co-product cash costs per pound of copper (a non-GAAP measure, see Section 13) were $1.75 per pound from the Chapada mine compared to $1.76 per pound of copper in the first half of 2013. Co-product cash costs per pound of copper for the quarter including the Company’s interest in Alumbrera were $1.84 per pound compared to $1.88 per pound for the first half of 2013. For the six months ended June 30, 2014 Total production for the six-month period ended June 30, 2014 was 603,674 GEO, compared to 586,858 GEO produced in the same period of 2013. Total production included production during commissioning of 44,993 ounces of gold. Commercial production for the six month period ended June 30, 2014 was 558,681 GEO compared with 574,995 GEO produced in the same period of 2013. Total commercial production comprised of 467,744 of gold and 4.5 million ounces of silver, compared to 493,983 ounces of gold and 4.1 million ounces of silver produced in the same period of 2013. Gualcamayo increased production by 58% relative to the six month period ended June 30, 2013 with production contribution from the QDD Lower West underground mine and from Amelia Inés. Production is expected to accelerate for the second half of 2014 as ordinary course mine sequencing will result in mining of higher grade areas with the largest impact at mines that contribute most significantly to the operating cash flow generation of the Company and the addition of six months of production from the Canadian Malartic mine. By-product cash costs (a non-GAAP measure, see Section 13) for the six month period ended June 30, 2014 averaged $491 per GEO, compared with $430 per GEO in the same period of 2013. By-product cash costs were impacted by a lower copper credit contribution from Chapada and Alumbrera due to a lower copper price and lower sales volume. The average market price for copper in the first half of 2014 was 8% lower than the average of the same period in 2013. By-product and co-product cash costs (a non-GAAP measure, see Section 13) were impacted by planned lower grades at certain mines and higher input costs compared to the six months ended June 30, 2013. By-product cash costs from key assets were $422 per GEO for the six month period ended June 30, 2014. Co-product cash costs (a non-GAAP measure, see Section 13) for the first half of 2014 averaged $630 per GEO, compared to $582 per GEO for the same period of 2013. Co-product cash costs for the first half of 2014 from key assets averaged $563 per GEO. All-in sustaining cash costs ("AISC", a non-GAAP measure, see Section 13) were $844 per GEO on a by-product basis, compared to $884 per GEO for the first six months of 2013 and well below the plan level of $850 per GEO. AISC on a by-product basis from

16
key assets average $657 per GEO for the first six months of 2014. On a co-product basis AISC were $942 per GEO for the first six months of 2014. Copper production for the first half of 2014 was 60.5 million pounds from the Chapada mine, compared to 57.5 million pounds for the same period of 2013. A total of 13.6 million pounds of copper produced from Alumbrera were attributable to the Company, compared with 13.5 million pounds for the six months period ended June 30, 2013. Total copper production for the first six months of 2014 was 74.1 million pounds, compared with 71.0 million pounds in the same period of 2013. Co-product cash costs per pound of copper (a non-GAAP measure, see Section 13) were $1.79 per pound for the six month period ended June 30, 2014 from the Chapada mine compared to $1.82 per pound of copper in the same period of 2013. Co-product cash costs per pound of copper for the first half of 2014 including the Company’s interest in Alumbrera were $1.90 per pound compared to $1.93 per pound for the same period of 2013.

17
6. OPERATING MINES CHAPADA, BRAZIL
For the three months ended
June 30, For the six months ended
June 30,
Operating Statistics 2014 2013
2014
2013
Production Concentrate (tonnes) 60,975 55,511 112,546 105,102 GEO contained in concentrate production (i) 30,418 26,525 52,128 49,884 Gold contained in concentrate (ounces) 28,875 25,014 49,330 46,736 Silver contained in concentrate (ounces) 77,148 75,595 139,877 157,407 Copper contained in concentrate (millions of pounds) 33.0 30.1 60.5 57.5 By-product cash costs per GEO produced (ii) $ (580 ) $ (490 ) $ (700 ) $ (1,102 ) Co-product cash costs per GEO produced (ii) $ 395 $ 421 $ 434 $ 441 Co-product cash costs per pound of copper produced (ii) $ 1.75 $ 1.76 $ 1.79 $ 1.82 Ore mined (tonnes) 4,375,863 5,180,543 8,728,649 9,684,625 Ore processed (tonnes) 5,034,490 5,016,383 9,879,242 10,124,902 Gold feed grade (g/t) 0.30 0.26 0.26 0.25 Copper feed grade (%) 0.37 0.34 0.35 0.33 Concentrate grade - gold (g/t) 14.73 14.02 13.63 13.83 Concentrate grade - copper (%) 24.52 24.62 24.40 24.81 Gold recovery rate (%) 60.0 59.6 59.4 57.9 Copper recovery rate (%) 80.0 80.2 79.7 78.7 Sales (iii) Concentrate (tonnes) 56,010 50,728 104,757 106,554 Payable GEO contained in concentrate 21,788 21,182 40,834 46,064 Payable gold contained in concentrate (ounces) 21,458 20,628 39,958 44,692 Payable silver contained in concentrate (ounces) 16,509 27,708 43,807 68,586 Payable copper contained in concentrate (millions of pounds) 28.7 26.7 54.0 55.8 Depletion, depreciation and amortization Per GEO sold $ 105 $ 110 $ 106 $ 100 Per copper pound sold $ 0.32 $ 0.35 $ 0.32 $ 0.33
______________________________ (i) GEO assumes gold plus the gold equivalent of silver using a ratio of 50:1 for all periods presented. (ii) A cautionary note regarding non-GAAP measures is included in Section 13 of this Management’s Discussion and Analysis. (iii) Quantities sold include quantity adjustment on provisional and final invoice settlements.
In the second quarter of 2014, Chapada produced a total of 30,418 GEO, which consisted of 28,875 ounces of gold and 77,148 ounces of silver, contained in concentrate, compared with 26,525 GEO, which consisted of 25,014 ounces of gold and 75,595 ounces of silver contained in concentrate in the same quarter of 2013. Chapada copper production was 33.0 million pounds in the quarter compared with production of 30.1 million pounds of copper in the second quarter of 2013. Compared to the first quarter, production at Chapada in the second quarter was 40% higher for gold and 20% higher for copper as a result of planned higher grades. The average gold grade is expected to be higher in the second half of 2014 compared to the first half of the year while copper grade is expected to remain relatively consistent period-over-period. Production for the quarter was higher than the second quarter of 2013 mainly as a result of higher gold feed grade and concentrate grade for gold compared to the second quarter of 2013. As expected, production at Chapada has steadily increased after the heavy rainfall of the wet season experienced during the first quarter. Production is expected to continue to grow stronger in the second half of the year with the additional contribution from higher grade ore feed from Corpo Sul expected by the end of the year. Corpo Sul is an adjacent near-to-surface ore body to the main pit. Pre-stripping at Corpo Sul began in the
18
first quarter. Work continues to enhance plant throughput and realize further improvements throughout the year with the acquisition of new drill rigs and on completing the installation of the in-pit crusher, which is planned for the third quarter. By-product cash costs for the quarter were negative $580 per GEO, compared with negative $490 per GEO for the same quarter in 2013. Lower by-product cash costs per GEO was mainly due to lower co-product cash costs and the effect of higher copper sales volume and copper prices in the second quarter of 2014 compared to 2013, resulting in a higher copper by-product credit for the quarter. Co-product cash costs were $395 per GEO in the second quarter, compared to $421 per GEO in the same quarter of 2013 and $489 per GEO in the first quarter of 2014. This represents a 19% decrease in cash costs from the first quarter of 2014. Lower co-product cash costs was a result of higher volume of gold production on lower tonnage of ore mined and ore processed at higher ore grade. Co-product cash costs for copper were $1.75 per pound in the second quarter compared to $1.76 per pound in the same quarter of 2013 and $1.84 per pound in the first quarter of 2014. Chapada revenues for the quarter net of sales taxes, treatment and refining costs and mark-to-market adjustments were $114.7 million (Q2 2013 - $100.0 million). Revenues included a gain from mark-to-market adjustments and provisional pricing settlements in the quarter of $7.7 million (Q2 2013 - loss of $5.6 million). In the first half of 2014, Chapada produced a total of 52,128 GEO, which consisted of 49,330 ounces of gold and 139,877 ounces of silver, contained in concentrate compared with 49,884 GEO, which consisted of 46,736 ounces of gold and 157,407 ounces of silver contained in concentrate in the same period of 2013. Chapada copper production was 60.5 million pounds in the quarter compared with production of 57.5 million pounds of copper in the first half of 2013. By-product cash costs for the first six months were negative $700 per GEO, compared with negative $1,102 per GEO for the same period in 2013. Higher by-product cash costs per GEO was mainly due to the effect of lower copper sales volume and lower copper prices in the first half of 2014 compared to 2013, resulting in a lower copper by-product credit for the quarter. Co-product cash costs were $434 per GEO in the first half of 2014, compared to $441 per GEO in the same period of 2013. Co-product cash costs for copper were $1.79 per pound in the first half of 2014 versus $1.82 per pound in the same period of 2013. Chapada revenues for the first six months net of sales taxes, treatment and refining costs and mark-to-market adjustments were $203.9 million (2013 - $225.9 million). Revenues included a gain from mark-to-market adjustments and provisional pricing settlements in the first six months of $0.4 million (2013 - loss of $13.0 million).
19
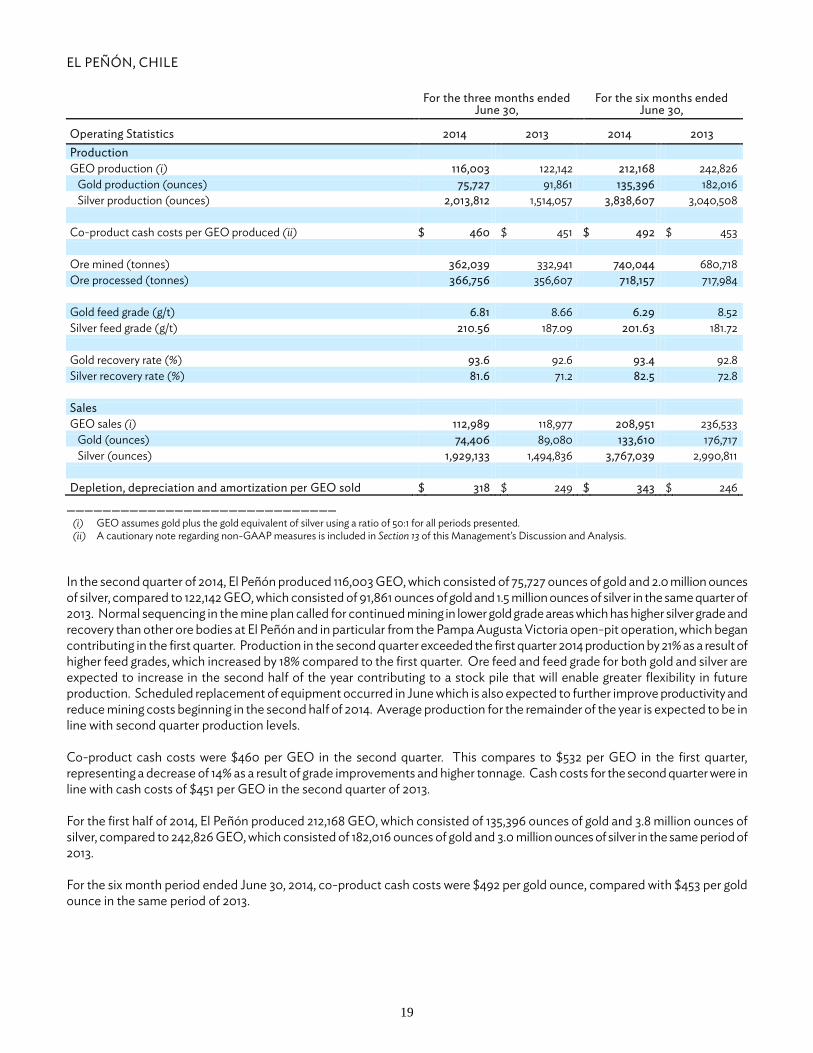
EL PEÑÓN, CHILE
For the three months ended
June 30, For the six months ended
June 30,
Operating Statistics 2014 2013
2014 2013
Production GEO production (i) 116,003 122,142 212,168 242,826 Gold production (ounces) 75,727 91,861 135,396 182,016 Silver production (ounces) 2,013,812 1,514,057 3,838,607 3,040,508 Co-product cash costs per GEO produced (ii) $ 460 $ 451 $ 492 $ 453 Ore mined (tonnes) 362,039 332,941 740,044 680,718 Ore processed (tonnes) 366,756 356,607 718,157 717,984 Gold feed grade (g/t) 6.81 8.66 6.29 8.52 Silver feed grade (g/t) 210.56 187.09 201.63 181.72 Gold recovery rate (%) 93.6 92.6 93.4 92.8 Silver recovery rate (%) 81.6 71.2 82.5 72.8 Sales GEO sales (i) 112,989 118,977 208,951 236,533 Gold (ounces) 74,406 89,080 133,610 176,717 Silver (ounces) 1,929,133 1,494,836 3,767,039 2,990,811 Depletion, depreciation and amortization per GEO sold $ 318 $ 249 $ 343 $ 246
______________________________ (i) GEO assumes gold plus the gold equivalent of silver using a ratio of 50:1 for all periods presented. (ii) A cautionary note regarding non-GAAP measures is included in Section 13 of this Management’s Discussion and Analysis.
In the second quarter of 2014, El Peñón produced 116,003 GEO, which consisted of 75,727 ounces of gold and 2.0 million ounces of silver, compared to 122,142 GEO, which consisted of 91,861 ounces of gold and 1.5 million ounces of silver in the same quarter of 2013. Normal sequencing in the mine plan called for continued mining in lower gold grade areas which has higher silver grade and recovery than other ore bodies at El Peñón and in particular from the Pampa Augusta Victoria open-pit operation, which began contributing in the first quarter. Production in the second quarter exceeded the first quarter 2014 production by 21% as a result of higher feed grades, which increased by 18% compared to the first quarter. Ore feed and feed grade for both gold and silver are expected to increase in the second half of the year contributing to a stock pile that will enable greater flexibility in future production. Scheduled replacement of equipment occurred in June which is also expected to further improve productivity and reduce mining costs beginning in the second half of 2014. Average production for the remainder of the year is expected to be in line with second quarter production levels. Co-product cash costs were $460 per GEO in the second quarter. This compares to $532 per GEO in the first quarter, representing a decrease of 14% as a result of grade improvements and higher tonnage. Cash costs for the second quarter were in line with cash costs of $451 per GEO in the second quarter of 2013. For the first half of 2014, El Peñón produced 212,168 GEO, which consisted of 135,396 ounces of gold and 3.8 million ounces of silver, compared to 242,826 GEO, which consisted of 182,016 ounces of gold and 3.0 million ounces of silver in the same period of 2013. For the six month period ended June 30, 2014, co-product cash costs were $492 per gold ounce, compared with $453 per gold ounce in the same period of 2013.

20
GUALCAMAYO, ARGENTINA
For the three months ended
June 30, For the six months ended
June 30, Operating Statistics 2014 2013 2014 2013 Production Gold production (ounces) 52,863 27,553 91,344 57,730 Co-product cash costs per gold ounce produced (i) $ 700 $ 761 $ 716 $ 669 Ore mined (tonnes) 1,349,512 1,621,066 3,323,077 1,675,625 Ore processed (tonnes) 1,435,864 1,915,698 3,341,551 3,708,921 Gold feed grade (g/t) 1.63 0.51 1.54 0.59 Gold recovery rate (%) 66.7 87.2 67.4 83.4 Sales Gold sales (ounces) 53,590 27,770 92,371 56,300 Depletion, depreciation and amortization per gold ounce sold $ 390 $ 453 $ 458 $ 452
______________________________ (i) A cautionary note regarding non-GAAP measures is included in Section 13 of this Management’s Discussion and Analysis.
Record production from Gualcamayo of 52,863 ounces of gold in the second quarter compared with 27,553 ounces produced in the second quarter of 2013, representing a 92% increase as a result of the contribution from the new QDD Lower West ("QDDLW") underground mine. Production was also 37% higher than the first quarter of 2014. Higher production was the result of planned higher grades which are over 200% higher than the comparable period in 2013 and 11% higher than the first quarter of 2014 mainly resulting from the new mineral source of QDDLW underground. Gold recovery for the second quarter was in line with that of the first quarter but lower than that of the comparable quarter of 2013 due to the metallurgy of the ore from Amelia Inés ("AIM") and QDDLW as it requires a longer leaching cycle than that of QDD Main, increasing the amount of ore on the heap leach pad. To improve recoveries, the expansion of the Adsorption and Desorption plant ("ADR") is planned for the second half of the year increasing volume of treatment capacity. These plant modifications are expected to improve recovery rates beginning later in the year on both the North and South leach pads. Gualcamayo is positioned to meet production expectations for 2014. Co-product cash costs were $700 per ounce in the second quarter compared with $761 per ounce in the second quarter of 2013 representing a decrease of 8%. Co-product cash costs for the second quarter were lower than the first quarter of 2014 by approximately 5% due to higher production contribution from QDDLW underground. Cash costs continue to be impacted by local inflationary pressures on labour and camp service costs, which were partly offset by the effect of the devaluation of the Argentine Peso on the portion of the operating cost structure reflected in local currency. The installation of a conveyor belt, which will reduce the cost of transport from the QDDLW underground is continuing and expected to be completed in the third quarter. The installation of the conveyor belt will further improve mining costs in the second half of the year. Gualcamayo produced 91,344 GEO in the first half of 2014, compared to 57,730 GEO in the same period of 2013 representing a 58% increase. Co-product cash costs for the six month period ended June 30, 2014 were $716 per gold ounce, compared with $669 per gold ounce in the second quarter of 2013. The Company continues to progress with studies of the options for processing the newly discovered sulphide mineral resources including Rodado. Current work includes underground diamond drilling to obtain samples for metallurgical testing in assessing the economic viability of the sulphide mineral resources.

21
MERCEDES, MEXICO
For the three months ended
June 30, For the six months ended
June 30, Operating Statistics 2014 2013 2014 2013 Production GEO production 24,671 39,226 50,130 75,801 Gold production (ounces) 22,809 35,701 46,388 68,741 Silver production (ounces) 93,057 176,205 187,099 353,006 Co-product cash costs per GEO produced (i) $ 763 $ 363 $ 708 $ 438 Ore mined (tonnes) 170,012 175,361 328,263 327,351 Ore processed (tonnes) 167,552 164,422 327,114 329,544 Gold feed grade (g/t) 4.60 6.74 4.71 6.64 Silver feed grade (g/t) 58.58 90.61 59.31 88.35 Gold recovery rate (%) 93.9 94.5 94.3 94.8 Silver recovery rate (%) 30.0 34.4 30.1 36.5 Sales GEO sales (ii) 25,971 37,593 50,553 79,749 Gold (ounces) 24,002 34,083 46,789 72,129 Silver (ounces) 98,436 175,514 188,175 381,013 Depletion, depreciation and amortization per GEO sold $ 442 $ 267 $ 420 $ 253
______________________________ (i) A cautionary note regarding non-GAAP measures is included in Section 13 of this Management’s Discussion and Analysis. (ii) GEO assumes gold plus the gold equivalent of silver using a ratio of 50:1 for all periods presented.
Production of 24,671 GEO in the second quarter consisted of 22,809 ounces of gold and 93,057 ounces of silver, compared with 39,226 GEO, which consisted of 35,701 ounces of gold and 176,205 ounces of silver in the second quarter of 2013. Production was lower than the second quarter of 2013, due to continued mining of lower grade areas as part of normal mine sequencing. Mining of higher grade areas and increased feed grades are expected for the remainder of the year with gold and silver grades expected to return to higher levels in the third quarter. Mining of lower grade areas also resulted in higher cash costs of $763 per GEO compared to $363 in the same quarter of 2013. For the first half of 2014, production of 50,130 GEO consisted of 46,388 ounces of gold and 187,099 ounces of silver, compared with 75,801 GEO, which consisted of 68,741 ounces of gold and 353,006 ounces of silver in the first six months of 2013. Co-product cash costs were $708 per GEO compared to $438 in the first six months of 2013. Development of other areas continued during the second quarter at Mercedes including: the advancement of permitting and continued drilling at Rey del Oro, infrastructure and sill development of the Barrancas zone and continued review to refine the mine design and permitting for Lupita and Diluvio.

22
CANADIAN MALARTIC (50% interest), CANADA
For the three months ended
June 30, For the six months ended
June 30, Operating Statistics (i) 2014 2013 2014 2013 Production Gold production (ounces) 11,878 n/a 11,878 n/a Co-product cash costs per gold ounce produced (ii) 614 n/a 614 n/a Ore mined (tonnes) 366,786 n/a 366,786 n/a Ore processed (tonnes) 397,813 n/a 397,813 n/a Gold feed grade (g/t) 1.03 n/a 1.03 n/a Gold recovery rate (%) 89.9 n/a 89.9 n/a Sales Gold sales (ounces) 16,303 n/a 16,303 n/a
Depletion, depreciation and amortization per gold ounce sold $ 314 n/a $ 314
n/a
______________________ (i) For the period from acquisition on June 16, 2014 to June 30, 2014. (ii) A cautionary note regarding non-GAAP measures is included in Section 13 of this Management’s Discussion and Analysis.
The Canadian Malartic mine is a large open pit operation with conventional processing located in Quebec, Canada acquired by the Company and its partner Agnico through the acquisition of Osisko which closed on June 16, 2014. The Company owns a 50% interest in the mine. The Company and Agnico operate the mine jointly through a joint management committee. On a 100% basis, the mine produced 133,181 ounces of gold in the second quarter of 2014 at an average grade of 1.01 gram per tonne. On a 100% basis, production from June 16 to June 30, 2014 was 23,756 ounces of gold. The Company’s 50% share of this production for the 15 days was 11,878 ounces of gold. The second quarter included a 5-day scheduled shutdown for mill maintenance. On a per ounce basis, net of by-product credits, Canadian Malartic’s total cash costs were $645 per ounce in the second quarter of 2014 and $614 per ounce for the period since acquisition and attributable to Yamana and Agnico. Attributable cash costs also include the new 5% net smelter royalty ("NSR") payable to Osisko Gold. For the entire second quarter of 2014, the Canadian Malartic mill processed an average of 50,673 tonnes per day and for the first six months of 2014, the mill processed an average of 49,584 tonnes per day. In the first six months of 2014, Canadian Malartic produced 273,211 ounces of gold on a 100% basis. Net of by-product credits, Canadian Malartic’s total cash costs per ounce were $610 per ounce in the first half of 2014 including the 5% NSR since the day of acquisition. The Company and Agnico are currently focused on transitioning Canadian Malartic into the Partnership structure. The Partnership believes that there is good potential to refine and improve the current Canadian Malartic mining operation. Studies are currently underway to fully explore opportunities for optimization of the asset. Potential initiatives include:
• Projects to improve the current crushing and grinding constraints. • The generation of additional ore stockpiles to support the increase in daily throughput through modifications to the
current crushing and grinding circuits. • Savings on procurement of consumables and equipment. • Improvement of drilling and blasting techniques in the open pit (fragmentation). • Reduction in contractor, exploration and head office general and administrative costs. Annual savings of
approximately C$12.0 to C$15.0 million are expected from Osisko's former head office. • Optimization of the mine plan.
Further details on the optimization plan will be presented at the end of the third quarter of 2014.

23
For the full year, forecast production is 510,000 to 530,000 ounces (100% basis). Ore grades and recovery rates for 2014 are expected to be in line with the second quarter. Plans to increase future production are under review. The total cash costs net of by-product credits for the full year of 2014 are now forecast to be approximately $695 per ounce including the new 5% NSR for the remainder of the year. Total cash costs are higher in the second half of 2014 largely due to the inclusion of the 5% NSR at approximately $65 per ounce per annum. Furthermore, earlier in the second quarter, permitting for the development of the Gouldie pit was obtained, enabling acceleration of the development of this pit to provide for future flexibility in production at an additional operating cost of approximately C$11.7 million for the remainder of the year. Higher operating costs in the second half of 2014 also include efforts to further reduce noise and vibration for the surrounding community at expected additional drilling costs of C$6.6 million for the north part of the pit. Due to the metallurgy of the ore in the north part of the pit, additional cyanide consumption is expected at a cost of approximately C$6.7 million. Total capital costs for 2014 are estimated at C$169.0 million including the acceleration of activities at the Gouldie pit to increase mining flexibility in the amount of C$13.0 million, with the creation of a lower grade stockpile, and additional capitalized stripping of C$12.0 million. A further C$9.0 million is committed to additional mining equipment that will add to the mining capacity of the operation. These capital expenditures will be fully funded by operating cash flow generated by the mine. Total capital expenditures for the three and six month period ended June 30, 2014 on a 100% basis was C$42.1 and C$67.1 million, respectively. Canadian Malartic is another cornerstone asset in a mining-friendly jurisdiction expected to increase the sustainable production level and contribute to cash flow and more significantly to net free cash flow. Canadian Malartic is expected to generate significant cash flow while continuing to be self-funding of its capital and other requirements. The acquisition provides significant mineral reserve growth and a large mineral resource base at higher average grades. Updated future guidance will be provided early in 2015. MINERA FLORIDA, CHILE
For the three months ended
June 30, For the six months ended,
June 30 Operating Statistics 2014 2013 2014 2013 GEO production (i) 29,031 26,582 57,346 60,606 Gold production (ounces) 25,311 23,962 49,721 50,613 Silver production (ounces) 185,952 131,029 381,239 499,663 Co-product cash costs per GEO produced (ii) $ 638 $ 915 $ 634 $ 819 Ore mined (tonnes) 207,417 191,787 415,833 368,873 Ore processed (tonnes) 405,855 402,130 853,258 813,708 Gold feed grade (g/t) 2.41 2.58 2.27 2.79 Silver feed grade (g/t) 24.89 18.16 25.46 32.16 Gold recovery rate (%) 80.4 77.7 79.9 73.4 Silver recovery rate (%) 57.3 53.8 54.6 55.1 GEO sales (i) 28,109 26,462 57,079 61,557 Gold (ounces) 24,635 23,930 48,730 50,599 Silver (ounces) 173,701 126,600 417,463 547,887 Depletion, depreciation and amortization per GEO sold 649 622 632 536
______________________________ (i) GEO assumes gold plus the gold equivalent of silver using a ratio of 50:1 for all periods presented and includes attributable ounces. (ii) A cautionary note regarding non-GAAP measures is included in Section 13 of this Management’s Discussion and Analysis.
In the second quarter of 2014, Minera Florida produced 29,031 GEO, which consisted of 25,311 ounces of gold and 185,952 ounces of silver, compared to 26,582 GEO, which consisted of 23,962 ounces of gold and 131,029 ounces of silver in the second quarter of 2013. Higher production was mainly attributed to higher silver feed grade, improved recovery rates and higher throughput offset by lower gold feed grade and expected as part of the mine plan.

24
Co-product cash costs for the second quarter of 2014 were $638 per GEO, representing a 30% reduction, compared with $915 per GEO in the same quarter in 2013. Lower cash costs was the result of continuous efforts at cost improvement initiatives implemented beginning in 2013, the devaluation of the Chilean Peso versus the U.S. Dollar and higher by-product credit from sales of zinc. For the first half of 2014, Minera Florida produced 57,346 GEO, which consisted of 49,721 ounces of gold and 381,239 ounces of silver, compared to 60,606 GEO, which consisted of 50,613 ounces of gold and 499,663 ounces of silver in the same period of 2013. Lower production is mainly due to lower grade despite higher throughput and recovery. Co-product cash costs for the first half of 2014 were $634 per gold ounce, compared with $819 per gold ounce in the comparable period of 2013 representing a 22% improvement period-over-period.

25
JACOBINA
For the three months ended
June 30, For the six months ended,
June 30 Operating Statistics 2014 2013 2014 2013 Gold production (ounces) 18,776 17,485 33,629 34,851 Co-product cash costs per gold ounce produced (i) $ 1,188 $ 1,270 $ 1,213 $ 1,273 Ore mined (tonnes) 358,901 385,517 699,930 798,551 Ore processed (tonnes) 350,919 384,614 690,801 799,340 Gold feed grade (g/t) 1.82 1.55 1.66 1.50 Gold recovery rate (%) 91.6 90.8 90.9 90.2 Gold Sales (ounces) 18,287 19,350 33,650 40,068 Depletion, depreciation and amortization per gold ounce sold 482 393 566 486
______________ (i) A cautionary note regarding non-GAAP measures is included in Section 13 of this Management’s Discussion and Analysis.
Gold production at Jacobina was 18,776 ounces in the second quarter of 2014, compared with 17,485 ounces produced in the same quarter of 2013 and 14,853 ounces in the first quarter of 2014. This represents a 26% increase in production relative to the first quarter as a result of higher throughput, feed grade and recovery. Higher production than the same quarter in 2013 resulted from improved feed grade and recovery offset by reduced throughput. Progress continues with a redeveloped mine plan and mining of higher grade areas will continue through the year with head grades expected to increase by the fourth quarter of 2014 which will also reduce cash costs per ounce. The focus at Jacobina is on producing quality ounces with sustainable margins and maximizing profitability and as such, in the short term, the emphasis has been on reducing costs rather than maximizing production preparing for a return to higher production levels and lower costs for the medium and longer term. Co-product cash costs were $1,188 per ounce for the second quarter compared to co-product cash costs of $1,270 per ounce for the second quarter of 2013, a 6% decrease. Cash costs for the second quarter were lower compared to the first quarter of 2014, representing a decrease in cash costs per ounce of approximately 5%. Lower co-product cash costs in the current quarter compared to the second quarter last year and the first quarter of 2014 reflects the effect of mine management's continuous effort in executing the cost containment initiatives implemented since the second quarter of 2013. For the six month period ended June 30, 2014, Jacobina produced 33,629 ounces compared to 34,851 ounces mainly due to lower throughput despite higher grade and comparable recovery. Co-product cash costs for the first half of 2014 were $1,213 per gold ounce, compared with $1,273 per gold ounce in the comparable period of 2013 representing a 5% improvement period-over-period.

26
OTHER MINES
For the three months ended
June 30, For the six months ended,
June 30 Operating Statistics 2014 2013 2014 2013 OTHER MINES Gold production from Other Producing Mines (iii) 27,250 28,278 50,058 53,297 Gold production from commissioning mines (iv) 20,876 7,754 44,993 11,863 Concentrate (tonnes) 11,188 13,129 23,798 24,389 Copper contained in concentrate (millions of pounds) 6.4 7.2 13.6 13.5 Co-product cash costs per GEO produced (i) $ 889 $ 640 $ 789 $ 690 Co-product cash costs per pound of copper produced (i) $ 2.32 $ 2.40 $ 2.36 $ 2.40 By-product cash costs per ounce of gold produced (i) $ 846 $ 465 $ 418 $ 490 Ore mined (tonnes) 1,569,708 1,250,052 3,345,048 2,127,998 Ore processed (tonnes) 2,300,026 1,761,321 4,480,064 3,324,473 Gold feed grade (g/t) 0.98 0.83 1.01 0.77 Copper feed grade (%) 0.34 0.36 0.36 0.34 Concentrate grade - gold (g/t) 21.32 21.02 22.24 20.91 Concentrate grade - copper (%) 26.08 24.83 25.94 25.03 Gold recovery rate (%) 66.0 76.0 66.0 78.0 Copper recovery rate (%) 74.6 76.5 75.8 76.0 Sales Gold sales (ounces) 26,201 26,920 53,563 50,021 Concentrate (tonnes) 7,924 12,210 27,597 22,975 Payable copper contained in concentrate (millions of pounds) 4.3 6.5 15.0 11.9 Depletion, depreciation and amortization per gold ounce sold (ii)
$ 367 $ 272 $ 342 $ 244
______________________________ (i) A cautionary note regarding non-GAAP measures is included in Section 13 of this Management’s Discussion and Analysis. (ii) For 100% owned mines only. (iii) Includes Fazenda Brasileiro, Ernesto/Pau-a-Pique and Alumbrera. (iv) Commissioning at Ernesto/Pau-a-Pique was completed May 1, 2014.
Other Producing Mines represents the aggregation of non-core mining interests accounting for less than 10% of production. In the second quarter of 2014, production from Other Producing Mines of 27,250 ounces of gold was 19% higher than the first quarter and compares to 28,278 ounces of gold in the second quarter of 2013. Co-product cash costs for the second quarter were $889 per GEO, compared to $640 per GEO in the same quarter in 2013. For the six month period ended June 30, 2014, Other Producing Mines produced 50,058 ounces of gold, compared to 53,297 ounces of gold in the same period of 2013. Throughput and average grades were higher quarter-over-quarter; however, lower average recoveries impacted production. Co-product cash costs for the first half of 2014 were $789 per gold ounce, compared to $690 per gold ounce in the comparable period of 2013. The Company continues with efforts to improve dilution and recovery rates from the carbon-in-leach (CIL) circuit at C1 Santa Luz. At Pilar, efforts to improve grade continue and production of ore from Caiamar, a satellite deposit, is ramping-up for processing with the higher grades offsetting the additional transportation costs to the plant. The Company also continues development of the Maria Lazarus deposit which is a nearer-to-plant satellite deposit with expected contribution to production at better costs due to ore geometry.

27
7. CONSTRUCTION, DEVELOPMENT AND EXPLORATION DEVELOPMENT The following summary highlights key updates from the development projects of the Company since December 31, 2013. Cerro Moro, Argentina Cerro Moro is a high-grade gold and silver deposit located in the Santa Cruz province of Argentina with similarities to the deposits at the El Peñón and Mercedes mines. With the feasibility study completed, detailed engineering and pre-development work is on track towards a planned construction decision before the end of 2014 targeting initial production in 2016. Long-lead items have been identified. Suppliers for these items are being defined so that the Company's project team will be ready to commence procurement of these critical items upon a construction decision. Detailed engineering has commenced to confirm assumptions and further refine capital costs to precision levels normally better than feasibility study levels. The feasibility study contemplates small open pits for the first three years followed by the development of underground areas. The Company is also evaluating optimizations and efficiencies that include scalability of the plant. The processing plant is to be built in two phases. The first phase to recover metal from a high grade gravity concentrate; and the second phase, after year three, will add flotation to increase recoveries. Development of the underground areas and second phase plant capital will be fully funded through cash flows. The project is expected to generate significant returns, create robust value and positively contribute to cash flow per share. This operation aligns with the Company's focus to balance production of growth and capital spending to maximize value creation. Suyai, Argentina Suyai is a high-grade gold and silver deposit located in the Chubut province of Argentina. An application for the environmental impact study ("EIS") is underway for exploration and development work which will be followed by permitting for an operational EIS within the current mining and environmental laws of the Chubut Province. The plan being evaluated is a small scale underground operation with off-site processing or direct sale of a precious metal concentrate. The parameters of the current plan include an initial capital investment of approximately $220 million, initial throughput rate of 1,150 tonnes per day with the ability to expand over time and expected annual production of approximately 150,000 GEO at costs consistent with the Company's current all-in sustaining cash cost structure. The Company continues with community engagement to demonstrate the benefits of underground mining and offsite processing of ore. Agua Rica, Argentina Agua Rica is a large-scale copper, gold, silver and molybdenum deposit located in the province of Catamarca, Argentina. In September 2011, the Company entered into an agreement granting Minera Alumbrera Argentina (“MAA”) an option to acquire the Company’s 100% interest in the Agua Rica project which included annual and other payments over the life of the agreement. In 2013, MAA requested, and the Company granted, an extension of the option payment due by one additional year. Subsequent to the end of the quarter, the Company decided not to grant any further extension for 2014 and the option agreement has terminated. Prior to the termination of the option agreement, the Company had received $50 million in option payments, all of which will be retained by the Company in addition to all technical and feasibility level work which has already transitioned back to Yamana. The Company is now actively engaged in the consolidation of that information for Agua Rica and has begun working with the Government of Catamarca to determine a development plan to establish a mining district within the region with Agua Rica as the cornerstone asset. The Company will consider several options for strategic alliances for the development of Agua Rica in conjunction with the efforts with the Government of Catamarca. EXPLORATION Exploration at Yamana continues to be a key to unlocking value at existing operations. The 2014 program will continue to focus on finding higher quality ounces, those with the greatest potential to most quickly generate cash flows allowing the Company to grow prudently and profitably.

28
The following is a summary of the exploration and evaluation expenditures for the current and comparative periods.
For the three months
ended June 30, For the six months ended
June 30 (In millions of Dollars) 2014 2013 2014 2013 Exploration and evaluation capitalized (i) $ 15.8 $ 20.1 $ 27.1 $ 37.1 Exploration and evaluation expensed (ii) 4.3 7.8 8.9 14.7 Total exploration and evaluation $ 20.1 $ 27.9 $ 36.0 $ 51.8
______________________________ (i) Capitalized exploration and evaluation costs are reflected in the Condensed Consolidated Interim Balance Sheet's property, plant and equipment as part
of the additions to mining property costs not subject to depreciation for near-mine exploration and tangible exploration and evaluation assets with probable future economic benefits.
(ii) Expensed exploration and evaluation costs are reported in the consolidated statements of operations. The following summary highlights key updates from the exploration program at the Company since December 31, 2013. Cerro Moro, Argentina The 2014 exploration program at Cerro Moro will focus on developing and defining mineral reserves and mineral resources, and upgrading mineral resources as the Company continues to advance development of the project. Surface exploration consisting of detailed mapping and sampling of prospective targets in the Escondida and La Negra blocks continued to be the focus of the exploration program during the second quarter. Mapping and sampling from the decline ramp and cross cuts of the Escondida fault and associated veins, breccia, and stockwork systems, which began in the first quarter, was completed during the second quarter and as expected confirmed the values in the mineral resource and mineral reserve models. A total of 1,272 metres have been completed in 11 holes through the end of the quarter. Infill and extension drilling of the Nini, Carlita, Margarita and other targets began early in the quarter as part of a 6,000 metre drill program planned for the year. Gualcamayo, Argentina The 2014 exploration program at Gualcamayo focuses on expanding the Rodado southwest mineral orebody and testing new target areas for near surface oxide potential. The drill program to infill and extend mineralization as well as collect fresh sulfide material in the Rodado southwest mineral body was completed during the quarter. A total of 7,965 metres have been completed in 19 holes through the end of the second quarter. Once final assays are received metallurgical testing will begin on the samples. The exploration program will continue to drill metallurgical holes in the Santiago and Magdalena targets during the third quarter along with drilling step-out holes to further explore favorable near surface intercepts encountered in drilling earlier in the year. The 2014 program will also infill known near surface oxide bodies to upgrade the resource category from inferred mineral resources to indicated mineral resources and subsequent consideration for mineral reserve status. El Peñón, Chile The 2014 exploration program at El Peñón builds on the success of the 2013 program. It involves a combination of surface and underground infill and exploration drill programs coupled with additional surface detailed mapping, sampling and brownfields target development. The program is expected to provide new mineral resources and upgrade existing mineral resources to mineral reserve categorization. This is a continuation of the 2013 program that focused on mineral resource discovery. During the second quarter, exploration continued to infill drill the Providencia HW1, HW2 and HW3 cross-cutting structures with positive results. Other drill targets returning positive results include Borde Este, Bonanza Norte and Esmeralda, all exploration and mineral resource expansion related targets. A total of 68,131 metres have been completed in 283 holes through the end of the second quarter. District exploration also continued in the quarter, building on results from the first quarter, to map and sample, and later in 2014 drill several targets with geologic similarities to that found at El Peñón. Mercedes, Mexico The 2014 exploration program at Mercedes focuses on testing for extensions of known ore bodies along the Mercedes-Barrancas-Marianas trend and upgrading inferred and indicated mineral resources into mineral reserve category. During the year, the Company expects to complete at least 18,500 metres of surface and underground drilling, development of underground drill stations along with important surface reconnaissance and district target development work. During the second quarter, exploration concentrated on surface drilling of new targets along the Mercedes to Marianas trend and collaring the first underground exploration holes in the Barrancas Gap area to more efficiently test the prospective structural

29
trend. A total of 16,005 metres have been completed in 47 holes through the end of the second quarter. Early results are encouraging and step-out drilling has confirmed some veins along strike. Surface exploration drilling at Diluvio continues to find important widths and grade at depth that is expected to build the mineral resources and eventually mineral reserves of that target. The positive results of the exploration program during the first half of 2014 supports an additional $2.5 million allocation to further the exploration efforts at Mercedes. Minera Florida, Chile The 2014 exploration program at Minera Florida will focus on upgrading mineral resources to replace and expand mineral reserves and developing new targets through surface mapping and sampling that could be drill tested in the second half of the year. During the second quarter, the exploration focus continued to execute the mineral resource upgrade and mineral resource expansion programs in the Mina Este and surrounding target areas. More than 9,000 metres of a total of 18,500 metres planned for the year have been completed in 57 holes through the end of the second quarter. Most holes encountered multiple intercepts of above cut-off grade mineralization that are currently being modeled and considered for mineral resource categorization. Surface mapping and sampling is continuing to support and generate near surface potential above the current mine footprint. Pilar, Brazil The 2014 exploration program at Pilar will focus on expanding the mineral resource and mineral reserve base through surface drill testing moderate to high grade indicated and inferred mineral resource shoots identified by underground mapping and sampling along with computer modeling of drill data. The surface and underground based drill programs to delineate high grade mineral shoots at Pilar, which began in the first quarter, continued throughout the second quarter and returned positive results. The program is designed to infill areas with existing development to aid in ore extraction and will act to extend or upgrade mineral resources in areas outside of the developed areas later in the year. A total of 1,625 metres have been completed in 11 holes through the end of the second quarter. Chapada, Brazil The 2014 exploration program at Chapada will focus on continuing to expand known mineral bodies and discover a new satellite mineral body that can be quickly defined and added to mineral resources. The Company expects 12,000 metres to be drilled within the known mine areas as infill and extension programs and 9,700 metres to be drilled on targets developed through near-mine and regional mapping and sampling programs relying on prior knowledge of the areas along with data acquired from existing aeromagnetic and radiometric surveys. The exploration and infill programs commenced by the end of the second quarter and a total of 3,485 metres have been completed in 13 holes through the end of the second quarter. There are currently four drill rigs on site: two exploring the Corpo Sul extension and Santa Cruz targets with plans to test the Taquaracu and other targets and two completing an infill program at Corpo Sul. Osisko Exploration Portfolio As part of the Canadian Malartic Partnership, Yamana and Agnico will also jointly explore and potentially develop the Kirkland Lake assets, and continue exploration at the Hammond Reef, Pandora, and the Wood-Pandora properties. Prior to the completion of the acquisition, Osisko drilled 215 exploration holes totaling approximately 94,000 metres on their key exploration holdings. Two drill rigs continue drilling on the Upper Beaver and Canadian Kirkland properties. Once the assays have been received for these holes, and all data from these programs has been reviewed and evaluated, priorities will be identified and a follow-up program will be determined. Drilling at the Odyssey target, located on CHL Property, is halted indefinitely, pending determination of the project's financial viability and the resolution of ongoing disputes. The total exploration program, budgets and a strategic plan to develop the Kirkland Lake camp will be released later this fall.
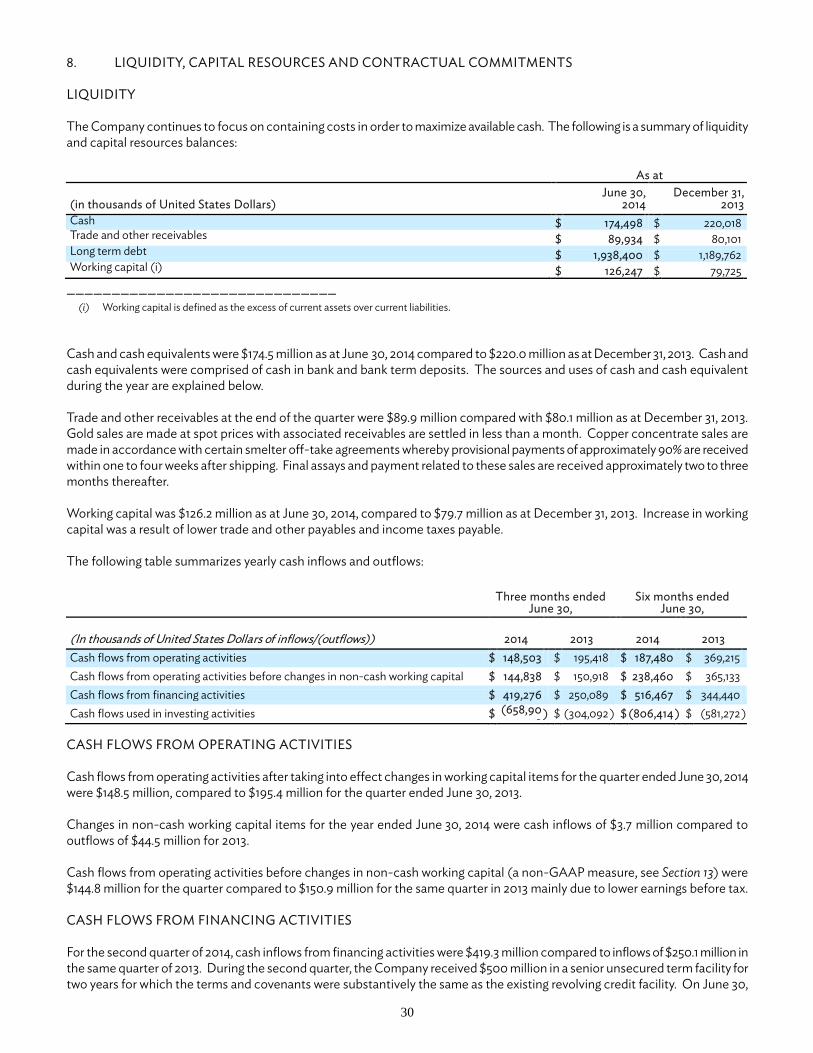
30
8. LIQUIDITY, CAPITAL RESOURCES AND CONTRACTUAL COMMITMENTS LIQUIDITY The Company continues to focus on containing costs in order to maximize available cash. The following is a summary of liquidity and capital resources balances: As at
(in thousands of United States Dollars) June 30,
2014 December 31,
2013 Cash $ 174,498 $ 220,018 Trade and other receivables $ 89,934 $ 80,101 Long term debt $ 1,938,400 $ 1,189,762 Working capital (i) $ 126,247 $ 79,725
______________________________ (i) Working capital is defined as the excess of current assets over current liabilities.
Cash and cash equivalents were $174.5 million as at June 30, 2014 compared to $220.0 million as at December 31, 2013. Cash and cash equivalents were comprised of cash in bank and bank term deposits. The sources and uses of cash and cash equivalent during the year are explained below. Trade and other receivables at the end of the quarter were $89.9 million compared with $80.1 million as at December 31, 2013. Gold sales are made at spot prices with associated receivables are settled in less than a month. Copper concentrate sales are made in accordance with certain smelter off-take agreements whereby provisional payments of approximately 90% are received within one to four weeks after shipping. Final assays and payment related to these sales are received approximately two to three months thereafter. Working capital was $126.2 million as at June 30, 2014, compared to $79.7 million as at December 31, 2013. Increase in working capital was a result of lower trade and other payables and income taxes payable. The following table summarizes yearly cash inflows and outflows:
Three months ended
June 30, Six months ended
June 30,
(In thousands of United States Dollars of inflows/(outflows)) 2014 2013
2014
2013
Cash flows from operating activities $ 148,503 $ 195,418 $ 187,480 $ 369,215 Cash flows from operating activities before changes in non-cash working capital $ 144,838 $ 150,918 $ 238,460 $ 365,133 Cash flows from financing activities $ 419,276 $ 250,089 $ 516,467 $ 344,440 Cash flows used in investing activities $ (658,90
9 ) $ (304,092 ) $ (806,414 ) $ (581,272 ) CASH FLOWS FROM OPERATING ACTIVITIES Cash flows from operating activities after taking into effect changes in working capital items for the quarter ended June 30, 2014 were $148.5 million, compared to $195.4 million for the quarter ended June 30, 2013. Changes in non-cash working capital items for the year ended June 30, 2014 were cash inflows of $3.7 million compared to outflows of $44.5 million for 2013. Cash flows from operating activities before changes in non-cash working capital (a non-GAAP measure, see Section 13) were $144.8 million for the quarter compared to $150.9 million for the same quarter in 2013 mainly due to lower earnings before tax. CASH FLOWS FROM FINANCING ACTIVITIES For the second quarter of 2014, cash inflows from financing activities were $419.3 million compared to inflows of $250.1 million in the same quarter of 2013. During the second quarter, the Company received $500 million in a senior unsecured term facility for two years for which the terms and covenants were substantively the same as the existing revolving credit facility. On June 30,

31
2014, the Company issued $500 million of 4.95% Senior Notes due July 15, 2024. The notes are unsecured, senior obligations of the Company and are unconditionally guaranteed by certain of the Company's subsidiaries that are also guarantors under the Company's unsecured senior credit facility. The net proceeds from the offering were used to repay in full its $500 million unsecured senior term loan due June 2016. The proceeds of the term loan were used to partly fund Yamana's joint acquisition of Osisko. Other outflows from financing activities for the quarter ended June 30, 2014 included interest and other finance expenses paid of $37.7 million, dividends paid of $28.4 million and assumed debt repayment of $14.1 million since the acquisition date. CASH FLOWS USED IN INVESTING ACTIVITIES Cash outflows for investing activities were $658.9 million for the quarter ended June 30, 2014, compared to cash outflows of $304.1 million for the quarter ended June 30, 2013. Higher cash outflows used in investing activities was primarily a result of the acquisition of a 50% interest in Osisko Mining Corporation which included cash consideration of $451.2 million. Additionally, a total of $193.5 million of capital expenditures including sustaining, expansionary and capitalized exploration and evaluation were incurred as follows:
Three months ended for
June 30, Six months ended for
June 30, (in thousands of United States Dollars) 2014 2013 2014 2013 Chapada $ 33,691 $ 29,058 $ 40,916 $ 46,536 El Peñón 32,914 25,157 64,745 68,991 Gualcamayo 14,880 43,594 24,921 82,831 Mercedes 11,961 15,588 21,001 29,213 Canadian Malartic (i) 2,831 n/a 2,831 n/a Minera Florida 13,474 24,114 27,793 42,477 Jacobina 7,496 16,654 14,085 28,510 Other mines/projects: Fazenda Brasileiro 3,912 3,343 5,857 8,743 C1 Santa Luz (ii) 19,484 15,916 41,395 46,071 Pilar (ii) 39,754 63,532 56,981 87,629 Cerro Moro 5,570 15,638 15,970 22,324 Other 7,547 48,701 22,883 77,435 Total capital expenditures $ 193,514 $ 301,295 $ 339,378 $ 540,760
______________________________ (i) For the period from acquisition on June 16, 2014 to June 30, 2014. (ii) Net of movement in accounts payable.
CAPITAL RESOURCES In order to maintain or adjust its capital structure, the Company may issue shares or debt securities, pay dividends, or undertake other activities as deemed appropriate under the specific circumstances. The Company is authorized to issue an unlimited number of common shares at no par value and a maximum of eight million first preference shares. There are no first preference shares issued or outstanding. As of July 24, 2014, the total number of shares outstanding were 877.5 million, the total number of stock options outstanding were 2.1 million, the total number of DSUs outstanding were 3.0 million and the total number of RSUs outstanding were 2.2 million. In the quarter, the Company declared a quarterly dividend of $0.0375 per share compared to the second quarter of 2013 of $0.065 per share. The following table summarizes the weighted average common shares and equity instruments outstanding as at June 30, 2014:

32
Equity instruments outstanding
as at
Weighted average dilutive equity
instruments (i), three months
ended
Weighted average dilutive equity
instruments (i), six months ended
(In thousands) June 30, 2014 June 30, 2014 June 30, 2014 Common shares 877,512 772,565 763,014 Dilutive shares relating to convertible debt held in trust 3,177 489 246 Options 2,106 9 11 RSU (i) 2,238 539 655 DSU (ii) 2,959 — — n/a 773,602 763,926
______________________________ (i) Total options excluded from the computation of diluted earnings per share because the exercise prices exceeded the average market value of the
common shares for the three and six month periods ended June 30, 2014 were 1.1 million and 1.1 million, respectively (three and six month periods ended June 30, 2014 - nil and 0.9 million).
(ii) DSU is settled in cash and as such excluded from the calculation of the weighted average number of shares outstanding.
CONTRACTUAL COMMITMENTS Day-to-day mining, sustaining and expansionary capital expenditures as well as administrative operations give rise to contracts requiring agreed upon future minimum payments. Management is of the view that such commitments will be sufficiently funded by current working capital, future operating cash flows and available credit facilities which provide access to additional funds. As at June 30, 2014, the Company is contractually committed to the following:
(In thousands of United States Dollars) Within 1 year
Between 1 to 3 years
Between 3 to 5 years
After 5 years Total
Mine operating/construction and service contracts and other $ 580,377
$ 479,490
$ 119,291
$ 6,963
$ 1,186,121
Long term debt principal repayments (i) 24,400 191,590 111,090 1,666,500 1,993,580 Decommissioning, Restoration and Similar Liabilities (undiscounted) 4,904
17,950
24,772
193,218
240,844
$ 609,681 $ 689,030 $ 255,153 $ 1,866,681 $ 3,420,545 ______________________________
(i) Excludes interest expense. 9. INCOME TAXES The Company recorded an income tax recovery of $35.4 million for the quarter compared to tax expense of $54.9 million in the second quarter of 2013. The decrease in the income tax expense for the quarter is a result of lower earnings for the period relative to the same period of prior year and the Company's ability to set up tax losses in Canada due to the recent acquisition. The income tax provision reflects a current income tax expense of $48.3 million and a deferred income tax recovery of $83.7 million versus a current income tax recovery of $1.3 million and a deferred income tax expense of $56.2 million for the three months ended June 30, 2013. The Condensed Consolidated Interim Balance Sheet reflects recoverable tax installments in the amount of $27.6 million and an income tax liability of $36.7 million. Additionally, the balance sheet reflects a deferred tax asset of $137.5 million and a deferred tax liability of $2.3 billion. The income tax provision is subject to a number of factors including the allocation of income between different countries, different tax rates in the various jurisdictions, the non-recognition of tax assets, foreign currency exchange movements, changes in tax laws and the impact of specific transaction and assessments. Due to the number of factors that can potentially impact the effective tax rate, it is expected that the Company's effective tax rate will fluctuate in future periods.
33
The Company has elected, under IFRS, to record foreign exchange related to deferred income tax assets and liabilities and interest and penalties in the income tax expense, therefore, due to foreign exchange differences, the tax rate will fluctuate during the year with the change in the Brazilian Real, Argentine Peso and Mexican Peso. During the year the Brazilian Real increased in value against the US Dollar and the Argentine Peso declined in value against the US Dollar. As a result for local purposes, a recovery of $26.5 million relating to unrealized foreign exchange was recorded in the deferred tax expense for the quarter ended June 30, 2014. The impact of these foreign exchange movements on taxes are non-cash and, as such, are excluded from adjusted earnings. On April 1, 2014, the Chilean government proposed a tax reform package. On July 8, 2014 the Chilean Executive Branch and member of the Senate’s Finance Commission announced a Protocol of Agreement. The agreement in this Protocol was voted and approved on the Senate floor on July 15, 2014. The Protocol includes amendment to the tax reform bill released on April 1, 2014, which is under discussion in the Chilean Congress. A technical working commission will translate the agreement into specific amendment to the bill, which is expected to be approved in August. The Company is evaluating the impact of the tax reform package on its taxes, although if passed it would progressively increase the Company’s cash taxes from 2014 to 2017. The tax reform package if enacted as proposed would also impact the Company’s non-cash deferred tax liability. See Note 23 to the Condensed Consolidated Interim Financial Statements for the period ended June 30, 2014 for a breakdown of the foreign exchange and interest and penalties charged to the income tax expense and Section 10 - Economic trends, risks and uncertainties - foreign operations and political risks of this Management Discussion and Analysis of Operations and Financial Condition for additional information.
10. ECONOMIC TRENDS, RISKS AND UNCERTAINTIES Exploration, development and mining of precious metals involve numerous risks as a result of the inherent nature of the business, global economic trends and the influences of local social, political, environmental and economic conditions in the various geographical areas of operation. As such, the Company is subject to several financial and operational risks that could have a significant impact on its profitability and levels of operating cash flows. The Company assesses and minimizes these risks by adhering to its internal risk management protocols which include the application of high operating standards empowering individuals and establishing processes to be able to identify, assess, report and monitor risk at all levels of the organization. Through careful management and planning of its facilities, hiring qualified personnel and developing a skilled workforce through training and development programs, the Company is able to generate shareholder value in a safe, resilient and responsible manner. Below is a summary of the principal risks and related uncertainties facing the Company. Readers are also encouraged to read and consider the risk factors more particularly described in the Company’s Annual Information Form for the year ended December 31, 2013. Such risk factors could materially affect the future operating results of the Company and could cause actual events to differ materially from those described in forward-looking statements relating to the Company. Metal Price Risk The mining industry is highly dependent on commodity prices which are the result of the economic interplay of supply and demand. The profitability of the Company is directly related to the market prices of gold and copper and to a lesser extent, silver. Market price fluctuations of these commodities could adversely affect profitability of the Company's operations and might lead to impairment of mineral properties. The market prices for the aforementioned commodities fluctuate widely and these fluctuations are caused by numerous factors beyond the Company's control. For example, the market price of gold may change for a variety of reasons, including:
• the strength of the United States Dollar, in which the gold price trades internationally, relative to other currencies; • financial market expectations regarding the rate of inflation; • monetary policies announced, changed or implemented by central banks; • changes in the demand for gold, primarily from Asia, including the demand from the gold exchange traded funds
("ETF"), as an investment or as a result of leasing arrangements; • changes in the physical demand for gold used in jewelry; • changes in the supply of gold from production, divestment, scrap and hedging; • global or regional political or economic events, and • speculative positions taken by investors or traders in gold.

34
Gold Price Two-Year Trend (Bloomberg: USD per ounce of gold)
For the quarter ended June 30, 2014, spot gold prices averaged $1,290 per ounce, or 9% lower, compared with $1,417 per ounce in the second quarter of 2013. Prices ranged between $1,244 and $1,328 per ounce and ended the quarter at $1,327 per ounce. Continuing geopolitical tensions, a generally weaker US dollar and lower US Treasury yields supported gold prices throughout most of the quarter. The weaker US dollar was primarily driven by mixed US economic data and signals from the US Federal Reserve (US Fed) that the timing of a future increase to the Fed Funds rate may not occur as soon as previously thought. As expected, during the second quarter the US Fed continued to wind down its quantitative easing (QE) program. However, the timing of an increase in the Fed Funds rate is still not expected to occur for at least several more quarters and may not occur as soon as previously thought. In recent weeks the US Fed seems to be signaling that they would rather keep the Fed Funds rate low for a longer period in order to be sure that an economic recovery has firmly taken hold. Global monetary policy continues to be generally easy and most governments continue to struggle with the fiscal situations they face and this should be supportive for gold over the longer term. Physical demand for gold continues to be steady in China after record demand in 2013. With a new government in India it is thought that gold import restrictions could be relaxed at some point given how unpopular they have been. If this were to occur it would result in a significant pick-up in demand. It is expected that physical demand, particularly from China, will continue to be supportive during periods of price weakness. Central Banks continue to be active buyers with Iraq and Russia making notable purchases so far in 2014. ETF holdings have stabilized in recent months and physical and central bank demand should help offset any further investment related liquidation during the balance of the year. In spite of the positive signs with respect to the physical demand for gold, following the recent decline in gold prices, the Company has revised its production targets for future years to favour a lower cost structure. The Company is evaluating the producing mines whose all-in sustaining cash costs exceed the Company's average cost structure. The objective is to pursue quality ounces with sustainable margins and maximize profitability and as such, in the short term the emphasis will be on reducing costs rather than maximizing production. The Company has not hedged any of its gold sales.

35
Copper Price Two-Year Trend (Bloomberg: USD per pound of copper)
For the quarter ended June 30, 2014, spot copper prices averaged $3.08 per pound, representing a decrease of 5% compared with $3.25 per pound in 2013. Prices ranged between $2.97 and $3.20 per pound and ended the quarter at $3.19 per pound After falling sharply towards the end of the first quarter, copper prices rebounded in the second quarter due to unanticipated supply disruptions and the moderation of concerns about the sustainability of current economic growth levels in China. It is expected that the copper market will be in surplus over the next few years and there are still concerns about the impact of slowing economic growth in China. In the short-term these factors may limit the potential upside for copper prices but over the longer term, supply constraints should result in a situation that is much more supportive of copper price. The Company periodically uses forward contracts to economically hedge against the risk of declining copper prices for a portion of its forecast copper concentrate sales. Currency Risk Conducting exploration, development and production operations in the Americas exposes the Company to currency risk. The Company’s revenues are denominated in United States Dollars (USD). However, the Company’s operating expenses are incurred in United States Dollars, Brazilian Reais (BRL), Chilean Pesos (CLP), Argentine Pesos (ARG), Mexican Pesos (MXN) and Canadian Dollars (CAD). Accordingly, fluctuations in the exchange rates can significantly impact the results of operations. The following summarizes the movement in key currencies vis-à-vis the United States Dollar:
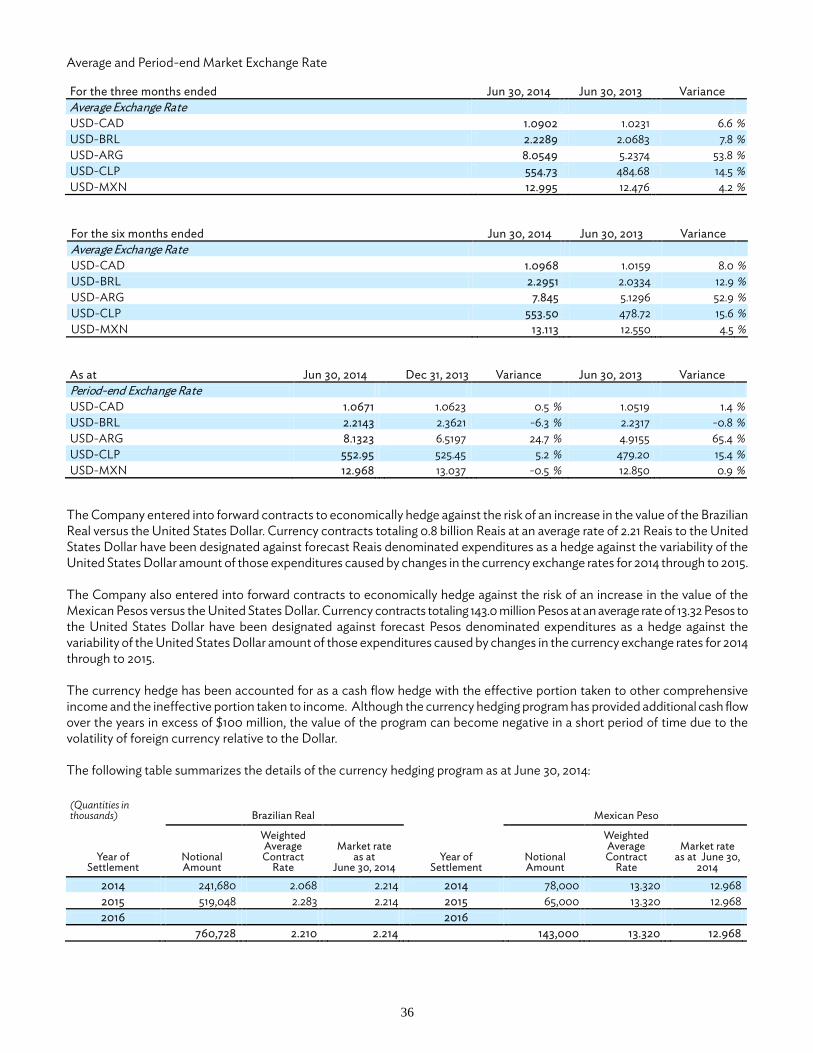
36
Average and Period-end Market Exchange Rate For the three months ended Jun 30, 2014 Jun 30, 2013 Variance Average Exchange Rate USD-CAD 1.0902 1.0231 6.6 % USD-BRL 2.2289 2.0683 7.8 % USD-ARG 8.0549 5.2374 53.8 % USD-CLP 554.73 484.68 14.5 % USD-MXN 12.995 12.476 4.2 %
For the six months ended Jun 30, 2014 Jun 30, 2013 Variance Average Exchange Rate USD-CAD 1.0968 1.0159 8.0 % USD-BRL 2.2951 2.0334 12.9 % USD-ARG 7.845 5.1296 52.9 % USD-CLP 553.50 478.72 15.6 % USD-MXN 13.113 12.550 4.5 %
As at Jun 30, 2014 Dec 31, 2013 Variance Jun 30, 2013 Variance Period-end Exchange Rate USD-CAD 1.0671 1.0623 0.5 % 1.0519 1.4 % USD-BRL 2.2143 2.3621 -6.3 % 2.2317 -0.8 % USD-ARG 8.1323 6.5197 24.7 % 4.9155 65.4 % USD-CLP 552.95 525.45 5.2 % 479.20 15.4 % USD-MXN 12.968 13.037 -0.5 % 12.850 0.9 %
The Company entered into forward contracts to economically hedge against the risk of an increase in the value of the Brazilian Real versus the United States Dollar. Currency contracts totaling 0.8 billion Reais at an average rate of 2.21 Reais to the United States Dollar have been designated against forecast Reais denominated expenditures as a hedge against the variability of the United States Dollar amount of those expenditures caused by changes in the currency exchange rates for 2014 through to 2015. The Company also entered into forward contracts to economically hedge against the risk of an increase in the value of the Mexican Pesos versus the United States Dollar. Currency contracts totaling 143.0 million Pesos at an average rate of 13.32 Pesos to the United States Dollar have been designated against forecast Pesos denominated expenditures as a hedge against the variability of the United States Dollar amount of those expenditures caused by changes in the currency exchange rates for 2014 through to 2015. The currency hedge has been accounted for as a cash flow hedge with the effective portion taken to other comprehensive income and the ineffective portion taken to income. Although the currency hedging program has provided additional cash flow over the years in excess of $100 million, the value of the program can become negative in a short period of time due to the volatility of foreign currency relative to the Dollar. The following table summarizes the details of the currency hedging program as at June 30, 2014: (Quantities in thousands) Brazilian Real Mexican Peso
Year of Settlement
Notional Amount
Weighted Average Contract
Rate Market rate
as at June 30, 2014
Year of Settlement
Notional Amount
Weighted Average Contract
Rate Market rate
as at June 30, 2014
2014 241,680 2.068 2.214 2014 78,000 13.320 12.968 2015 519,048 2.283 2.214 2015 65,000 13.320 12.968 2016 2016
760,728 2.210 2.214 143,000 13.320 12.968

37
Interest Rate Risk The Company is exposed to interest rate risk on its variable rate debt. Monetary policy by central banks in the countries in which the Company operates have maintained interest rates relatively low to avoid a relapse of the credit crisis and to provide incentive to economic growth. At June 30, 2014, the majority of the Company’s long term debt was carried at fixed rates, hence there is limited market risk arising from fluctuations in floating interest rate. Credit Risk Credit risk is the risk that a third party might fail to fulfill its performance obligations under the terms of a financial instrument. For cash, cash equivalents and trade and other receivables, credit risk is represented by the carrying amount on the balance sheet. For derivatives, the Company assumes no credit risk when the fair value of the instruments is negative. When the fair value of the instruments is positive, this is a reasonable measure of credit risk. The Company limits credit risk by entering into business arrangements with high credit-quality counterparties, limiting the amount of exposure to each counterparty and monitoring the financial condition of counterparties. Liquidity Risk Liquidity risk is the risk that an entity will encounter difficulty in meeting obligations associated with financial liabilities that are settled by delivering cash or another financial asset. Under the terms of our trading agreements, counterparties cannot require the Company to immediately settle outstanding derivatives except upon the occurrence of customary events of default. The Company mitigates liquidity risk through the implementation of its Capital Management Policy by spreading the maturity dates of derivatives over time, managing its capital expenditures and operation cash flows, and by maintaining adequate lines of credit. Investment Risk Investment risk is the risk that a financial instrument’s value will deviate from the expected returns as a result of changes in market conditions, whether those changes are caused by factors specific to the individual investment or factors affecting all investments traded in the market. Although the factors that affect investment risk are outside the Company’s control, the Company mitigates investment risk by limiting its investment exposure in terms of total funds to be invested and by being selective of high quality investments. Construction and Start-up of New Mines Risk The success of construction projects and the start-up of new mines by the Company is subject to a number of factors including the availability and performance of engineering and construction contractors, mining contractors, suppliers and consultants; the receipt of required governmental approvals and permits in connection with the construction of mining facilities and the conduct of mining operations (including environmental permits); and the successful completion and operation of ore passes, the Adsorption and Desorption plant and conveyors to move ore, among other operational elements. Any delay in the performance of any one or more of the contractors, suppliers, consultants or other persons on which the Company is dependent in connection with its construction activities; a delay in or failure to receive the required governmental approvals and permits in a timely manner or on reasonable terms; or a delay in or failure in connection with the completion and successful operation of the operational elements in connection with new mines could delay or prevent the construction and start-up of new mines as planned. There can be no assurance that current or future construction and start-up plans implemented by the Company will be successful; that the Company will be able to obtain sufficient funds to finance construction and start-up activities; that available personnel and equipment will be available in a timely manner or on reasonable terms to successfully complete construction projects; that the Company will be able to obtain all necessary governmental approvals and permits; and that the completion of the construction, the start-up costs and the ongoing operating costs associated with the development of new mines will not be significantly higher than anticipated by the Company. There is no certainty that the realization of mineral reserves and mineral resources projected by the feasibility study and technical assessment performed on the project may be realized. There is no certainty that future metal prices to ensure commercial viability will materialize. Consequently, there is a risk that start-up of new mines and development projects may be subject to a write-down and/or closure as there is no certainty that they are commercially viable. Any of the foregoing factors could adversely impact the operations and financial condition of the Company. The Company's projects have no operating history upon which to base estimates of future cash flow. The capital expenditures and time required to develop new mines or other projects are considerable and changes in costs or construction schedules can affect project economics. Thus, it is possible that actual costs may change significantly and economic returns may differ materially from the Company's estimates.

38
Currently, the Company has two mines under construction in Brazil, namely, C1 Santa Luz and Pilar. Both mines commenced commissioning in the second half of 2013 and remain subject to the risks of start-up of new mines. Foreign Operations and Political Risk The Company holds mining and exploration properties in Brazil, Argentina, Chile, Mexico and Canada exposing it to the socioeconomic conditions as well as the laws governing the mining industry in those countries. Inherent risks with conducting foreign operations include, but are not limited to, high rates of inflation; military repression; war or civil war; social and labour unrest; organized crime and hostage taking which cannot be timely predicted and could have a material adverse effect on the Company’s operations and profitability. The governments in those countries are currently generally supportive of the mining industry but changes in government laws and regulations including taxation, royalties, the repatriation of profits, restrictions on production, export controls, changes in taxation policies, environmental and ecological compliance, expropriation of property and shifts in the political stability of the country could adversely affect the Company’s exploration, development and production initiatives in these countries. In efforts to tighten capital flows and protect foreign exchange reserves, the Government of Argentina issued foreign exchange resolutions with respect to export revenues that resulted in a temporary suspension of export sales of concentrate at Alumbrera during the second quarter of 2012 as management evaluated how to comply with the new resolution. The Government of Argentina subsequently announced amendment to the foreign exchange resolution extending the time for exporters to repatriate net proceeds from export sales enabling Alumbrera to resume exports in July 2012. The Government of Argentina has also introduced certain protocols relating to the importation of goods and services and providing where possible for the substitution of Argentine produced goods and services. During 2012, Alumbrera was unable to obtain permission to repatriate dividends although certain accommodations have since been made to permit distribution of profits from Argentina. Discussion between the joint venture and the Argentine government on approval to remit dividends are ongoing. The Company continues to monitor developments and policies in all its jurisdictions and the impact thereof to its operations. Brazil is in the process of reviewing the royalties on mining companies. The finalization of the royalty rates are subject to change during the review and approval process therefore the final rates are not determinable at this time. The magnitude of change in royalty rates might affect net earnings and cash flows from the Company's operations in Brazil. On April 1, 2014, the Chilean government proposed a tax reform package. On July 8, 2014 the Chilean Executive Branch and member of the Senate’s Finance Commission announced a Protocol of Agreement. The agreement in this Protocol was voted and approved on the Senate floor on July 15, 2014. The Protocol includes amendment to the tax reform bill released on April 1, 2014, which is under discussion in the Chilean Congress. A technical working commission will translate the agreement into specific amendment to the bill, which is expected to be approved in August. The Company is evaluating the impact of the tax reform package on its taxes, although if passed it would progressively increase the Company’s cash taxes from 2014 to 2017. The tax reform package if enacted as proposed would also impact the Company’s non-cash deferred tax liability. On November 12, 2013, the Québec government introduced amendment to Québec’s Mining Tax Act under Québec Bill 55. The Bill introduced a new method for computing mining tax, amongst other changes. The new regime is scheduled to come into effect as of January 1, 2014. Subsequent to the election, the new government re-introduced the Bill in the Québec National Assembly, making the changes retroactive to the beginning of the year. The new changes are not expected to have a material impact to the mining taxes over the life of the Canadian Malartic mine. Consistent with its risk management protocol, to mitigate land title risks, the Company makes no commitments and does not undertake exploration without first determining that necessary property rights are in good standing. However, despite the Company’s best efforts, land title may still be affected by undetected defects. Health, Safety and Environmental Risk Mining, like many other extractive natural resource industries, is subject to potential risks and liabilities due to accidents that could result in serious injury or death and or material damage to the environment and Company assets. The impact of such accidents could affect the profitability of the operations, cause an interruption to operations, lead to a loss of licenses, affect the reputation of the Company and its ability to obtain further licenses, damage community relations and reduce the perceived appeal of the Company as an employer. Yamana has rigorous procedures in place to manage health and safety protocols in order to reduce the risk of occurrence and the severity of any accident and is continually investing time and resources to enhance health and safety at all operations.

39
The Company’s operations are subject to various laws and regulations governing the protection of the environment, exploration, development, production, exports, taxes, labour standards, occupational health, waste disposal, toxic substances, mine safety, and other matters. Permits from various governmental authorities are necessary in order to engage in mining operations in all jurisdictions in which the Company operates. Such permits relate to many aspects of mining operations, including maintenance of air, water and soil quality standards. In most jurisdictions, the requisite permits cannot be obtained prior to completion of an environmental impact statement and, in some cases, public consultation. Further, the Company may be required to submit for government approval a reclamation plan, to post financial assurance for the reclamation costs of the mine site, and to pay for the reclamation of the mine site upon the completion of mining activities. The Company mitigates this risk by performing certain reclamation activities concurrent with production. Environmental liability may result from mining activities conducted by others prior to the Company’s ownership of a property. To the extent Yamana is subject to uninsured environmental liabilities, the payment of such liabilities would reduce funds otherwise available for business activities and could have a material adverse effect on the Company. Should the Company be unable to fully fund the cost of remedying an environmental problem, the Company might be required to suspend operations or enter into interim compliance measures pending completion of the required remedy, which may have a material adverse effect. The Company mitigates the likelihood and potential severity of these environmental risks it encounters in its day-to-day operations through the application of its high operating standards as dictated by the Yamana management system. The Company has insurance policies in place to cover accidents and business interruption and regularly monitors the adequacy of such policies. Energy Risk The Company consumes energy in mining activities, primarily in the form of diesel fuel, electricity and natural gas. As many of the Company’s mines are in remote locations and energy is generally a limited resource, the Company faces the risk that there may not be sufficient energy available to carry out mining activities efficiently or that certain sources of energy may not be available. The Company manages this risk by means of long term electricity agreements with local power authorities and inventory control process on consumables including fuel. Many of the mines have on-site generator sets as back-up to mitigate the anticipated and unanticipated interruptions from the energy providers. Furthermore, the Company’s operations are continually improved to reduce input costs and maximize output. Nature and Climatic Condition Risk The Company and the mining industry are facing continued geotechnical challenges, which could adversely impact the Company's production and profitability. No assurances can be given that unanticipated adverse geotechnical and hydrological conditions, such as landslides, droughts and pit wall failures, will not occur in the future or that such events will be detected in advance. Geotechnical instabilities and adverse climatic conditions can be difficult to predict and are often affected by risks and hazards outside of the Company's control, such as severe weather and considerable rainfall, which may lead to periodic floods, mudslides, wall instability and seismic activity, which may result in slippage of material. Geotechnical failures could result in limited or restricted access to mine sites, suspension of operations, government investigations, increased monitoring costs, remediation costs, loss of ore and other impacts, which could cause one or more of the Company's projects to be less profitable than currently anticipated and could result in a material adverse effect on the Company's results of operations and financial position. 11. CONTINGENCIES Due to the size, complexity and nature of the Company’s operations, various legal and tax matters arise in the ordinary course of business. The Company accrues for such items when a liability is both probable and the amount can be reasonably estimated. In the opinion of management, these matters will not have a material effect on the Condensed Consolidated Interim Financial Statements of the Company. In 2004, a former director of Yamana's Northern Orion subsidiary commenced proceedings in Argentina against Northern Orion claiming damages in the amount of $177.0 million for alleged breaches of agreements entered into with the plaintiff. The plaintiff alleged that the agreements entitled him to a pre-emption right to participate in acquisitions by Northern Orion in Argentina and claimed damages in connection with the acquisition by Northern Orion of its 12.5% equity interest in the Alumbrera project. On August 22, 2008, the National Commercial Court No. 13 of the City of Buenos Aires issued a first-instance judgment rejecting the claim. The plaintiff appealed this judgment to the National Commercial Appeals Court. On May 22, 2013, the appellate court
40
overturned the first-instance decision. The appellate court determined that the plaintiff was entitled to make 50% of Northern Orion’s investment in the Alumbrera acquisition, although weighted the chance of the plaintiff's 50% participation at 15%. The matter was remanded to the first instance court to determine the value. On June 12, 2013, Northern Orion filed an extraordinary recourse with the appellate court in order to bring the matter before the Supreme Court for considering the National Commercial Appeals Court’s decision to be arbitrary. The extraordinary recourse was denied by the appellate court and this decision was notified to Northern Orion on December 20, 2013. Based on this decision, Northern Orion filed an appeal directly with the Supreme Court of Argentina on February 3, 2014. Pending the decision of the Supreme Court, Northern Orion will make submissions to the first instance court to address value. The outcome of this case is uncertain and cannot be reasonably estimated. The Company has received assessments from the Brazilian federal tax authorities disallowing certain deductions relating to debentures for the periods 2007-2010. The Company believes these debentures were issued on commercial terms permitted under applicable laws and is challenging these assessments. As such, the Company does not believe it is probable that any amounts will be paid with respect to these assessments with the Brazilian authorities and the amount and timing of any assessments cannot be reasonably estimated. 12. CRITICAL ACCOUNTING POLICIES AND ESTIMATES The Company's consolidated financial statements are prepared in accordance with International Financial Reporting Standards as issued by the International Accounting Standards Board (“IFRS”). The significant accounting policies applied and recent accounting pronouncements are described in Note 3 and Note 5 to the Company's annual consolidated financial statements for the quarter ended December 31, 2013. In preparing the consolidated financial statements in accordance with the IFRS, management is required to make estimates and assumptions that affect the reported amounts of assets, liabilities, revenues and expenses for the period end. Critical accounting estimates represent estimates that are uncertain and for which changes in those estimates could materially impact on the Company's consolidated financial statements. Actual future outcomes could differ from present estimates. Management reviews its estimates and assumptions on an ongoing basis using the most current information available. The critical judgments and key sources of estimation uncertainty in the application of accounting policies during the second quarter ended June 30, 2014 were similar to those disclosed in Note 4 to the Company's annual consolidated financial statements for the year ended December 31, 2013, except for the determination of the Company's reportable operating segments which was revisited in the quarter ended June 30, 2014 based on the internal reorganization as a result of the Company's recent acquisition. Additional information has been provided in Note 4 to the Company's annual consolidated financial statements for the year ended December 31, 2013. Acquisition of 50% interest in Osisko Mining Corporation The acquisition of 50% interest of the Osisko Mining Corporation and the Canadian Malartic mine is accounted for as a business combination using the acquisition method. The joint arrangement established by the Company and Agnico in operating the Canadian Malartic mine is accounted for as a joint operation. In accordance with IFRS 3, Business Combinations, a business combination is a transaction in which an acquirer obtains control of a business defined as an integrated set of activities and assets that is capable of being conducted and managed to provide a return to investors. Based on the analysis of the significant inputs and processes applied to those inputs in the Canadian Malartic mine, the Company has accounted for the acquisition as a business combination using the acquisition method. The identifiable assets acquired and the liabilities assumed are recorded at acquisition-date fair values at the Company’s proportionate share of 50%. The excess of (i) total consideration transferred by the Company, measured at fair value, and (ii) the acquisition-date fair value of the net of the assets acquired and liabilities assumed, is recorded as goodwill. Joint arrangements are those entities over whose activities the Company has joint control, established by contractual agreement. According to IFRS 11, Joint Arrangements, in assessing whether a joint arrangement is a joint operation or a joint venture, the rights and obligations arising from the joint arrangement should be considered. In assessing the rights and obligations of the Yamana/Agnico joint arrangement, the following are considered:
• the structure and legal form of the arrangement, • the terms agreed by the parties in the contractual arrangement and, when relevant, • other facts and circumstances.
Based on its analysis, the Company concluded that the joint arrangement should be accounted for as a joint operation.

41
Reportable Operating Segments Following the acquisition of a 50% interest in the Canadian Malartic mine in Quebec, Canada, effective in the second quarter of 2014, the Company’s determination of its reportable operating segments was revised to reflect its organizational changes realigning skills and expertise and the addition of new members to the Senior management team. The Company has five reportable operating segments which include the following mines: Chapada, El Peñón, Mercedes, Gualcamayo and Canadian Malartic (50% interest). In the Condensed Consolidated Interim Financial Statements, the Company also aggregates and discloses the financial results of the following non-reportable operating segments: Jacobina, Fazenda Brasileiro and Ernesto/Pau-a-Pique in Brazil, Minera Florida in Chile and Alumbrera (12.5% interest) in Argentina. These aggregated operating segments do not meet the quantitative thresholds to qualify as reportable operating segments; however, we have disclosed the aggregation of these non-reportable operating segments and in the MD&A, the production details of Minera Florida and Jacobina. Prior-period amounts have been adjusted retrospectively to reflect these operating segment changes.
13. NON-GAAP AND ADDITIONAL MEASURES The Company has included certain non-GAAP measures including “Co-product cash costs per gold equivalent ounce”, “Co-product cash costs per pound of copper”, “By-product cash costs per gold equivalent ounce”, “Adjusted Earnings or Loss, Adjusted Earnings or Loss per share” and Adjusted Cash Flows to supplement its Condensed Consolidated Interim Financial Statements, which are presented in accordance with International Financial Reporting Standards as issued by the International Accounting Standards Board (“IFRS”). The term IFRS and generally accepted accounting principles (“GAAP”) are used interchangeably throughout this MD&A. The Company believes that these measures, together with measures determined in accordance with IFRS, provide investors with an improved ability to evaluate the underlying performance of the Company. Non-GAAP measures do not have any standardized meaning prescribed under IFRS, and therefore they may not be comparable to similar measures employed by other companies. The data is intended to provide additional information and should not be considered in isolation or as a substitute for measures of performance prepared in accordance with IFRS. CASH COSTS The Company discloses “cash costs” because it understands that certain investors use this information to determine the Company’s ability to generate earnings and cash flows for use in investing and other activities. The Company believes that conventional measures of performance prepared in accordance with IFRS do not fully illustrate the ability of its operating mines to generate cash flows. The measures, as determined under IFRS, are not necessarily indicative of operating profit or cash flows from operating activities. Cash costs figures are calculated in accordance with a standard developed by The Gold Institute, which was a worldwide association of suppliers of gold and gold products and included leading North American gold producers. The Gold Institute ceased operations in 2002, but the standard remains the generally accepted standard of reporting cash costs of production in North America. Adoption of the standard is voluntary and the cost measures presented herein may not be comparable to other similarly titled measures of other companies. The Company’s business model is focused on the production and sale of precious metals - gold and silver, which accounts for a significant portion of the Company's total revenue generated. The emphasis on precious metals therefore entails the necessity to provide investors with cash costs information that is relevant to their evaluation of the Company’s ability to generate earnings and cash flows for use in investing and other activities. Cash costs are computed on a co-product, by-product, all-in sustaining co-product and all-in sustaining by-product basis. Cash costs include mine site operating costs such as mining, processing, administration, production taxes and royalties which are not based on sales or taxable income calculations, but are exclusive of amortization, reclamation, capital, development and exploration costs. The Company believes that such measure provides useful information about the Company’s underlying cash costs of operations in isolating the impact of precious metal production volumes and the impact of by-product credits on the Company’s cost structure. Cash costs per gold equivalent ounce on a by-product basis is calculated by applying copper and zinc net revenues, which are incidental to the production of precious metals, as a credit to the cost of gold equivalent ounce production and as such the by-product gold equivalent ounce cash costs are impacted by realized copper and zinc revenue, thereby allowing the Company’s management and stakeholders to assess net costs of precious metal production. These costs are then divided by gold equivalent ounces produced. Gold equivalent ounces are determined by converting silver production to its gold equivalent using relative gold/silver metal prices at an assumed ratio and adding the converted silver production expressed in gold ounces to the ounces of gold production. Cash costs on a co-product basis are also presented. Cash costs on a co-product basis do not reflect a reduction in costs for costs associated with non-precious metals.
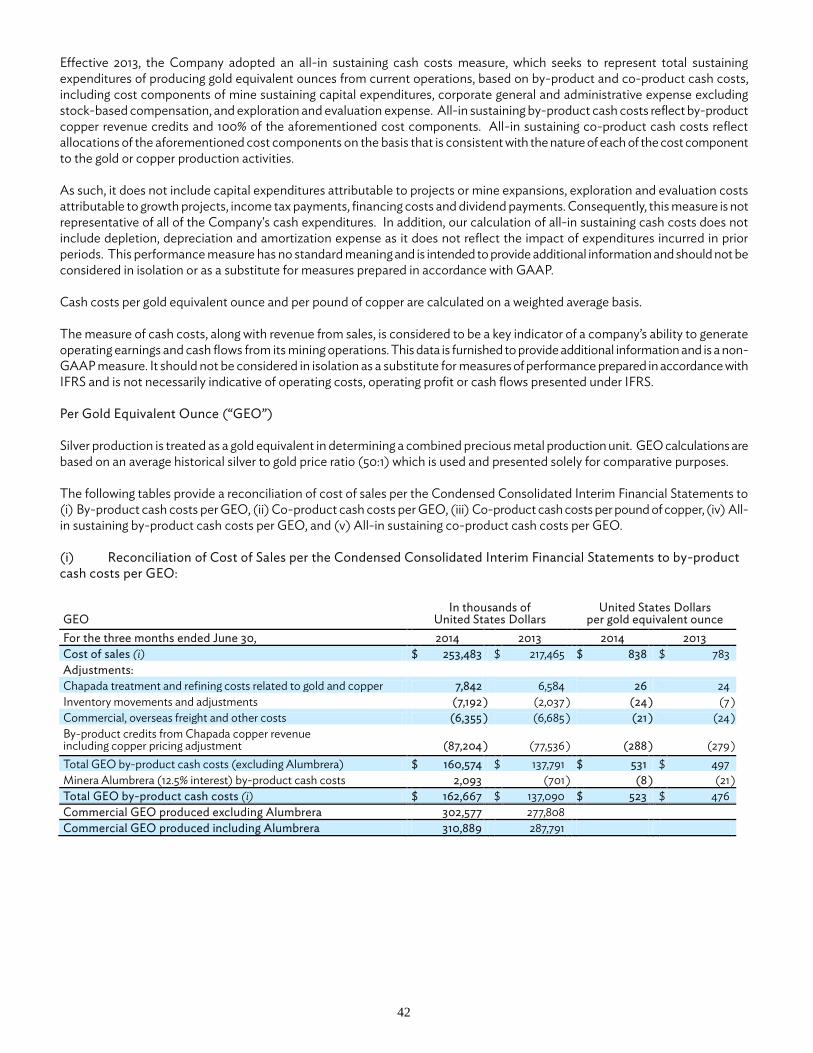
42
Effective 2013, the Company adopted an all-in sustaining cash costs measure, which seeks to represent total sustaining expenditures of producing gold equivalent ounces from current operations, based on by-product and co-product cash costs, including cost components of mine sustaining capital expenditures, corporate general and administrative expense excluding stock-based compensation, and exploration and evaluation expense. All-in sustaining by-product cash costs reflect by-product copper revenue credits and 100% of the aforementioned cost components. All-in sustaining co-product cash costs reflect allocations of the aforementioned cost components on the basis that is consistent with the nature of each of the cost component to the gold or copper production activities. As such, it does not include capital expenditures attributable to projects or mine expansions, exploration and evaluation costs attributable to growth projects, income tax payments, financing costs and dividend payments. Consequently, this measure is not representative of all of the Company's cash expenditures. In addition, our calculation of all-in sustaining cash costs does not include depletion, depreciation and amortization expense as it does not reflect the impact of expenditures incurred in prior periods. This performance measure has no standard meaning and is intended to provide additional information and should not be considered in isolation or as a substitute for measures prepared in accordance with GAAP. Cash costs per gold equivalent ounce and per pound of copper are calculated on a weighted average basis. The measure of cash costs, along with revenue from sales, is considered to be a key indicator of a company’s ability to generate operating earnings and cash flows from its mining operations. This data is furnished to provide additional information and is a non-GAAP measure. It should not be considered in isolation as a substitute for measures of performance prepared in accordance with IFRS and is not necessarily indicative of operating costs, operating profit or cash flows presented under IFRS. Per Gold Equivalent Ounce (“GEO”) Silver production is treated as a gold equivalent in determining a combined precious metal production unit. GEO calculations are based on an average historical silver to gold price ratio (50:1) which is used and presented solely for comparative purposes. The following tables provide a reconciliation of cost of sales per the Condensed Consolidated Interim Financial Statements to (i) By-product cash costs per GEO, (ii) Co-product cash costs per GEO, (iii) Co-product cash costs per pound of copper, (iv) All-in sustaining by-product cash costs per GEO, and (v) All-in sustaining co-product cash costs per GEO. (i) Reconciliation of Cost of Sales per the Condensed Consolidated Interim Financial Statements to by-product cash costs per GEO:
GEO In thousands of
United States Dollars United States Dollars
per gold equivalent ounce For the three months ended June 30, 2014 2013 2014 2013 Cost of sales (i) $ 253,483 $ 217,465 $ 838 $ 783 Adjustments: Chapada treatment and refining costs related to gold and copper 7,842 6,584 26 24 Inventory movements and adjustments (7,192 ) (2,037 ) (24 ) (7 ) Commercial, overseas freight and other costs (6,355 ) (6,685 ) (21 ) (24 ) By-product credits from Chapada copper revenue including copper pricing adjustment (87,204 ) (77,536 ) (288 ) (279 ) Total GEO by-product cash costs (excluding Alumbrera) $ 160,574 $ 137,791 $ 531 $ 497 Minera Alumbrera (12.5% interest) by-product cash costs 2,093 (701 ) (8 ) (21 ) Total GEO by-product cash costs (i) $ 162,667 $ 137,090 $ 523 $ 476 Commercial GEO produced excluding Alumbrera 302,577 277,808 Commercial GEO produced including Alumbrera 310,889 287,791

43
GEO In thousands of
United States Dollars United States Dollars
per gold equivalent ounce For the six months ended June 30, 2014 2013 2014 2013 Cost of sales (i) $ 462,348 $ 448,207 $ 856 $ 805 Adjustments: Chapada treatment and refining costs related to gold and copper 15,749 14,926 29 27 Inventory movements and adjustments (3,245 ) (14,663 ) (7 ) (26 ) Commercial, overseas freight and other costs (19,546 ) (15,889 ) (36 ) (29 ) By-product credits from Chapada copper revenue including copper pricing adjustment (168,804 ) (181,182 ) (312 ) (325 ) Total GEO by-product cash costs (excluding Alumbrera) $ 286,502 $ 251,399 $ 530 $ 452 Minera Alumbrera (12.5% interest) by-product cash costs (12,198 ) (3,641 ) (39 ) (22 ) Total GEO by-product cash costs (i) $ 274,304 $ 247,758 $ 491 $ 430 Commercial GEO produced excluding Alumbrera 540,254 556,789 Commercial GEO produced including Alumbrera 558,680 574,995
______________________________ (i) Cost of sales includes non-cash items including the impact of the movement in inventory. (ii) Depletion, depreciation and amortization are excluded from both total cash costs and cost of sales.
(ii) Reconciliation of cost of sales per the Condensed Consolidated Interim Financial Statements to co-product cash costs per GEO:
GEO In thousands of
United States Dollars United States Dollars
per gold equivalent ounce For the three months ended June 30, 2014 2013 2014 2013 Cost of sales (i) (iii) $ 253,483 $ 217,465 $ 838 $ 782 Adjustments: Copper contained in concentrate related cash costs (excluding related TCRC’s) (ii) (49,848 ) (47,381 ) (165 ) (171 ) Treatment and refining costs (“TCRC”) related to Chapada gold (138 ) 927 — 3 Inventory movements and adjustments (6,915 ) (1,873 ) (23 ) (7 ) Commercial, overseas freight and other costs (6,355 ) (6,685 ) (21 ) (24 ) Total GEO co-product cash costs (excluding Alumbrera) $ 190,227 $ 162,453 $ 629 $ 583 Minera Alumbrera (12.5% interest) GEO cash costs 3,267 3,780 (7 ) (6 ) Total GEO co-product cash costs (iii) $ 193,494 $ 166,233 $ 622 $ 577 Commercial GEO produced excluding Alumbrera 302,577 277,808 Commercial GEO produced including Alumbrera 310,889 287,791
GEO In thousands of
United States Dollars United States Dollars
per gold equivalent ounce For the six months ended June 30, 2014 2013 2014 2013 Cost of sales (i) (iii) $ 462,348 $ 448,207 $ 856 $ 805 Adjustments: Copper contained in concentrate related cash costs (excluding related TCRC’s) (ii) (92,603 ) (92,109 ) (171 ) (165 ) Treatment and refining costs (“TCRC”) related to Chapada gold 188 2,180 — 4 Inventory movements and adjustments (4,818 ) (14,663 ) (9 ) (26 ) Commercial, overseas freight and other costs (19,546 ) (15,889 ) (36 ) (29 ) Total GEO co-product cash costs (excluding Alumbrera) $ 345,569 $ 327,726 $ 640 $ 589 Minera Alumbrera (12.5% interest) GEO cash costs 6,390 7,037 (10 ) (7 ) Total GEO co-product cash costs (iii) $ 351,959 $ 334,763 $ 630 $ 582 Commercial GEO produced excluding Alumbrera 540,254 556,789 Commercial GEO produced including Alumbrera 558,680 574,995
_____________________________
(i) Cost of sales includes non-cash items including the impact of the movement in inventory.

44
(ii) Costs directly attributed to a specific metal are allocated to that metal. Costs not directly attributed to a specific metal are allocated based on relative value. As a rule of thumb, the relative value has been 80/75% copper and 20/25% gold. TCRC’s are defined as treatment and refining charges.
(iii) Depletion, depreciation and amortization are excluded from both total cash costs and cost of sales.
(iii) Reconciliation of cost of sales per the Condensed Consolidated Interim Financial Statements to co-product cash costs per pound of copper:
Copper In thousands of
United States Dollars United States Dollars per pound of copper
For the three months ended June 30, 2014 2013 2014 2013 Cost of sales (i) (iii) $ 253,483 $ 217,465 $ 7.69 $ 7.21 Adjustments: GEO related cash costs (excluding related TCRC’s) (ii) (190,460 ) (161,361 ) (5.78 ) (5.36 ) TCRC related to Chapada copper 7,732 5,492 0.23 0.18 Inventory movements and adjustments (6,679 ) (1,873 ) (0.20 ) (0.06 ) Commercial, overseas freight and other costs (6,355 ) (6,685 ) (0.19 ) (0.22 ) Total copper co-product cash costs (excluding Alumbrera) $ 57,721 $ 53,038 $ 1.75 $ 1.75 Minera Alumbrera (12.5% interest) copper cash costs 14,927 17,219 0.09 0.13 Total copper co-product cash costs (iii) $ 72,648 $ 70,257 $ 1.84 $ 1.88 Commercial copper produced excluding Alumbrera (millions of lbs) 33.0
30.1
Commercial copper produced including Alumbrera (millions of lbs) 39.4
37.3
Copper In thousands of
United States Dollars United States Dollars per pound of copper
For the six months ended June 30, 2014 2013 2014 2013 Cost of sales (i) (iii) $ 462,348 $ 448,207 $ 7.64 $ 7.79 Adjustments: GEO related cash costs (excluding related TCRC’s) (ii) (345,575 ) (325,381 ) (5.71 ) (5.67 ) TCRC related to Chapada copper 15,542 12,746 0.26 0.22 Inventory movements and adjustments (4,239 ) (14,663 ) (0.08 ) (0.26 ) Commercial, overseas freight and other costs (19,546 ) (15,889 ) (0.32 ) (0.28 ) Total copper co-product cash costs (excluding Alumbrera) $ 108,530 $ 105,020 $ 1.79 $ 1.80 Minera Alumbrera (12.5% interest) copper cash costs 32,137 32,303 0.11 0.13 Total copper co-product cash costs (iii) $ 140,667 $ 137,323 $ 1.90 $ 1.93 Commercial copper produced excluding Alumbrera (millions of lbs) 60.5
57.5
Commercial copper produced including Alumbrera (millions of lbs) 74.1
70.9
______________________________
(i) Cost of sales includes non-cash items including the impact of the movement in inventory. (ii) Costs directly attributed to a specific metal are allocated to that metal. Costs not directly attributed to a specific metal are allocated based on relative
value. As a rule of thumb, the relative value has been 80/75% copper and 20/25% gold. TCRC’s are defined as treatment and refining charges. (iii) Depletion, depreciation and amortization are excluded from both total cash costs and cost of sales.
(iv) All-in sustaining cash costs per GEO on a by-product basis:
GEO In thousands of
United States Dollars United States Dollars
per GEO For the three months ended June 30, 2014 2013 2014 2013 Total GEO by-product cash costs (i) $ 162,667 $ 137,090 $ 523 $ 476 General and administrative, excluding share-based compensation (ii) 30,425 31,432 98 109 Sustaining capital expenditures (ii) 71,091 87,415 229 304 Exploration and evaluation expense (ii) 4,292 7,748 14 27 Total all-in sustaining by-product cash costs per GEO $ 268,475 $ 263,685 $ 864 $ 916 Commercial GEO produced including Alumbrera 310,889 287,791

45
GEO In thousands of
United States Dollars United States Dollars
per GEO For the six months ended June 30, 2014 2013 2014 2013 Total GEO by-product cash costs (i) $ 274,304 $ 247,594 $ 491 $ 430 General and administrative, excluding share-based compensation (ii) 57,790 62,262 103 107 Sustaining capital expenditures (ii) 130,568 185,433 234 322 Exploration and evaluation expense (ii) 8,891 14,652 16 25 Total all-in sustaining by-product cash costs per GEO $ 471,553 $ 509,941 $ 844 $ 884 Commercial GEO produced including Alumbrera 558,680 574,995
___________ (i) Chapada copper revenue credits reflected in GEO by-product cash costs. (ii) 100% of the cost component is included.
(v) All-in sustaining cash costs per GEO on a co-product basis:
GEO In thousands of
United States Dollars United States Dollars
per GEO For the three months ended June 30, 2014 2013 2014 2013 Total GEO co-product cash costs $ 193,494 $ 166,233 $ 622 $ 577 General and administrative, excluding share-based compensation (i) 24,715 25,237 79 88 Sustaining capital expenditures (ii) 62,777 74,950 203 260 Exploration and evaluation expense (i) 3,483 7,180 11 25 Total all-in sustaining co-product cash costs per GEO $ 284,469 $ 273,600 $ 915 $ 950 Commercial GEO produced including Alumbrera 310,889 287,791
GEO In thousands of
United States Dollars United States Dollars
per GEO For the six months ended June 30, 2014 2013 2014 2013 Total GEO co-product cash costs $ 351,959 $ 334,599 $ 630 $ 582 General and administrative, excluding share-based compensation (i) 46,803 49,489 84 86 Sustaining capital expenditures (ii) 119,833 166,857 215 290 Exploration and evaluation expense (i) 7,500 13,862 13 24 Total all-in sustaining co-product cash costs per GEO $ 526,095 $ 564,807 $ 942 $ 982 Commercial GEO produced including Alumbrera 558,680 574,995
___________ (i) Chapada's general and administrative ("G&A") expense and exploration expense are allocated 20% to gold and 80% to copper, reflecting costs
incurred on the related activities at Chapada. G&A and exploration expenses of all other operations are allocated 80% to gold and 20% to copper based on the relative proportions of consolidated revenues from gold and copper sales.
(ii) Chapada's sustaining capital expenditures are allocated 20% to gold and 80% to copper, reflecting costs incurred on the related activities at Chapada. Sustaining capital expenditures of all other operations are allocated 100% to gold.
ADJUSTED EARNINGS OR LOSS AND ADJUSTED EARNINGS OR LOSS PER SHARE The Company uses the financial measures “Adjusted Earnings or Loss” and “Adjusted Earnings or Loss per share” to supplement information in its consolidated financial statements. The Company believes that in addition to conventional measures prepared in accordance with IFRS, the Company and certain investors and analysts use this information to evaluate the Company’s performance. The presentation of adjusted measures are not meant to be a substitute for net earnings or loss or net earnings or loss per share presented in accordance with IFRS, but rather should be evaluated in conjunction with such IFRS measures. Adjusted Earnings or Loss and Adjusted Earnings or Loss per share are calculated as net earnings excluding (a) share-based payments and other compensation, (b) unrealized foreign exchange (gains) losses related to revaluation of deferred income tax asset and liability on non-monetary items, (c) unrealized foreign exchange (gains) losses related to other items, (d) unrealized (gains) losses on commodity derivatives, (e) impairment losses and reversals, (f) deferred income tax expense (recovery) on the translation of foreign currency inter-corporate debt, (g) mark-to-market (gains) losses on share-purchase warrants, (h) write-down of investments and other assets (i) mark-to-market (gains) losses on revaluation of convertible debt and any other non-recurring adjustments. Non-recurring adjustments from unusual events or circumstances are reviewed from time to time based on materiality and the nature of the event or circumstance. Earnings adjustments for the comparative period reflect both continuing and discontinued operations.
46
The terms “Adjusted Earnings or Loss” and “Adjusted Earnings or Loss per share” do not have a standardized meaning prescribed by IFRS, and therefore the Company’s definitions are unlikely to be comparable to similar measures presented by other companies. Management believes that the presentation of Adjusted Earnings or Loss and Adjusted Earnings or Loss per share provide useful information to investors because they exclude non-cash and other charges and are a better indication of the Company’s profitability from operations. The items excluded from the computation of Adjusted Earnings or Loss and Adjusted Earnings or Loss per share, which are otherwise included in the determination of net earnings or loss and net earnings or loss per share prepared in accordance with IFRS, are items that the Company does not consider to be meaningful in evaluating the Company’s past financial performance or the future prospects and may hinder a comparison of its period-to-period profitability. Reconciliation of Adjusted Earnings to net earnings is provided in Section 5.1, Overview of Financial Results for the six months ended June 30, 2014. ADJUSTED CASH FLOWS The Company uses the financial measures “Adjusted Cash Flows" to supplement information in its consolidated financial statements. The Company believes that in addition to conventional measures prepared in accordance with IFRS, the Company and certain investors and analysts use this information to evaluate the Company’s performance. The presentation of Adjusted Cash Flows is not meant to be a substitute for the cash flows information presented in accordance with IFRS, but rather should be evaluated in conjunction with such IFRS measures. Adjusted Cash Flows is calculated as the sum of cash flows from operating activities before non-cash working capital and the transaction costs related to the Company's acquisition of 50% interest of Osisko. A reconciliation of the non-GAAP measure is provided in Section 5.1 Overview of Financial Results. ADDITIONAL MEASURES The Company uses other financial measures the presentation of which is not meant to be a substitute for other subtotals or totals presented in accordance with IFRS, but rather should be evaluated in conjunction with such IFRS measures. The following other financial measures are used:
• Gross margin - represents the amount of revenues in excess of cost of sales excluding depletion, depreciation and amortization.
• Mine operating earnings - represents the amount of revenues in excess of cost of sales excluding depletion, depreciation and amortization and depletion, depreciation and amortization.
• Operating earnings - represents the amount of earnings before net finance income/expense and income tax expense.
• Cash flows from operating activities before changes in non-cash working capital — excludes the non-cash movement from period-to-period in working capital items including trade and other receivables, other assets, inventories, trade and other payables.
The terms described above do not have a standardized meaning prescribed by IFRS, and therefore the Company’s definitions are unlikely to be comparable to similar measures presented by other companies. The Company’s management believes that their presentation provides useful information to investors because gross margin excludes the non-cash operating cost item (i.e. depreciation, depletion and amortization), cash flows from operating activities before changes in non-cash working capital excludes the non-cash movement in working capital items, mine operating earnings excludes expenses not directly associate with commercial production and operating earnings excludes finance and tax related expenses and income/recoveries. These, in management’s view, provide useful information of the Company’s cash flows from operating activities and are considered to be meaningful in evaluating the Company’s past financial performance or the future prospects.

47
14. SELECTED QUARTERLY FINANCIAL AND OPERATING SUMMARY June 30, March 31, December 31, September 30, (In thousands of United States Dollars, unless otherwise noted) 2014 2014 2013 2013 Financial results
Revenues (i) $ 450,832 $ 353,916 $ 420,663 $ 456,675 Mine operating earnings $ 74,807 $ 33,101 $ 70,113 $ 144,010 Net (loss)/earnings attributed to Yamana equity holders $ 5,105 $ (29,608 ) $ (583,936 ) $ 43,450 Adjusted earnings (ii) $ 43,306 $ 12,100 $ 36,719 $ 69,530 Cash flows from operating activities $ 148,503 $ 38,977 $ 184,845 $ 99,078 Cash flows from operating activities before changes in non-cash working capital (ii) $ 144,838
$ 93,622
$ 165,315
$ 177,416
Cash flows to investing activities $ (658,909 ) $ (147,506 ) $ (259,992 ) $ (217,601 ) Cash flows from (to) financing activities operations $ 419,276 $ 97,192 $ 66,711 $ (27,308 ) Per share financial results
Net earnings/(loss) per share attributable to Yamana equity holders
Basic and diluted $ 0.01 $ (0.04 ) $ (0.78 ) $ 0.06 Adjusted earnings per share (ii)
Basic and diluted $ 0.05 $ 0.02 $ 0.05 $ 0.09 Financial position
Cash and cash equivalents $ 174,498 $ 209,764 $ 220,018 $ 232,125 Total assets $ 13,473,735 $ 11,375,496 $ 11,410,717 $ 12,026,181 Total long term liabilities $ 4,678,011 $ 3,717,249 $ 3,615,242 $ 3,589,579
Production
Commercial GEO produced (iii) 310,889 247,792 277,447 289,176 Commissioning GEO produced (iii)(iv) 20,876 24,116 26,321 17,758 Total GEO produced (iii) 331,765 271,908 303,768 306,934 By-product cash costs per GEO produced, including 12.5% equity interest in Alumbrera (ii)(iii) $ 523
$ 450
$ 417
$ 365
Co-product cash costs per GEO produced, including 12.5% equity interest in Alumbrera (ii)(iii) $ 622
$ 640
$ 647
$ 574
All-in by-product cash costs per GEO produced, including 12.5% equity interest in Alumbrera (ii)(iii) $ 864
$ 820
$ 754
$ 730
All-in co-product cash costs per GEO produced, including 12.5% equity interest in Alumbrera (ii)(iii) $ 915
$ 975
$ 935
$ 888
Chapada concentrate production (tonnes) 60,975 51,570 67,395 67,315 Chapada copper contained in concentrate production (millions of pounds) 33.0
27.6
36.0
36.8
Chapada co-product cash costs per pound of copper $ 1.75 $ 1.84 $ 1.53 $ 1.48 Alumbrera (12.5% interest) attributable concentrate production (tonnes) 11,188
12,610
17,547
13,179
Alumbrera (12.5% interest) attributable copper contained in concentrate production (millions of pounds) 6.4
7.2
9.6
7.1
Alumbrera co-product cash costs per pound of copper (ii) 2.32 2.40 1.75 2.45 Gold Equivalent Ounces Breakdown
Total gold ounces produced 284,366 204,255 260,187 263,830 Total silver ounces produced (millions of ounces) 2.4 2.2 2.2 2.2 Sales Included in Revenue Total GEO sales, excluding 12.5% interest in Alumbrera (iii) 297,467 236,561 260,568 275,447 Total gold sales (ounces) 253,111 192,587 218,223 232,284 Total silver sales (millions of ounces) 2.2 2.2 2.1 2.2 Chapada concentrate sales (tonnes) 56,010 48,747 67,616 68,512 Chapada payable copper contained in concentrate sales (millions of pounds) 28.7
25.4
34.5
35.7
Average realized gold price per ounce (i) $ 1,292 $ 1,300 $ 1,277 $ 1,332 Average realized copper price per pound (i) $ 3.11 $ 3.25 $ 3.37 $ 3.13 Average realized silver price per ounce (i) $ 19.81 $ 20.43 $ 20.63 $ 21.45

48
June 30, March 31, December 31, September 30, (in thousands of United States Dollars) 2013 2013 2012 2012 Financial results
Revenues (i) $ 430,471 $ 534,873 $ 629,505 $ 611,807 Mine operating earnings $ 118,646 $ 208,009 $ 322,082 $ 279,158 Net (loss)/earnings attributed to Yamana equity holders $ (7,898 ) $ 102,096 $ 169,161 $ 59,965 Adjusted earnings (ii) $ 50,181 $ 116,980 $ 197,368 $ 177,588 Cash flows from operating activities operations $ 195,418 $ 173,801 $ 367,881 $ 363,059 Cash flows from operating activities before changes in non-cash working capital (ii) $ 150,918
$ 214,219
$ 298,064
$ 285,696
Cash flows to investing activities $ (300,368 ) $ (275,452 ) $ (375,544 ) $ (619,134 ) Cash flows from (to) financing activities $ 150,089 $ 94,350 $ (44,467 ) $ (42,678 ) Per share financial results
Net (loss)/earnings per share attributable to Yamana equity holders Basic $ (0.01 ) $ 0.14 $ 0.23 $ 0.08
Diluted $ (0.01 ) $ 0.14 $ 0.22 $ 0.08 Adjusted earnings per share (ii)
Basic and diluted $ 0.07 $ 0.16 $ 0.26 $ 0.24 Financial position
Cash and cash equivalents $ 379,817 $ 342,596 $ 349,594 $ 400,419 Total assets $ 11,960,854 $ 11,806,864 $ 11,800,163 $ 11,495,917 Total long term liabilities $ 3,593,059 $ 3,341,054 $ 3,269,266 $ 3,248,086 Production
Commercial GEO produced (iii) 287,791 287,203 321,716 308,629 Commissioning GEO produced (iii) (iv) 7,754 4,109 1,274 1,861 Total GEO produced (iii) 295,545 291,312 322,990 310,490 By-product cash costs per GEO produced, including 12.5% equity interest in Alumbrera (ii)(iii) $ 476
$ 383
$ 198
$ 201
Co-product cash costs per GEO produced, including 12.5% equity interest in Alumbrera (ii)(iii) $ 577
$ 587
$ 517
$ 531
All-in by-product cash costs per GEO produced, including 12.5% equity interest in Alumbrera (ii)(iii) 916
855
n/a n/a
All-in co-product cash costs per GEO produced, including 12.5% equity interest in Alumbrera (ii)(iii) 950
1,014
n/a n/a
Chapada concentrate production (tonnes) 55,511 49,591 72,518 70,151 Chapada copper contained in concentrate production (millions of pounds) 30.1
27.4
40.5
39.4
Chapada co-product cash costs per pound of copper $ 1.76 $ 1.90 $ 1.38 $ 1.38 Alumbrera (12.5% interest) attributable concentrate production (tonnes) 13,129
11,260
14,669
17,830
Alumbrera (12.5% interest) attributable copper contained in concentrate production (millions of pounds) 7.2
6.3
8.5
10.4
Alumbrera co-product cash costs per pound of copper (ii) 2.40 2.40 2.15 1.92 Gold Equivalent Ounces Breakdown
Total gold ounces produced 257,608 248,239 276,373 266,374 Total silver ounces produced (millions of ounces) 1.9 2.2 2.3 2.2 Sales Included in Revenue
Total GEO sales, excluding 12.5% interest in Alumbrera (iii) 270,207 284,872 304,070 297,406 Total gold sales (ounces) 233,714 241,259 258,978 252,813 Total Silver sales (millions of ounces) 1.8 2.2 2.3 2.2 Chapada concentrate sales (tonnes) 50,728 55,826 69,589 69,694 Chapada payable copper contained in concentrate sales (millions of pounds) 26.7
29.1
37.3
37.1
Average realized gold price per ounce (i) $ 1,385 $ 1,620 $ 1,692 $ 1,680 Average realized copper price per pound (i) $ 3.05 $ 3.58 $ 3.54 $ 3.54 Average realized silver price per ounce (i) $ 22.55 $ 29.81 $ 31.37 $ 30.76
______________________________ (i) Revenues consist of sales net of sales taxes. Revenue per ounce data is calculated based on gross sales. Realized prices reflect continuing operations. (ii) A cautionary note regarding non-GAAP measures is included in Section 13 of this Management’s Discussion and Analysis of Operations and Financial
Condition.
49
(iii) GEO assumes gold plus the gold equivalent of silver using a ratio of 50:1. (iv) Including commissioning GEO from Minera Florida's tailings retreatment project, Ernesto/Pau-a-Pique, C1 Santa Luz and Pilar.
15. DISCLOSURE CONTROLS AND PROCEDURES Disclosure controls and procedures are designed to provide reasonable assurance that all relevant information is gathered and reported to senior management, including the Company’s Chairman and Chief Executive Officer and Executive Vice President, Finance and Chief Financial Officer, on a timely basis so that appropriate decisions can be made regarding public disclosure. The Company’s system of disclosure controls and procedures includes, but is not limited to, our Timely Disclosure and Confidentiality Policy, our Code of Conduct, our Insider Trading Policy, our Corporate Controls Policy, the effective functioning of our Audit Committee and procedures in place to systematically identify matters warranting consideration of disclosure by the Audit Committee. As at the end of the period covered by this Management’s Discussion and Analysis, management of the Company, with the participation of the Chairman and Chief Executive Officer and the Executive Vice President, Finance and Chief Financial Officer, evaluated the effectiveness of the Company’s disclosure controls and procedures as required by applicable rules of the Canadian Securities Administrators (or Canadian securities regulatory authorities). The evaluation included documentation review, enquiries and other procedures considered by management to be appropriate in the circumstances. Based on that evaluation, the Chairman and Chief Executive Officer and the Executive Vice President, Finance and Chief Financial Officer have concluded that, as of the end of the period covered by this management’s discussion and analysis, the disclosure controls and procedures (as defined in Rule 13a-15(e) under the Securities Exchange Act of 1934) were effective to provide reasonable assurance that information required to be disclosed in the Company’s annual filings and interim filings and other reports filed or submitted under applicable securities laws, is recorded, processed, summarized and reported within time periods specified by those laws and that material information is accumulated and communicated to management of the Company, including the Chairman and Chief Executive Officer and the Executive Vice President, Finance and Chief Financial Officer, as appropriate to allow timely decisions regarding required disclosure. MANAGEMENT’S REPORT ON INTERNAL CONTROL OVER FINANCIAL REPORTING Management of the Company is responsible for establishing and maintaining effective internal control over financial reporting as such term is defined in the rules of the United States Securities and Exchange Commission and the Canadian Securities Administrators. The Company’s internal control over financial reporting is designed to provide reasonable assurance regarding the reliability of the Company’s financial reporting for external purposes in accordance with IFRS. The Company’s internal control over financial reporting includes:
• maintaining records, that in reasonable detail, accurately and fairly reflect our transactions and dispositions of the assets of the Company;
• providing reasonable assurance that transactions are recorded as necessary for preparation of our consolidated financial statements in accordance with generally accepted accounting principles;
• providing reasonable assurance that receipts and expenditures are made in accordance with authorizations of management and the directors of the Company; and
• providing reasonable assurance that unauthorized acquisition, use or disposition of Company assets that could have a material effect on the Company’s consolidated financial statements would be prevented or detected on a timely basis.
The Company’s internal control over financial reporting may not prevent or detect all misstatements because of inherent limitations. Additionally, projections of any evaluation of effectiveness to future periods are subject to the risk that controls may become inadequate because changes in conditions or deterioration in the degree of compliance with the Company’s policies and procedures. CHANGES IN INTERNAL CONTROLS During the period ended June 30, 2014, there has been no change in the Company’s internal control over financial reporting that has materially affected, or is reasonably likely to materially affect, the Company’s internal control over financial reporting.

50
LIMITATIONS OF CONTROLS AND PROCEDURES The Company’s management, including the Chairman and Chief Executive Officer and the Executive Vice President, Finance and Chief Financial Officer, believe that any disclosure controls and procedures or internal controls over financial reporting, no matter how well conceived and operated, can provide only reasonable, not absolute, assurance that the objectives of the control system are met. Further, the design of a control system must reflect the fact that there are resource constraints, and the benefits of controls must be considered relative to their costs. Because of the inherent limitations in all control systems, they cannot provide absolute assurance that all control issues and instances of fraud, if any, within the Company have been prevented or detected. These inherent limitations include the realities that judgments in decision-making can be faulty, and that breakdowns can occur because of simple error or mistake. Additionally, controls can be circumvented by the individual acts of some persons, by collusion of two or more people, or by unauthorized override of the control. The design of any systems of controls also is based in part upon certain assumptions about the likelihood of future events, and there can be no assurance that any design will succeed in achieving its stated goals under all potential future conditions. Accordingly, because of the inherent limitations in a cost effective control system, misstatements due to error or fraud may occur and not be detected. This report provides a discussion and analysis of the financial condition and results of operations (“Management’s Discussion and Analysis”) to enable a reader to assess material changes in financial condition between June 30, 2014 and December 31, 2013 and results of operations for the periods ended June 30, 2014 and June 30, 2013. This Management’s Discussion and Analysis has been prepared as of July 30, 2014. The Condensed Consolidated Interim Financial Statements prepared in accordance with IFRS as issued by the IASB follow this Management’s Discussion and Analysis. This Management’s Discussion and Analysis is intended to supplement and complement the annual audited consolidated financial statements and notes thereto as at and for the year ended December 31, 2013 (collectively the “Financial Statements”). You are encouraged to review the financial statements in conjunction with your review of this Management’s Discussion and Analysis. This Management’s Discussion and Analysis should be read in conjunction with both the annual audited consolidated financial statements for the year ended December 31, 2013 and the most recent Annual Information Form for the year ended December 31, 2013 on file with the Securities Commissions of all of the provinces in Canada, which are included in the 2013 Annual Report on Form 40-F on file with the United States Securities and Exchange Commission. Certain notes to the Financial Statements are specifically referred to in this Management’s Discussion and Analysis and such notes are incorporated by reference herein. All Dollar amounts in the Management’s Discussion and Analysis are in United States Dollars, unless otherwise specified. CAUTIONARY NOTE REGARDING FORWARD-LOOKING STATEMENTS This Management’s Discussion and Analysis contains or incorporates by reference “forward-looking statements” within the meaning of the United States Private Securities Litigation Reform Act of 1995 and “forward-looking information” under applicable Canadian securities legislation. Except for statements of historical fact relating to the Company, information contained herein constitutes forward-looking statements, including any information as to the Company’s strategy, plans or future financial or operating performance. Forward-looking statements are characterized by words such as “plan,” “expect”, “budget”, “target”, “project”, “intend”, “believe”, “anticipate”, “estimate” and other similar words, or statements that certain events or conditions “may” or “will” occur. Forward-looking statements are based on the opinions, assumptions and estimates of management considered reasonable at the date the statements are made, and are inherently subject to a variety of risks and uncertainties and other known and unknown factors that could cause actual events or results to differ materially from those projected in the forward-looking statements. These factors include the Company’s expectations in connection with the expected production and exploration, development and expansion plans at the Company's projects discussed herein being met, the impact of proposed optimizations at the Company's projects, the impact of the proposed new mining law in Brazil, and the impact of general business and economic conditions, global liquidity and credit availability on the timing of cash flows and the values of assets and liabilities based on projected future conditions, fluctuating metal prices (such as gold, copper, silver and zinc), currency exchange rates (such as the Brazilian Real, the Chilean Peso, the Argentine Peso and the Mexican Peso versus the United States Dollar), the impact of inflation, possible variations in ore grade or recovery rates, changes in the Company’s hedging program, changes in accounting policies, changes in mineral resources and mineral reserves, risks related to non-core mine disposition, risks related to acquisitions, changes in project parameters as plans continue to be refined, changes in project development, construction, production and commissioning time frames, risks related to joint venture operations, the possibility of project cost overruns or unanticipated costs and expenses, higher prices for fuel, steel, power, labour and other consumables contributing to higher costs and general risks of the mining industry, failure of plant, equipment or processes to operate as anticipated, unexpected changes in mine life, final pricing for concentrate sales, unanticipated results of future studies, seasonality and unanticipated weather changes, costs and timing of the development of new deposits, success of exploration activities, permitting time lines, government regulation and the risk of government expropriation or nationalization of mining operations, environmental risks, unanticipated reclamation expenses, title disputes or claims, limitations on insurance coverage

51
and timing and possible outcome of pending litigation and labour disputes, as well as those risk factors discussed or referred to herein and in the Company's Annual Information Form filed with the securities regulatory authorities in all provinces of Canada and available at www.sedar.com, and the Company’s Annual Report on Form 40-F filed with the United States Securities and Exchange Commission. Although the Company has attempted to identify important factors that could cause actual actions, events or results to differ materially from those described in forward-looking statements, there may be other factors that cause actions, events or results not to be anticipated, estimated or intended. There can be no assurance that forward-looking statements will prove to be accurate, as actual results and future events could differ materially from those anticipated in such statements. The Company undertakes no obligation to update forward-looking statements if circumstances or management’s estimates, assumptions or opinions should change, except as required by applicable law. The reader is cautioned not to place undue reliance on forward-looking statements. The forward-looking information contained herein is presented for the purpose of assisting investors in understanding the Company’s expected financial and operational performance and results as at and for the periods ended on the dates presented in the Company’s plans and objectives and may not be appropriate for other purposes. CAUTIONARY NOTE REGARDING MINERAL RESERVES AND MINERAL RESOURCES Readers should refer to the Annual Information Form of the Company for the year ended December 31, 2013 and other continuous disclosure documents filed by the Company since January 1, 2014 available at www.sedar.com, for further information on mineral reserves and mineral resources, which is subject to the qualifications and notes set forth therein. CAUTIONARY NOTE TO UNITED STATES INVESTORS CONCERNING ESTIMATES OF MINERAL RESERVES AND MINERAL RESOURCES This Management’s Discussion and Analysis has been prepared in accordance with the requirements of the securities laws in effect in Canada, which differ in certain material respects from the disclosure requirements of United States securities laws. The terms “mineral reserve”, “proven mineral reserve” and “probable mineral reserve” are Canadian mining terms as defined in accordance with Canadian National Instrument 43-101 Standards of Disclosure for Mineral Projects (“NI 43-101”) and the Canadian Institute of Mining, Metallurgy and Petroleum (the “CIM”) - CIM Definition Standards on Mineral Resources and Mineral Reserves, adopted by the CIM Council, as amended. These definitions differ from the definitions in the disclosure requirements promulgated by the Securities and Exchange Commission (the “Commission”) and contained in Industry Guide 7 (“Industry Guide 7”). Under Industry Guide 7 standards, a “final” or “bankable” feasibility study is required to report mineral reserves, the three-year historical average price is used in any mineral reserve or cash flow analysis to designate mineral reserves and the primary environmental analysis or report must be filed with the appropriate governmental authority. In addition, the terms “mineral resource”, “measured mineral resource”, “indicated mineral resource” and “inferred mineral resource” are defined in and required to be disclosed by NI 43-101. However, these terms are not defined terms under Industry Guide 7 and are not permitted to be used in reports and registration statements of United States companies filed with the Commission. Investors are cautioned not to assume that any part or all of the mineral deposits in these categories will ever be converted into mineral reserves. “Inferred mineral resources” have a great amount of uncertainty as to their existence, and great uncertainty as to their economic and legal feasibility. It cannot be assumed that all or any part of an inferred mineral resource will ever be upgraded to a higher category. Under Canadian rules, estimates of inferred mineral resources may not form the basis of feasibility or pre-feasibility studies, except in rare cases. Investors are cautioned not to assume that all or any part of an inferred mineral resource exists or is economically or legally mineable. Disclosure of “contained ounces” in a mineral resource is permitted disclosure under Canadian regulations. In contrast, the Commission only permits U.S. companies to report mineralization that does not constitute “mineral reserves” by Commission standards as in place tonnage and grade without reference to unit measures. Accordingly, information contained in this Management’s Discussion and Analysis may not be comparable to similar information made public by U.S. companies subject to the reporting and disclosure requirements under the United States federal securities laws and the rules and regulations of the Commission thereunder.
*************


![Puerto Rico Renewable Energy Development · Renewable Energy Designs, Inc_ - PR PresentationGeneral 3-27-12_ppt [Compatibility Mode] Created Date: 6/22/2012 4:03:44 PM](https://img.dokumen.tips/doc/110x75/5f5ea8728a153b039f1b0cd7/puerto-rico-renewable-energy-development-renewable-energy-designs-inc-pr-presentationgeneral.jpg)