Embed Size (px)
Citation preview

Florida International UniversityFIU Digital Commons
FIU Electronic Theses and Dissertations University Graduate School
7-12-2011
Exergoeconomic Analysis of Solar OrganicRankine Cycle for Geothermal Air ConditionedNet Zero Energy BuildingsRambod RayeganFlorida International University, [email protected]
DOI: 10.25148/etd.FI11080805Follow this and additional works at: https://digitalcommons.fiu.edu/etd
This work is brought to you for free and open access by the University Graduate School at FIU Digital Commons. It has been accepted for inclusion inFIU Electronic Theses and Dissertations by an authorized administrator of FIU Digital Commons. For more information, please contact [email protected].
Recommended CitationRayegan, Rambod, "Exergoeconomic Analysis of Solar Organic Rankine Cycle for Geothermal Air Conditioned Net Zero EnergyBuildings" (2011). FIU Electronic Theses and Dissertations. 470.https://digitalcommons.fiu.edu/etd/470
FLORIDA INTERNATIONAL UNIVERSITY
Miami, Florida
EXERGOECONOMIC ANALYSIS OF SOLAR ORGANIC RANKINE CYCLE FOR
GEOTHERMAL AIR CONDITIONED NET ZERO ENERGY BUILDINGS
A dissertation submitted in partial fulfillment of the
requirements for the degree of
DOCTOR OF PHILOSOPHY
in
MECHANICAL ENGINEERING
by
Rambod Rayegan
2011

ii
To: Dean Amir Mirmiran College of Engineering and Computing
This dissertation, written by Rambod Rayegan, and entitled Exergoeconomic Analysis of Solar Organic Rankine Cycle for Geothermal Air Conditioned Net Zero Energy Buildings, having been approved in respect to style and intellectual content, is referred to you for judgment. We have read this dissertation and recommend that it be approved.
_______________________________________ Ali Ebadian
_______________________________________
Yiding Cao
_______________________________________ Yimin Zhu
______________________________________
Yong X. Tao, Major Professor Date of Defense: July 12, 2011 The dissertation of Rambod Rayegan is approved.
_______________________________________ Dean Amir Mirmiran
College of Engineering and Computing
_______________________________________ Interim Dean Kevin O’Shea University Graduate School
Florida International University, 2011

iii
DEDICATION
I dedicate this dissertation to my parents and my wife for their never-ending love.

iv
ACKNOWLEDGMENTS
I am grateful to my major advisor Dr. Yong Tao for his support and guidance
throughout my studies. The discussions I had with Dr. Tao were a great source of
learning and encouragement for me. I am truly thankful for his patience, support and
valuable advices. I would also like to recognize and thank Dr. Ali Ebadian, Dr. Yiding
Cao and Dr. Yimin Zhu for serving on my advisory committee.
The work and its findings in this paper are made possible by the financial support
from US Department of Energy Geothermal Program under the Award No. DE-
EE0002802, which is greatly appreciated. Finally, I would like to acknowledge the
financial support of Florida International University Doctoral Evidence Acquisition
Fellowship.

v
ABSTRACT OF THE DISSERTATION
EXERGOECONOMIC ANALYSIS OF SOLAR ORGANIC RANKINE CYCLE FOR
GEOTHERMAL AIR CONDITIONED NET ZERO ENERGY BUILDINGS
by
Rambod Rayegan
Florida International University, 2011
Miami, Florida
Professor Yong X. Tao, Major Professor
This study is an attempt at achieving Net Zero Energy Building (NZEB) using a
solar Organic Rankine Cycle (ORC) based on exergetic and economic measures. The
working fluid, working conditions of the cycle, cycle configuration, and solar collector
type are considered the optimization parameters for the solar ORC system.
In the first section, a procedure is developed to compare ORC working fluids
based on their molecular components, temperature-entropy diagram and fluid effects on
the thermal efficiency, net power generated, vapor expansion ratio, and exergy efficiency
of the Rankine cycle. Fluids with the best cycle performance are recognized in two
different temperature levels within two different categories of fluids: refrigerants and
non-refrigerants. Important factors that could lead to irreversibility reduction of the solar
ORC are also investigated in this study.
In the next section, the system requirements needed to maintain the electricity
demand of a geothermal air-conditioned commercial building located in Pensacola of
Florida is considered as the criteria to select the optimal components and optimal
working condition of the system. The solar collector loop, building, and geothermal air

vi
conditioning system are modeled using TRNSYS. Available electricity bills of the
building and the 3-week monitoring data on the performance of the geothermal system
are employed to calibrate the simulation. The simulation is repeated for Miami and
Houston in order to evaluate the effect of the different solar radiations on the system
requirements.
The final section discusses the exergoeconomic analysis of the ORC system with
the optimum performance. Exergoeconomics rests on the philosophy that exergy is the
only rational basis for assigning monetary costs to a system’s interactions with its
surroundings and to the sources of thermodynamic inefficiencies within it.
Exergoeconomic analysis of the optimal ORC system shows that the ratio Rex of the
annual exergy loss to the capital cost can be considered a key parameter in optimizing a
solar ORC system from the thermodynamic and economic point of view. It also shows
that there is a systematic correlation between the exergy loss and capital cost for the
investigated solar ORC system.

vii
TABLE OF CONTENTS
CHAPTER PAGE
1. INTRODUCTION ...........................................................................................................1 1.1 Research Background .................................................................................................1 1.2 Exergoeconomic Point of View .................................................................................4 1.3 Objectives and Significance of Study ........................................................................5 1.4 Framework of the Research ........................................................................................6
2. A CRITICAL REVIEW ON SINGLE COMPONENT WORKING FLUIDS FOR ORGANIC RANKINE CYCLES (ORCs)...........................................................................9
2.1 Introduction ................................................................................................................9 2.2 General criteria for Selecting Working Fluids in ORC ............................................10 2.3 Studies Based on Critical Temperature ....................................................................14 2.4 Studies Based on Molecular Complexity .................................................................18 2.5 Comparison in Efficiency among Selected Fluids ...................................................22 2.6 ORCs at Supercritical Region ..................................................................................27 2.7 Major Findings .........................................................................................................28
3. A PROCEDURE TO SELECT WORKING FLUIDS FOR SOLAR ORGANIC RANKINE CYCLES .........................................................................................................35
3.1. Introduction .............................................................................................................35 3.2. Preliminary Selection ..............................................................................................36 3.3. Thermodynamic cycle .............................................................................................37 3.4. Analysis ...................................................................................................................42
3.4.1 Basic cycle ........................................................................................................ 42 3.4.2 Regenerative cycle ............................................................................................ 49
3.5. Results and discussion .............................................................................................51 3.5.1. Dominant factors influencing the performance of an ORC ............................. 51 3.5.2. Maximum thermal efficiency of the ORC for different working fluids .......... 52 3.5.3. Comparing procedure of preselected working fluids ...................................... 54 3.5.4. Exergy efficiency enhancement in a solar ORC .............................................. 60
3.6. Conclusions .............................................................................................................68 4. EXERGOECONOMIC ANALYSIS OF SOLAR ORGANIC RANKINE CYCLE FOR A BUILDING IN HOT AND HUMID CLIMATE ..................................................72
4.1 Introduction ............................................................................................................722 4.2 TRNSYS Software ...................................................................................................73 4.3 Building and GSHP System Description .................................................................74 4.4 Building and GSHP System Modeling Details ........................................................75 4.5 Calibration Procedure ...............................................................................................80 4.6 ORC System Modeling Details ................................................................................84 4.7 The Optimal Solar ORC Components and Working Condition ...............................89 4.8 Solar Radiation Intensity Effect on the Solar ORC Performance ............................95

viii
4.9 Economic Comparison between the Solar ORC and PV Panel System ...................98 4.10 Exergoeconomic Analysis of the Optimal Solar ORC System ............................104 4.11 Conclusions ..........................................................................................................108
5. CONCLUSIONS AND FUTURE WORK ..................................................................110
5.1 Conclusions ............................................................................................................110
5.1 Future work ............................................................................................................115
LIST OF REFERENCES .................................................................................................116
VITA ................................................................................................................................119

ix
LIST OF TABLES
TABLE PAGE
Table 2.1 Optimization results for a regenerative biomass ORC (Drescher and Bruggemann, 2007)........................................................................................................... 16 Table 2.2 Optimization results for a regenerative waste heat ORC for fluids with different molecular complexity (Invernizzi et al., 2007) ................................................................. 21 Table 2.3 Summary of the most important characteristics of the fluids and cycle for selected fluids.................................................................................................................... 31 Table 2.3 Summary of the most important characteristics of the fluids and cycle for selected fluids (Continued) ............................................................................................... 32 Table 3.1 Preselected working fluids ................................................................................ 38 Table 3.2 Practical limits of the ORC for preselected working fluids .............................. 41 Table 3.3 Values of the coefficients for the thermal loss coefficient of the LS-3 PTC absorber tube [Delgado-Torres and Garcia-Rodriguez (2007a)] ...................................... 48 Table 3.4 Maximum delivery of an ORC employing different working fluids ................ 53 Table 3.5 Regeneration Effects on thermal efficiency, exergy efficiency, and irreversibility of a solar ORC employing IND300 and LS-3 solar collectors for different working fluids ................................................................................................................... 64 Table 3.6 Molecular complexity of working fluids .......................................................... 65 Table 4.1 Key properties of constituent layers of the building envelope’s main components ....................................................................................................................... 76 Table 4.2 Made assumptions in modeling building and GSHP. ....................................... 81 Table 4.3 Temperature difference between the inside and outside of the building for February and March in Pensacola based on measured data and simulation results. ......... 85 Table 4.4 Power consumption of the building in Pensacola based on simulation results and available billing information ...................................................................................... 86 Table 4.5 Selected solar collector specifications .............................................................. 88
x
Table 4.6 Low temperature flat plate collector ORC system performance and collector requirements for different working fluids in Pensacola .................................................... 91 Table 4.7 Low temperature evacuated tube collector ORC system performance and collector requirements for different working fluids in Pensacola ..................................... 92 Table 4.8 Medium temperature evacuated tube collector ORC system performance and collector requirements for different working fluids in Pensacola ..................................... 93 Table 4.9 Annual power demand of the building and the annual power generation per collector unit for the solar ORC which employs evacuated tube collector and Isopentane as the working fluid for Pensacola,Miami and Houston ................................................... 98 Table 4.10 Derate factors for AC power rating at Standard Testing Condition ............. 101 Table 4.11 Selected PV panel and inverter specifications .............................................. 103 Table 4.12 Required area and total cost for the suggested solar ORC system (employing low-temperature evacuated tube and Isopentane as working fluid) and PV panel system to maintain the power demand of the building ................................................................... 104 Table 4.13 The exergy loss, capital cost, payback period and Rex of the ORC system which employs low temperature evacuated tube collector for different working fluids in Pensacola......................................................................................................................... 106
xi
LIST OF FIGURES
FIGURE PAGE Fig. 2.1 Framework of the research. ................................................................................... 8 Fig. 2.1 Organic fluids with lower specific vaporization heat produce less irreversibility (Larjola, 1995)............................................................................................ 12 Fig. 2.2 (a) Plant layout (b) Typical T-S diagram for a regenerative ORC (Drescher and Bruggemann, 2007)........................................................................................................... 17 Fig. 2.3 The effect of molecular complexity on the Tr-S diagram (Mago et al., 2008) .... 19 Fig. 2.4 Parabolic Trough Collector (PTC) ...................................................................... 26 Fig. 2.5 Pressure ratios and vapor expansion ratio across the turbine for selected fluids 33 Fig. 2.6 Variation of the fluid and cycle characteristics for linear hydrocarbons ........... 33 Fig. 2.7 Variation of the critical temperature, boiling temperature and efficiency for refrigerants ........................................................................................................................ 34 Fig. 3.1 Higher pressure limit of the ORC ..................................................................... 40 Fig. 3.2 Actual saturated basic ORC .............................................................................. 43 Fig. 3.3 Enthalpy calculation procedure in a saturated basic ORC ................................ 44 Fig. 3.4 Heat transfer components to/from a solar ORC ................................................ 45 Fig. 3.5 Actual saturated regenerative ORC .................................................................. 49 Fig. 3.6 Supplementary enthalpy calculation procedure in a saturated regenerative ORC........................................................................................................................................... 50 Fig. 3.7 Variation of performance factors with respect to Teva of an ORC employing R-236ea as working fluid (a) VER and wnet (b) ηth and ηex .................................................. 52 Fig. 3.8 Thermal and exregy efficiency of the ORC for different working fluids at Teva=130°C ........................................................................................................................ 56 Fig. 3.9 Net output power of the ORC for different working fluids at Teva=130°C ......... 57 Fig. 3.10 Vapor expansion ratio in the ORC for different working fluids at Teva=130°C 58

xii
Fig. 3.11 Thermal and exregy efficiency of the ORC for different working fluids at Teva=85°C .......................................................................................................................... 60 Fig. 3.12 Net output power of the ORC for different working fluids at Teva=85°C ......... 61 Fig. 3.13 Vapor expansion ratio in the ORC for different working fluids at Teva=85°C .. 62 Fig. 3.14 (a) Irreversibility reduction, (b) Exergy efficiency enhancement by increasing collector efficiency from 70% to 100% for Isopentane. ................................................... 63 Fig. 3.15 (a) Thermal and exergy efficiency enhancement, (b) Irreversibility reduction by using regenerative ORC based on molecular complexity of working fluids (Teva=130°C)........................................................................................................................................... 66 Fig. 3.16 (a) Thermal and exergy efficiency enhancement, (b) Irreversibility reduction by using regenerative ORC based on molecular complexity of working fluids (Teva=85°C)........................................................................................................................................... 67 Fig. 3.17 Proposed selection procedure of the working fluid in a solar ORC .................. 68 Fig 4.1 Building and GSHP system TRNSYS model SketchUp ...................................... 77 Fig 4.2 The building geometry created in Google SketchUp ........................................... 79 Fig 4.3 The electrical power consumption of the north zone heat pump unit based on measured data and simulation results ............................................................................... 82 Fig 4.4 Monthly average of indoor and outdoor temperatures for each hour of every day in February in Pensacola ................................................................................................... 83 Fig 4.5 Monthly average of indoor and outdoor temperature for each hour of every day in March in Pensacola ........................................................................................................... 84 Fig 4.6 Solar collector loop TRNSYS model ................................................................... 89 Fig 4.7 Required collector area for running the solar ORC which employs low temperature evacuated tube collector and Isopentane as the working fluid for Pensacola, Miami and Houston........................................................................................................... 95 Fig 4.8 Monthly power generation per collector unit for the solar ORC which employs low temperature evacuated tube collector and Isopentane as the working fluid for Pensacola, Miami and Houston......................................................................................... 97 Fig 4.9 Monthly average of solar radiation incident upon the collector surface for Miami, Pensacola and Houston ..................................................................................................... 97

xiii
Fig 4.10 A snapshot of the input page of the PVWatts 2 ................................................ 100 Fig 4.11 Rex variation versus ambient temperature for an ORC system which employs low temperature evacuated tube collector in Pensacola ................................................. 107 Fig. 5.1 Proposed selection procedure of the working fluid in a solar ORC .................. 111

xiv
LIST OF SYMBOLS
Cg geometric concentration ratio of solar collector [-]
Ex exergy [W]
Fe dirt degree of the collector mirrors [-]
Gb direct solar irradiance [W/m2]
h specific enthalpy [J/kg]
K incidence angle modifier [-]
Kg capital cost [USD]
Lex exergy loss [W]
annual exergy loss [kWh]
mass flow rate [kg/s]
P pressure [Pa]
annual power demand of the building [kWh]
Ph higher pressure limit of Rankine cycle [Pa]
Q heat transfer rate [W]
Q* irradiation rate [W]
Q0 ambient heat loss rate of solar collector [W]
q heat transfer per unit mass [J/kg]
R gas constant [J/kg K]
Rex ratio of the annual exergy loss to the capital cost [kWh/USD]
s specific entropy [J/kg K]
Sgen entropy generation rate [W/K]
∆T temperature difference [K]

xv
T temperature [K]
Tbp boiling point [°C]
T* apparent sun temperature [K]
thermal loss coefficient per unit area of the absorber tube [W/m2 K]
W power [W]
w power per unit mass [J/kg]
Greek Symbols
εreg regeneration efficiency [-]
η efficiency [%]
ηopt,0 collector optical efficiency at a zero incidence angle [%]
σ molecular complexity [-]
angle of incidence of the direct solar radiation [rad]
Subscripts
a actual
abs absorber
c collector
CHP combined heat and power
con condenser
cr critical
eva evaporator
ex exergy

xvi
f saturated liquid
g saturated vapor
in inlet flow
inside inside of the building
j cycle component index
L low
ME measured data
TR TRNSYS simulation results
net net output
out outlet flow
outside outside of the building
p pump
r reduced property
s isentropic
SV saturation vapor
t turbine
th thermal
WH water heating
wf working fluid
0 ambient

xvii
Superscripts
¯ average
Sat saturation state
Acronyms
DIPPR Design Institute for Physical Properties
GSHP Ground Source Heat Pump
HVAC Heating, Ventilating and Air Conditioning
NZEB Net Zero Energy Building
ODP Ozone Depletion Potential
ORC Organic Rankine Cycle
PTC Parabolic Trough Collector.
PV Photovoltaic
SHGC Solar Heat Gain Coefficient
SRCC Solar Rating and Certification Corporation
STC Standard Test Conditions

1
CHAPTER 1
INTRODUCTION
1.1 Research Background
Buildings have a significant impact on energy consumption. The Net Zero Energy
Building (NZEB) concept is a promising approach to overcoming the energy crisis of our
time. The NZEB is a residential or commercial building with greatly reduced energy
needs achieved through efficiency gains such that the balance of energy needs can be
supplied with renewable technologies on an annual basis. This study is an attempt at
achieving NZEB using a solar-assisted geothermal heat pump.
Air conditioning systems are usually the most energy consuming devices in
regular residential and commercial buildings especially in hot and humid climates.
Among different air conditioning systems, the heat pump is the most common system in
which the amount of heat absorption from its condenser in cooling mode, has a great
effect on the efficiency of the system. Ground Source Heat Pumps (GSHPs) use the
relatively constant temperature of ground. Heat is extracted from the ground and
delivered to the space during the winter, and removed from the space and rejected into
the ground during the summer. The cooling Energy Efficiency Ratio (EER) of a GSHP is
higher than its heating EER which makes the GSHP a better choice for cooling
dominated regions. For this reason GSHPs have recently become more popular for
residential and commercial space cooling applications.
Electricity generation for a GSHP is another challenge. It is clear that in a net zero
energy building, the input energy of the electricity generation system should be a form of

2
sustainable energy. Solar radiation has the highest capacity and the lowest replenishment
time among sustainable energies. There are different technologies available to convert
solar radiation to electricity. Because of the low efficiency and high capital costs of PV
panels and also the high energy consumption and CO2 production rate of the
manufacturing process of PV panels, this technology has not been widely commercialized
for residential and commercial building application. Enhancement of the PV panel
manufacturing process may alter this conclusion in the future. Therefore the use of solar
irradiation as a heat source to run heat engines is of great interest.
Because of the limitation of solar irradiation and efficiency of collectors, the
conventional Rankine cycle is economically feasible only for large scale power plants.
The Organic Rankine cycle (ORC) is a substitutive technology which is applicable for
small scale power generation for use in residential and commercial buildings. ORC
employs low grade heat from different sources such as biomass, geothermal, solar and
waste heat of industrial processes. The main difference between ORC and the
conventional Rankine cycle is in the working fluid. The boiling point of the working fluid
in ORC is much lower than steam, hence there is no need to achieve high temperatures to
generate vapor for running a micro-turbine or expander. As a result ORC can be driven at
lower temperatures than the Rankine cycles that use water.
Hot and humid climate has been selected for the study due to its high solar
intensity and long solar radiation time through the year. In addition in such a cooling
dominant region, the GSHP system has a better annual performance and electricity
demand profile of the building better follows the electricity generation profile by the
solar ORC system.
3
A solar ORC can be optimized with respect to different parameters. Parameters
that will be considered for solar ORC optimization in this study are as follows: the
working fluid, the working conditions of the cycle, the cycle configuration and the solar
collector type.
In most of the papers that have been reviewed so far ORC optimization has been
done for a limited number of fluids or the optimization procedure has been applied on an
ORC system using one specific working fluid.
Mago et al. (2008) determined the influence of the boiling point temperature on
the system thermal efficiency for both basic and regenerative ORCs by comparing
simulation results for R113, R123, R245ca and Isobutane. Angelino et al. (1984) suited
the performance of the ORC system employing seven linear hydrocarbons from C4H10
(n-butane) to C10H22 (n-decane). Hung (1995) compared ORC efficiency and
irreversibility for selected refrigerants and hydrocarbons. He selected R-113 and R-123
from refrigerants and p-Xylene (C8H10), Toluene (C7H8) and Benzene (C6H6) from
aromatic hydrocarbons. Hettiarachchi et al. (2007) compared a geothermal ORC optimum
performance for ammonia, R123, n-Pentane and PF5050 as the working fluid. Thermal
stability over the range of operating temperatures and a minimal degradation rate over
time is the only criteria in the preliminary selection of the working fluids for a given
ORC in Prabha’s analysis (2006). A regenerative cascade cycle with toluene as the
topping fluid and butane as the bottoming fluid is the optimized solar ORC plant relative
to this study.
A comparison between Toluene and some selected siloxanes for different
superheating temperatures, condensation temperatures and recuperator’s efficiencies in a

4
100 KW power ORC in the medium range temperature has been carried out by Delgado-
Torres and Garcia-Rodriguez (2007a).
Karellas and Schuster (2008) studied the effects of using working fluids at their
supercritical region on the ORC performance. The R-245fa was chosen as the working
fluid for calculations.
As can be seen, because of the wide variety of fluid parameters and the cycle
conditions that have been considered in the literature, there have been very limited
attempts at systematically categorizing the selection of working fluids, working condition
and cycle configuration for an ORC. In addition previous investigations on the ORC
using solar heat are very limited and often emphasize the optimized cycle that results in
different working conditions for different working fluids. The best performance of each
fluid in a Rankine cycle has not been compared under the relatively same benchmark
conditions for solar heat applications. The employment of a specific solar collector in a
specific geographic region often limits its temperature range. Therefore the highest
allowed temperature for a working fluid in the ORC is not necessarily achievable through
solar heat source. Therefore it is necessary to develop a meaningful procedure to compare
capabilities of working fluids when they are employed in solar Rankine cycles with
similar working conditions.
1.2 Exergoeconomic Point of View
Among the methods that have been used to evaluate the performance of a thermal
energy system, there are techniques that combine thermodynamic and economic
principles. Thermoeconomics is a general term that describes any combination of a

5
thermodynamic analysis with an economic one. Compared with energy, exergy is a more
consistent measure of economic value. Exergoeconomics rests on the philosophy that
exergy is the only rational basis for assigning monetary costs to a system’s interactions
with its surroundings and to the sources of thermodynamic inefficiencies within it. The
ratio Rex of the exergy loss to the capital cost is the key parameter of exergoeconomic
analysis of energy systems.
Ozgener et al. (2007) believe that for any technology there is an appropriate value
for Rex where the design of the device is more successful if the Rex for that device
approaches that appropriate value. Rosen et al. (2003a) speculate that mature
technologies have achieved a balance of exergy loss and capital cost over the time that is
appropriate to the circumstances.
The main perspective in the exergoeconomic analysis of the Solar ORC system in
this study is to examine the relation between the exergy loss and the capital cost for the
optimal solar ORC system using the exergoconomic key parameter Rex.
1.3 Objectives and Significance of Study
Fossil fuel depletion, atmospheric pollution, global warming and ozone layer
destruction are serious problems experts face in finding more sustainable ways to satisfy
the requirements of human life. Buildings account for 40% of the energy used annually
worldwide. In the U.S. about as much construction and demolition waste is produced as
municipal garbage. As a result, both the constructions and Heating, Ventilating and Air
Conditioning (HVAC) industries are under increasing pressure from government and
environmental groups to replace conventional methods with more sustainable processes.

6
This research can give us applied guidelines for using sustainable resources of
energy for space air conditioning. By considering how the solar collector type, solar
collector size, working fluid selection, temperature and pressure of each section of cycle
influence the exergy loss, as well as their effects on the capital cost of the solar ORC
system, for a building with a specific power demand a unique combination of all these
parameters - the optimized condition - will be determined. This will inevitably be an
important step toward creating a sustainable society.
1.4 Framework of the Research
This research mainly focuses on employing exergoeconomic principles in order to
select optimal working fluids, cycle configuration, solar collector type and operation
conditions for solar ORCs to maintain power demand of a building in hot and humid
climate. Among above mentioned parameters, the selection of working fluids is the base
to determine the optimal performance of ORCs. In other words, other parameters
including cycle configuration, solar collector type, and operation conditions are addressed
in the selection process of working fluids for solar ORCs.
Chapter 2 presents a comprehensive review on the ORC literature. Second law
efficiency and exergetic studies on ORCs have thus far drawn less attention by
researchers. In addition, in most of papers that have been reviewed so far ORC
optimization has been done for a limited number of fluids or the optimization procedure
has been applied on an ORC system using one specific working fluid. In general, there is
no systematic procedure in the literature to compare capabilities of working fluids when
they are employed in ORCs with similar working conditions.

7
Chapter 3 is an attempt at filling above mentioned gaps in selecting working
fluids for the solar ORCs with a consideration of exergetic measures. In this chapter, a
procedure is developed to compare ORC working fluids in two different operation
conditions (i.e., two different temperature levels). The comparison is based on fluids
molecular components, temperature-entropy diagram of the fluid, and fluid effects on the
thermal efficiency, net power generated, vapor expansion ratio, and exergy efficiency of
the Rankine cycle. Fluids with the best cycle performance are recognized in two different
temperature levels within two different categories of fluids: refrigerants and non-
refrigerants. The optimal cycle configuration for the selected working fluids is identified
through an exergetic analysis.
In Chapter 4, the optimization process is finalized by identifying the best collector
type and its corresponding temperature level, and exergoeconomic principles are applied
on the optimal solar ORC. In the first section of chapter 4, the best collector-temperature
combination for the solar ORC which maintains the electricity demand of a geothermal
air-conditioned commercial building located in Pensacola of Florida is determined with
exergetic and economic considerations. Selected fluids in chapter 3 are employed in this
analysis. The solar collector loop, building, and geothermal air conditioning system are
modeled using TRNSYS. Available electricity bills of the building and the 3-week
monitoring data on the performance of the geothermal system are employed to validate
the simulation. By the end of this section, the optimal working fluids, cycle
configuration, solar collector type, and operation conditions of the solar ORC are
determined.
Second section of chapter 4 discusses the exergoeconomic analysis of the optimal

8
solar ORC system. The analysis shows that the ratio Rex of the annual exergy loss to the
capital cost can be considered a key parameter in optimizing a solar ORC system from
the thermodynamic and economic point of view. It also shows that there is a systematic
correlation between the exergy loss and capital cost for the investigated solar ORC
system. The framework of the research can be summarized and illustrated in Fig. (2.1).
Fig. 2.1 Framework of the research. Note: All steps are taken with exergetic considerations.
To identify the optimal cycle configuration for the selected
working fluids
To develop a systematic selection procedure of the working fluid
To identify the gaps of previous investigations
Literature review
To identify the optimal collector-temperature combination for the
selected working fluids and selected cycle configuration
Employing governing equations of basic thermodynamic cycle
- Modeling the building, GSHP system and solar collector loop using TRNSYS - To verify the simulation results using monitoring data and available electricity bills
Applying exergoeconomic principles on the optimal solar ORC
Employing governing equations of regenerative thermodynamic cycle
Steps Methods
To extract a systematic correlation between the exergy loss and capital cost of a solar
ORC
9
CHAPTER 2
A CRITICAL REVIEW ON SINGLE COMPONENT WORKING FLUIDS FOR
ORGANIC RANKINE CYCLES (ORCs)
2.1 Introduction
The main difference between the ORC and the conventional Rankine cycle is the
working fluid. The boiling point of working fluid in the ORC is much lower than steam,
hence there is no need to achieve high temperatures to generate vapor for running a
micro-turbine or expander. As a result ORCs can be driven at lower temperatures than the
Rankine cycles that use water.
The selection of working fluid and operation conditions has a great effect on the
system operation, and its energy efficiency and impact on the environment. The selection
of working fluid is the base to determine the optimal performance of ORCs. In other
words, other optimization parameters including cycle configuration, solar collector type,
and operation conditions are addressed in the selection process of working fluids for solar
ORCs.
The main advantage of using multicomponent organic fluids in the Rankine cycle
is non-isothermal phase change processes in the evaporator and condenser. Siloxanes
have the same advantage among single component working fluids. In addition,
muticomponent organic fluids cover an unlimited number of fluids and studies on them
are more fundamental than practical. For those reasons this literature review has been
narrowed to single component working fluids to reach to more practical conclusions.

10
Single component organic fluids have different categories which have desirable
and undesirable properties for use in ORC. This chapter presents a critical review on
single component working fluids in Organic Rankine Cycles (ORCs). The study focuses
on practical considerations for providing guidelines for the categorization of working
fluids based on their capabilities and shortcomings for power generation in a Rankine
cycle.
2.2 General criteria for Selecting Working Fluids in ORC
There are some general desirable properties of the working fluids in a
thermodynamic cycle regardless of its application that help reduce equipment size and
decrease different types of fluid loss (i.e. heat and pressure loss) while passing through a
component or fluid interaction with its environment. Some of these desirable properties
of working fluids in ORCs can be listed as follows:
• Small specific volume
• Low viscosity and surface tension
• High thermal conductivity
• Suitable thermal stability
• Non-corrosive, non-toxic and compatible with engine materials and lubricating
oils
• Moderate vapor pressure in the range (0.1-2.5 Mpa) in the heat exchange units
• High availability and low costs
• Low safety, health and environmental hazards
11
Low Ozone Depletion Potential (ODP) is one of the most important
environmental characteristic of the fluid used as the working fluid in the ORC system.
Chlorine containing fluids are not Ozone-safe and have been banned by Montreal
protocol and thus should be avoided in new systems.
We can also recognize properties of working fluids that are generally beneficial
for ORCs and help us for preliminary selection of fluids before computing calculations.
Depending on the slope of the temperature-entropy curve to be infinity, positive,
or negative, working fluids can be classified into isentropic, dry, or wet respectively. Dry
or isentropic working fluids are more appropriate for ORC systems. This is because dry
or isentropic fluids are superheated after isentropic expansion. Therefore there is no
concern for existing liquid droplets at the turbine outlet.
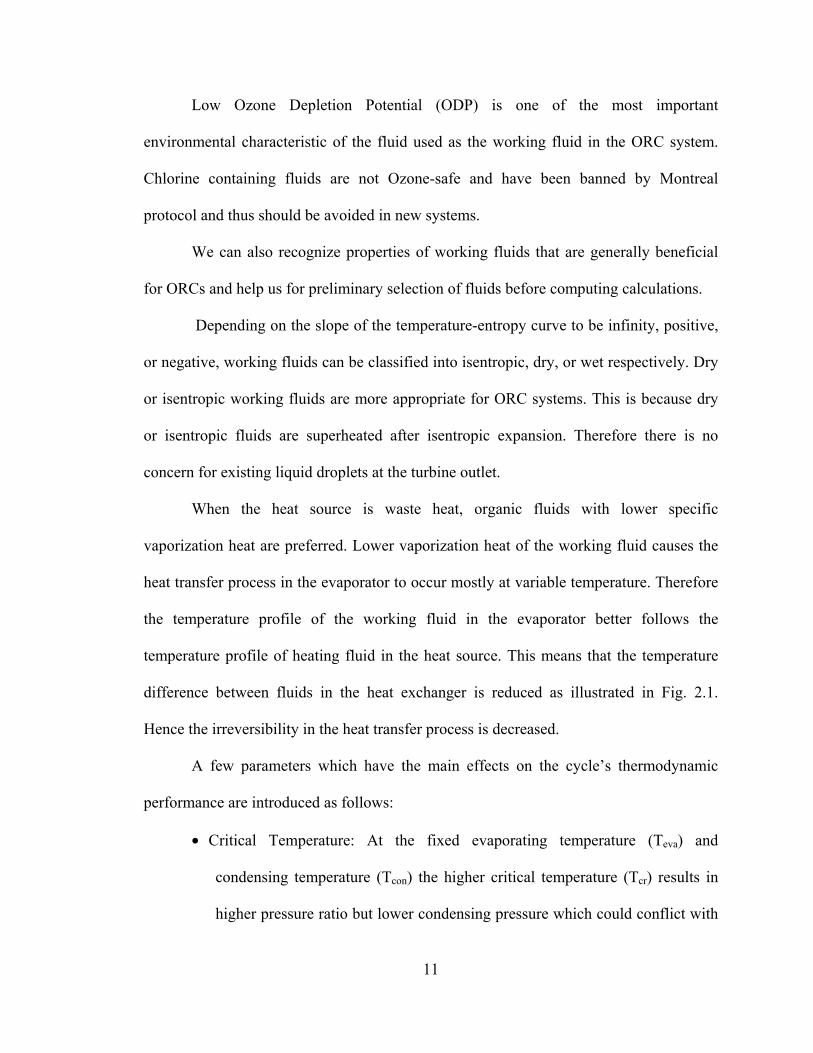
When the heat source is waste heat, organic fluids with lower specific
vaporization heat are preferred. Lower vaporization heat of the working fluid causes the
heat transfer process in the evaporator to occur mostly at variable temperature. Therefore
the temperature profile of the working fluid in the evaporator better follows the
temperature profile of heating fluid in the heat source. This means that the temperature
difference between fluids in the heat exchanger is reduced as illustrated in Fig. 2.1.
Hence the irreversibility in the heat transfer process is decreased.
A few parameters which have the main effects on the cycle’s thermodynamic
performance are introduced as follows:
• Critical Temperature: At the fixed evaporating temperature (Teva) and
condensing temperature (Tcon) the higher critical temperature (Tcr) results in
higher pressure ratio but lower condensing pressure which could conflict with

O
cy
• Mo
or
or
Fig. 2.1
• Mo
oc
sp
From
ORC working
1. Hy
Iso
ycle compon
olecular com
rganic fluids
rganic fluids
Organic f
olecular mas
ccurs across
peed and a sm
the structur
g fluids can b
ydrocarbons
opentane), a
ents design.
mplexity: Mo
s are fluids
can satisfy t
fluids with irrever
ss: In gener
the turbine
mall number
ral point of
be categoriz
s including
and aromatic
12
ore complex
with high c
the dry cond
lower spesibility (Larj
ral for heavy
e. Then the
r of stages.
view and ty
zed under fou
linear (n-B
hydrocarbo
fluids usual
complexity m
dition to be e
ecific vaporizjola, 1995)
y fluids a l
turbine tend
ype of atom
ur main clas
Butane, n-Pen
ons (Toluene
lly are dry fl
molecules. T
employed in
zation heat p
lower vapor
ds to have
ms in the flu
ses:
ntane), bran
e, Benzene) h
luids. Major
This means
a Rankine c
produce less
r expansion
a low perip
uid molecule
nched (Isobu
have:
ity of
most
cycle.
ratio
pheral
e, the
utane,

13
- Desirable thermodynamic properties
- Flammability issues
2. Perfluorocarbons (Fully fluorinated hydrocarbons) (Hexaflourobenzene)
are/have:
- Extremely inert and stable
- Extreme molecular complexity
- Thermodynamically undesirable
3. Partially flouro-substituted straight chain hydrocarbons
- There are several zero ODP fluids among them which are of considerable
potential interest
4. Siloxanes (MM, MM/MDM/MD2M)
- Attractive for a mix of physical and thermal properties (low toxicity and
flammability level; high molecular mass; prolonged use as a high
temperature heat carrier)
- They are often available as mixtures rather than as pure fluids
- Isobaric condensation and evaporation are not isothermal and exhibit a
certain glide
As we can see there is no single category of fluids that satisfies all desirable
properties for use in an ORC system. Hence after preliminary selection of fluids by
discarding chlorine containing and wet fluids, we seek an optimization process that may
lead to the final choice for better cycle performance.

14
In most of papers that have been reviewed so far ORC optimization has been done
for a limited number of fluids or the optimization procedure has been applied on an ORC
system using one specific working fluid.
Because of the wide variety of fluid parameters and the cycle conditions that have
been considered in the literature there have been very limited attempts at systematically
categorizing the selection of working fluids for an ORC. In the following sections we
will fill this gap by categorizing the results in the literature based on our selection criteria.
2.3 Studies Based on Critical Temperature
Bruno et al. (2008) have accomplished a wide-ranging study on the working
fluids in an ORC system that produces energy for running a reverse osmosis desalination
system. The authors considered the Aspen plus software library as their reference. At the
first step they discarded chlorine included, wet and isentropic fluids.
During the second step for the preliminary selected working fluids the optimum
high and low pressure of the saturated cycle maintaining the maximum first law
efficiency of the cycle were found.
In general, employing a fluid with higher critical temperature results in higher
efficiency but lower condensing pressure. Three groups of fluids can be recognized in the
results: (A) fluids with a high efficiency close to 30% with low condensing pressures
under atmospheric pressure, such as the siloxane fluids, (B) fluids with atmospheric
pressure at the condensing section and with medium efficiency of around 20%, such as n-
Pentane and Isopentane. Isopentane has the best performance according to the efficiency
(27.2 %) and the minimum pressure in the cycle (1 bar). Therefore Isopentane is the best

15
choice for the ORC cycle if the heat source can provide the proper evaporating
temperature (about 180 ºC) (C) there is another group of fluids such as Isobutane working
at high condensing pressures showing an efficiency lower than 15%.
For a practical comparison between fluids at this stage, a complementary study is
necessary to increase the group A condensing pressure to atmospheric pressure and repeat
the simulation process to find the cycle efficiency at new working conditions.
In the last step for four different types of solar collectors the optimization to find
the best high temperature in a superheated ORC cycle has been done by Bruno and his
coworkers (2008). Generally, superheating in an ORC increases the first law efficiency of
the cycle with a very low slope but decreases the second law efficiency of the cycle. Then
superheated cycles are never recommended unless in cases which high power output is
desired even by running a low efficiency cycle. In addition, in solar cycles increasing the
maximum temperature of the collector increases the heat loss from the collector.
Except for the general trend of increasing the efficiency of the cycle with the
critical temperature of the working fluid no discussion about the relation between fluid
properties and the ORC efficiency can be found in the Bruno and his coworkers’ study
(2008).
Drescher and Bruggemann (2007) fulfilled an inclusive research to identify the
most suitable fluids for ORC in biomass power and heat plants. In this study the Design
Institute for Physical Properties (DIPPR) database has been considered as the reference.
For preliminary selection, the authors extracted cycle pressure and temperature
requirements for an ORC with a biomass heat source from literature.
16
About 700 substances of the DIPPR database pass the pre-selection criteria and
are included in the subsequent comparison.
The efficiency of the 100 best-suited fluids ranges from 24.3% to 25.4% for the
regenerative ORC. According to the results, the efficiency rises to approximately 25% at
1 MPa with a slight decrease for higher pressures. The slight decrease can be explained
by the needed work of the feed pump. This means that there is an optimal maximum
process pressure.
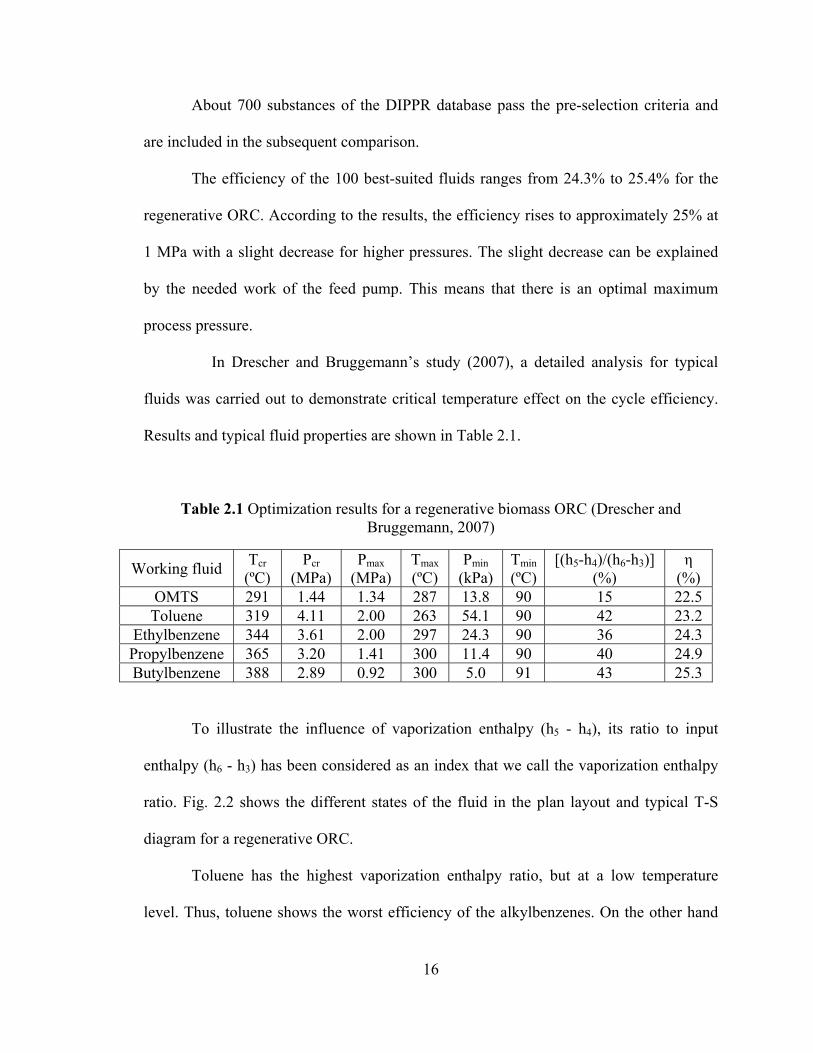
In Drescher and Bruggemann’s study (2007), a detailed analysis for typical
fluids was carried out to demonstrate critical temperature effect on the cycle efficiency.
Results and typical fluid properties are shown in Table 2.1.
Table 2.1 Optimization results for a regenerative biomass ORC (Drescher and Bruggemann, 2007)
Working fluid Tcr
(ºC) Pcr
(MPa) Pmax
(MPa) Tmax
(ºC) Pmin
(kPa) Tmin
(ºC)[(h5-h4)/(h6-h3)]
(%) η
(%) OMTS 291 1.44 1.34 287 13.8 90 15 22.5 Toluene 319 4.11 2.00 263 54.1 90 42 23.2
Ethylbenzene 344 3.61 2.00 297 24.3 90 36 24.3 Propylbenzene 365 3.20 1.41 300 11.4 90 40 24.9 Butylbenzene 388 2.89 0.92 300 5.0 91 43 25.3
To illustrate the influence of vaporization enthalpy (h5 - h4), its ratio to input
enthalpy (h6 - h3) has been considered as an index that we call the vaporization enthalpy
ratio. Fig. 2.2 shows the different states of the fluid in the plan layout and typical T-S
diagram for a regenerative ORC.
Toluene has the highest vaporization enthalpy ratio, but at a low temperature
level. Thus, toluene shows the worst efficiency of the alkylbenzenes. On the other hand

O
h
te
h
O
F
OMTS has a
as the lowe
emperature a
igher critica
ORC.
Fig. 2.2 (a) P
high vapori
est efficienc
and enthalpy
al temperatu
Plant layout
ization temp
cy of the s
y result in h
ure and wide
(b) Typical Br
17
erature but t
selected flu
high ORC ef
er saturation
T-S diagramruggemann,
the lowest v
uids. Theref
fficiency. T
n dome are
m for a regen2007)
vaporization
fore both h
This means t
most effici
nerative ORC
enthalpy rat
high vaporiz
that fluids w
ent fluids fo
C (Drescher
tio. It
zation
with a
for an
and

18
Mago et al. (2008) determined the influence of the boiling point temperature (Tbp)
on the system thermal efficiency for both basic and regenerative ORCs by comparing
simulation results for R113, R123, R245ca and Isobutane. Since fluids with higher
boiling temperature have higher critical temperature, this study can be considered as a
critical temperature based study.
The results demonstrate that the fluid which shows the best thermal efficiency is
the one that has the highest boiling point among the selected fluids (R113, Tbp = 47.59
ºC), while the fluid with the worst thermal efficiency has the lowest boiling point
temperature (Isobutane, Tbp = -11.61ºC). Therefore, it can be concluded that the higher
the boiling point temperature of the organic fluid the better the thermal efficiency that
will be achieved by the ORC.
2.4 Studies Based on Molecular Complexity
Invernizzi et al. (2007) presented a relation between molecular complexity (σ) and
thermodynamic properties of the fluid. They also introduced the acentric factor (ω) as a
new effective factor on the cycle performance. Molecular complexity and acentric factor
are defined by equations (2.1) and (2.2) respectively.
, . (2.1)1 log . (2.2)
where Pr and Tr are reduced pressure and temperature respectively.

d
co
re
m
th
il
ar
sp
m
in
fo
in
The σ
irectly relat
omplexity is
elation betw
molecules the
he saturated
llustrated in
re dry. The a
pherical mo
molecule with
Invern
ncreases with
or fluids in t
ncreases with
Fig. 2.3 Th
σ is primarily
ed to the m
s a function
ween the m
e slope of th
d line increa
Fig. 2.3. Th
acentric fact
lecules ω =
h respect to b
nizzi et al. (
h the molecu
the same cate
h the numbe
he effect of m
y a function
molecular str
of the slope
molecular co
he saturated
ases by inc
hus simple m
tor represent
= 0. At pres
both the geo
(2007) belie
ular complex
egory (i.e. h
er of atoms in
molecular co
19
of the heat c
ructure of th
e of the temp
omplexity an
vapor line in
creasing the
molecule flui
ed the acent
ent, it is us
ometry and p
ve that as a
xity, but as
hydrocarbons
n the molecu
omplexity on
capacity of th
he fluid. As
mperature-ent
nd wetness
n the T–S p
molecular
ids are wet a
tricity or non
sed as meas
polarity.
a rule, the cr
we will see
s or siloxane
ule.
n the Tr-S di
the vapor and
s can be see
tropy curve.
of the flu
plan is negat
complexity
and complex
nsphericity o
sure for the
ritical tempe
later this ru
es). For hom
iagram (Mag
d consequen
en the mole
Hence there
uid. For si
tive. The slo
y of the flu
x molecule f
of a molecul
complexity
erature of a
ule is only co
mologous flui
go et al., 200
ntly is
ecular
e is a
imple
ope of
uid as
fluids
e; for
y of a
fluid
orrect
ids, σ
08)

20
Invernizzi and his coworkers’ analysis has been done for an ORC that employs
exhaust gas of a micro –gas turbine as a heat source. The working fluids have been
selected from fluids with critical temperatures between 180 ºC and 320 ºC with positive
molecular complexity. Categories of selected fluids are linear and branched
hydrocarbons, linear CFCs, aromatic fluoro-carbons, and linear and cyclic siloxanes.
In a comparison made among different working fluids with the same heat source
(1 kg/s of 300 ºC hot gas), condensing temperature (30 ºC) and evaporating temperature
(170 ºC) it can be seen:
• The ORC thermodynamic efficiency mostly increases with the molecular
complexity because of its effect on critical temperature and subsequently on
regeneration efficiency.
• At the fixed molecular complexity, fluids with higher Tcr have higher
thermodynamic efficiency.
• The overall efficiency is influenced by both thermodynamic and heat recovery
efficiencies. The thermodynamic efficiency increases and heat recovery
efficiency decreases with increasing molecular complexity σ as implied in
Table 2.2. The predominant effect is related to the heat recovery efficiency so
that an increase of the molecular complexity σ results in a decrease of the
power output of the recovery cycle.
• From this analysis it can be concluded that from a thermodynamic point of
view it would be better to employ fluids with a rather low molecular
complexity; thanks to the less specific heat duty requested by the regenerator
and to their higher capacity of cooling the micro-turbine exhausts.

21
• Preliminary design of turbine shows us that the lower molecular complexity in
single stage turbines lead to lower isentropic efficiency at the same turbine
size.
Table 2.2 Optimization results for a regenerative waste heat ORC for fluids with different molecular complexity (Invernizzi et al., 2007)
Working fluid n-Pentane C6F6 MM MD2M Molecular complexity 7 13 29 72 Exit gas temperature 74 90 106 120
Power out put 46 46 43 43
As different types of molecules show different thermal and physical behaviors, it
makes more sense if we look for the relationship between cycle operation and fluid
properties at least among fluids with some common characteristics.
Study of seven linear hydrocarbons from C4H10 (n-butane) to C10H22 (n-decane)
shows the increase in molecular complexity has the effect of rising the fluid critical
temperature while reducing its critical pressure. This means the fluid with more
molecular complexity has the higher normal boiling point.
For a cycle with the high and low temperatures equal to 100ºC and 40ºC
respectively the following results have been obtained:
• Condensation pressure variation : From 377 to 0.49 kPa
• Evaporation pressure variation: From 1508 to 9.56 kPa
• Pressure ratio variation: From 4 to 20
• Optimized stage rotating speed variation in turbine: From 57000 rpm to 1800
rpm
• Turbine mean diameter variation: From 0.074 to 2.11 m

22
• Efficiency variation: increasing with molecular complexity, mainly if the
cycle includes regeneration.
• Pump work variation: decreasing with molecular complexity
2.5 Comparison in Efficiency among Selected Fluids
Hung (1995) compared ORC efficiency and irreversibility for selected
refrigerants and hydrocarbons. He selected R-113 and R-123 from refrigerants and p-
Xylene (C8H10), Toluene (C7H8) and Benzene (C6H6) from aromatic hydrocarbons. A
constant 10 MW waste heat source is employed. The cycle is saturated. Irreversibility and
efficiency of the cycle have been compared between selected working fluids.
Irreversibility changes are completely dependent on the heat source conditions.
At a fixed heat source temperature (TH=600 K) when turbine inlet pressure varied
from 500 to 1800 kPa, the following observations have been made:
• For all fluids, irreversibility of the cycle (Irr.) is decreasing with increasing
inlet turbine pressure.
• Irr. p-Xylene<Irr. Toluene< Irr. Benzene < Irr. R113 < Irr. R123
• Among aromatic hydrocarbons : The higher molecular weight, the lower
irreversibility
For a fixed temperature difference between the turbine inlet and the heat source
(15ºC) when turbine inlet pressure varied from 800 to 2200 kPa, the following
observations have been made:
• Irr. R123 < Irr. R113<Irr. Benzene <Irr. Toluene < Irr. p-Xylene
• For all fluids, irreversibility is increasing with increasing inlet turbine

23
pressure.
ORC efficiency calculations for the selected fluids at different turbine inlet
pressures show that:
• η R123< η R113<η Benzene <η Toluene < η p-Xylene
• For all fluids, efficiency is increasing with increasing inlet turbine pressure.
• The working fluids with higher boiling temperature will have greater
efficiency.
• The lower condenser exit temperature (lower ambient temp), the higher
efficiency.
• System efficiency and total irreversibility have opposite trends. Using the
operation conditions at the intersection point of the efficiency curve and the
availability ratio (ratio of the available energy to the total energy obtained
from the heat source) curve would lead to the optimal balance between the
two conflicting factors.
Hettiarachchi et al. (2007) compared a geothermal ORC optimum performance
for ammonia, R123, n-Pentane and PF5050 as the working fluid. The ratio of the total
heat exchanger area to net power output is considered as the objective function.
Ammonia has minimum objective function and maximum geothermal water
utilization (Net work / Geothermal water mass flow rate), but not necessarily maximum
cycle efficiency. PF5050 and Ammonia have the worst performance from the exergy
efficiency point of view. This means not considering the objective function, Ammonia
cannot be a choice because of its low ORC cycle and exergy efficiency.

24
The fluids, n-Pentane and R123, have better cycle efficiency than PF5050,
although the latter has better physical and chemical characteristics compared to other
fluids considered.
Liu et al. (2004) examined the influence of various working fluids on the thermal
efficiency and on the total heat-recovery efficiency of ORC for a waste heat recovery
system. Finding a relation between the molecular structure of the fluid and its T-S vapor
saturation line slope is one of the achievements of Liu and his coworkers’ study. The
results show that the presence of a hydrogen bond in certain molecules, such as water,
ammonia, and ethanol results in wet fluids and is considered as inappropriate for ORC
systems. The authors claim that although the thermal efficiency for working fluids with
lower critical temperature is lower; the critical temperature of the fluid has not significant
effect on the thermal efficiency of the cycle. An explanation for the contradiction
between this conclusion and previous studies may lie on the use of a correlation (Watson
relation) to calculate the vaporization enthalpy of the fluid by Liu and his coworkers
(2004). The heat recovery efficiency is higher for higher inlet temperatures of the waste
heat and higher critical temperature fluids. The effect of the heat source temperature
profile on the system performance has been approved by the results of Liu and his
coworkers’ study (2004).
Thermal stability over the range of operating temperatures and a minimal
degradation rate over time is the only criteria in preliminary selection of the working
fluids for a given ORC in Prabha’s analysis (2006).
25
Benzene is the most thermally stable of the candidate working fluids. Next after
Benzene is Toluene. Isobutane is a thermally stable fluid in Low temperature range. In
this study the author concentrates on cascade solar ORCs.
A regenerative cascade cycle with toluene as the topping fluid and butane as the
bottoming fluid is the optimized solar ORC plant relative to Prabha’s study.
A comparison between Toluene and some selected siloxanes for different
superheating temperatures, condensation temperatures and recuperator’s efficiencies in a
100 KW power ORC in the medium range temperature has been carried out by Delgado-
Torres and Garcia-Rodriguez (2007b).
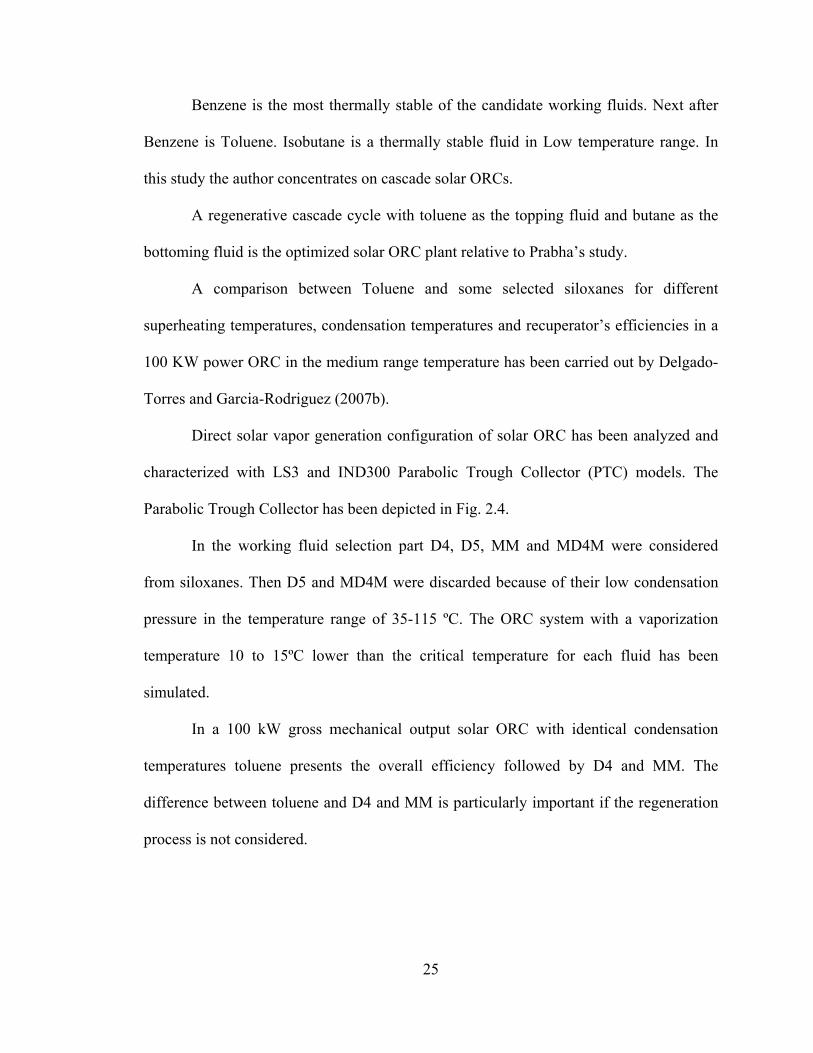
Direct solar vapor generation configuration of solar ORC has been analyzed and
characterized with LS3 and IND300 Parabolic Trough Collector (PTC) models. The
Parabolic Trough Collector has been depicted in Fig. 2.4.
In the working fluid selection part D4, D5, MM and MD4M were considered
from siloxanes. Then D5 and MD4M were discarded because of their low condensation
pressure in the temperature range of 35-115 ºC. The ORC system with a vaporization
temperature 10 to 15ºC lower than the critical temperature for each fluid has been
simulated.
In a 100 kW gross mechanical output solar ORC with identical condensation
temperatures toluene presents the overall efficiency followed by D4 and MM. The
difference between toluene and D4 and MM is particularly important if the regeneration
process is not considered.

se
d
sy
ef
d
th
T
w
te
Delga
econd ORC
ouble cascad
ystem called
The t
ffectiveness,
one for the t
he top cycle
The vaporizat
Butan
working flui
emperature r
F
ado-Torres a
that is pow
de ORC. Th
d Solar Troug
top temperat
, εreg = 0.8 a
top cycle wit
is absorbed
tion tempera
ne, isobutene
ids proposed
ranges of the
ig. 2.4 Parab
and Garcia-
wered by the
his configura
gh Organic R
ture cycle g
and a conden
th Toluene a
d by the bott
ature of the b
e, pentane,
d in the li
e bottom cyc
26
bolic Trough
-Rodriguez
thermal pow
ation has bee
Rankine Ele
generates 10
nsation temp
and MM as t
tom cycle w
bottom cycle
isopentane
iterature for
cles.
h Collector (
(2007b) co
wer rejected
en one of the
ctricity Syst
00 kW of r
perature of 1
the working
with a conde
e is equal to
and neope
r Organic R
(PTC)
ontinued the
d by the top
e proposed b
tem (STORE
raw power
115ºC. The a
fluid. The h
ensation temp
105ºC.
entane are e
Rankine Cy
eir work w
ORC, form
by Prabhu fo
ES).
with regene
analysis has
heat rejected
mperature at 3
evaluated am
ycles within
with a
ming a
or the
erator
been
from
35ºC.
mong
n the
27
From the results obtained, isopentane is selected as the most suitable working
fluid for the low temperature cycle since pentane and isopentane shows superior behavior
but the normal boiling point of pentane is above 35ºC.
It should be pointed out that the above discussion does not consider the difference
or similarity of the thermal properties among the fluids.
2.6 ORCs at Supercritical Region
Karellas and Schuster (2008) studied the effects of using working fluids at their
supercritical region on the ORC performance. The R-245fa was chosen as the working
fluid for calculations. The authors found that in a high temperature ORC that employed
exhaust gas at a temperature around 490 ºC, supercritical cycle achieved more than 9%
relative efficiency gain with respect to the subcritical one.
In the low temperature ORC with a geothermal heat source at temperatures
between 80 ºC and 160 ºC supercritical cycle showed a different behavior. Two working
fluids have been taken into consideration because of their critical points: the working
fluids R134a and R227ea. In most cases the supercritical cycle has lower thermal
efficiency than the subcritical one. The expansion in the turbine ends in the two-phase
area, so no recuperator can be used. That is the reason why the thermal efficiency in these
cases of supercritical parameters is much lower than the subcritical ones, in which a
recuperator is used.
Angelino et al. (2000) showed for a waste heat ORC that using toluene at its
supercritical region increased recovered thermal power with respect to the subcritical
cycle with no significant change in the cycle thermal efficiency. The Maximum
28
temperatures for subcritical and supercritical cycles were 308.6 °C and 342.1 °C
respectively.
Zhang et al. (2006) analyzed a novel solar energy-powered Rankine cycle for
combined power and heat generation using supercritical carbon dioxide. Results show
higher efficiency than conventional Rankine cycle with water at maximum temperatures
between 32 ºC and 177.4 ºC but the efficiency is still low (less than 12%)) to be proper
for practical power plants.
2.7 Major Findings
The above literatures on working fluids for Organic Rankine Cycles (ORCs) can
be analyzed as below:
In general, using supercritical cycles are only recommended for relatively high
temperature cycles and for lower temperatures the first law efficiency of supercritical
cycles are even lower than subcritical ones. In addition, saturation cycles have an
advantage of being less expensive and involving simpler heat exchangers.
It can be noticed from the survey that there is no specific category of fluids that
satisfies all desirable characteristics for an ORC system. In the majority of papers no
specific relation between thermodynamic properties and cycle performance can be
recognized.
For the better observation of the results in the literature, a number of fluids have
been chosen and the most important characteristics of the fluids and the cycle have been
summarized in Table 2.3. In this selection there are four linear hydrocarbons (Pentane,
Hexane, Heptane, and Octane), two branched hydrocarbons (Isobutane and Isopentane),

29
two aromatic hydrocarbons (Benzene and Toluene) and four refrigerants (R218, 113,
R123, and R236ea).
The following findings can be illustrated:
• The higher critical temperature allows setting the evaporation temperature at a
higher level that leads to the higher efficiency of the cycle.
• In the fluids of one category, at the fixed Teva and Tcon, the higher critical
temperature results in higher pressure ratio but lower condensing pressure.
• Fluids with higher pressure ratio in the cycle have higher vapor expansion
ratio across the turbine as illustrated in Fig. 2.5. Thus the higher vapor
expansion ratio is an undesirable subsequence of using high critical
temperature fluid in a Rankine cycle. If for a small amount of work, a high
vapor expansion ratio occurs across the turbine, supersonic flow problems,
higher turbine size or greater number of stages are inevitable.
• Generally, high efficiency ORCs are achievable by using hydrocarbons rather
than refrigerants. It means hydrocarbons have a higher potential to produce
power in a Rankine cycle than refrigerants because of their relatively high
critical temperature. But Hydrocarbons are more flammable in comparison
with refrigerants.
• The molecular complexity increases with the number of atoms in the molecule
for homologous fluids.
• In linear hydrocarbons fluids with higher number of atoms have higher critical
and boiling temperatures, higher molecular complexity, and higher molecular
30
mass and higher efficiency. As shown in Fig. 2.6, the variation of above
mentioned parameters, excluding efficiency, is very close to linear with
respect to the number of atoms in the molecule.
• Except in linear hydrocarbons no relation between molecular mass and cycle
efficiency can be recognized.
• In hydrocarbons, acentric factor increases with their molecular complexity.
Thus acentric factor can be used as an index to compare hydrocarbons’
wetness.
• Molecular mass mostly is in inverse relation with vapor expansion ratio across
the turbine. Therefore turbines in cycles using heavier fluids are smaller or
have less number of stages.
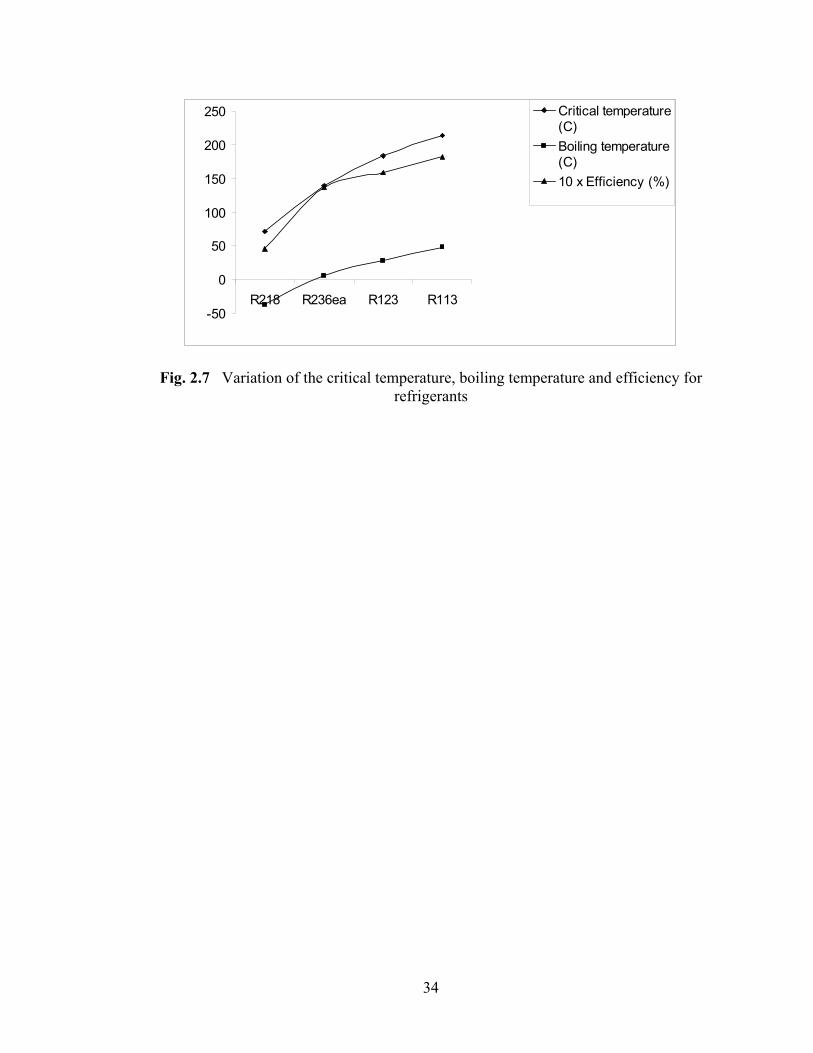
• Among refrigerants, fluids with higher critical temperature have higher
normal boiling point and higher efficiency as demonstrated in Fig. 2.7.
As different fluids show different pros and cons, fluid selection is completely
dependent on the priorities in the project design. Hence, after preliminary selection of
fluids by discarding chlorine containing and wet fluids, the optimization process gives us
the final choice for better cycle performance. Second law efficiency and exergetic studies
on ORCs have thus far drawn less attention by researchers. In general, there is no
systematic procedure in the literature to compare capabilities of working fluids when they
are employed in ORCs with similar working conditions. In chapter 3 a study to fill these
gaps for the solar ORCs will be done.

31
Table 2.3 Summary of the most important characteristics of the fluids and cycle for selected fluids
Fluid Isobutane Isopentane n-Pentane n-Hexane n-Heptane n-Octane Relative Vapor Density (air=1) 2 2.2 1.8 1.3 3.46 3.94
NFPA, NPCA-HMIS Hazard Codes
Health 1 1 1 1 1 0 Flammability 4 4 4 3 3 3
Instability /Reactivity
0 0 0 0 0 0
Flash Point (ºC) Flammable Gas < -51 - 49 -23.3 - 4 13 Autoignition Temperature (ºC) 460 420 309 225 285 220
Critical Temperature (ºC) 134.7 187.2 196.6 234.7 267.0 296.2 Boiling Temperature (ºC) -12 28 36 69 98 126
Reduced Teva 0.981 0.981 0.983 0.989 0.988 0.989 Specific Vaporization Heat
at Th (kJ/kg) 116.41 111.45 109.75 85.65 80.95 75.01
Vaporization Heat Ratio at Th (%)
30.2 25.2 23.9 17.8 15.9 15.4
Vapor Expansion Ratio 13 49 52 180 650 627 Molecular Complexity 1.14 7.20 6.5 11.6 17.6 23.5
Molecular Mass (kg/kmol) 58.1 72.2 72.2 86.2 100.2 114.2 Acentric Factor 0.185 0.2296 0.251 0.299 0.349 0.393
Reported Condition
Saturated regenerative
cycle Th=126.9ºC Ph=32 bar Tl=29.9 ºC
Pl=4 bar
Saturated regenerative
cycle Th=178.5ºC Ph=30 bar Tl=26.8 ºC Pl=1 bar
Saturated regenerative
cycle Th=188.7ºC Ph=30 bar Tl=35.9 ºC
Pl=1 bar
Saturated regenerativ
e cycle Th=229ºC Ph=28 bar Tl=34.4 ºC Pl=0.3 bar
Saturated regenerative
cycle Th=260.3 ºC
Ph=25 bar Tl=28.7 ºC
Pl=0.075 bar
Saturated regenerative
cycle Th=289.7 ºC Ph=23 bar Tl=52.2 ºC
Pl=0.075 bar
Efficiency at Reported Condition
13.94 27.2 16.74 29.28 29.67 33.75

32
Table 2.3 Summary of the most important characteristics of the fluids and cycle for selected fluids (Continued)
Fluid Benzene Toluene R218 R113 R123 R236ea Relative Vapor Density (air=1) 1.2 3.1 6.65 2.9 5.3 N/A
NFPA, NPCA-HMIS Hazard Codes
Health 2 2 1 1 2 N/A Flammability 3 3 0 0 1 N/A
Instability /Reactivity
0 0 0 1 0 N/A
Flash Point (ºC) -11 4 N/A N/A N/A N/A Autoignition Temperature (ºC) 498 480 N/A 680 770 N/A
Critical Temperature (ºC) 288.9 318.6 71.9 214.1 183.7 139.3 Boiling Temperature (ºC) 80 111 -36.8 48 27.8 6.2
Reduced Teva 0.960 0.983 0.990 0.958 0.926 0.983 Specific Vaporization Heat
at Th (kJ/kg) 166.06 104.34 25.55 64.53 93.91 59.20
Vaporization Heat Ratio at Th (%)
24.8 18.3 31.1 28.5 42.9 32.12
Vapor Expansion Ratio 195.5 841.9 4.0 43.9 16.3 14.8 Molecular Complexity 4.22 8.91 4.68 6.59 1.68 3.02
Molecular Mass (kg/kmol) 78.1 92.1 188 187.4 152.9 152.0 Acentric Factor 0.2092 0.266 0.317 0.25253 0.28192 0.3794
Reported Condition
Saturated basic cycle
Th=266.5ºC Ph=37 bar Tl=40.0 ºC Pl=0.25 bar
Saturated regenerative
cycle Th=308.4ºC Ph=35 bar Tl=39.5 ºC Pl=0.075bar
Saturated regenerative
cycle Th=68.6ºC Ph=25 bar Tl=29.9 ºC Pl=10 bar
Saturated basic cycle Th=193.5º
C Ph=25 bar Tl=40.0 ºC Pl=0.78 bar
Saturated basic cycle
Th=150.0 ºC Ph=21 bar Tl=40 ºC
Pl=1.54 bar
Saturated regenerative
cycle Th=132.2 ºC
Ph=30 bar Tl=36.4 ºC Pl=3.00 bar
Efficiency at Reported Condition
24.5 29.43 4.6 18.2 15.9 13.67

33
Fig. 2.5 Pressure ratios and vapor expansion ratio across the turbine for selected fluids
Fig. 2.6 Variation of the fluid and cycle characteristics for linear hydrocarbons
0150
300450600
750900
R218
R236ea
Isobu
tane
R123
Pentan
eR113
Benzen
e
Isope
ntan
e
Tolue
ne
Heptan
e
Hexane
Octan
e
Pressure ratio
Vapor expansion ratio
0
50
100
150
200
250
300
350
400
Pentane Hexane Heptane Octane
Criticaltemperature(C)
Boilingtemperature(C)
10 x Molecularcomplexity
Molecular mass(kg/kmol)
1000 X Acentricfactor
10 X Efficiency (%)
34
Fig. 2.7 Variation of the critical temperature, boiling temperature and efficiency for refrigerants
-50
0
50
100
150
200
250
R218 R236ea R123 R113
Critical temperature(C)
Boiling temperature(C)
10 x Efficiency (%)

35
CHAPTER 3
A PROCEDURE TO SELECT WORKING FLUIDS FOR SOLAR ORGANIC
RANKINE CYCLES
3.1. Introduction
Previous investigations on the ORC using solar heat are very limited and often
emphasize the optimized cycle that results in different working conditions for different
working fluids. The best performance of each fluid in a Rankine cycle has not been
compared under the relatively same benchmark conditions for solar heat applications in
previous studies. The employment of a specific solar collector in a specific geographic
region often limits its temperature range. Therefore the highest allowed temperature for a
working fluid in the ORC is not necessarily achievable through a solar heat source. The
main purpose of this study is to develop a meaningful procedure to compare capabilities
of working fluids when they are employed in solar Rankine cycles with similar working
conditions.
The procedure is presented based on working fluids molecular components,
temperature-entropy diagram and fluid effects on thermal efficiency, net power
generated, vapor expansion ratio, and exergy efficiency of the Rankine cycle. Refprop 8.0
database has been considered as the reference in this study. This program, developed by
the National Institute of Standards and Technology, provides tables and plots of the
thermodynamic and transport properties of industrially important fluids and their
mixtures with an emphasis on refrigerants and hydrocarbons. Refprop 8.0 consists of 85
pure fluids and 55 predefined mixtures. Among them 63 pure fluids and 54 predefined

36
mixtures are organic. R508A and R508B have very low critical temperatures. Therefore
they are not proper to be employed in a Rankine cycle. A total of 115 pure fluids and
predefined mixtures from the Refprop 8.0 database are investigated.
Irreversibility in solar thermal systems is relatively high because of the high
temperature difference between the solar collector and the apparent sun temperature.
Important factors that could lead to irreversibility reduction of the solar ORC by collector
efficiency improvement and using regenerative cycles are investigated at the last section
of this chapter.
3.2. Preliminary Selection
In the preliminary selection Chlorine included fluids and wet fluids should be
discarded. Chlorine containing fluids are not Ozone-safe and have been banned by
Montreal protocol and thus should be avoided in new systems. Among pure fluids of the
Refprop 8.0 database, 12 fluids are chlorine included. Six of them are CFCs and six fluids
are HCFCs. Among predefined mixtures, there are 28 chlorine included fluids. 23
mixtures are CFC included; three mixtures are HCFC included and two of them include
both CFC and HCFC.
Depending on the slope of the temperature-entropy curve to be infinity, positive,
or negative, working fluids can be classified into isentropic, dry, or wet respectively. Dry
or isentropic working fluids are more appropriate for ORC systems. This is because dry
or isentropic fluids are superheated after isentropic expansion. Therefore there is no
concern for existing liquid droplets at the turbine outlet. The slope of the temperature-
entropy curve for some wet fluids is very close to infinity. Furthermore the isentropic

37
efficiency of turbine is less than 100% in the practical cycle. Subsequently the turbine
outlet will be in the dry region that means employing such a fluid causes no problem for
the turbine. There are four wet fluids among the final preselected fluids. Table 3.1 shows
the critical properties of preselected organic fluids with their critical properties.
3.3. Thermodynamic cycle
The heat absorption process in an ORC may end in a saturated vapor state or
superheated vapor state. Generally, superheating in an ORC increases the thermal
efficiency of the cycle with a very low slope but decreases the exergy efficiency of the
cycle. Then superheated cycles are never recommended unless in order to gain more
power at the expense of losing efficiency. In addition, increasing the maximum
temperature of the collector in solar cycles increases the heat loss of it. Because of these
reasons the saturated Rankine cycle has been investigated in this study instead of a
superheated cycle.
Assumptions of the analysis are as follows: steady state condition; no pressure
drop in heat exchangers and connecting pipes, and isentropic efficiencies of the pump and
the turbine are equal to 0.8.
During the next step we should determine the practical pressure and temperature
limits of the cycle. As the higher pressure ratio leads to a higher efficiency, we prefer to
expand higher and lower pressure limits of the cycle, but there are always some practical
restrictions.
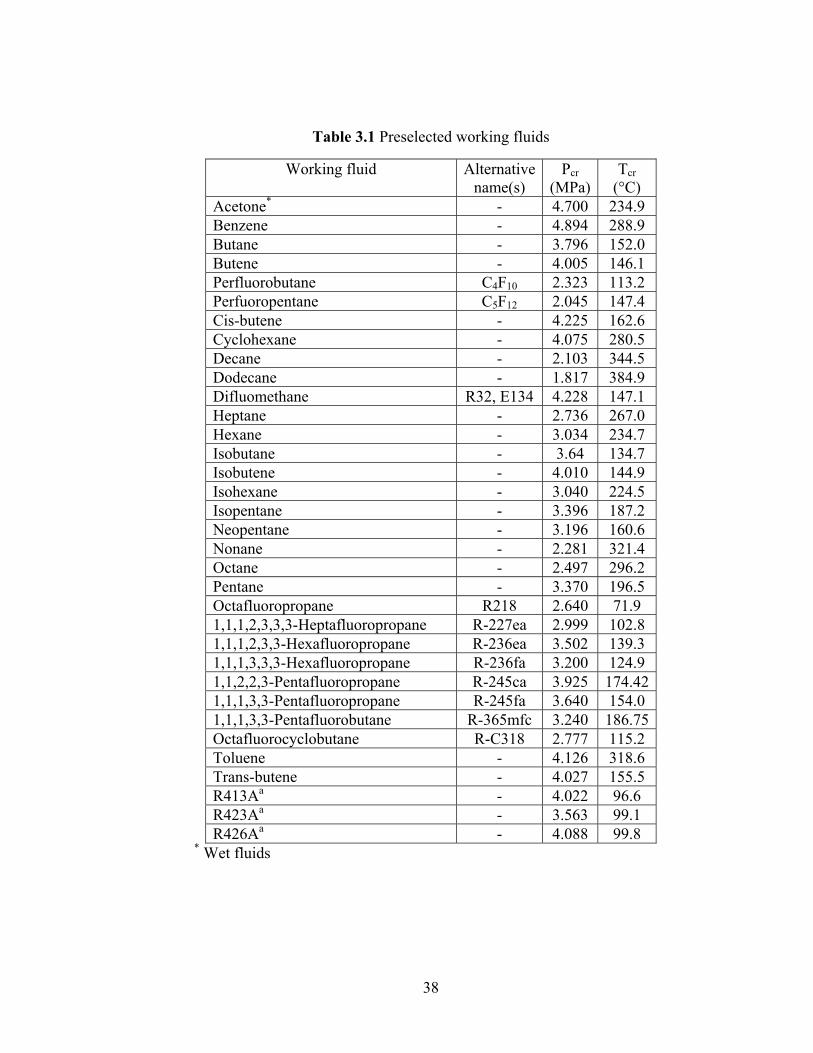
38
Table 3.1 Preselected working fluids
Working fluid Alternative name(s)
Pcr (MPa)
Tcr
(°C) Acetone* - 4.700 234.9 Benzene - 4.894 288.9 Butane - 3.796 152.0 Butene - 4.005 146.1 Perfluorobutane C4F10 2.323 113.2 Perfuoropentane C5F12 2.045 147.4 Cis-butene - 4.225 162.6 Cyclohexane - 4.075 280.5 Decane - 2.103 344.5 Dodecane - 1.817 384.9 Difluomethane R32, E134 4.228 147.1 Heptane - 2.736 267.0 Hexane - 3.034 234.7 Isobutane - 3.64 134.7 Isobutene - 4.010 144.9 Isohexane - 3.040 224.5 Isopentane - 3.396 187.2 Neopentane - 3.196 160.6 Nonane - 2.281 321.4 Octane - 2.497 296.2 Pentane - 3.370 196.5 Octafluoropropane R218 2.640 71.9 1,1,1,2,3,3,3-Heptafluoropropane R-227ea 2.999 102.8 1,1,1,2,3,3-Hexafluoropropane R-236ea 3.502 139.3 1,1,1,3,3,3-Hexafluoropropane R-236fa 3.200 124.9 1,1,2,2,3-Pentafluoropropane R-245ca 3.925 174.42 1,1,1,3,3-Pentafluoropropane R-245fa 3.640 154.0 1,1,1,3,3-Pentafluorobutane R-365mfc 3.240 186.75 Octafluorocyclobutane R-C318 2.777 115.2 Toluene - 4.126 318.6 Trans-butene - 4.027 155.5 R413Aa - 4.022 96.6 R423Aa - 3.563 99.1 R426Aa - 4.088 99.8
* Wet fluids

39
Near critical pressure, small changes in temperature are equivalent to large
changes in pressure that make the system unstable. Therefore a reasonable distance
between the higher limit of the cycle and the critical point of the fluid should be
considered. But there is no unique interpretation of the reasonable distance from critical
point in the literature. Drescher and Bruggemann (2007) suggested setting the higher
pressure limit of the cycle 0.1 MPa lower than critical pressure. Delgado-Torres and
Garcia-Rodriguez (2007b) considered the higher temperature of the cycle to be 10-15 °C
lower than critical temperature. Because of the difference between the critical properties
of working fluids, a fixed pressure or temperature interval near the critical point of the
fluid may not be a consistent way to determine the distance between the higher limit of
the cycle and the critical point of the fluid. For example a 15 °C temperature difference
next to the critical point of Dodecane is equivalent to a 0.332 MPa pressure difference,
while for R-227ea it is equivalent to 0.800 MPa.
The slope of the temperature –entropy diagram has been used to determine the
higher limit of the Rankine cycle in this study. To avoid the presence of liquid in every
single section of the turbine, the highest input pressure of the turbine is the pressure that
the slope of temperature-entropy diagram is equal to infinity at that point (point “A” in
Fig. 3.1). Calculating the higher pressure and temperature limit of the cycle based on this
criterion shows that for most of fluids a large capacity of producing power is neglected.
For example for R32 and Cis-butene, point “A” is 45.1°C and 44.6°C lower than their
own critical temperature respectively.

40
Fig. 3.1 Higher pressure limit of the ORC
To modify this criterion, increasing the higher limit of the cycle in expense of
liquid droplet presence across a small portion of the turbine process is proposed. As has
been shown in Fig. 3.1, by increasing the higher pressure limit of the cycle from Ph1 to
Ph2 liquid droplets present in the turbine across BD. The maximum mass fraction of
liquid in this process belongs to point C. In the modified method the highest allowed
mass fraction of the liquid across the turbine is restricted to one percent. In this method
for both R32 and Cis-butene, higher pressure limit of the cycles are 25°C lower than their
own critical temperature.
Condensing temperature has been set to 25°C in this study. If necessary, the
condenser temperature is raised to make the condenser pressure equal to 5 kPa, the lowest
pressure accepted for the condenser. Table 3.2 shows the practical higher and lower limit
B
T
S
Ph2
C
A Ph1
D
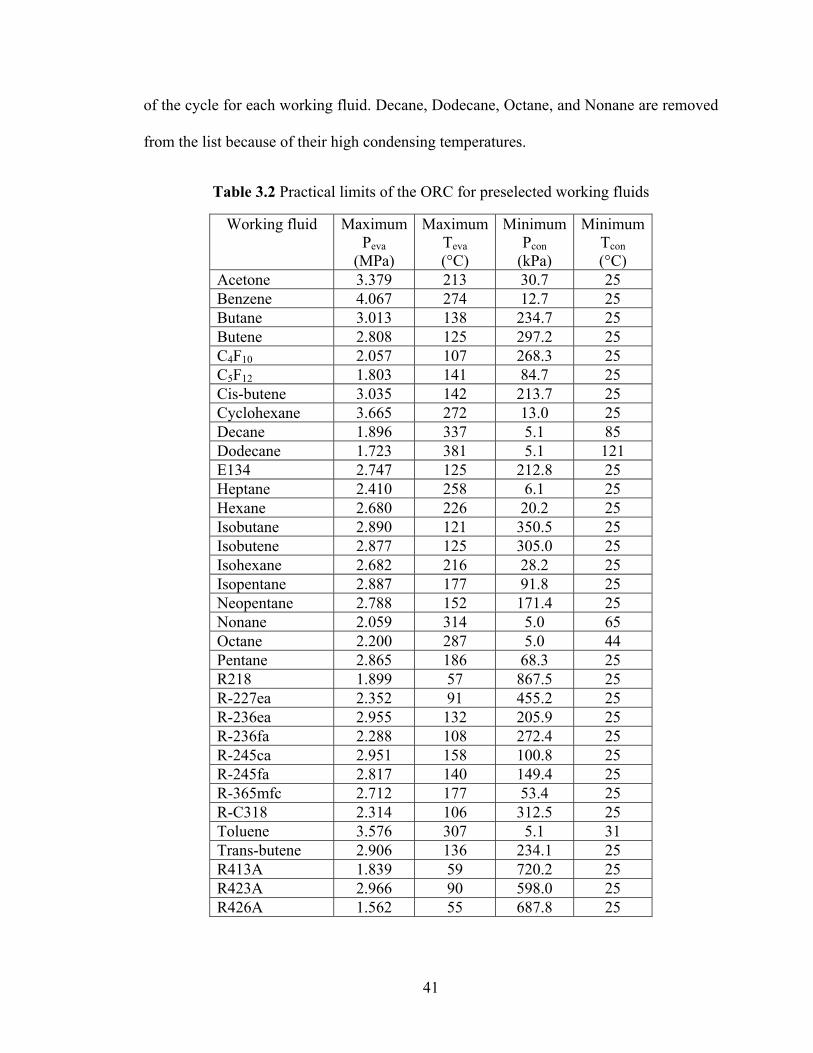
41
of the cycle for each working fluid. Decane, Dodecane, Octane, and Nonane are removed
from the list because of their high condensing temperatures.
Table 3.2 Practical limits of the ORC for preselected working fluids
Working fluid MaximumPeva
(MPa)
MaximumTeva
(°C)
MinimumPcon
(kPa)
Minimum Tcon
(°C) Acetone 3.379 213 30.7 25 Benzene 4.067 274 12.7 25 Butane 3.013 138 234.7 25 Butene 2.808 125 297.2 25 C4F10 2.057 107 268.3 25 C5F12 1.803 141 84.7 25 Cis-butene 3.035 142 213.7 25 Cyclohexane 3.665 272 13.0 25 Decane 1.896 337 5.1 85 Dodecane 1.723 381 5.1 121 E134 2.747 125 212.8 25 Heptane 2.410 258 6.1 25 Hexane 2.680 226 20.2 25 Isobutane 2.890 121 350.5 25 Isobutene 2.877 125 305.0 25 Isohexane 2.682 216 28.2 25 Isopentane 2.887 177 91.8 25 Neopentane 2.788 152 171.4 25 Nonane 2.059 314 5.0 65 Octane 2.200 287 5.0 44 Pentane 2.865 186 68.3 25 R218 1.899 57 867.5 25 R-227ea 2.352 91 455.2 25 R-236ea 2.955 132 205.9 25 R-236fa 2.288 108 272.4 25 R-245ca 2.951 158 100.8 25 R-245fa 2.817 140 149.4 25 R-365mfc 2.712 177 53.4 25 R-C318 2.314 106 312.5 25 Toluene 3.576 307 5.1 31 Trans-butene 2.906 136 234.1 25 R413A 1.839 59 720.2 25 R423A 2.966 90 598.0 25 R426A 1.562 55 687.8 25

42
3.4. Analysis
The equations used to calculate the different parameters to evaluate the
performance of the cycle are presented in this section. The first law of thermodynamics is
applied to the individual components of the cycle and the second law of thermodynamics
is applied to the whole cycle to determine heat transfer, work input and output, and
irreversibility of the cycle. The first law of thermodynamics for steady state steady flow
processes when potential and kinetic energy changes are negligible can be expressed as:
( )(3.1)
where Q, W, , hout and hin are the heat transfer rate, the power exchange, the mass flow
rate and outgoing and incoming flow enthalpies respectively.
The irreversibility rate for a cycle in steady state steady flow condition can be
expressed as: ( ) (3.2) where Lex, T0, Sgen, Exin and Exout are the irreversibility (exergy loss), the entropy
generation rate and incoming and outgoing exergy flows respectively. qj is the heat
transfer per unit mass and Tj is the temperature of the jth component of the cycle.
3.4.1 Basic cycle
Fig. 3.2 shows a general representation of the actual saturated basic Rankine cycle
in the T-s diagram considering assumptions that were mentioned in the previous section.

43
States 1a and 3a are the actual exit states of the pump and the turbine, respectively, and
1s and 3s are the corresponding states for the isentropic case. Heat transfer and power in
each component of the cycle are calculated by applying the first law of thermodynamics
on them.
Fig. 3.2 Actual saturated basic ORC
Evaporator:
(3.3) Turbine/ Expander:
(3.4) Condenser:
(3.5)Pump:
(3.6)
T
S
4
1s 3a
2
1a
3s
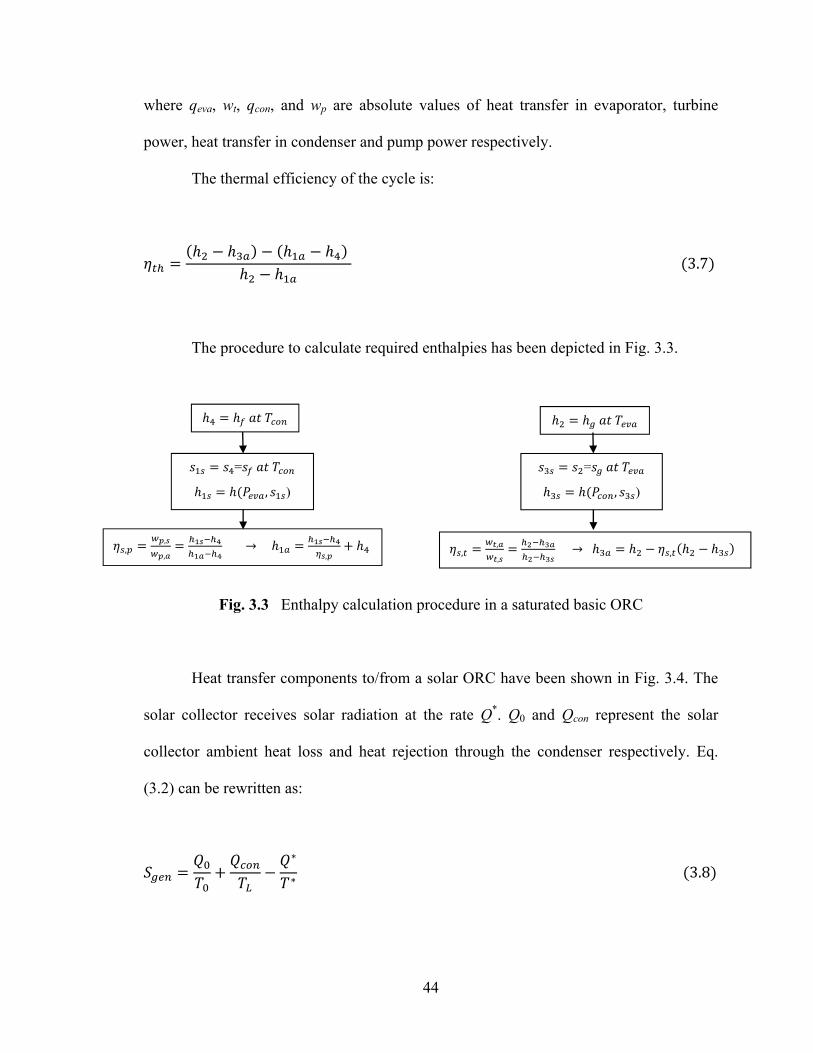
44
where qeva, wt, qcon, and wp are absolute values of heat transfer in evaporator, turbine
power, heat transfer in condenser and pump power respectively.
The thermal efficiency of the cycle is:
( ) ( ) (3.7)
The procedure to calculate required enthalpies has been depicted in Fig. 3.3.
Fig. 3.3 Enthalpy calculation procedure in a saturated basic ORC
Heat transfer components to/from a solar ORC have been shown in Fig. 3.4. The
solar collector receives solar radiation at the rate Q*. Q0 and Qcon represent the solar
collector ambient heat loss and heat rejection through the condenser respectively. Eq.
(3.2) can be rewritten as:
∗∗ (3.8)
= ( , )
, ,, → ,
= ( , )
, ,, → , ( )

45
where T* is the apparent sun temperature as an exergy source, T0 is the ambient
temperature , and TL is the temperature of the heat carrying fluid in condenser. In this
study the value suggested by Petela for T* is adopted that is approximately equal to ¾ Ts,
where Ts is the apparent black body temperature of the sun, which is about 6000K.
Therefore, the T* considered here is 4500 K.
Fig. 3.4 Heat transfer components to/from a solar ORC
Assuming that the temperature difference between the heat carrying fluid and the
condenser is ∆T yields
∆ (3.9)
Evaporator
Condenser
Pump Turbine
Qcon
Q0 Q*

46
∆T has been considered 15°C in this analysis. The net heat absorption by the
evaporator (Qeva) will be the difference between the solar radiation received by the
collector (Q*) and the solar collector ambient heat loss (Q0).
∗ (3.10)
The solar collector’s efficiency ηc is defined as that fraction of the solar radiation
which reaches the receiver and is absorbed there:
∗ (3.11)
By using Eqs. (3.9), (3.10), and (3.11), Eq. (3.8) can be written as:
1 1∗ (3.12)
The only parameter that we should determine to fulfill calculations is the solar
collector efficiency. Every single type of a solar collector has its own formula to calculate
its efficiency that is a function of the geometry of the collector and the thermo physical
properties of the materials that have been used to build it. In this analysis the Parabolic
Trough Collectors (PTCs) suggested by Delgado-Torres and Garcia-Rodriguez (2007a)
are adopted: LS-3 and IND300.
47
The LS-3 model is one of the biggest collectors within the family of commercial
PTCs that has been used in some of the largest solar energy plants built in Mojave Desert
in California. It was also the PTC chosen to demonstrate the technical feasibility of the
direct steam generation process within the scope of Direct Solar Steam (DISS) project.
The efficiency of the LS-3 PTC is given by the following expression:
( , , ) , . ( ). . ( )(3.13)
where ηopt,0 is the collector efficiency at a zero incidence angle, is the angle of
incidence of the direct solar radiation, K( ) is the incidence angle modifier, Fe is the dirt
degree of the collector mirrors, is the thermal loss coefficient per unit area of the
absorber tube, Cg is the geometric concentration ratio, is the absorber’s tube average
temperature, T0 is the ambient temperature and Gb is the direct solar irradiance.
The thermal loss coefficient per unit area of the tube is given by Eq. (3.14).
( ) ( ) . (3.14)
The values for the coefficients a, b, and c are shown in Table 3.3. The rest of the
parameters in Eq. (3.13) are set as follows: ηopt,0 =0.77, K( )=1, Fe=0.967, Cg=26.2,
T0=300K, and Gb=850 W/m2. In this analysis it has been assumed that the average

48
temperature of the working fluid in the collector and the average temperature of the
absorber’s tube are the same.
Table 3.3 Values of the coefficients for the thermal loss coefficient of the LS-3 PTC absorber tube [Delgado-Torres and Garcia-Rodriguez (2007a)]
a b c 200 0.68726 0.002 2.6 x 10⁻⁵ 200 300 1.43324 -0.01 4.6 x 10⁻⁵ 300 2.89547 -0.016 6.5 x 10⁻⁵
The IND300 model is a smaller PTC in comparison to the LS-3 made by the
Israeli company Solel Solar Systems. The IND300 PTC’s efficiency is given by Eq.
(3.15).
0.733 0.238 0.0013 (3.15)
where is the average temperature of the working fluid in the collector.T0 and Gb for
IND300 PTC have the same value for the LS-3 model.
The exergy efficiency of the cycle is defined by:
(3.16)
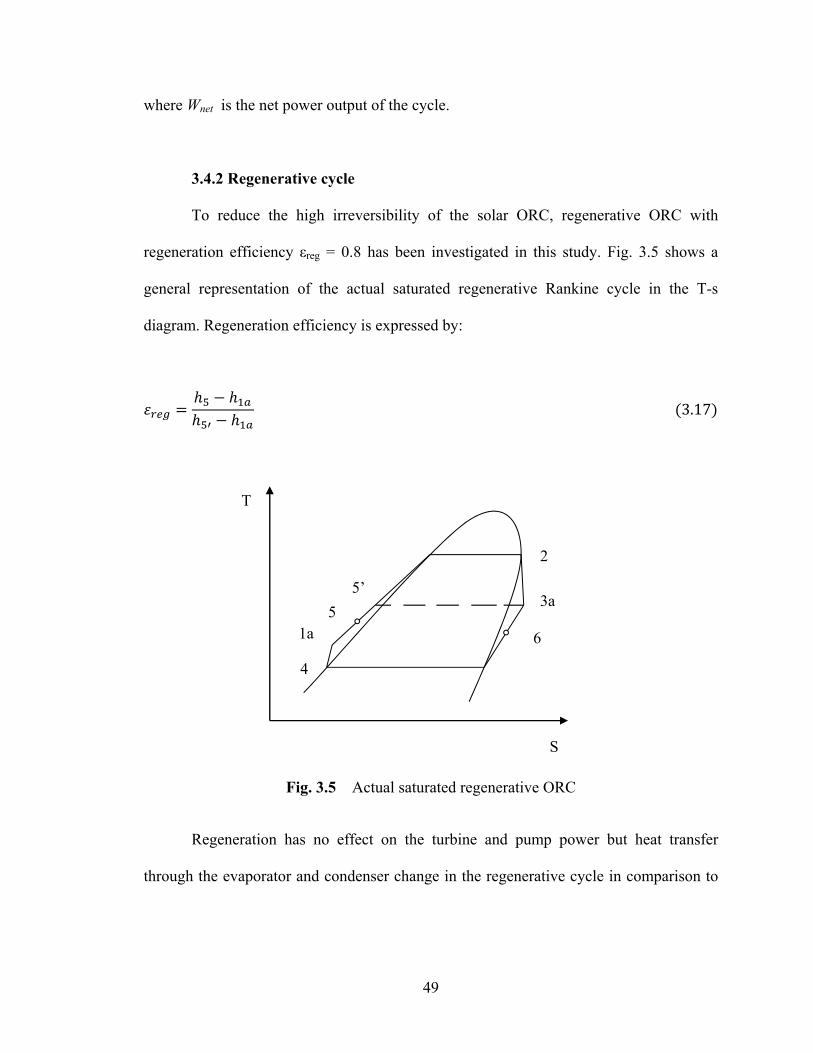
49
where Wnet is the net power output of the cycle.
3.4.2 Regenerative cycle
To reduce the high irreversibility of the solar ORC, regenerative ORC with
regeneration efficiency εreg = 0.8 has been investigated in this study. Fig. 3.5 shows a
general representation of the actual saturated regenerative Rankine cycle in the T-s
diagram. Regeneration efficiency is expressed by:
(3.17)
Fig. 3.5 Actual saturated regenerative ORC
Regeneration has no effect on the turbine and pump power but heat transfer
through the evaporator and condenser change in the regenerative cycle in comparison to
T
S
4
3a
2
1a
5’
5
6

50
the basic cycle. Applying the first law of thermodynamics on the evaporator and
condenser processes yields:
Evaporator: (3.18) Condenser:
(3.19)
The procedure to calculate enthalpies of common states with basic cycle (4, 1a, 2,
and 3a) are exactly the same. The enthalpy calculation procedure of states 5 and 6 has
been shown in Fig. 3.6. It should be noticed that in this procedure it is assumed that the
regenerator is well insulated and changes in kinetic and potential energies are negligible.
For exergy efficiency calculations in the regenerative ORC, the same equations of the
basic ORC are applicable.
Fig. 3.6 Supplementary enthalpy calculation procedure in a saturated regenerative ORC
( , )( , )
- → +
→ ( )
51
3.5. Results and discussion
In this section four main subjects will be discussed. The first subject is to choose
dominant factors influencing the performance of an ORC. The second is the calculation
of maximum practical thermal efficiency of an ORC through employing each working
fluid. The third subject is to complete the comparing procedure of working fluids, started
at section 2, based on their effects on the performance of the ORC. The fourth subject
focuses on investigation of different methods to reduce irreversibility of the ORC.
3.5.1. Dominant factors influencing the performance of an ORC
The first factor which is always the center of attention among different factors in a
Rankine cycle is the thermal efficiency or the first law efficiency of the cycle. For a
specific working fluid and particular amount of input heat rate the higher thermal
efficiency leads to the higher net power output. As we want to compare different working
fluids in the Rankine cycle, the net power output should be considered along with the
thermal efficiency.
If for a small amount of work, a high vapor expansion ratio occurs across the
turbine (VER), supersonic flow problems, higher turbine size or greater number of stages
are inevitable. Thus the high vapor expansion ratio across the turbine is an undesirable
factor in an ORC. Exergy efficiency or second law efficiency is the factor which helps us
to choose working fluids that recover a greater portion of input exergy of the cycle.
Consequently; thermal efficiency, net power output, vapor expansion ratio across
the turbine, and exergy efficiency of the cycle are the most important factors to be
considered as the performance improvement of an ORC.

52
3.5.2. Maximum thermal efficiency of the ORC for different working fluids
Maximum practical thermal efficiency and corresponding performance factors for
preselected working fluids are calculated in this section. Because of the increasing trend
of ηth, wnet, VER, and ηex with Teva in all fluids, their maximum happen at maximum Teva.
Figure 3.7 shows this increasing trend for R-236ea as an example. Calculation results for
best possible performance of each working fluid in an ORC can be seen in Table 3.4.
Results have been sorted from smallest to largest maximum Teva.
(a) (b)
Fig. 3.7 Variation of performance factors with respect to Teva of an ORC employing R-236ea as working fluid (a) VER and wnet (b) ηth and ηex
Results shown in Table 3.4 confirm conclusions of chapter 2. The higher critical
temperature allows setting the evaporation temperature at a higher level that leads to the
higher thermal efficiency of the cycle. Generally, high thermal efficiency ORCs are
achievable by using hydrocarbons rather than refrigerants. This means hydrocarbons have
0
10
20
30
40
50
05
1015202530
40 60 80 100 120 140
Wne
t (KJ
/Kg)
VER
Teva (°C)
Vapor Expantion Ratio
Wnet(KJ/Kg)
0
4
8
12
16
40 60 80 100 120 140Teva (°C)
Thermal Efficiency (%)
Exergy Efficiency - IND300 (%)
Exergy Efficiency - LS-3 (%)

53
Table 3.4 Maximum delivery of an ORC employing different working fluids
Working fluid
Maximum Teva
(°C)
Minimum Tcon
(°C)
Maximum ηth (%)
Maximum wnet
(KJ/Kg)
Maximum VER
Maximum ηex for
IND300 (%)
Maximum ηex for LS-3 (%)
R426A 55 25 6.37 11.92 2.35 4.74 4.86 R218 57 25 5.73 5.03 2.86 4.28 4.38 R413A 59 25 7.05 12.60 2.66 5.25 5.38 R423A 90 25 10.28 16.50 6.93 7.59 7.85 R-227ea 91 25 10.11 14.06 7.65 7.49 7.74 R-C318 106 25 11.22 16.20 11.74 8.31 8.62 C4F10 107 25 10.53 13.87 13.47 7.85 8.13 R-236fa 108 25 12.31 22.93 12.02 9.07 9.43 Isobutane 121 25 13.78 58.08 11.73 10.10 10.55 Butene 125 25 14.78 66.53 12.08 8.62 8.94 Isobutene 125 25 14.65 66.27 12.35 10.70 11.20 E134 125 25 14.79 37.08 16.29 10.80 11.31 R-236ea 132 25 14.29 30.40 21.60 10.48 10.97 Trans-butene
136
25 15.84 77.05 16.17 11.53 12.11
Butane 138 25 15.48 74.78 17.61 11.30 11.86 R-245fa 140 25 15.57 40.04 26.50 11.37 11.94 C5F12 141 25 12.37 21.31 38.19 9.28 9.71 Cis-butene 142 25 16.50 82.09 25.91 11.98 12.62 Neopentane 152 25 15.52 71.78 26.90 11.40 11.99 R-245ca 158 25 16.96 48.20 43.12 12.34 13.03 Isopentane 177 25 17.75 97.10 50.62 12.94 13.75 R-365mfc 177 25 17.55 56.28 84.27 12.82 13.61 Pentane 186 25 18.51 108.12 67.40 13.45 14.34 Acetone 213 25 22.54 155.44 128.27 15.87 17.24 Isohexane 216 25 19.27 123.32 169.34 14.07 15.17 Hexane 226 25 20.08 135.54 232.50 14.59 15.81 Heptane 258 25 20.81 158.24 720.95 15.14 16.64 Cyclohexane 272 25 23.49 170.22 508.92 16.71 18.48 Benzene 274 25 25.79 179.00 428.71 17.88 19.92 Toluene 307 31 25.60 190.82 1106.28 17.87 20.09
a higher potential to produce power in a Rankine cycle than refrigerants because of their
relatively high critical temperature. On the other hand hydrocarbons are more flammable
in comparison to refrigerants. These results add to previous conclusions that the exergy
efficiency has almost the same trend of thermal efficiency with respect to the critical
54
temperature of the fluid. In general, the same as thermal efficiency, the exergy efficiency
of refrigerants are lower than hydrocarbons.
3.5.3. Comparing procedure of preselected working fluids
A specific solar collector in a region with a definite direct solar irradiance can
maintain temperatures within restricted limits. Therefore the highest allowed temperature
for a working fluid in the ORC is not necessarily achievable through solar heat source.
Thus the capabilities of different working fluids should be compared in ORCs
with similar collector temperatures. Solar collectors can be categorized based on the
temperature level that they can maintain. Generally there are three temperature level solar
collectors:
(1) Low temperature solar collectors: with the output temperature less than 85 °C.
Flat plate solar collectors are in this category.
(2) Medium temperature solar collectors: with the output temperature below 130-
150 °C. Most evacuated tube collectors are in this category.
(3) High temperature solar collectors: with the output temperature higher than 150
°C. Parabolic trough collectors are mainly in this category.
High temperature solar collectors are suitable for large scale power generation
applications. In this section a comparison between performance factors of ORCs
employing different working fluids at Teva=85 °C and 130°C will be made. Figures (3.8)
to (3.13) show variation of performance factors of the ORC for different working fluids
at two evaporating temperatures.

55
As it can be observed for almost all fluids in both evaporating temperatures, the
thermal efficiency and exergy efficiency of the ORC have the same trend with respect to
changing working fluids. Therefore the thermal efficiency and exergy efficiency of the
cycle play the same role in selecting the proper working fluid.
The main criterion to select working fluid is considered the cycle thermal/exergy
efficiency in this study. Among fluids with the same order of the cycle thermal/exergy
efficiency, the net power output of the ORC is a determinant factor to select the working
fluid. The third step will be eliminating fluids with a high VER at the close level of
efficiencies and wnet.
As maximum thermal efficiency calculations show and Figures (3.8) to (3.13)
confirm, refrigerants have a lower capacity to produce power through the ORC. On the
other hand refrigerants are less flammable and in some cases less hazardous than non-
refrigerant fluids. Therefore fluids can be analyzed in two different categories:
refrigerants and non-refrigerants.
Figures (3.8) and (3.9) show that among refrigerants, R245fa, R265mfc, and
R245ca provide higher cycle efficiency and wnet. R365mfc have a higher VER in the
cycle but almost the same cycle efficiency and wnet as shown in Fig. (3.10). Thus the final
refrigerants selected at medium temperature level (Teva=130°C) will be R245fa and
R245ca.
For non-refrigerants, at the medium temperature level, Toluene, Cyclohexane,
Acetone, and Benzene provide a higher cycle efficiency as illustrated in Fig. (3.8).
Among them, Acetone and Benzene produce more wnet as can be recognized in Fig. (3.9).
Fig. (3.10) shows that Benzene has higher VER in the cycle, but because of higher cycle

56
efficiency with respect to Acetone, we will keep it in our final fluids’ list. According to
Fig (3.8) and (3.9), there are eight non-refrigerant fluids, cycle efficiency and wnet of
which are about the same level. However their cycle efficiency and power level is lower
than cycle efficiency and power level of the other four non-refrigerant fluids mentioned
above, it is good to find the most suitable fluids out of this group to add to the final
fluids’ list. Fig. (3.10) shows that from this group of eight, Butane , Isopentane, Trans-
butene, and Cis-butene have a lower VER in the cycle, so they can be in the final list as
medium performance non-refrigerants.
Fig. 3.8 Thermal and exregy efficiency of the ORC for different working fluids at Teva=130°C
6
8
10
12
14
16
18
20
C5F1
2
R236
ea
Neo
pent
ane
R245
fa
Buta
ne
R365
mfc
Isop
enta
ne
R245
ca
Tran
s-bu
tene
Isoh
exan
e
Pent
ane
Hexa
ne
Cis-
bute
ne
Hept
ane
Tolu
ene
Cycl
ohex
ane
Acet
one
Benz
ene
Teva= 130 °C
Thermal Efficiency (%) Exergy Efficiency - IND300 (%)
Exergy Efficiency - LS-3 (%)

57
Fig. 3.9 Net output power of the ORC for different working fluids at Teva=130°C
All together, the final selected fluids for a solar ORC at medium temperature level
are as follows:
(a) R245fa and R245ca in the refrigerant group
(b) Acetone and Benzene in the high performance non-refrigerant group
(c) Butane, Isopntane, Trans-butene, and Cis-butene in the medium performance
non-refrigerant group
At the low temperature level the procedure is exactly the same as at the medium
temperature level. As some fluids have low critical temperatures (i.e. R227ea) they are
included in the low temperature level analysis but are not included in the medium
0
20
40
60
80
100
120
C5F1
2
R236
ea
Neo
pent
ane
R245
fa
Buta
ne
R365
mfc
Isop
enta
ne
R245
ca
Tran
s-bu
tene
Isoh
exan
e
Pent
ane
Hexa
ne
Cis-
bute
ne
Hept
ane
Tolu
ene
Cycl
ohex
ane
Acet
one
Benz
ene
wne
t(K
J/Kg
)
Teva= 130 °C

58
temperature level analysis. The only liquid that is included in the medium temperature
analysis but it is not included in the low temperature analysis is Acetone. Acetone is a
wet fluid whose slope of temperature-entropy curve is very close to infinity. The
isentropic efficiency of the turbine is assumed 80% in this study. With this amount of
isentropic efficiency the fluid across the turbine falls into the wet region for Teva less than
124°C. This means that for Acetone in addition to the higher limit, there is lower limit for
Teva.
Fig. 3.10 Vapor expansion ratio in the ORC for different working fluids at Teva=130°C
0
5
10
15
20
25
30
35
40
C5F1
2
R236
ea
Neo
pent
ane
R245
fa
Buta
ne
R365
mfc
Isop
enta
ne
R245
ca
Tran
s-bu
tene
Isoh
exan
e
Pent
ane
Hexa
ne
Cis-
bute
ne
Hept
ane
Tolu
ene
Cycl
ohex
ane
Acet
one
Benz
ene
VER
Teva= 130 °C
59
Fig. (3.11) and (3.12) show that among refrigerants R245fa, R365mfc, E134, and
R245ca provide a higher cycle efficiency and wnet. R365mfc has a higher VER but almost
the same cycle efficiency and wnet as shown in Fig. (3.13). Thus the final refrigerants
selected at the low temperature level (Teva=85°C) will be R245fa, E134, and R245ca.
For non-refrigerants at the low temperature level Toluene, Cyclohexane and
Benzene provide higher cycle efficiency as illustrated in Fig. (3.11). As can be seen in
Fig. (3.12) and (3.13), their wnet and VER are at the same level. As depicted in Fig (3.11)
and (3.12), eleven non-refrigerant fluids have very close cycle efficiencies and power
outputs. Although their cycle efficiencies and power outputs are lower than cycle
efficiencies and power outputs of non-refrigerants mentioned above, it is good to pick the
most suitable fluids out of this group as it has been done for the medium temperature
level. Fig. (3.11) shows that from this group of eleven, Butene has a lower exergy
efficiency; Toluene, Isohexane, Pentane, Hexane, and Heptane have a higher VER as
illustrated in Fig. (3.13). Since Butane, Isobutene, Isopentane, Trans-butene, and Cis-
butene have a lower VER in the cycle, they can be in the final list as medium
performance non-refrigerants.
All together, the final selected fluids for a solar ORC at the low temperature level
are as follows:
(a) R245fa, E134 and R245ca in the refrigerant group
(b) Benzene and Cyclohexane in the high performance non-refrigerant group
(c) Butane, Isobutene, Isopentane, Trans-butene, and Cis-butene in the medium
performance non-refrigerant group

60
Fig. 3.11 Thermal and exregy efficiency of the ORC for different working fluids at Teva=85°C
3.5.4. Exergy efficiency enhancement in a solar ORC
Irreversibility in solar thermal systems is relatively high because of the high
temperature difference between the solar collector and the apparent sun temperature.
Collector efficiency improvement and use of the regenerative ORC instead of the basic
cycle are investigated in this section to reduce irreversibility of a solar ORC.
Exergy efficiency enhancement and irreversibility reduction are calculated for all
11 selected fluids when the collector efficiency increases from 70% to 100% at low and
medium temperature levels. Seventy percent has been selected as a benchmark because
5
6
7
8
9
10
11
12
13C4
F10
C5F1
2R2
27ea
RC31
8R4
23A
R236
faR4
16A
R236
eaN
eope
ntan
eIs
obut
ane
Tolu
ene
R245
faBu
tane
Isob
uten
eR3
65m
fcBu
tene
Isop
enta
neE1
34R2
45ca
Isoh
exan
ePe
ntan
eTr
ans-
bute
neHe
xane
Hept
ane
Cis-
bute
neCy
cloh
exan
eBe
nzen
e
Teva= 85 °C
Thermal Efficiency (%) Exergy Efficincy - IND300 (%)
Exergy Efficiency- LS-3 (%)

61
the collector efficiency for two selected models, IND300 and LS-3, for most analyzed
fluids in this study is close to 70% for a large interval of Teva. Calculations show that the
exergy efficiency variation with respect to collector efficiency at each temperature level
not only has the same trend but also the exergy efficiency enhancement percentage is
almost the same for all selected fluids. It is also correct for the irreversibility reduction
trend and percentage.
Fig. 3.12 Net output power of the ORC for different working fluids at Teva=85°C
0
10
20
30
40
50
60
70
C4F1
0C5
F12
R227
eaRC
318
R423
AR2
36fa
R416
AR2
36ea
Neo
pent
ane
Isob
utan
eTo
luen
eR2
45fa
Buta
neIs
obut
ene
R365
mfc
Bute
neIs
open
tane
E134
R245
caIs
ohex
ane
Pent
ane
Tran
s-bu
tene
Hexa
neHe
ptan
eCi
s-bu
tene
Cycl
ohex
ane
Benz
ene
wne
t (KJ
/Kg)
Teva= 85 °C

62
Fig. 3.13 Vapor expansion ratio in the ORC for different working fluids at Teva=85°C
Fig. (3.14) shows the variation of irreversibility reduction and exergy efficiency
enhancement for Isopentane as a representative. As seen in Fig. (3.14), the theoretical
limit for irreversibility reduction through collector efficiency improvement for two
selected collector models, IND300 and LS-3, is 35%. It also shows this limit is 5% for
the exergy efficiency enhancement.
0
2
4
6
8
10
12
C4F1
0C5
F12
R227
eaRC
318
R423
AR2
36fa
R416
AR2
36ea
Neo
pent
ane
Isob
utan
eTo
luen
eR2
45fa
Buta
neIs
obut
ene
R365
mfc
Bute
neIs
open
tane
E134
R245
caIs
ohex
ane
Pent
ane
Tran
s-bu
tene
Hexa
neHe
ptan
eCi
s-bu
tene
Cycl
ohex
ane
Benz
ene
VER
Teva= 85 °C
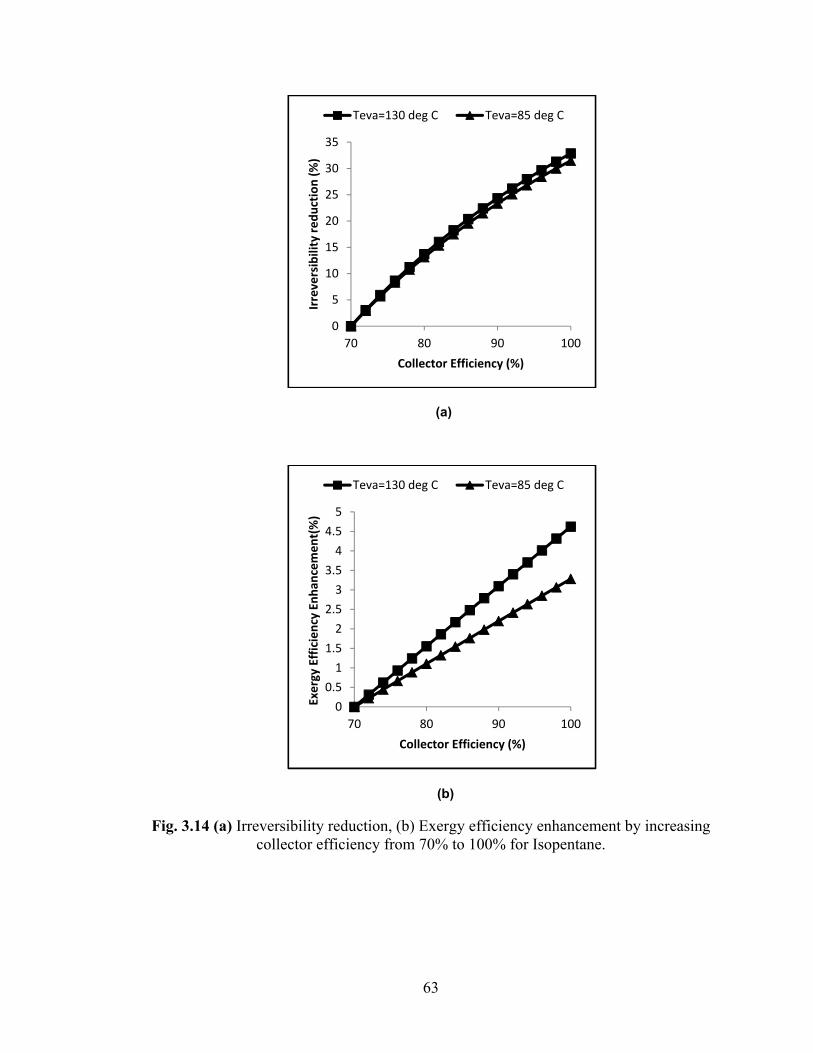
63
(a)
(b)
Fig. 3.14 (a) Irreversibility reduction, (b) Exergy efficiency enhancement by increasing collector efficiency from 70% to 100% for Isopentane.
0
5
10
15
20
25
30
35
70 80 90 100
Irrev
ersi
bilit
y re
duct
ion
(%)
Collector Efficiency (%)
Teva=130 deg C Teva=85 deg C
00.5
11.5
22.5
33.5
44.5
5
70 80 90 100
Exer
gy E
ffici
ency
Enh
ance
men
t(%
)
Collector Efficiency (%)
Teva=130 deg C Teva=85 deg C

64
The second method to reduce irreversibility of a cycle is using the regenerative
cycle instead of the basic cycle. Regeneration reduces the absorption heat while keeping
the net power output constant. In other words regeneration enhances thermal and exergy
efficiency simultaneously. For the 11 selected fluids regenerative cycles with
regeneration efficiency εreg = 0.8 have been investigated at low and medium temperature
levels. As illustrated in Table 3.5, in contrast with collector efficiency improvement
effect on the exergy efficiency of the cycle, regeneration’s effect on the exergy efficiency
of the ORC is fluid dependent.
Table 3.5 Regeneration Effects on thermal efficiency, exergy efficiency, and irreversibility of a solar ORC employing IND300 and LS-3 solar collectors for different
working fluids
Working fluid
Teva= 85°C Teva= 130°C
∆ηth
(%)
∆ηex
(%) for
IND300
∆Lex
(%) for
IND300
∆ηex
(%) for
LS-3
∆Lex
(%) for
LS-3
∆ηth
(%)
∆ηex
(%) for
IND300
∆Lex
(%) for
IND300
∆ηex
(%) for LS-3
∆Lex
(%) for
LS-3
Acetone NA NA NA NA NA 0.02 0.02 0.14 0.02 0.15 Benzene 0.18 0.13 1.55 0.14 1.60 0.94 0.62 5.35 0.70 5.75 Butane 0.91 0.64 7.96 0.68 8.19 1.75 1.18 10.84 1.30 11.43Cis-butene 0.40 0.29 3.58 0.30 3.70 0.73 0.54 5.10 0.60 5.41 Cyclohexane 0.76 0.53 6.28 0.57 6.48 2.27 1.48 12.23 1.66 13.02E134 0.52 0.37 4.71 0.39 4.85 NA NA NA NA NA Isobutene 0.62 0.44 5.52 0.46 5.69 NA NA NA NA NA Isopentane 1.32 0.92 10.97 0.98 11.27 3.15 2.07 17.47 2.30 18.39R245ca 1.05 0.74 8.95 0.78 9.19 2.35 1.57 13.75 1.74 14.49R245fa 1.01 0.72 8.82 0.76 9.06 2.04 1.37 12.44 1.51 13.09Trans-butene 0.56 0.40 5.01 0.43 5.16 1.02 0.69 6.45 0.76 6.83
Molecular complexity (σ) is proposed as a criterion to find a trend of regeneration
effect on the ORC performance. Molecular complexity is defined as: әә , . (3.20)

65
where Pr and Tr are reduced pressure and temperature respectively, R is gas constant and
SV stands for saturation vapor.
The higher slope of the entropy-temperature diagram results in higher molecular
complexity. Table 3.6 shows the molecular complexity of selected fluids.
Table 3.6 Molecular complexity of working fluids
Working fluid σ Acetone -2.13 Benzene 4.22 Butane 1.78 Cis-butene -1.18 Cyclohexane 8.97 E134 -0.3 Isobutene 0.56 Isopentane 7.2 R245ca 4.33 R245fa 2.76 Trans-butene 0.14
Figures (3.15) and (3.16) show thermal and exergy efficiency enhancement and
irreversibility reduction of the ORC by using the regenerative cycle for selected working
fluids. In these figures fluids are arranged in the horizontal axis in ascending order of
molecular complexity.
At both temperature levels and based on all performance factors discussed in this
section higher molecular complexity results in a more effective regenerative cycle. The
only exceptions to this rule are Benzene and Cyclohexane. This means that the
regeneration will be more effective in ORCs employing high molecular complexity
working fluids if they are not Cyclohydrocarbons.

66
(a)
(b) Fig. 3.15 (a) Thermal and exergy efficiency enhancement, (b) Irreversibility reduction by using regenerative ORC based on molecular complexity of working fluids (Teva=130°C)
00.5
11.5
22.5
33.5
Acet
one
Cis-
bute
ne
Tran
s-bu
tene
Buta
ne
R245
fa
Benz
ene
R245
ca
Isop
enta
ne
Cycl
ohex
ane
Teva=130°C
Thermal efficiency enhancement (%)
Exergy efficiencyenhancement -IND300 (%)
Exergy efficiency enhancement- LS-3 (%)
02468
101214161820
Acet
one
Cis-
bute
ne
Tran
s-bu
tene
Buta
ne
R245
fa
Benz
ene
R245
ca
Isop
enta
ne
Cycl
ohex
ane
Teva=130°C
Irreversibility reduction-IND300 (%) Irreversibility reduction- LS-3 (%)
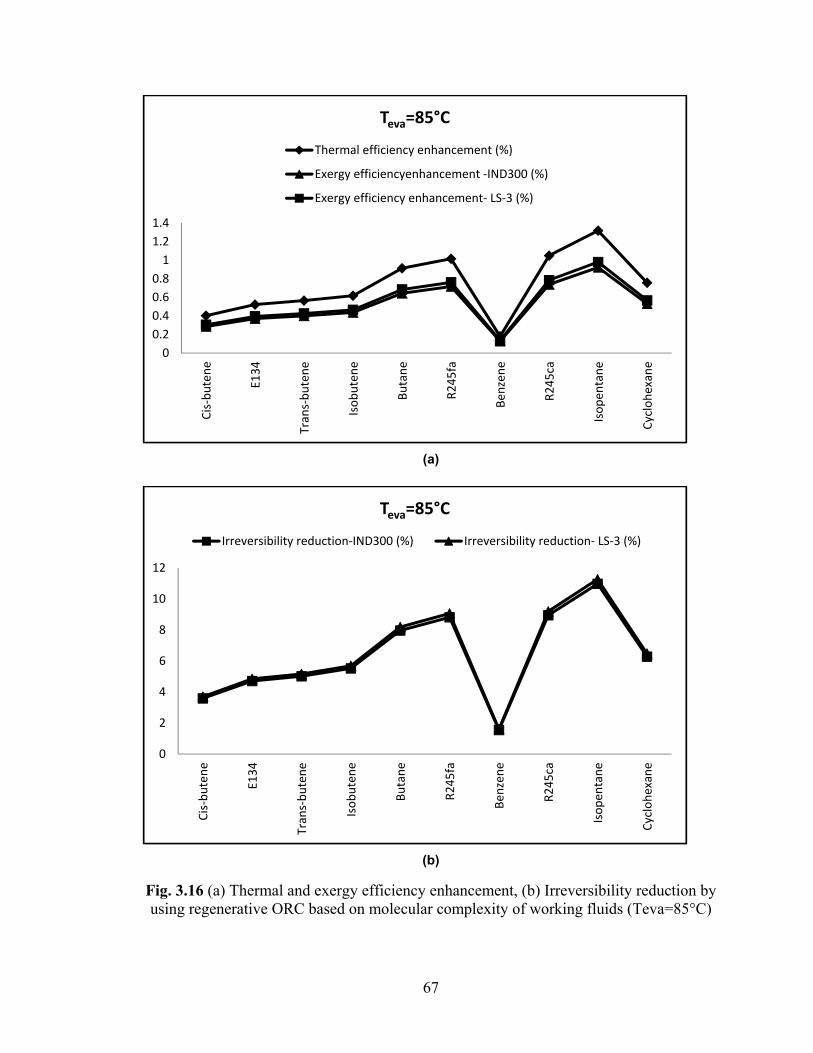
67
(a)
(b)
Fig. 3.16 (a) Thermal and exergy efficiency enhancement, (b) Irreversibility reduction by using regenerative ORC based on molecular complexity of working fluids (Teva=85°C)
00.20.40.60.8
11.21.4
Cis-
bute
ne
E134
Tran
s-bu
tene
Isob
uten
e
Buta
ne
R245
fa
Benz
ene
R245
ca
Isop
enta
ne
Cycl
ohex
ane
Teva=85°C
Thermal efficiency enhancement (%)
Exergy efficiencyenhancement -IND300 (%)
Exergy efficiency enhancement- LS-3 (%)
0
2
4
6
8
10
12
Cis-
bute
ne
E134
Tran
s-bu
tene
Isob
uten
e
Buta
ne
R245
fa
Benz
ene
R245
ca
Isop
enta
ne
Cycl
ohex
ane
Teva=85°C
Irreversibility reduction-IND300 (%) Irreversibility reduction- LS-3 (%)
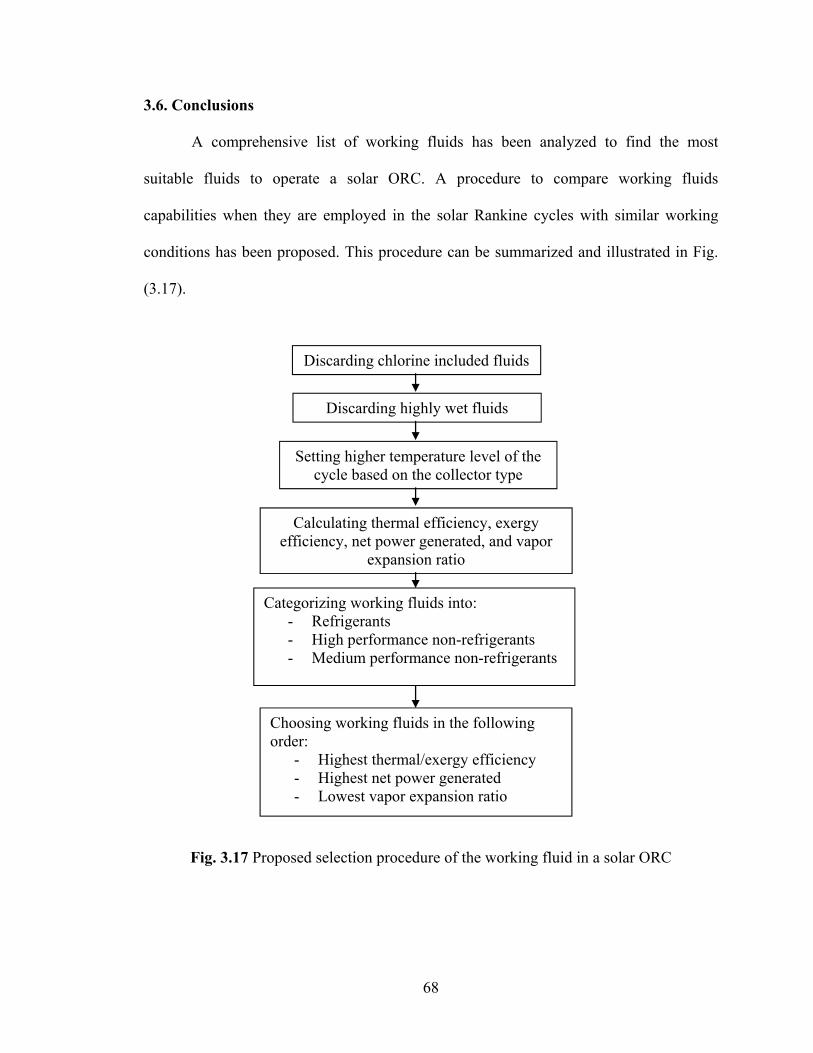
68
3.6. Conclusions
A comprehensive list of working fluids has been analyzed to find the most
suitable fluids to operate a solar ORC. A procedure to compare working fluids
capabilities when they are employed in the solar Rankine cycles with similar working
conditions has been proposed. This procedure can be summarized and illustrated in Fig.
(3.17).
Fig. 3.17 Proposed selection procedure of the working fluid in a solar ORC
Discarding chlorine included fluids
Discarding highly wet fluids
Calculating thermal efficiency, exergy efficiency, net power generated, and vapor
expansion ratio
Setting higher temperature level of the cycle based on the collector type
Categorizing working fluids into: - Refrigerants - High performance non-refrigerants - Medium performance non-refrigerants
Choosing working fluids in the following order:
- Highest thermal/exergy efficiency - Highest net power generated - Lowest vapor expansion ratio

69
At the first step of the procedure Chlorine included fluids and wet fluids have
been discarded. The slope of the temperature-entropy curve for some wet fluids is very
close to infinity. These fluids have been selected at this step.
The maximum practical thermal efficiency and corresponding performance
factors for preselected working fluids confirm that fluids with higher critical temperature
have better performance in the ORC. Calculation shows that the thermal efficiency higher
than 25% and the exergy efficiency higher than 20% are achievable in ORCs.
In the next step a comparison between different ORC working fluids based on
fluids effect on the thermal /exergy efficiency, net power generated, and vapor expansion
ratio of the Rankine cycle has been accomplished. Thermal efficiency and exergy
efficiency of the ORC have the same trend with respect to changing working fluids.
Therefore thermal efficiency and exergy efficiency of the cycle play the same role in
selecting a proper working fluid. In the investigation, two temperature levels for Teva have
been considered which are 85 °C and 130 °C as representatives of low temperature and
medium temperature solar collectors.
The main criterion for selecting a working fluid in this study was the
thermal/exergy efficiency. After that among fluids with the same order of thermal/exergy
efficiency, net power output of the ORC is a determinant factor to select the working
fluid. The third step will be eliminating fluids with a high vapor expansion ratio at the
close level of cycle efficiencies and power outputs.
Fluids have been divided into two groups: refrigerants and non-refrigerants.
Fluids with the best performance in the ORC have been recognized in each group. In the
non-refrigerant’s group, two different subdivisions have been considered: high

70
performance fluids and medium performance fluids. The reason for this subdivision is
that most non-refrigerants are in the medium performance group. Then by considering all
non-refrigerants as one group, a large group of fluids would be omitted from analysis.
At medium temperature level the final selected refrigerants through the introduced
procedure are R245fa and R245ca. The final selected non-refrigerants at Teva=130 °C are
Acetone and Benzene with the high performance and Butane, Isopentane, Transbutan,
and Cis-butene with the medium performance.
At the low temperature level only a few numbers of fluids have been changed in
comparison to fluids selected at the medium temperature level. At Teva=85 °C, E134 has
been added to the selected refrigerants at Teva=130 °C. In the non-refrigerants group
Acetone has been replaced by Cyclohexane and Isobutene has been added to the fluids
with the medium performance capability.
Collector efficiency improvement and use of regenerative ORC instead of the
basic cycle to reduce irreversibility of a solar ORC were investigated in the last section.
Exergy efficiency enhancement and irreversibility reduction have been calculated for all
11 selected fluids when the collector efficiency increases from 70% to 100% at low and
medium temperature levels. Calculation results show that the theoretical limit for
irreversibility reduction through collector efficiency improvement for two selected
collector models, IND300 and LS-3, is 35%. It also shows this limit is 5% for the exergy
efficiency enhancement. For the 11 selected fluids a regenerative cycle with regeneration
efficiency εreg = 0.8 have been investigated at low and medium temperature levels. In
contrast to collector efficiency improvement effect on the exergy efficiency of the cycle,
regeneration’s effect on the ORC is fluid dependent. Calculation results show, at the two

71
temperature level studied, the regeneration will be more effective in ORCs employing
high molecular complexity working fluids except for Cyclohydrocarbons.

72
CHAPTER 4
EXERGOECONOMIC ANALYSIS OF SOLAR ORGANIC RANKINE CYCLE
FOR A BUILDING IN HOT AND HUMID CLIMATE
4.1 Introduction
In chapter 3 the optimal working fluids and cycle configuration have been
determined by employing governing equations of basic and regenerative thermodynamic
cycle with a consideration of exergetic measures. In this chapter, the optimization process
of the solar ORC is finalized by identifying the best collector type and its corresponding
temperature level, and exergoeconomic principles are applied on the optimal solar ORC.
In the first section of chapter 4, the best collector-temperature combination for the solar
ORC which maintains the electricity demand of a geothermal air-conditioned commercial
building located in Pensacola of Florida is determined with exergetic and economic
considerations. The 11 selected fluids in chapter 3 are employed in this analysis. The
solar collector loop, building, and geothermal air conditioning system are modeled using
TRNSYS. TRNSYS is a transient systems simulation FORTRAN program with a
modular structure for simulating energy systems. TRNSYS is also notably powerful for
steady problems. Available electricity bills of the building and the 3-week monitoring
data on the performance of the geothermal system are employed to validate the
simulation. The effect of the different solar radiations on the system requirements is also
investigated. By the end of this section, the optimal working fluids, cycle configuration,
solar collector type, and operation conditions of the solar ORC are determined.
Second section of chapter 4 discusses the exergoeconomic analysis of the optimal

73
solar ORC system. Among the methods have been used to evaluate the performance of a
thermal energy system, there are techniques that combine thermodynamic and economic
principles. Thermoeconomics is a general term that describes any combination of a
thermodynamic analysis with an economic one. Compared with energy, exergy is a more
consistent measure of economic value. Exergoeconomics rests on the philosophy that
exergy is the only rational basis for assigning monetary costs to the system interactions
with its surroundings and to the sources of thermodynamic inefficiencies within it. The
ratio Rex of the exergy loss to the capital cost is the key parameter of exergoeconomic
analysis of energy systems.
Geothermal systems and thermal power plants have been investigated through
Exergoeconomic analysis while there are no studies to date on exergoeconimc evaluation
of a solar ORC. For the first in this study, the exergoeconomic concept will be applied on
a solar ORC in order to investigate the relation between the exergy loss and capital cost
of the system.
4.2 TRNSYS Software
TRNSYS is a transient systems simulation FORTRAN program with a modular
structure for simulating energy systems. TRNSYS is also notably powerful for steady
problems. A TRNSYS project is typically setup by connecting components graphically in
an interface called Simulation Studio. TRNSYS components are often referred to as
Types.
One of the key factors in TRNSYS’ success over the last 35 years is its open,
modular structure. The source code of the kernel as well as the component models is

74
delivered to the end users. This simplifies extending existing models to make them fit the
user’s specific needs. The DLL-based architecture allows users and third-party
developers to easily add custom component models, using all common programming
languages (C, C++, PASCAL, FORTRAN, etc.). In addition, TRNSYS can be easily
connected to many other applications, for pre- or post-processing or through interactive
calls during the simulation (e.g. Microsoft Excel, Matlab, COMIS, etc.).
The main visual interface of TRNSYS is the Simulation Studio. From there, you
can create projects by drag-and-dropping components to the workspace, connecting them
together and setting the global simulation parameters. The Simulation Studio saves the
project information in a TRNSYS Project File. When a simulation is run; the Simulation
Studio also creates a TRNSYS input file. The TRNSYS input file is a text file that
contains all the information on the simulation but no graphical information.
The simulation Studio also includes an output manager from where the
programmer can control which variables are integrated, printed and/or plotted, and a
log/error manager that allows studying in detail what happened during a simulation.
Many additional tasks can be performed from the Simulation Studio such as to generate
projects using the "New Project Wizard", generate a skeleton for new components using
the Fortran Wizard, view output files, and view and edit the components proformas. A
proforma is the input/output/parameters description of a component.
4.3 Building and GSHP System Description
Pensacola is a city in the state of Florida which has the hot and humid climate.
Hot and humid climate has been selected for the study due to its high solar intensity and

75
long solar radiation time through the year. In addition in such a cooling dominant region,
the GSHP system has a better annual performance and electricity demand profile of the
building better follows the electricity generation profile by the solar ORC system.
The building is a one story commercial building with 395 m2 floor area located in
downtown Pensacola and is served by grid power. Its operation started on August 2010.
The building consists of 8 offices, 1 conference room, 1 break room, 1 lay out room, 1
computer server room, two bathrooms, and a front office desk.
Table 4.1 shows key properties of constituent layers of the building envelope’s
main components.
The building has been equipped with two 6 ton geothermal heat pump units that
condition the north zone and south zones of the building and a small 1 ton unit that
compensates the heat load of the computer server’s room. Each 6 ton unit is a
WaterFurnace™, Envision ND072 and the 1 ton unit is a WaterFurnace™, Versatec
V012. The GSHP system utilizes a closed loop vertical U-tube heat exchanger, which is
composed of 14 boreholes reaching a depth of 300 feet. All buried pipes are made of
Polyethylene. U-tube pipes are ¾” with 0.433 W/m.K thermal conductivity.
4.4 Building and GSHP System Modeling Details
The system consists of three main subsystems: the building, the GSHP system
and the ORC system. In this section the building and the GSHP modeling details will be
presented.
TRNSYS 17 has been employed for the modeling of the building and the GSHP
system. The TRNSYS model of the building and the geothermal system has been

76
depicted in Fig. 4.1. The main TRNSYS modules used are the following:
• Weather data (Type 109): serves the main purpose of reading weather data at
regular time intervals from a data file.
Table 4.1 Key properties of constituent layers of the building envelope’s main components
ComponentConstituent
layer(s) Key properties
U-value [W/m2K]
Exterior wall
Concrete
Thickness=15.2 cm
0.251
Density=2400 kg/m3
Gypsum board
Thickness=1.6 cm Density=900 kg/m3
Polystyrene
Thickness=13.0 cm Density=25 kg/m3
Face brick
Thickness=9.20 cm Density=1922 kg/m3
Roof
Plaster board
Thickness=1.0 cm
0.156
Density=950 kg/m3
Horizontal air gap
NA
Polystyrene
Thickness=12.7 cm Density=25 kg/m3
Roof Deck
Thickness=35 cm Density=530 kg/m3
Window Glass SHGC=0.397 1.26

77
Fig 4..1 Building and
GSHP system TTRNSYS modell

78
• Psychrometrics (Type 33): takes the dry bulb temperature and relative
humidity of moist air as input and calculates the other thermodynamic
properties of moist air.
• Sky temp (Type 69): determines an effective sky temperature, which is used
to calculate the long-wave radiation exchange between an arbitrary external
surface and the atmosphere.
• Building (Type 56): models the thermal behavior of a building having
multiple thermal zones.
• Thermostat_N/Thermostat_S (Type 108): is modeled to output five on/off
control functions that can be used to control a system having a two stage heat
source, an auxiliary heater, and a two-stage cooling system. For this study
only the first stages of heating and cooling have been applied to the model.
• GSHP_N/GSHP_S/GSHP_SER (Type 504): models a single-stage liquid
source heat pump.
• V Ground Loop (Type 557): models a vertical heat exchanger that interacts
thermally with the ground.
• Buried Pipe (Type 31): models the fluid flow in a horizontal buried pipe.
• Circulation pump (Type 3): models the performance of a variable speed pump.
In the created TRNSYS model, there is no continuous flow modulation.
Consequently, the outlet flow rate and the power used are at their maximum
value.
• Diverter (Type 647): models a diverting valve that splits a liquid inlet mass
flow into fractional outlet mass flows.

h
pr
T
th
cr
G
dr
th
• Va
str
• Li
wh
• W
tim
In add
ave been us
rinter compo
The equation
he Simulatio
Instea
reated by Tr
Google Sketc
raw heat tra
he building g
alve (Type
reams into a
ighting/Equi
hich has a be
Weekend Det
me step.
dition to the
sed in the T
onent is use
block recog
on Studio env
ad of enterin
rnsys3d for T
chUp that all
nsfer surface
geometry cre
Fig 4.2 Th
649): mode
single outle
ipment Pow
ehavior char
terminant (T
e above men
TRNSYS m
ed to print s
gnizes some
vironment.
ng the surfa
TRNSYS can
lows you to
es, draw win
eated in Goo
he building g
79
els a mixing
et mass flow
wer (Type 14
racterized by
Type21): retu
ntioned mod
model of the
elected syste
mathematic
aces manual
n be importe
create a bui
ndows, draw
ogle SketchU
geometry cre
g valve that
.
4): A time
y a repeated
urns differen
dules, some
e building a
em variable
cal functions
lly in TRNS
ed. Trnsys3d
ilding geome
w shading su
Up.
eated in Goo
t combines
dependent
pattern.
nt time valu
printers and
and geotherm
es at specifie
s and acts lik
SYS, three d
d for TRNSY
etry from sc
urfaces, etc. F
ogle SketchU
individual l
forcing fun
ues at the cu
d equation b
mal system.
ed time inter
ke a calculat
dimensional
YS is a plugi
cratch: add z
Figure 4.2 s
Up
liquid
nction
urrent
blocks
. The
rvals.
tor in
l data
in for
zones,
hows

80
4.5 Calibration Procedure
The performance of the GSHP system has been monitored for 20 days between
Feb 18th and March 9th 2011. Monitoring data and available electricity bills of the
building have been employed to calibrate the building and GSHP system simulation.
The TRNSYS model has been run for the monitoring period and 5 billing periods
for calibration purposes. Table 4.2 shows the assumptions that have been made in the
modeling. In this table the number of people and the type and number of equipment have
been assumed based on collected information from the owner of the building. The
building is a commercial building and the number of people as well as the equipment
used during the first month the business ran was less than the following months. Some
equipment such as the computer server work 24/7 but most of the equipment’s power
consumption coincides with the personal use of those present. Lighting power has been
extracted from the lighting plan of the building. Heating and cooling set point
temperatures have been derived from thermostats in the building. The occupants did not
change thermostats set points upon exiting the building.
The following monitoring equipment was installed in the building:
• FLXIM™, Fluxus F601 ultrasonic energy meter, that was installed on the
main ground loop to measure and log the water flow rate and supply and
return temperatures of the main loop.
• Shenitech® STUF-R1B ultrasonic energy meter, which was installed on one
of the 6 ton units that serves the north zone of the building to measure and log
the water flow rate and supply and return temperatures of the unit.

81
Table 4.2 Made assumptions in modeling building and GSHP. Schedule A: Weekdays From 8:00 AM to 5:00 PM, Schedule B: 24/7
Simulation period I: 1st billing period (7/30/2010-8/12/2010) Simulation period II: All other billing period, monitoring period, and annual period
ScheduleSimulation
Period I II
Number of People
A 4 8
lighting [W/m2] A 13 13
Equipment [W] A 920 920 Equipment [W] B 920 4600
Heating set
point [°F]
North Zone
B 72 72
South Zone
B 70 70
Cooling set
point [°F]
North Zone
B 75 75
South Zone
B 73 73
• Wattnode® single phase AC power meter with CR-200 series Campbell
Scientific data logger to measure and log the power consumption of the north
zone heat pump unit.
• Hobo® data logger to measure and log the temperature and relative humidity
of the inside and outside of the building.
Measured data by ultrasonic energy meters have been used to adjust the passing
flow through main ground loop and each heat pump unit.
Figure 4.3 shows the power consumption of the north zone heat pump unit based
on measured data and simulation results.

82
Fig 4.3 The electrical power consumption of the north zone heat pump unit based on measured data and simulation results
The electrical power consumption of the north zone heat pump based on
simulation results is 28.3 kWh while the measured power consumption is 22.8 kWh
which is 20 percent lower than simulation results. The discrepancy is the result of the
difference between real weather data and the TRNSYS weather data. TRNSYS weather
data has been calculated based on the statistical weather data of previous years in the
region.
Figures 4.4 and 4.5 illustrate the monthly average indoor and outdoor temperature
for each hour in every day in February and March in Pensacola. As can be seen the
difference between indoor measured temperature and simulation data is negligible for the
most part of the day, while the TRNSYS outdoor temperature is lower than the measured
data most of the time.
The temperature difference between the inside and outside of the building plays a
key role in heat transfer rate from/to building. Table 4.3 shows the temperature difference
between the inside and outside of the building for February and March in Pensacola
0
5
10
15
20
25
30
Measured data Simulation result
Pow
er c
onsu
mpt
ion
(kW
h)
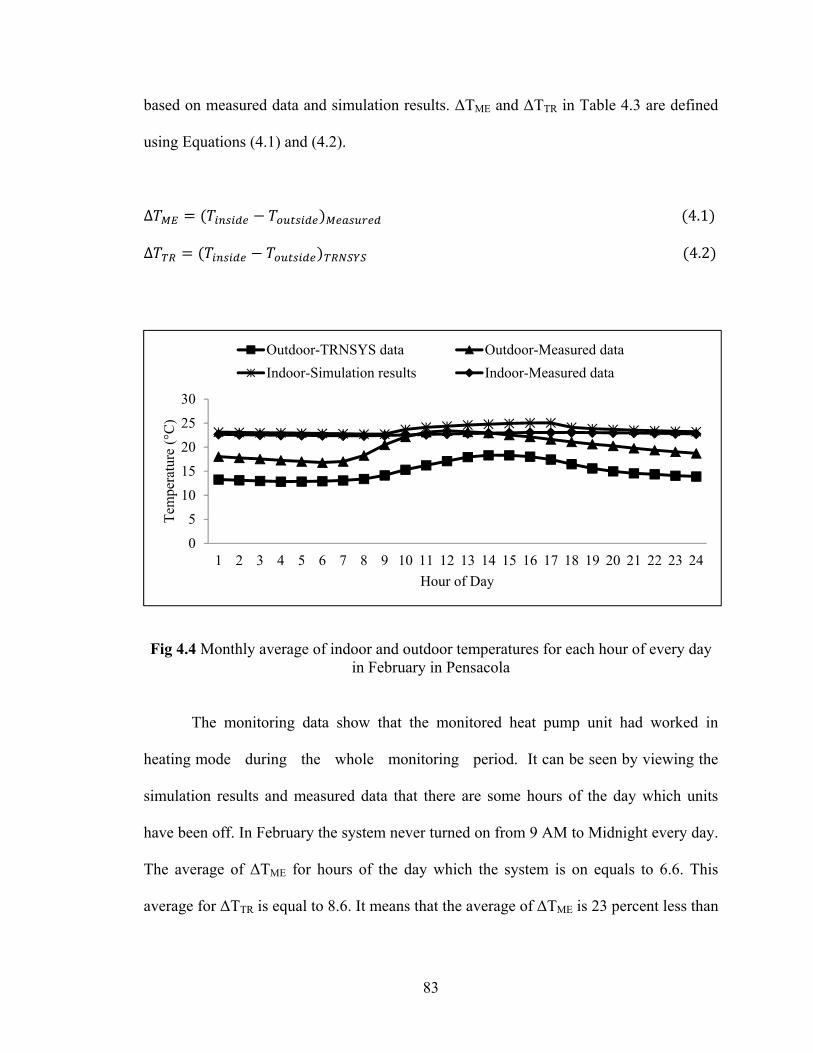
83
based on measured data and simulation results. ΔTME and ΔTTR in Table 4.3 are defined
using Equations (4.1) and (4.2).
∆ ( ) (4.1)∆ ( ) (4.2)
Fig 4.4 Monthly average of indoor and outdoor temperatures for each hour of every day in February in Pensacola
The monitoring data show that the monitored heat pump unit had worked in
heating mode during the whole monitoring period. It can be seen by viewing the
simulation results and measured data that there are some hours of the day which units
have been off. In February the system never turned on from 9 AM to Midnight every day.
The average of ΔTME for hours of the day which the system is on equals to 6.6. This
average for ΔTTR is equal to 8.6. It means that the average of ΔTME is 23 percent less than
0
5
10
15
20
25
30
1 2 3 4 5 6 7 8 9 10 11 12 13 14 15 16 17 18 19 20 21 22 23 24
Tem
pera
ture
(°C
)
Hour of Day
Outdoor-TRNSYS data Outdoor-Measured data
Indoor-Simulation results Indoor-Measured data

84
the average of ΔTTR which can justify the 20 percent power consumption difference of
simulation results and measured power consumption.
Fig 4.5 Monthly average of indoor and outdoor temperature for each hour of every day in March in Pensacola
In the next step the TRNSYS model was run for the 5 billing periods. Table 4.4
shows the power consumption of the building based on simulation results and available
billing information. As can be seen in Table 4.4 simulation results are in good conformity
with the actual power consumption extracted from electricity bills of the building.
4.6 ORC System Modeling Details
There are two steps in the ORC system analysis.
1. Modeling solar collector loop in order to calculate the annual heat gain of
each collector unit at the specified working temperature.
2. Calculating the required number of collector units based on:
• Calculated collector’s annual heat gain in step one
0
5
10
15
20
25
30
1 2 3 4 5 6 7 8 9 10 11 12 13 14 15 16 17 18 19 20 21 22 23 24
Tem
pera
ture
(°C
)
Hour of Day
Outdoor-TRNSYS data Outdoor-Measured data
Indoor-Simulation results Indoor-Measured data

85
• Thermal efficiency of ORC cycle for different working fluids (From
chapter 3).
• Annual power demand of the building resulting from building and GSHP
modeling.
Table 4.3 Temperature difference between the inside and outside of the building for February and March in Pensacola based on measured data and simulation results.
February March Hour
of the day
ΔTTR
[°C] ΔTME [°C]
ΔTTR
[°C] ΔTME
[°C]
1 9.9 5.1 10.0 7.4 2 9.9 5.3 10.0 7.6 3 10.0 5.4 10.1 8.0 4 10.1 5.7 10.2 8.3 5 10.0 5.9 10.0 8.2 6 9.9 6.1 10.1 8.0 7 9.7 5.8 10.0 7.1 8 9.3 4.4 8.9 5.8 9 8.6 2.2 7.4 5.5 10 8.4 1.5 6.8 6.0 11 7.9 1.0 6.2 6.4 12 7.3 0.9 5.6 6.6 13 6.7 1.4 5.2 6.7 14 6.5 1.8 5.2 6.9 15 6.6 2.4 5.6 7.2 16 7.0 2.9 6.0 7.7 17 7.6 3.4 6.7 8.1 18 7.7 3.0 6.9 7.4 19 8.3 3.2 8.0 7.2 20 8.7 3.4 8.9 7.2 21 9.0 3.7 9.5 7.2 22 9.0 4.0 9.9 7.3 23 9.2 4.3 10.2 7.6 24 9.3 4.5 10.5 7.7

86
Table 4.4 Power consumption of the building in Pensacola based on simulation results and available billing information
Billing Period
Simulation Results Billed Total
Power Consumption
[kWh]
100x 1- (Simulation power/
Billed power ) [%]
HVAC Power
Consumption [kWh]
Non-HVAC Power Consumption [ kWh] Total Power
Consumption [KWh] Equipment Lighting Total
7/30/2010 -
8/12/2010 987.80 307.74 493.46 801.20 1789.00 1688.00 5.98
8/13/2010 -
9/16/2010 2608.87 1467.42 1028.04 2495.46 5104.33 5072.00 0.64
9/17/2010 -
10/13/2010 1639.49 1173.00 822.43 1995.43 3634.92 3668.00 -0.90
10/14/2010 -
11/11/2010 1229.99 1291.70 904.68 2196.38 3426.36 3379.00 1.40
11/12/2010 -
12/13/2010 1123.66 1348.72 945.80 2294.52 3418.18 3610.00 -5.31

87
In chapter 3, 11 fluids have been suggested to be employed in solar ORCs for two
temperature levels of Teva which are 85°C and 130°C.
For solar collector loop modeling, low temperature and medium temperature solar
collectors should be selected first. Desired output temperature of the collector plays a key
role in selecting the proper collector. The heat-carrying fluid temperature in the collector
should be higher than the highest temperature in the ORC. As the working fluid in the
evaporator of the ORC is in the phase change status with constant temperature, the
temperature of the heat-carrying fluid in the collector should be high enough at the
beginning of the heat transfer process with ORC in order to retain its heat capacity up to
the end of the process. For this reason, the desired collector output temperature for low
and medium ORC have been considered 120°C and 165°C respectively.
Table 4.5 shows the specifications of selected solar collectors for low and
medium temperature ORCs. Being SRCC (Solar Rating and Certification Corporation)
certified, and having relatively high efficiency have been considered in selecting the
supplier and model of the collectors.
XCELTHERM® HT from Radco Industries has been selected as the heat-carrying
fluid in the collectors. XCELTHERM® HT has an appropriate heat capacity and
relatively low viscosity in comparison to similar commercial products.
The TRNSYS model of the solar collector loop has been depicted in Fig. 4.6. The
main TRNSYS modules used are as follows:
• Weather (Type 109): serves the main purpose of reading weather data at
regular time intervals from a data file.

88
• Collector (Type 1 for flat plate collector-Type 71 for evacuated tube
collector): models the thermal performance of a flat plate/evacuated tube
collector.
• Controller (Type 22): An iterative feedback controller that calculates the
control signal required to maintain the controlled variable at a specified set
point.
• Pump (Type 110): models a variable speed pump that is able to maintain any
outlet mass flow rate between zero and a rated value. The mass flow rate of
the pump varies linearly with control signal setting.
Table 4.5 Selected solar collector specifications
Supplier SunMaxx Solar Apricus
Inc.
Model TitanPowerPlus-
SU2 AP-20
Type Flat plate Evacuated
tube
ORC temperature level Low Low
- Medium
Gross area [m2] 1.99 2.96
Efficiency coefficients
a0 0.754 0.456
a1
[w/m2K] 3.43 1.3509
a2
[w/m2K2]0.0106 0.00381
Unit price at May 2011 [USD]
786.85 1048.00

so
su
co
co
se
so
n
4
n
O
Printe
olar collecto
urface is assu
Solar
ollector unit
ollector spec
et point are
olar collecto
eeded to ma
.7 The Opti
In the
eeded to ma
ORC working
Fig
er and some
or loop. In
umed 45°, fa
collector is
t at the spec
cifications s
inputs of th
or loop mode
aintain the po
imal Solar O
e first part of
aintain the p
g fluids at t
g 4.6 Solar c
equation bl
all solar co
facing the equ
s modeled in
cified worki
such as effic
he model. An
eling is used
ower demand
ORC Comp
f this section
power consu
two tempera
89
collector loop
locks have b
ollector loop
uator.
n order to d
ing temperat
ciency coeff
nnual heat g
d to calculat
d of the buil
onents and
n the require
umption of
ature levels.
p TRNSYS
been used in
p simulation
determine th
ture. In this
ficients, and
gain of the c
te the requir
lding through
Working C
ed collector
the building
In chapter 3
model
n the TRNS
ns the slope
he annual h
s modeling t
collector ou
collector as
red number
hout the yea
Condition
area and tot
g are compa
3 it has bee
YS model o
of the coll
heat gain of
the weather
utlet temper
the output o
of collector
ar.
tal collector
ared for diff
n shown tha
of the
lector
each
data,
rature
of the
units
price
ferent
at the

90
regenerative ORC has the better performance in comparison to the basic ORC. It is for
this reason that the regenerative ORC is considered in this chapter.
The collector heat-carrying fluid leaves the heat transfer process with the ORC at
a relatively high temperature. This heat capacity can be used for water heating purposes.
Water heating efficiency, ηWH, combined heat and power efficiency, ηCHP, the required
collector area and the collector expense for the whole system has been compared for
different ORC working fluids in Pensacola in Tables 4.6 to 4.8. Water heating efficiency,
and combined heat and power efficiency are defined by equations (4.3) and (4.4)
respectively.
(4.3) (4.4)
In the real case the circulation pump works continuously throughout the year
regardless of heat pump units’ working status. The total power consumption of the
system will be decreased if the running time of the circulation pump is synchronized with
the heat pump units’ running time by using a proper controller.
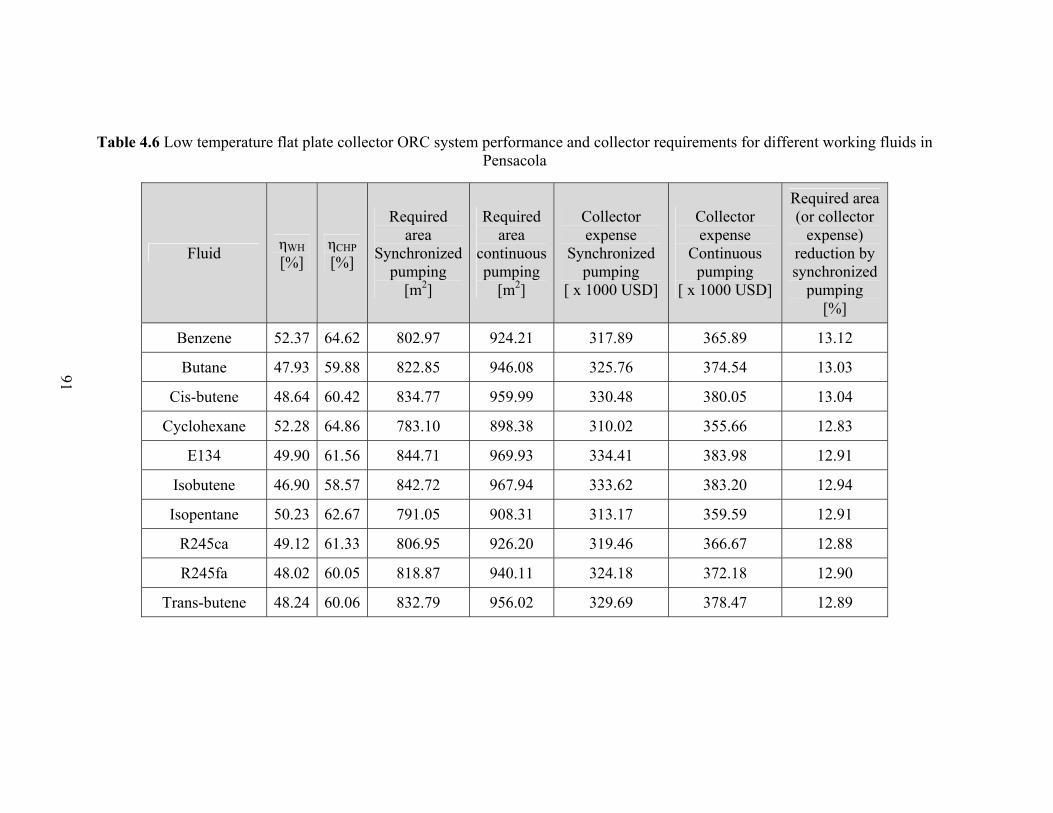
91
Table 4.6 Low temperature flat plate collector ORC system performance and collector requirements for different working fluids in Pensacola
Fluid ηWH
[%] ηCHP
[%]
Required area
Synchronized pumping
[m2]
Required area
continuous pumping
[m2]
Collector expense
Synchronized pumping
[ x 1000 USD]
Collector expense
Continuous pumping
[ x 1000 USD]
Required area (or collector
expense) reduction by synchronized
pumping [%]
Benzene 52.37 64.62 802.97 924.21 317.89 365.89 13.12
Butane 47.93 59.88 822.85 946.08 325.76 374.54 13.03
Cis-butene 48.64 60.42 834.77 959.99 330.48 380.05 13.04
Cyclohexane 52.28 64.86 783.10 898.38 310.02 355.66 12.83
E134 49.90 61.56 844.71 969.93 334.41 383.98 12.91
Isobutene 46.90 58.57 842.72 967.94 333.62 383.20 12.94
Isopentane 50.23 62.67 791.05 908.31 313.17 359.59 12.91
R245ca 49.12 61.33 806.95 926.20 319.46 366.67 12.88
R245fa 48.02 60.05 818.87 940.11 324.18 372.18 12.90
Trans-butene 48.24 60.06 832.79 956.02 329.69 378.47 12.89

92
Table 4.7 Low temperature evacuated tube collector ORC system performance and collector requirements for different working
fluids in Pensacola
Fluid ηWH
[%] ηCHP
[%]
Required area
Synchronized pumping
[m2]
Required area
continuous pumping
[m2]
Collector expense
Synchronized pumping
[ x 1000 USD]
Collector expense
Continuous pumping
[ x 1000 USD]
Required area (or collector
expense) reduction by synchronized
pumping [%]
Benzene 52.30 64.54 645.28 742.96 228.46 263.05 13.15
Butane 47.86 59.82 660.08 760.72 233.70 269.34 13.23
Cis-butene 48.57 60.35 671.92 769.60 237.90 272.48 12.69
Cyclohexane 52.21 64.79 627.52 722.24 222.18 255.71 13.11
E134 49.82 61.49 677.84 778.48 239.99 275.62 12.93
Isobutene 46.83 58.50 677.84 778.48 239.99 275.62 12.93
Isopentane 50.16 62.60 636.40 728.16 225.32 257.81 12.60
R245ca 49.05 61.26 648.24 742.96 229.51 263.05 12.75
R245fa 47.95 59.98 657.12 754.80 232.66 267.24 12.94
Trans-butene 48.17 59.99 668.96 766.64 236.85 271.43 12.74

93
Table 4.8 Medium temperature evacuated tube collector ORC system performance and collector requirements for different working fluids in Pensacola
Fluid ηWH
[%] ηCHP
[%]
Required area
Synchronized pumping
[m2]
Required area
continuous pumping
[m2]
Collector expense
Synchronized pumping
[ x 1000 USD]
Collector expense
Continuous pumping
[ x 1000 USD]
Required area (or collector
expense) reduction by synchronized
pumping [%]
Acetone 54.00 71.41 837.68 962.00 296.58 340.60 12.92
Benzene 55.96 74.49 787.36 902.80 278.77 319.64 12.79
Butane 41.46 58.28 867.28 994.56 307.06 352.13 12.80
Cis-butene 45.69 62.29 879.12 1009.36 311.26 357.37 12.90
Cyclohexane 55.54 74.74 760.72 873.20 269.34 309.16 12.88
Isopentane 50.65 69.19 787.36 902.80 278.77 319.64 12.79
R245ca 47.68 65.48 819.92 941.28 290.30 333.26 12.89
R245fa 42.62 59.70 852.48 979.76 301.82 346.89 12.99
Trans-butene 43.32 59.83 882.08 1012.32 312.30 358.42 12.87

94
The presented results in Tables 4.6 to 4.8 show that the best collector-temperature
combination for supplying the building power is the low temperature evacuated tube solar
collector. In the real case, the minimum required collector area among all possible
options is 722.54 m2 which belongs to the low temperature ORC using the evacuated tube
solar collector and Cyclohexane as its working fluid. This amount can be reduced to
627.52 m2 by synchronizing circulation pump running time with the heat pump units’
running time. It can be seen however that the power consumption rate of the circulation
pump is low in comparison to units’ power consumption; non-stop working of the pump
can increase the required collector area and the corresponding expense up to 13 percent.
After Cyclohexane, Isopentane with a 728.16 m2 required collector area, and Benzene
and R245ca each with a 742.96 m2 required collector area to maintain the power demand
of the building are the best working fluids to be employed in the ORC system.
Isopentane is a more optimal choice for working fluid in comparison to
Cyclohexane, Benzene, and R245ca. Cyclohexane is a smog generating pollutant. Smog,
which is ground-level Ozone, is formed when volatile organic compounds and oxides of
nitrogen interact in the presence of sunlight. Exposure to elevated smog levels can cause
serious respiratory problems, such as aggravate asthma and lead to increased respiratory
infection rates. Benzene is also not a suitable choice due to its carcinogenic properties,
while R245ca has a relatively high global warming potential, which makes it more
undesirable as a working fluid.
While the thermal efficiency of the ORC for none of the fluids in this study can
exceed 19.2 % at low or medium temperature levels, relatively high combined heat and
power efficiencies up to 74% are achievable which makes the use of the ORC technology

95
more reasonable.
4.8 Solar Radiation Intensity Effect on the Solar ORC Performance
In this section the effect of solar radiation intensity on the performance of the
suggested technology is investigated. Pensacola, Miami and Houston have been selected
as the representatives of hot and humid climate.
The required collector area for running the solar ORC which employs low
temperature evacuated tube collector and Isopentane as the working fluid for the above
mentioned cities have been depicted in Figure 4.7. As can be seen in Figure 4.7 the
variation of required collector area versus working fluid has the same trend in all three
cities. For all working fluids, the required collector area for Pensacola is less than that of
Miami but more than that of Houston.
Fig 4.7 Required collector area for running the solar ORC which employs low temperature evacuated tube collector and Isopentane as the working fluid for Pensacola,
Miami and Houston
650
700
750
800
850
900
Req
uirr
ed c
olle
ctor
are
a (m
2 )
Pensacola Miami Houston

96
To find the reason for this trend, the monthly power generation of the
aforementioned ORC system per collector unit and monthly average of solar radiation
incident upon the collector surface for Miami, Pensacola and Houston have been
presented in Figures 4.8 and 4.9.
Figures 4.8 and 4.9 show that the monthly variation of the power generation of the
ORC per collector unit and the average solar radiation incident upon the surface follow
the same pattern. This conformity is not just due to the order but the amount as well. For
example, in months like January, February and December where the differences between
the average solar radiations in the cities are significant, the differences between power
generations of the system per collector unit in different cities are significant too. In
months like August, September and October where the differences between average solar
radiations in the cities are negligible, the power generations of the ORC per collector unit
in three cities are very close to each other.
The power demand of the building is different in different cities due to their
different weather conditions. Hence the annual power demand of the building should be
considered in order to justify the differences between required collector areas needed to
run the suggested ORC system in the cities presented in Fig. 4.7. Table 4.9 shows the
annual power demand of the building and annual power generation per collector unit of
the aforementioned ORC system in Pensacola, Miami and Houston.
Houston has the minimum power generation per collector unit using the suggested
ORC while the power demand of the building in that city is higher than the demand in
Pensacola. Hence in Houston, the maximum collector area needed to run the suggested
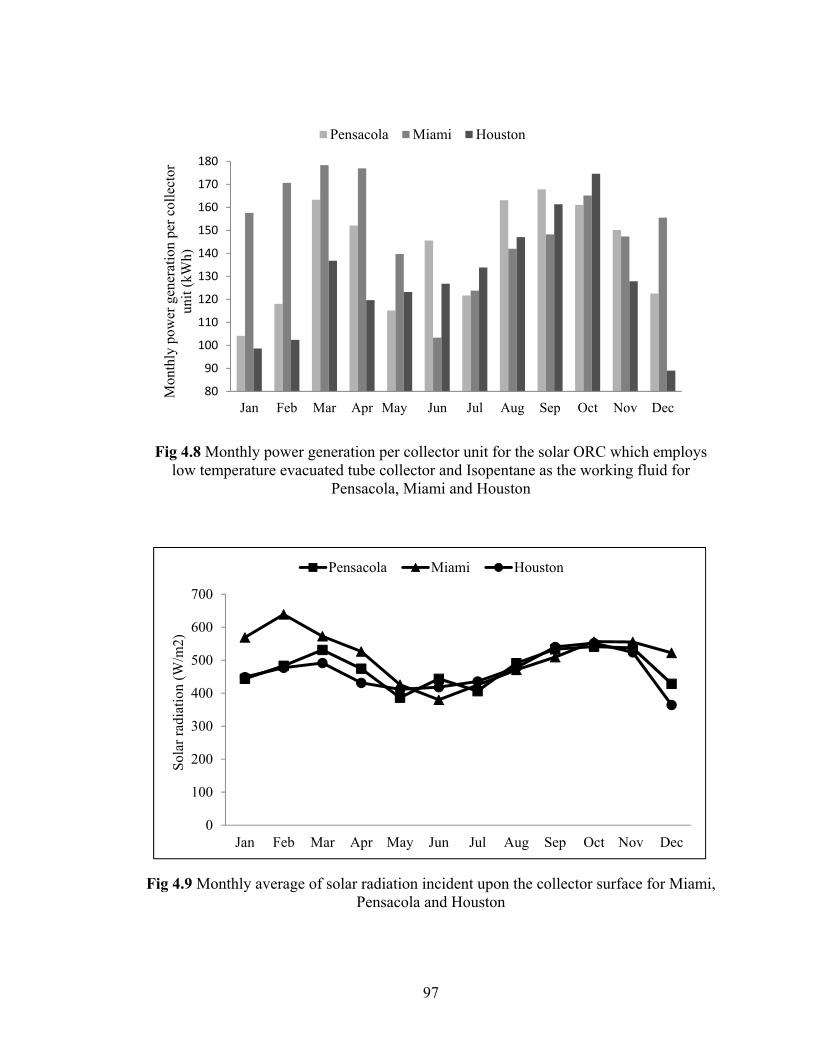
97
Fig 4.8 Monthly power generation per collector unit for the solar ORC which employs low temperature evacuated tube collector and Isopentane as the working fluid for
Pensacola, Miami and Houston
Fig 4.9 Monthly average of solar radiation incident upon the collector surface for Miami, Pensacola and Houston
80
90
100
110
120
130
140
150
160
170
180
Jan Feb Mar Apr May Jun Jul Aug Sep Oct Nov Dec
Mon
thly
pow
er g
ener
atio
n pe
r co
llec
tor
unit
(kW
h)
Pensacola Miami Houston
0
100
200
300
400
500
600
700
Jan Feb Mar Apr May Jun Jul Aug Sep Oct Nov Dec
Sol
ar r
adia
tion
(W
/m2)
Pensacola Miami Houston

98
ORC system. In Miami the suggested ORC system can generate 7.4 percent more power
per collector unit in comparison to the system in Pensacola while the power demand of
the building in Miami is 14.5 percent more that the demand in Pensacola. Therefore the
required collector area to run the system in Miami is higher than that in Pensacola.
Table 4.9 Annual power demand of the building and the annual power generation per
collector unit for the solar ORC which employs evacuated tube collector and Isopentane as the working fluid for Pensacola,Miami and Houston
Pensacola Miami Houston
Annual power demand [kWh]
46408.0 53132.6 47784.1
Annual power generation per collector unit
[kWh]
1684.6 1808.6 1541.1
4.9 Economic Comparison between the Solar ORC and PV Panel System
Because of the low efficiency and high capital costs of PV panels and also the
high energy consumption and CO2 production rate of the manufacturing process of PV
panels, this technology has not been widely commercialized for residential and
commercial building application.
An economic comparison between the studied solar ORC system and a PV panel
system that maintains the electricity demand of the building is presented in this section.
PVWatts™ 2 is used to determine the required PV panel area and number of inverters to
maintain the power demand of the building. PVWatts™ Grid Data calculator is an

99
internet-accessible simulation tool for providing quick estimates of the electrical energy
produced by grid-connected crystalline silicon PV system for a location in United States
from an interactive map. This tool has been provided by National Renewable Energy
Library and it is available to public.
The Grid Data calculator employs a PV performance model and hourly typical
meteorological year (TMY2) weather data to estimate annual energy production for a
crystalline silicon PV system. It allows users to create estimated performance data of the
PV system for any location in the United States or its territories by selecting a site on a
40-km gridded map. PVWatts™ 2 considers data from a climatologically similar typical
meteorological year data station and site-specific solar resource and maximum
temperature information to provide PV performance estimation. In version 2,
performance is first calculated for the nearest TMY2 location and then translated to the
desired 40-km grid cell location. Grid cell monthly values of solar radiation and
meteorological parameters are used in the translation process.
The input factors of the PV system that should be determined by the user are as
follows:
• Nameplate DC power rating
• DC-to-AC derate factor
• Array type (fixed, sun-tracking with one or two axes of rotation)
• Tilt angle
• Azimuth angle
• Electricity cost
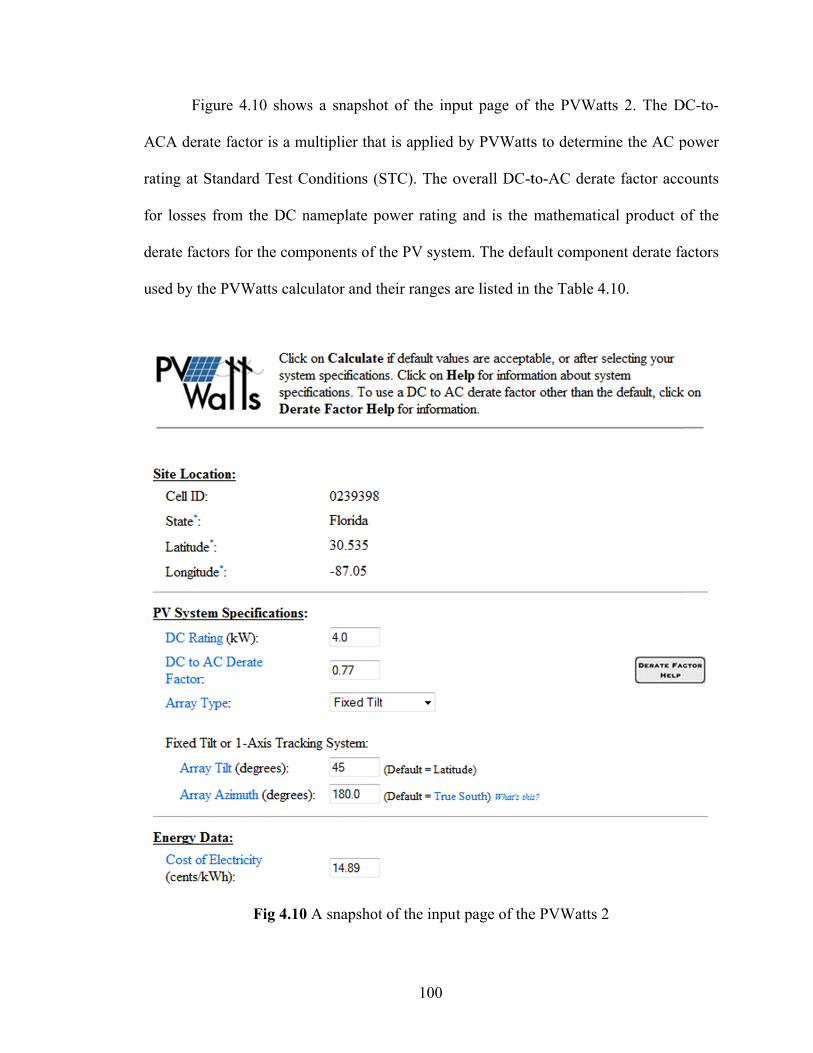
A
ra
fo
d
u
Figure
ACA derate f
ating at Stan
or losses fro
erate factors
sed by the P
e 4.10 show
factor is a m
ndard Test C
om the DC n
s for the com
PVWatts calc
Fig 4.10
ws a snapsho
multiplier tha
Conditions (S
nameplate p
mponents of t
culator and th
0 A snapshot
100
ot of the inp
at is applied
STC). The o
power rating
the PV syste
heir ranges a
t of the input
put page of
by PVWatts
overall DC-t
g and is the
em. The defa
are listed in
t page of the
the PVWatt
s to determin
to-AC derat
mathematic
ault compon
the Table 4.
e PVWatts 2
ts 2. The D
ne the AC p
e factor acc
al product o
nent derate fa
.10.
2
DC-to-
power
ounts
of the
actors

101
Table 4.10 Derate factors for AC power rating at Standard Testing Condition
Component derate factors
PVWatts default Range
PV module nameplate DC
rating 0.95 0.80–1.05
Inverter and transformer
0.92 0.88–0.98
Mismatch 0.98 0.97–0.995
Diodes and connections
1.00 0.99–0.997
DC wiring 0.98 0.97–0.99 AC wiring 0.99 0.98–0.993
Soiling 0.95 0.30–0.995
System availability
0.98 0.00–0.995
Shading 1.00 0.00–1.00 Sun-tracking 1.00 0.95–1.00
Age 1.00 0.70–1.00
Overall DC-to-AC derate
factor 0.77 0.099–0.960
The component derate factors are described below.
• PV module nameplate DC rating derate factor accounts for the accuracy of the
manufacturer's nameplate rating.
• Inverter and transformer derate factor reflects the inverter's and transformer's
combined efficiency in converting DC power to AC power.
• The derate factor for PV module mismatch accounts for manufacturing tolerances
that yield PV modules with slightly different current-voltage characteristics.
Consequently, when connected together electrically, they do not operate at their

102
peak efficiencies.
• Diodes and connections derate factor accounts for losses from voltage drops
across diodes used to block the reverse flow of current and from resistive losses in
electrical connections.
• DC wiring derate factor for DC wiring accounts for resistive losses in the wiring
between modules and the wiring connecting the PV array to the inverter.
• AC wiring derate factor for AC wiring accounts for resistive losses in the wiring
between the inverter and the connection to the local utility service.
• The derate factor for soiling accounts for dirt, snow, and other foreign matter on
the surface of the PV module that prevent solar radiation from reaching the solar
cells.
• The derate factor for system availability accounts for times when the system is off
because of maintenance or inverter or utility outages.
• The derate factor for shading accounts for situations in which PV modules are
shaded by nearby buildings, objects, or other PV modules and arrays.
• The derate factor for sun-tracking accounts for losses for one- and two-axis
tracking systems when the tracking mechanisms do not keep the PV arrays at the
optimum orientation.
• The derate factor for age accounts for performance losses over time because of
weathering of the PV modules.
Annual electricity production of each PV panel which is the output of the
PVwatt™ 2 and the available annual power demand of the building are used to calculate
the required number of PV panels and inverters to maintain the annual power demand.

103
Table 4.11 shows the specifications of selected PV panel and inverter.
Table 4.11 Selected PV panel and inverter specifications
Supplier Kyocera Solar Fronius USA
Model KD135GX-LPU IG PLUS 5.0-1
Type Multicrystal
Sicilon module Utility
interactive
Maximum power at STC [w]
135 NA
Maximum power voltage at STC [V]
17.7 NA
Maximum power current at STC [A]
7.63 NA
Recommended PV power [w]
NA 4250-5750
Maximum input voltage [v]
NA 600
Nominal input current [A]
NA 13.8
Nominal output power [w]
NA 5000
Gross area [m2] 1.00 NA
Unit price at May 2011 [USD]
365 3320
Table 4.12 shows the required area and total cost for the suggested solar ORC
system (employing low-temperature evacuated tube and Isopentane as working fluid) and
PV panel system to maintain the power demand of the building in Pensacola. It can be
seen for the suggested ORC system the required collector area to maintain the power
demand of the building is more than 60 percent less than required PV panel area to
maintain the same amount of power. The total cost to establish the suggested solar ORC
system is more than 50 percent less than total cost of running a PV panel system to

104
maintain the power demand of the building in Pensacola.
Table 4.12 Required area and total cost for the suggested solar ORC system (employing low-temperature evacuated tube and Isopentane as working fluid) and PV panel system to
maintain the power demand of the building
System Required
area [m2]
Collector/ PV expense
[ x 1000 USD]
ORC package/Inverter expense
[ x 1000 USD]
Total cost [ x 1000 USD]
Solar ORC 728.16 257.81 75 332.81
PV 1839.00 671.24 33.2 704.44
4.10 Exergoeconomic Analysis of the Optimal Solar ORC System
The main objective of this section is to examine the relation between the exergy
loss and the capital cost of the optimal solar ORC system using the exergoconomic key
parameter Rex. Rex is defined by the Eq. (4.5).
(4.5)
where is the annual exergy loss in [kWh] and Kg is the capital cost in [USD].
is calculated using Eq. (4.6).
(4.6)

105
where Lex is exergy loss of the cycle in [W], is the annual power demand of the
building in [kWh] and Wnet is the net power output of the cycle in [W].
is one of the outputs of the building and the GSHP system modeling. Lex and
Wnet are calculated by Equations (3.2) and (3.1) in chapter 3.
The main reason that the capital cost is the only considered economic item in this
study is that the use of other economic details like maintenance cost, interest rate and
equipment lifetimes increases significantly the complexity of the analysis. There are two
main justifications for this simplification:
• Capital costs are often the most significant part of the total cost of the system.
Hence, the consideration of only capital cost closely approximates the results
when the total cost of the system is considered.
• The total cost components other than capital costs often are proportional to
capital costs. Therefore, the identified trends in the present study will likely be
in good conformity with those identified when the entire cost term is
considered.
Ozgener et al. (2007) believe that for any technology there is an appropriate value
for Rex where the design of the device is more successful if the Rex for that device
approaches that appropriate value. Rosen et al. (2003a) speculate that mature
technologies have achieved a balance of exergy loss and capital cost over the time that is
appropriate to the circumstances.
Table 4.13 shows the exergy loss, capital cost, payback period and Rex of the

106
ORC system which employs low temperature evacuated tube collector for different
working fluids in Pensacola. Minor costs such as controllers’ costs, in-line pumps’ costs
and piping costs have been neglected in comparison to collector and ORC system costs.
The selected ORC system in this study is a 50 kW EletraTherm™ ORC package.
Table 4.13 The exergy loss, capital cost, payback period and Rex of the ORC system which employs low temperature evacuated tube collector for different working fluids in
Pensacola
Kg Capital cost [ USD]
Fluid
Annual
exergy loss [kWh]
Collector expense
ORC system expense
Total capital
cost
Payback period [Year]
Rex [kWh/USD]
Benzene 443931.36 263048 75000 338048 48.92 1.313 Butane 455888.98 269336 75000 344336 49.83 1.324
Cis-butene 463228.06 272480 75000 347480 50.29 1.333 Cyclohexane 430868.52 255712 75000 330712 47.86 1.303
E134 468400.30 275624 75000 350624 50.74 1.336 Isobutene 468175.76 275624 75000 350624 50.74 1.335 Isopentane 435843.64 257808 75000 332808 48.16 1.310
R245ca 445392.91 263048 75000 338048 48.92 1.318 R245fa 452813.18 267240 75000 342240 49.53 1.323
Trans-butene 461579.86 271432 75000 346432 50.13 1.332
It can be seen that the payback period variation for different fluids follows the
same pattern as Rex variation. Fluids with lower payback period have a lower Rex. This
means that Rex is an appropriate parameter for thermodynamic and economic evaluation
of a solar ORC.
This analysis is done at different ambient temperatures T0 from 5 to 27 °C, for
Cyclohexane, Isobutane, R245ca and Benzene. The results have been depicted in Fig.

107
4.11. Equations (4.7) to (4.9) present linear correlations for the Rex of the system for each
working fluid that has been depicted in Figure 4.11.
Cyclohexane: ( ) 0.0031 1.233 (4.7) Isopentane: ( ) 0.0031 1.2257 (4.8) R245ca: ( ) 0.0031 1.2194 (4.9)
where T0 is the ambient temperature in [°C].
Fig 4.11 Rex variation versus ambient temperature for an ORC system which employs low temperature evacuated tube collector in Pensacola
Equations (4.7) to (4.9) confirm the exergoeconomic notion that states exergy is
the commodity of value in the system. This means that there is a systematic correlation
between the annual exergy loss and capital cost for the investigated solar ORC system.
Rex = 0.0031T0+ 1.2194R² = 1
Rex = 0.0031T0+ 1.2257R² = 1
Rex = 0.0031T0 + 1.233R² = 1
1.230
1.240
1.250
1.260
1.270
1.280
1.290
1.300
1.310
1.320
1.330
0 5 10 15 20 25 30
Rex
(kW
h/U
SD
)
T0 (°C)
Cyclohexane Isopentane R245ca

108
4.11 Conclusions
Exergoeconomic analysis of the optimal solar ORC system that maintains the
electricity demand of a geothermal air conditioned commercial building has been
accomplished in this chapter. The system requirements needed to run the solar ORC
system has been considered as the criteria to select the optimal components and optimal
working condition of the system such as collector type, working fluid and high
temperature level of the ORC system.
TRNSYS 17 has been employed for the modeling of the building, GSHP system
and solar collector loop. The building and GSHP modeling has been calibrated by
measured data from a 20 day monitoring period and also available billing information.
The system requirements needed to maintain the electricity demand of the
building with an ORC system has been compared for the 11 suggested fluids in chapter 3
for two temperature levels of 85°C and 130°C. The simulation results show that the best
collector-temperature combination for supplying the building power is the low
temperature evacuated tube solar collector. Cyclohexane and Ispentane with respectively
722.54 m2 and 728.16 m2 and Benzene and R245ca each with a 742.96 m2 required
collector area are the best working fluids to be employed in the ORC system to maintain
the power demand of the building in Pensacola. Isopentane is a more optimal choice for
working fluid in comparison to Cyclohexane, Benzene, and R245ca when considering
environmental and health issues.
The effect of solar radiation intensity on the performance of the suggested
technology was investigated. Pensacola, Miami and Houston were selected as the
representatives of hot and humid climate cities. The results show that the monthly
109
variation of the power generation of the ORC per collector unit and the average solar
radiation incident upon the surface follow the same pattern. This means that the solar
radiation incident upon the collector surface is a determining factor of the required
collector area to maintain a specific amount of electricity. The effect of weather condition
on the building load and consequently on the power demand of the building should not be
neglected.
An economic comparison between the solar ORC and PV panel system shows the
suggested ORC system (employing low-temperature evacuated tube and Isopentane as
working fluid) needs 60 percent less area and 50 percent less money than PV panel
system to maintain the power demand of the commercial building in Pensacola.
Exergoeconomic analysis of the optimal ORC system shows that the ratio Rex of
the annual exergy loss to the capital cost can be considered as a key parameter in order to
optimize a solar ORC system from the thermodynamic (exergy-based) and economic
point of view. It also shows that there is a systematic correlation between the exergy loss
and capital cost for the investigated solar ORC system.

110
CHAPTER 5
CONCLUSIONS AND FUTURE WORK
This research has been developed the applied guidelines for using a solar organic
Rankine cycle for space air conditioning. By considering how the solar collector type,
solar collector size, working fluid selection, temperature and pressure of each section of
the cycle influence the exergy loss, as well as their effects on the capital costs of the solar
ORC system, for a building with a specific power demand, a unique combination of all
these parameters - the optimized condition – has been determined.
A procedure to compare working fluid capabilities when they are employed in the
solar Rankine cycles with similar working conditions has been developed.
The exergoeconomic concept has been applied on the optimal solar ORC in order
to investigate the relation between the exergy loss and capital cost of the system for the
first time in this study. A systematic correlation between the annual exergy loss and
capital cost for the optimal solar ORC system has been derived.
5.1 Conclusions
A comprehensive list of working fluids has been analyzed to find the most
suitable fluids to operate a solar ORC. A procedure to compare working fluid capabilities
when they are employed in the solar Rankine cycles with similar working conditions has
been proposed. This procedure has been summarized and illustrated in Fig. (5.1).
The maximum practical thermal efficiency and corresponding cycle performance
factors confirm that fluids with a higher critical temperature have better performance in

111
the ORC. Calculation shows that a thermal efficiency higher than 25% and an exergy
efficiency higher than 20% are achievable in ORCs.
Fig. 5.1 Proposed selection procedure of the working fluid in a solar ORC
Discarding chlorine included fluids
Discarding highly wet fluids
Calculating thermal efficiency, exergy efficiency, net power generated, and vapor
expansion ratio
Setting higher temperature level of the cycle based on the collector type
Categorizing working fluids into: - Refrigerants - High performance non-refrigerants - Medium performance non-refrigerants
Choosing working fluids in the following order:
- Highest thermal/exergy efficiency - Highest net power generated - Lowest vapor expansion ratio
112
In the investigation, two temperature levels for Teva have been considered which
are 85 °C and 130 °C as representatives of low temperature and medium temperature
solar collectors.
Fluids have been divided into two groups: refrigerants and non-refrigerants.
Fluids with the best performance in the ORC have been recognized in each group. In the
non-refrigerant’s group, two different subdivisions have been considered: high
performance fluids and medium performance fluids. The reason for this subdivision is
that most non-refrigerants are in the medium performance group. Then by considering all
non-refrigerants as one group, a large group of fluids would be omitted from analysis.
At medium temperature level the final selected refrigerants through the introduced
procedure are R245fa and R245ca. The final selected non-refrigerants at Teva=130 °C are
Acetone and Benzene with high performance and Butane, Isopentane, Transbutan, and
Cis-butene with medium performance.
At the low temperature level only a few numbers of fluids have been changed in
comparison to fluids selected at the medium temperature level. At Teva=85 °C, E134 has
been added to the selected refrigerants at Teva=130 °C. In the non-refrigerants group,
Acetone has been replaced by Cyclohexane and Isobutene has been added to the fluids
with the medium performance capability.
Exergy efficiency enhancement and irreversibility reduction have been calculated
for all 11 selected fluids when the collector efficiency increases from 70% to 100% at
low and medium temperature levels. Calculation results show that the theoretical limit for
irreversibility reduction through collector efficiency improvement for two selected
collector models, IND300 and LS-3, is 35%. It also shows this limit is 5% for the exergy

113
efficiency enhancement.
Different configurations of ORCs have different effects on the overall thermal
efficiency of the cycle, the cycle total irreversibility, cycle second law efficiency, and the
mass flow rate needed to generate a certain power output. Regenerative ORC is the most
significant alternative configuration for basic ORC. The finite temperature difference
during the heat transfer process is the main reason for irreversibility. The regenerative
cycle reduces the irreversibility by using heat input from other parts of the system. In this
study it has been investigated by what percentage the regenerative cycle outperforms the
basic cycle with respect to the working fluid of the cycle. Calculation results show, at the
two temperature levels studied, the regeneration will be more effective in ORCs
employing high molecular complexity working fluids except for Cyclohydrocarbons.
The optimization process has been finalized by identifying the best collector type
and its corresponding temperature level, and exergoeconomic principles were applied on
the optimal solar ORC. The best collector-temperature combination for the solar ORC
which maintains the electricity demand of a geothermal air-conditioned commercial
building located in Pensacola of Florida is determined with exergetic and economic
considerations.
The system requirements needed to maintain the electricity demand of the
building with an ORC system has been compared for the 11 suggested fluids in the
previous section for two temperature levels of 85°C and 130°C. The simulation results
show that the best collector-temperature combination for supplying the building power is
the low temperature evacuated tube solar collector. Cyclohexane and Ispentane with
respectively 722.54 m2 and 728.16 m2 and Benzene and R245ca each with a 742.96 m2

114
required collector area are the best working fluids to be employed in the ORC system to
maintain the power demand of the building in Pensacola. Isopentane is a more optimal
choice for working fluid in comparison to Cyclohexane, Benzene, and R245ca when
considering environmental and health issues.
The investigation of solar radiation intensity effect on the performance of the
suggested technology shows that the monthly variation of the power generation of the
ORC per collector unit and the average solar radiation incident upon the surface follow
the same pattern. This means the solar radiation incident upon the collector surface is a
determining factor of the required collector area needed to maintain a specific amount of
electricity. The effect of weather condition on the building load and consequently on the
power demand of the building should not be neglected.
An economic comparison between the solar ORC and PV panel system shows the
suggested ORC system (employing low-temperature evacuated tube and Isopentane as
working fluid) needs 60 percent less area and 50 percent less money than PV panel
system to maintain the power demand of the commercial building in Pensacola.
Exergoeconomic analysis of the optimal ORC system shows that the ratio Rex of
the annual exergy loss to the capital cost can be considered a key parameter in order to
optimize a solar ORC system from the thermodynamic (exergy-based) and economic
point of view. It also shows that there is a systematic correlation between the annual
exergy loss and capital cost for the investigated solar ORC system.

115
5.1 Future work
Possible future works include:
• Evaluation of different options to reach to net zero energy building such
as:
- Installing appropriate equipment to return the surplus electricity to the grid
- Choosing an appropriate Thermal Energy Storage (TES) system
- Using PV panels as a supplement to the power generation system and
finding the best combination of ORC and PV panel system for this option
• All calculations of this study have been done in steady state mode and in
an annual base. Performing a time dependent analysis will give a better
understanding of the energy, exergy and cost flow in the system.
• A comprehensive comparison between the solar ORC and PV panel
system which includes consumed energy and materials in manufacturing process
of both technologies.
• Using Compound Parabolic Concentrating (CPC) collectors can be a
solution to reduce the required collector area while there are no studies to date on
using CPC collectors to generate power for a residential or commercial building.
CPC collector products have not been commercialized for public use as of yet.
For this reason the high price of CPC collectors is the main barrier of use in
residential or commercial building application.

116
LIST OF REFERENCES
Angelino, G., and Di Paliano, P. C., 2000, “Organic Rankine cycles (ORCs) for energy recovery from molten carbonated fuel cell,” Proceedings of the Intersociety Energy Conversion Engineering Conference, 2, pp. 1400-1409.
Angelino, G., Gaia, M., and Macci, E., 1984, “A review of Italian activity in the field of organic Rankine cycles,” VDI Berichte, pp. 465-482.
Bejan, A., Entropy generation through heat and fluid flow, John Wiley and Sons Inc., 1982.
Bruno, J.C., Lopez-Villada, J., Letelier, E., Romera, S., and Coronas, A., 2008, “Modeling and optimization of solar organic Rankine cycle engines for reverse osmosis desalination”, Applied Thermal Engineering, 28:2212-2226.
Cengel, Y.A., and Boles, M.A., Thermodynamics: An Engineering Approach, fifth ed., McGraw-Hill, 2006.
Delgado-Torres, A. M., and Garcia-Rodriguez, L., 2007a, “Preliminary assessment of solar organic Rankine cycles for driving a desalination system,” Desalination, 216, pp. 252-275.
Delgado-Torres, A. M, and Garcia-Rodriguez, L., 2007b, “Double cascade organic Rankine cycle for solar driven reverse osmosis desalination,” Desalination, 216, pp. 306-313.
Drescher, U. and Bruggemann, D., 2007, “Fluid selection for the Organic Rankine Cycle (ORC) in biomass power and heat plants”, Applied Thermal Engineering, 27:223-228.
Eck, M., and Steinmann, W.D., 2002, Direct steam generation in parabolic troughs: First results of the DISS project, ASME Journal of Solar Energy Engineering, 124, pp. 134-139.
Feng, M., 2008, “An exergy based engineering and economic analysis of sustainable building”, PhD Thesis, Florida International University, Miami, Florida.
Hermann, W. A., 2006, “Quantifying global exergy resources”, Energy, 31(12):1349-1366.
Hettiarachchi, H. D. M., Golubovic, M., Worek W. M., and Ikegami, Y., 2007, “Optimum design criteria for an Organic Rankine cycle using low-temperature geothermal heat sources,” Energy, 32, pp. 1698-1706.
Hung, T. C., 1995, “Waste heat recovery of organic Rankine cycle using dry fluids,” Energy Conversion and Management, 42(5), pp. 539-553.

117
Invernizzi, C., Iora, P., and Silva, P., 2007, “Bottoming micro-Rankine cycles for micro-gas turbines”, Applied Thermal Engineering, 27:100-110.
Karellas, S., and Schuster, A., 2008, “Supercritical fluid parameters in organic Rankine cycle applications,” International Journal of Thermodynamics, 11(3), pp. 101-108.
Larjola, J., 1995, “Electricity from industrial waste heat using high-speed organic Rankine cycle (ORC),” International Journal of Production Economics, 41(1-3), pp. 227-235.
Lemmon, E.W., Huber, M.L., and McLinden, M.O., 2007, NIST Standard Reference Database 23: Reference Fluid Thermodynamic and Transport Properties-REFPROP, Version 8.0, National Institute of Standards and Technology, Standard Reference Data Program, Gaithersburg.
Liu, B. T., Chien, K. H., and Wang, C. C., 2004, “Effect of working fluids on organic Rankine cycle for waste heat recovery,” Energy, 29, pp. 1207-1217.
Mago, P. J., Chamra, L. M., Srinivasan, K., and Somayaji, C., 2008, “An examination of regenerative organic Rankine cycles using dry fluids,” Applied Thermal Engineering, 28, pp. 998-1007.
Maizza, V., and Maizza, A., 1996, “Working fluids in non-steady flows for waste energy recovery systems,” Applied Thermal Engineering, 16(7), pp. 579-590.
Marion, B., Anderberg, M., George, R., Gary-Hann, P., and Heimiller D., “PVWATTS Version 2- Enhanced Spatial Resolution for Calculating Grid-Connected PV Performance,” National Renewable Energy Laboratory (NREL) publications.
Mills, D., 2004, “Advances in solar thermal electricity technology”, Solar Energy, 76:19-31.
National Renewable Energy Laboratoty (NREL) renewble energy data center, Updated June 06 2011, Website: < http://www.nrel.gov/rredc/pvwatts/grid.html >.
Ozgener, O., Hepbasli, A., and Ozgener, L., 2007, “A parametric study on the exegoeconomic assessment of a vertical ground-coupled (geothermal) heat pump system ,” Building and Environment, 42, pp. 1503-1509.
Prabha, E., March 2006, “Solar Trough ORC Electricity System (STORES) Stage 1- Power plant optimization and economics,” National Renewable Energy Laboratory report, NREL/SR-550-39433.
Rabl, A., Active solar collectors and their applications, Oxford University Press, New York, 1985.
Roodman, D.M. and Lenssen, N., 1995, “A building revolution: How ecology and health concerns are transforming construction”, Worldwatch Paper, Worldwatch Institute, Washington, DC.

118
Rayegan, R., and Tao, Y.X., 2009, “A critical review on single component working fluids for Organic Rankine Cycles (ORCs),” ASME Early Career Technical Journal, 8(1), pp. 20.1-20.8.
Rayegan, R., and Tao, Y. X., 2011, “A procedure to select working fluids for solar Organic Rankine Cycles (ORCs),” Renewable Energy, Vol. 36 (2), pp. 659-670.
Rosen, M.A., and Dincer, I., 2003a, “Exergoeconomic analysis of power plants operating on various fuels,” Applied Thermal Engineering, Vol. 23, pp. 643-658.
Rosen, M.A., and Dincer, I., 2003b, “Thermoeconomic analysis of power plants: an application to a coal fired electrical generating station,” Energy Conversion and Management, Vol. 44, pp. 2743-2761.
Torcellini, P., Pless, S., and Deru, M., 2006, “Zero energy buildings: A critical look at the definition”, National Renewable Energy Laboratory report, NREL/CP-550-39833.
TRNSYS 17 Main Reference Manual.
Tsatsaronis, G., 2007, “Definitions and nomenclature in exergy analysis and exergoeconomics”, Energy, 32(4):249-253.
Tsatsaronis, G., and Winhold, M., 1985, “Exergoeconomic analysis and evaluation of energy conversion plants: I.A new General methodology”, Energy, 10(1):69-80.
United Nations Environmental Programme, September 2006, “Montreal protocol on substances that deplete the ozone layer,” Website: <http://ozone.unep.org/teap/Reports/TEAP_Reports/Teap-CUN-final-report-Sept-2006.pdf >.
Zhang, X. R., Yamaguchi, H., Unedo, D., Fujima, K., Enomoto, M., and Sawada, N., 2006, “Analysis of a novel solar energy-powered Rankine cycle for combined power and heat generation using supercritical carbon dioxide,” Renewable Energy, 31, pp. 1839-1854.

119
VITA
RAMBOD RAYEGAN
EDUCATION
1996 B.Sc., Mechanical Engineering University of Tehran Tehran, Iran 1998 M.Sc., Mechanical Engineering University of Tehran Tehran, Iran 2009 Doctoral Candidate in Mechanical Engineering Florida International University Miami, Florida, USA
AWARDS
Florida International University, University Graduate School, Doctoral Evidence Acquisition Fellowship, Summer and Fall 2009. Florida International University, Student Government Association, Graduate Student Leadership Scholarship, 2008.
PUBLICATIONS
Book Chapter
Tao, Y. X., Rayegan, R., “Solar energy applications and comparisons,” in Energy and Power Generation Handbook, Editor: K. R. Rao, Publisher: ASME Press (In Press)

120
Papers
Rayegan, R., Tao, Y.X., 2011, “Analysis of solar Organic Rankine Cycle for a building in hot and humid climate,” ASME 2011 International Mechanical Engineering Congress and Exposition, Denver, Colorado, USA. (Accepted) Rayegan, R., Tao, Y. X., 2011 “A procedure to select working fluids for solar Organic Rankine Cycles (ORCs),” Renewable Energy, 36 (2), pp. 659-670. Rayegan, R., Tao, Y. X., 2009, “A critical review on single component working fluids for Organic Rankine Cycles (ORCs),” ASME Early Career Technical Journal, 8(1), pp. 20.1-20.8. Mun, J., Rayegan, R., Phadtare, S., Zhu, Y., and Tao, Y.X., “Feasibility Study of Horizental Ground Loop Modules of EnergyPlus on Geothermal Heat Pump System Simulation,” ASME International Mechanical Engineering Congress & Exposition, Denver, Colorado, November 2011 (Accepted). Jones, W.K., Zheng, F., Siddiqui, M., Rayegan, R., Tao, Y.X., 2008, “Development of 3-D channels in LTCC for capillary cooling structures for thermal management,” IMAPS/ACerS 4th International Conference and Exhibition on CICMT, Munich, Germany. Rayegan, R., Tao, Y. X., 2007, “A critical review of hot gas and reverse cycle defrost methods,” ASME Early Career Technical Journal, 6(1), pp. 9.1-9.8. Rayegan, R., Ziari A., 2006, “Analysis of energy and cost reduction in a typical residential building due to using appropriate thermal insulation materials,” The 5th Conference of Iranian Fuel Consumption Optimization (I.F.C.O.), Tehran, Iran. Rayegan, R., Jahani, N., 2004, “Ocean Thermal Energy Conversion (OTEC) power plants,” Proceedings of the 1st International Conference on Eco-energy, Urima, Iran. Nourbakhsh, A., Rayegan, R., 2001, “Cavitation erosion testing techniques,” Journal of Faculty of Engineering, University of Tehran, 34(1), pp. 96-107.