Embed Size (px)
Citation preview

EXERCISE INDUCED BRONCHOCONSTRICTION:
A COMPARISION OF TWO PROVOCATION TESTS FOR THE SCREENING OF
ATHLETES.
A thesis submitted to the University of Gloucestershire for the degree of
MSc by Research in the Faculty of Sports Science
By
JOSEPH LUKE FFOULKES
University of Gloucestershire
June 2015

II
ABSTRACT
BACKGROUND: Exercise induced bronchoconstriction (EIB) affects a large number of
athletes, with rates within literature between 7% to 50% for elite athletes (Dickinson et
al., 2006; Falvey et al., 2010). Two provocation methods for the diagnosis of EIB include
an exercise challenge test (ECT) and a eucapnic voluntary hyperpnoea (EVH) test.
Previous research has compared the airway response to ECT to EVH but has often failed
to ensure that the ECT is conducted according to standardised guidelines (ATS., 1999;
Trumper et al., 2009; Stickland et al., 2010). PURPOSE: Therefore, the aim of this study
was to compare the airway responses to ECT and EVH following standardised
guidelines. METHODS: In a randomised order and on separate days, seventeen
participants completed an ECT and an EVH test. Participants were all University level
athletes or professional rugby league player (Age 25 ± 2 yr.; height 1.81 ± 0.06 m; mass
85.4 ± 13.7 kg) recruited via open enquiry to the study. The ECT procedure followed the
American Thoracic Society (ATS) protocol, whilst the EVH test followed the procedures
recommended by Anderson et al. (2001). Spirometry was performed prior to and at 0, 3,
5, 10, 15, 20, and 30 min post challenge. A positive EIB diagnosis was regarded as a
≥10% decrease in forced expired ventilation over one second (FEV1). RESULTS: Nine
participants experienced a fall in FEV1 ≥10%, with five having falls ≥10% in both
provocation tests. Two participants experienced falls in the ECT alone and EVH alone
respectively. Out of the nine participants, only two had a previous history of asthma.
There was no significant difference in the peak ΔFEV1 between the two provocation tests
(p=0.143). CONCLUSION: In summation, athletes should be tested for EIB, with both
the ECT and EVH being acceptable methods, although our results are inconclusive due
to poor agreement and limitations. Future research should aim to have a greater number
of participants.

III
DECLARATION
I declare that the work in this thesis was carried out in accordance with the regulations
of the University of Gloucestershire and is original except where indicated by specific
reference in the text. No part of the thesis has been submitted as part of any other
academic award. The thesis has not been presented to any other education institution in
the United Kingdom or overseas.
Any views expressed in the thesis are those of the authors and in no way represent those
of the University.
Signed: Date: June 2015

IV
ACKNOWLEDGEMENTS
Many thanks to Dr Stephen How and Dr Simon Fryer for their continued support, use of
their knowledge and patience for the duration of my research. Thanks to the University
of Gloucestershire for providing me with the opportunity to complete my research, and
providing me with the facilities and literature to do so. I am also grateful for the support
and encouragement of my parents during this time. They have always believed in me
and are always proud of my achievements. Finally, a big thank you goes to Rachel
Primarolo for her love, friendship, patience and support over the past three years.

V
TABLE OF CONTENTS
Preliminaries
Title Page………………………………………………………………………………… I
Abstract………………………………………………………………………………….. II
Declaration………………………………………………………………………………. III
Acknowledgements……………………………………………………………………. IV
Table of Contents………………………………………………………………………. V
List of Tables……………………………………………………………………………. VIII
List of Figures…………………………………………………………………………... VIII
List of Symbols and Abbreviations…………………………………...................... IX
Thesis
Chapter 1 INTRODUCTION……………………………………………………….. 1
Chapter 2 LITERATURE REVIEW……………………………………………….. 6
2.1 Asthma Pathology…………………………………………………………... 7
2.2 Exercise Induced Bronchoconstriction Mechanisms………………….... 9
2.2.1 Airway Inflammation……………………………………………... 10
2.2.2 Refractoriness……………………………………………………. 11
2.3 Affected Populations………………………………………………………... 12
2.3.1 Winter Sports……………………………………………………... 12
2.3.2 Summer and All Year Round Sports…………………………… 13
2.3.3 Athletes at High Risk…………………………………………...... 14
2.4 Gender Variations…………………………………………………………… 15
2.5 Prevention and Medication………………………………………………… 15
2.5.1 World Anti-Doping Agency Guidelines………………………… 17
2.6 American Thoracic Society Guidelines for the diagnosis of EIB……… 17
2.6.1 Evaluation of Heart Rate Protocol……………………………… 18
2.7 Exercise Challenge Testing………………………………………………... 21

VI
2.8 Eucapnic Voluntary Hyperpnoea………………………………………….. 24
2.9 Exercise Challenge Testing vs. Eucapnic Voluntary Hyperpnoea…….. 26
2.10 Spirometry………………………………………………………………. 28
2.11 Standardisation…………………………………………………………. 30
Chapter 3 METHOD………………………………………………………………… 31
3.1 Participants………………………………………………………………….. 32
3.2 Procedures………………………………………………………………….. 32
3.3 Spirometry…………………………………………………………………… 33
3.4 Exercise Challenge Test…………………………………………………… 34
3.5 Eucapnic Voluntary Hyperpnoea………………………………………….. 34
3.6 Treatment of Data…………………………………………………………... 35
3.7 Statistical Analysis………………………………………………………….. 35
Chapter 4 RESULTS……………………………………………………………….. 37
4.1 Summary…………………………………………………………………….. 38
4.2 Baseline Lung Function……………………………………………………. 38
4.3 Achievement of Target Heart Rate during the ECT…………………….. 39
4.4 Achievement of Target Ventilation during the EVH……………………... 39
4.5 Effect of Provocation Test on the Airway Response:
Exercise Challenge Test and Eucapnic Voluntary Hyperpnoea……..… 40
4.6 Effect of Provocation Test on the Airway Response:
Positive and Negative diagnosis………………………………………….. 41
4.7 Post Provocation Lung Function…………………………………………... 42
4.7.1 ΔFEV1…………………………………………………………….. 44
4.7.2 ΔFVC……………………………………………………………… 44
4.7.3 ΔPEF…………………………………………………………….... 44
4.7.4 ΔFEV1/FVC……………………………………………………..... 45
4.8 Agreement Between ECT and EVH……………………………………… 46
Chapter 5 DISCUSSION…………………………………………………………… 48

VII
5.1 Key Findings………………………………………………………………… 49
5.2 Literature Comparison……………………………………………………… 49
5.3 Pathological Interpretation………………………………………………… 50
5.4 Clinical Interpretation………………………………………………………. 52
5.5 Strengths, limitaions and Future Research…………………………….... 53
Chapter 6 CONCLUSION……………………………………………..…………… 55
Chapter 7 REFERENCES……………………………………..…………………... 57
Chapter 8 APPENDICES……………………………………………………..…… 67
8.1 Health History Questionnaire…………………………………………….. 68
8.2 Respiratory Clinic Health Questionnaire………………………………… 74
8.3 Research Participant Information Sheet………………………………… 75
8.4 Medication Withhold Times……………………………………………….. 79

VIII
LIST OF TABLES
Chapter 4 RESULTS
Table 1: Participants response to provocation testing………………………………. 38
Table 2: Mean (SD) for the paired samples t-test for peak fall in:
ΔFEV1, ΔFVC, ΔPEF and ΔFEV1/FVC………….………………………….. 41
Table 3: Mean (SD) for the paired samples t-test in positive and negative
results for peak fall in ΔFEV1, ΔFVC, ΔPEF and ΔFEV1/FVC….………... 41
Table 4: Mean (SD) for ΔFEV1, ΔFVC, ΔPEF, ΔFEV1/FVC over the seven post
provocation test time points for positive and negative groups…………… 43
LIST OF FIGURES
Chapter 4 RESULTS
Figure 1: Percentage of Target HR Achieved Against Peak Fall in FEV1………… 39
Figure 2: Percentage of Target V̇E Achieved Against Peak Fall in FEV1………….. 40
Figure 3: Correlation between Peak Fall in FEV1 during the ECT and EVH……... 46
Figure 4: Bland and Altman Plot for the Mean Scores and Difference
in Peak Falls in FEV1 between the ECT and EVH………………………. 47

IX
LIST OF SYMBOLS AND ABBREVIATIONS
≥ Greater Than or Equal To
Δ Delta or Difference
˚C Temperature Celsius
µ Micro
ATS American Thoracic Society
BUSC British Universities and College Sport
ECT Exercise Challenge Test
EIA Exercise Induced Asthma
EIB Exercise Induced Bronchoconstriction
ERS European Respiratory Society
EVH Eucapnic Voluntary Hyperpnoea
FCєRI Immunoglobulin Receptors
FEF25-75 Forced Expiratory Flow at 25 to 75%
FEV1 Forced Expiratory Volume in One Second
FVC Forced Vital Capacity
GxT Gas Exchange Threshold
hrs Hours
HR Heart Rate
HRmax Max Heart Rate
IgE Immunoglobulin E
IL - Interleukin 4, 5, 9, 13, 17A
IMC-OC International Olympic Committee Medical Commission
kg Kilograms
[La+] Lactate Concentration
L·min-1 Litres per Minute
LECT Laboratory Exercise Challenge Test

X
m Meters
min Minutes
MVV Maximum Voluntary Ventilation
PEF Peak Expiratory Flow
PGE2 Prostaglandin E 2
RH Relative Humidity
s Seconds
SSECT Sports Specific Exercise Challenge Test
TH T Helper Cells Type 2, 9, 17
WADA World Anti-Doping Agency
V̇CO2 Volume of Carbon Dioxide Expired
V̇E Minute Ventilation
V̇Emax Maximum Minute Ventilation
V̇O2 Volume of Oxygen Consumed
V̇O2max Maximum Oxygen Consumption
V̇O2peak Peak Oxygen Consumption
yr Years

Chapter One - Introduction MSc by Research
1
CHAPTER ONE
INTRODUCTION

Chapter One - Introduction MSc by Research
2
Asthma is regarded as a highly prevalent chronic inflammatory disease, characterised
by intermittent airway obstruction, causing breathlessness, wheezing and coughing.
(Curran et al., 2010). Asthma is a common diagnosis in both adults and children,
affecting 300 million people worldwide; with 5.4 million in the United Kingdom. Out of
those affected, 4.3 million are adults and 1.1 million are children (Kudo et al., 2013; UK,
2015). The mechanisms of asthma are triggered via an external stimulus, such as foreign
bodies within inspired air, dry environmental conditions and exercise, stimulating T
helper type 2 release cells (TH2) (Kudo et al., 2013). The release of TH2 causes an
immediate responsiveness, mediated via immunoglobulin E (IgE), which gets captured
via eosinophils and mast cells within the airway, causing the release of inflammatory
molecules and subsequently, airway obstruction (Barrios et al., 2006).
The term exercise-induced asthma (EIA) describes the transient narrowing of the airways
seen after the stimulus of exercise in those with clinically diagnosed asthma, causing
abnormal coughing, wheezing, chest tightness and/or dyspnoea (ATS., 1999; Dryden et
al., 2010). Symptoms of EIA can also occur after exercise in individuals without a clinical
diagnosis of asthma, and in these circumstances the term exercise-induced
bronchoconstriction (EIB) is used (Holzer & Brukner, 2004; Dryden et al., 2010). The
term EIB will be used within this study.
The two hypothesised theories that cause these responses are the osmotic and the
thermal hypotheses (Anderson & Daviskas, 2000; Rundell & Jenkinson, 2002; Stoloff et
al., 2011). The osmotic hypothesis considers that during exercise, inspired air gets
conditioned within the upper airway. This conditioning process evaporates airway
surface liquid, causing dehydration as osmosis draws water from the nearby epithelial
cells, in turn, shifting the condition process into the smaller, lower airways, causing

Chapter One - Introduction MSc by Research
3
airway constriction (Anderson & Daviskas, 2000; Anderson & Kippelen, 2012). The
thermal hypothesis states that airway cooling during exercise followed by rapid
rewarming post causes oedema within the airway walls, assisting to the constrictive
response (Anderson & Daviskas, 2000).
Up to 80% of people with clinical asthma experience symptoms after exercise (Anderson
& Holzer, 2000). It is also frequently reported within the elite athlete population; with 25%
of European athletes at the Beijing Olympic Games, and 50% of winter sport athletes
experiencing symptoms of EIB (Moreira et al., 2011). The high prevalence in elite
athletes in sporting events such as swimming, winter and endurance sports reflect the
mechanisms which onset EIB due to the high rates of ventilation during these events, as
well as the environmental conditions these events are competed in.
The athletic population, specifically those of an elite standard are more prevalent to
asthmatic symptoms of EIB, however, the developed mechanisms theories do not fully
explain the increase in susceptibility (Anderson & Holzer, 2000; Moreira et al., 2011).
During training and competition, athletes are exposed to varied environmental
conditions, airborne allergens and irritants which enhance the magnitude of the
bronchoconstriction, coinciding to the increased prevalence in elite swimmers, winter
sports and endurance athletes (Wilber et al., 2000; Knopfli et al., 2007). Most athletes
present a performance driving mentality and increased pain threshold which affect their
perception of airway constriction and its subsequent performance limitations, which
although desirable within sports, may hinder athletes’ perception, education and
treatment of EIB (Rundell et al., 2001).

Chapter One - Introduction MSc by Research
4
To control the severity of the bronchoconstriction, athletes commonly use inhaled short
action and long action β2-agonist before exercise to reduce respiratory symptoms
(Dryden et al., 2010). The current World Anti-Doping Agency (WADA) guidelines for β2-
agonist allow for salbutamol, salmeterol and formoterol to be used following pre-
prescribed dosage, and to be monitored to ensure dosages and within therapeutic
ranges, so a therapeutic usage exemption form (TUE) is not needed (WADA, 2015).
Two physiological bronchial provocation tests used for the diagnosis of EIB are; the
exercise challenge test (ECT), and the eucapnic voluntary hyperpnoea (EVH) (ATS.,
1999; Anderson et al., 2001; Dickinson et al., 2006). The ECT, recommended by the
American Thoracic Society (ATS) aims to stimulate the airways via increased ventilation
during high intensity exercise at 80% to 90% heart rate max (HRmax), whereas the EVH,
designed as a surrogate for the ECT by the American military, substitute exercise with
controlled hyperventilation of a dry gas mixture at 80% maximum voluntary ventilation
(MVV) (Anderson et al., 2001). For both challenges, a positive diagnosis occurs when
forced expiratory ventilation (FEV1) falls by ≥10% when compared to the baseline lung
function (ATS., 1999).
Both provocation tests have been used for the diagnosis of EIB in athletes and are both
accepted methods by the International Olympic Committee Medical Commission (IOC-
MC). Out of the two provocation tests, previous research has suggested that the EVH is
a more sensitive method of diagnosis (Dickinson et al., 2006), although the methods
used within the research have not followed current guidelines. A review by Stickland et
al. (2010) found that previous research failed to complete the ECT following the current
ATS guidelines, with lack of control of air water content, exercise intensity and duration,
and follow up spirometry. These deviations would alter the severity of the ECT, leading

Chapter One - Introduction MSc by Research
5
to an under or over diagnosis. In this case, the sensitivity of the EVH relative to the ECT
is unclear.
The review by Stickland et al. (2010) brings into question both the need to standardise
the testing procedure, specifically the ECT, but also brings into question the previous
research comparing the ECTs and EVHs sensitivity. Also, with the high prevalence of
EIB in the athletic population, it is important to tests those who compete on a regular
basis to ensure those who may be unaware are educated and informed, specifically in
high risk sports. Therefore, the aim of the present study was to determine whether there
was a significant difference between the ECT and EVH provocation tests for screening
athletes when adhering to current guidelines.

Chapter Two – Literature Review MSc by Research
6
CHAPTER TWO
LITERATURE REVIEW

Chapter Two – Literature Review MSc by Research
7
2.1 Asthma Pathology
Asthma effects more than 300 million people all over the world, with approximately
250,000 annual deaths caused by the disease (Kudo et al., 2013). Within the United
Kingdom alone, 5.4 million people are affected by asthma (UK, 2015).
The precise basis of the development of airway inflammation in patients with asthma is
not fully defined (Barrios et al., 2006). Allergic asthma is a disease characterised by
intermittent airway obstruction that causes difficulty in breathing, ultimately mediated by
hyper-responsive bronchial smooth muscle, separated airway glycoproteins and
inflammatory debris produced by airway goblet cells (Barrios et al., 2006; Kudo et al.,
2013). Two principal immune mechanisms lead to airway obstruction in allergic
inflammation, both dependent on the presence of a terminally differentiated subset of T
helper cells, the TH2 cell in the lung (Barrios et al., 2006). The TH2 cell secretes a highly
characteristic cytokine repertoire that includes interleukin-4 (IL-4), IL-5, IL-9, and IL-13,
all of which contribute to the manifestation of inflammation (Yazdanbakhsh et al., 2002;
Kudo et al., 2013). Common inhaled allergens which stimulate TH2 cell are house dust
mites, animal dander, fungi and pollen (Kudo et al., 2013).
The immediate hypersensitivity response is mediated by IgE, an antibody isotype
produced by B cells activated by IL-4 (Barrios et al., 2006). Circulating IgE is captured
by immunoglobulin receptors (FCєRI) present on immune effector cells such as mast
cells, basophils and eosinophils (Barrios et al., 2006). Subsequent encounters with
antigen induce FCєRI cross linking, cellular activation, degranulation of mast cells,
basophils and eosinophils, and the release of a variety of toxic inflammatory molecules,
specifically leukotrienes, lipid mediators of inflammation derived from arachidonic acid.

Chapter Two – Literature Review MSc by Research
8
Leukotrienes are short-lived molecules existing in a variety of isoforms which act through
G protein-coupled receptors. They induce airway hyper-responsiveness, eosinophilia
and airway glycoprotein hyper secretion, ultimately eliciting obstruction (Barrios et al.,
2006).
The type 4 hypersensitivity response is mediated through TH2 cytokines IL-4 and
predominantly IL-13, as it acts directly on airway smooth muscle and the epithelium to
elicit airway hyper-reactivity, enhanced glycoprotein production, and eosinophilia. IL-4
and IL-13 are signalled through the α chain of the IL-4 receptors, members of the Janus
family of tyrosine kinases. Both contribute indirectly by aiding immediate hypersensitivity
reactions. IL-4 and IL-9 are required for mast cell maturation, IgE recreation, and signals
through α chain of the IL-4 receptors mediate eosinophil recruitment. More recent
developments within the pathophysiology has found that the TH17 and TH9 cells also
modulate asthma through the production of IL-17A, which enhances smooth muscle
contractibility, and IL-17F and IL-22, which induce airway inflammation (Kudo et al.,
2013).
Most pathologic patterns of asthma have been derived from autopsy studies. These
patterns are based on individuals who died of asthmaticus over-inflation and mucus
plugs obstructing the medium-sized bronchi, small bronchi and bronchioles. In
asthmatics, over-inflation occurs when the lungs fill the chest cavity during status
asthmaticus and do not collapse when the pleural space is opened, even when the lungs
appear normal between attacks. Mucous plugs are made of heavily viscous inspired
mucus produced by both sub-mucosal gland hypertrophy and goblet cell hyperplasia
which fill both bronchi and bronchioles (Kudo et al., 2013). In asthmatics, mucin and
goblet cells in the epithelium can be three times higher when compared to a non-
asthmatic. Patients dying of status asthmaticus have a two to three fold increase in the

Chapter Two – Literature Review MSc by Research
9
amount of airway smooth muscle, especially in the medium sized bronchi, with thickness
increased with age, due to myofibroblast, characterised as airway remodelling. Airway
remodelling has a profound effect on airway narrowing mechanics, exacerbating the
chronicity and progression of the disease (Kudo et al., 2013). It is postulated that the
injured airway epithelium acts as a continuous stimulus for airway remodelling.
2.2 Exercise Induced Bronchoconstriction Mechanisms
EIB is described as the drying and cooling of the intra-thoracic airways and mucosa,
stimulating the release of inflammatory mediators causing airway narrowing during or
following exercise (Rundell et al., 2002; Tecklenburg et al., 2007; Anderson, 2012;
Mainardi et al., 2012). The fundamental mechanics of EIB are believed to be part of a
multifaceted approach, explaining why both healthy and asthmatic individuals can
develop EIB (Rundell et al., 2002; Parsons & Mastronarde, 2005; Stoloff et al., 2011).
The mechanism whereby airway narrowing occurs due to the response of exercise is
subdivided into two key hypotheses; the thermal and the osmotic (Anderson & Daviskas,
2000; Rundell et al., 2002; Stensrud et al., 2006).
The thermal hypothesis considers that EIB is initiated by the thermal effects on the
airways during and post exercise, that is, airways cooling during exercise following rapid
rewarming of the airways after exercise. These thermal effects are proposed to cause a
reactive hyperaemia of the bronchial microvascular, and oedema of the airway wall
(McFadden et al., 1986; Anderson & Daviskas, 2000). Stimulation during post exercise
environmental conditions may affect severity of EIB through reducing the reactive
hyperaemia. McFadden et al. (1986) aimed to observe changes in respiratory airways
whilst controlling the temperature and humidity during both exercise and recovery. Data
confirmed that when the respiratory tract is rapidly rewarmed post exercise, there is a
significant decrease in FEV1 compared to a controlled temperature and gradual

Chapter Two – Literature Review MSc by Research
10
rewarming, even when exercise was performed in sub-freezing temperatures,
concluding that thermal aspects do play a part in constriction.
The osmotic hypothesis puts forward that the increase in ventilation during exercise and
subsequent conditioning of the inspired dry air causes dehydration within the respiratory
cells, initiating the contraction of the bronchial smooth muscle (Anderson & Daviskas,
2000), and because EIB can occur without significant cooling of the airways, the osmotic
effects are thought to be more important than the thermal effects (Rundell et al., 2002).
During activities with high ventilatory flow rates in dry conditions, the conditioning of
inspired air becomes more intensive, requiring the smaller airways to aid in the
conditioning process. It is theorised that water loss from the airways surface causes
water to move out of nearby cells in response to increases in osmolality (Anderson &
Daviskas, 1997; Rundell et al., 2002).
2.2.1 Airway Inflammation
Airway inflammation during EIB plays a pivotal role in airway sensitivity during the
osmotic stimulus (Dryden et al., 2010). Inflammation response occurs via stimulation of
the mast cells and eosinophils within the respiratory tract due to increased ventilation
during exercise (Hallstrand et al., 2007; Anderson, 2012). Mast cells are highly
developed cells derived from bone marrow, associated with structures such as blood
vessels and nerves, in proximity to surfaces that interface the external environment
(Metcalfe et al., 1997; Anderson, 2012). When activated, mast cells and eosinophils
release mediators, including histamines, leukotrienes and eicosanoids, such as
cysteinyl, leukotraines and prostaglandin D2, inducing allergic inflammation (Metcalfe et
al., 1997; Hallstrand et al., 2007; Philip et al., 2007; Mainardi et al., 2012).

Chapter Two – Literature Review MSc by Research
11
Two principle immune mechanisms are believed to lead to airway obstruction, both
dependent on T helper cells (Marsh et al., 1994; Barrios et al., 2006). Immediate
responsiveness is mediated by IgE. IgE antibody is associated with atopic allergies and
linked with T Cell-B interaction. Stimulation between the T helper cells and B-cells, and
the release of IL-4 and IL-13 result in a specific IgE response (Marsh et al., 1994). These
IgE responses are bound to high affinity IgE receptors on mast cells and basophils
(Walley & Cookson, 1996). The input IL-4 enhances the degranulation of mast cells by
increasing the saturation of IgE receptors with allergen complexes (Walley & Cookson,
1996). IL-13 is a TH2 cytokine which binds to the α chain of IL-4 (Wills-Karp et al., 1998),
playing a key role in airway hyper-responsiveness. Research by Wills-Karp et al. (1998)
found a blockade of IL-13 via soluble IL-13α2-IgEFc fusion protein 24 hr before intra-
tracheal allergen challenge resulted in significant decrease in airway hyper-
responsiveness, concluding that IL-13 is the primary T cell derived factor responsible for
allergen-induced airway inflammation and EIB.
2.2.2 Refractoriness
Refractoriness is the time post exercise, whereby if an asthmatic develops EIB and then
spontaneously recovers within about an hour, a secondary exercise stimulus results in a
marked reduction in EIB in about 50% of subjects (Larsson et al., 2011). Research by
Larsson et al. (2011) found that completing one ECT achieved a fall in FEV1 of 26.9%,
which reduced to a 13.3% after a second challenge. Because refractoriness disappears
if an asthmatic is treated with a nonsteroidal anti-inflammatory medication, it may be
mediated by a prostaglandin, such as prostaglandin E2 (PGE2). PGE2 is a known
bronchodilator produced in the lungs (Suman et al., 2000). Suman et al. (2000) study on
PGE2 effects on guinea pigs found that prolonged hyperventilation caused a slow
release of PGE2, due to airway cooling, drying or stretching, but could not fully conclude
that PGE2 involvement caused refractoriness.

Chapter Two – Literature Review MSc by Research
12
2.3 Affected Populations
EIB has become more common place in athletes competing at an Olympic level, with
607 athletes at the Sydney Olympics notifying the medical commission of the use of a
β2-agonist, a notable increase above the 383 athletes seen at the 1996 Atlanta games
(Holzer et al., 2002). However, a recent study at the Beijing Olympics reported that one
in four European athletes experienced symptoms associated with EIB (Carlsen et al.,
2008). Overall, high performing athletes are at a higher risk of EIB compared to the
general population (Knopfli et al., 2007). Although EIB can affect any athlete, with up to
50% of athletes suffering from EIB (Wilber et al., 2000; Holzer et al., 2002; Parsons &
Mastronarde, 2005), it is more prevalent in certain sports, specifically: endurance sports,
swimming and winter sports, or sports that induce a high ventilatory component (Rundell
et al., 2002; Moreira et al., 2011).
2.3.1 Winter Sports
Larsson et al. (1993) investigated elite cross country skiers found that due to the cold
and dry environmental conditions experienced during both training and competition,
asthmatic symptoms occurred in 55% of elite skiers. Similar research by Rundell et al.
(2001) found that in a wide range of elite cold-weather athletes, EIB was present with
26% of subjects being classified with the condition.
Wilber et al. (2000) conducted a case study on the US winter Olympic team and aimed
to determine whether differences occurred within winter sports, even those performed in
similar environmental conditions, could affect possible EIB rates. 23% of the 170 subjects
from 7 sports had incidences of EIB post testing. Although environmental conditions were
similar, certain sports had greater incidences of EIB. 50% of cross country skiers were
diagnosed with EIB, coinciding with previous research by Larsson et al. (1993). 6 out of

Chapter Two – Literature Review MSc by Research
13
7 sports did show incidences of EIB, with biathlon being the exception. Wilber et al.
(2000) concluded that due to an unseasonably warm day during competition (+11°C),
the stimulus of cold weather was reduced. The similarity between biathlon and cross-
country skiing should procure a different result when performed in a cold, dry condition.
Dickinson et al. (2006) also researched the prevalence within winter sports, specifically
British short track speed skaters and biathletes using the ECT, EVH and sports specific
tests (SST). Out of the 14 athletes tested, 10 achieved peak falls in FEV1 ≥10% of
baseline, but results were dependent on the screening method used. The EVH had the
highest percentage of falls ≥10%, with 10 out of the 14. For the ECT, none of the
participants had falls ≥10%, and the SST had 3.
2.3.2 Summer and All Year Round Sports
Weiler et al. (1998) worked alongside the US summer Olympic team addressing EIB
incidences in multiple sports for athletes who competed in the 1996 Atlanta Olympics.
Out of the 699 athletes who took part in the study, 17% were diagnosed with having EIB.
With high ventilatory rates seen in track, road and off road cycling, these sports had the
greatest asthmatic response with 50% of athletes being diagnosed.
Research by Schoene et al. (1997) on US elite track and field athletes found that after
their events, long distance athletes, such as 10km runners and 20km walkers had
diagnosed cases of EIB, due to their larger vital capacities and high ventilation rates
during events. Similarly, Helenius et al. (1997) research with 213 elite track and field
athletes, found that event type relates to the amount of athletes who get diagnoses with
asthma. In their results, like Schoene et al. (1997), long distance runners were much
more susceptible to EIB symptoms compared to sprinters, field eventers and sedentary
individuals, due to short events do not stimulate the ventilation system for a sufficient
amount of time to cause the thermal or osmotic changes.

Chapter Two – Literature Review MSc by Research
14
Studies in all year round sports like football have found varying results into the severity
of EIB above the general population. Ventura et al. (2009) investigated young football
players who play as part of a major team via self-reported questionnaire. These athletes
had a slightly greater percentage of EIB than that seen in recreational players, but not
enough to be statistically significant (5.1% = Players, 2.9% = Recreational). Although the
study found no difference, the design was aimed more to allergies with airborne particles
rather than a pre-existing asthmatic condition. Research by Rupp et al. (1992) analysed
a range of middle and high school athletes with possible unrecognised EIB found that
out of the 230 tested, 66 were diagnosed with EIB. Although participants were not
selected on an asthmatic basis, those with a medical history criteria, or risk factors
indicating EIB, such as abnormal spirometry results were chosen.
2.3.3 Athletes at High Risk
There is an overwhelming body of evidence which shows that athletes, specifically those
of a high standard are at an increased risk of asthmatic symptoms and EIB (Larsson et
al., 1993; Wilber et al., 2000; Knopfli et al., 2007; Moreira et al., 2011). However, the
reasoning and mechanisms for this remain unclear, with possible theories relating to;
increased exposure to environmental factors, genetic pre-disposition and
physiological/psychological variations (Moreira et al., 2011). An elite athlete goes above
and beyond, both physiologically and psychologically, when training and competing,
which can affect the diagnosis of asthma and EIB (Rundell et al., 2002). Psychologically,
elite athletes become more performance driven, and look upon asthma interventions as
both a physical and psychological battle against their training and competing (Rundell et
al., 2002). During training and competition, athletes may become more exposed to
triggers which influence the occurrence of EIB, such as airborne allergens and irritants
for example, pollen and exhaust fumes, as well as environmental conditions with extreme
temperatures and differing humidities (Rundell et al., 2002). Intensive training can

Chapter Two – Literature Review MSc by Research
15
increase susceptibility via effecting autonomic regulation and cardiac function, thus
effecting airway smooth muscle (Parsons & Mastronarde, 2005; Moreira et al., 2011).
2.4 Gender Variations
Although athletes have a high prevalence of EIB when compared to the general
population, little is known about the differences between the genders (Langdeau et al.,
2009). Prior to puberty, asthma is greater in males, with females being greater post
puberty. The possible shift may be due to the start of the menstrual cycle, caused by the
release of progesterone and oestrogen (Balzano et al., 2001; Postma, 2007). In
conjunction with Balzano et al. (2001) research by Stanford et al. (2006) with females
who recreationally train found a significant differences in forced vital capacity (FVC) and
FEV1 when comparing the early follicular (day 5) and mid-luteal (day 21) parts of the
menstrual cycle.
In the athletic population, research by Langdeau et al. (2009) into gender variations for
respiratory symptoms and asthma found that for exercise-induced respiratory symptoms,
female athletes were significantly more susceptible when compared to males. The
difference was possibly down to hormonal variations, following previous literature
(Balzano et al., 2001; Postma, 2007), although no data was collected within the area
and so this is merely speculation (Langdeau et al., 2009).
2.5 Prevention and Medication
There are multiple options to prevent EIB, all relating to modifying either the stimulus, or
the mechanism of EIB (Anderson, 2012). To reduce water loss during exercise,
conditioning the inspired air to body temperature (37°C) and 100% relative humidity (RH)
prevents EIB in the majority of cases (Anderson, 2012). Stensrud et al. (2006)
researched the effect of respiratory function at different humidity levels on EIB sufferers.

Chapter Two – Literature Review MSc by Research
16
When exercise was completed at 95% humidity, significant increases were found in both
respiratory functions, such as oxygen uptake (V̇O2), with significant reductions in FEV1
post exercise when compared to exercise completed at 40% humidity.
As EIB is stimulated via the release of mediators, suppression of their secretion via
pharmacological agents, such as β2-agonist, which when used prior to exercise,
effectively prevents asthmatics suffering from EIB (Anderson, 2012). A case study by
Stoloff et al. (2011) on a 45 year old male who had shown symptoms related to EIB,
reduced and removed those symptoms after a prescription of a β2-agonist post lung
function assessment. The supplementation of fish oils has also been evaluated as a
method of reducing EIB symptoms during exercise. Mickleborough et al. (2006) research
found that after 3 weeks of supplementation, lung function reduced below diagnosable
levels against both a control and a placebo group, creating a 31% reduction in
bronchodilator usage. With elite athletes, Mickleborough et al. (2003) found similar
results to the general population, with all 10 participants experiencing significant
reductions in EIB intensity. Supplementation of fish oil has anti-inflammatory potential
through eicosapentaenoic acid and arachidonic acid suppressing inflammatory
mediators (Mickleborough et al., 2003; Mickleborough et al., 2006).
Preventative measures via controlled exercise programs are regularly prescribed to
asthmatic patients as a way to improve aerobic capacity (Matsumoto et al., 1999).
Research by Matsumoto et al. (1999) found that completing 30 minutes of high intensity
swimming at 125% lactate threshold, six times per week for six weeks, subjects with pre-
diagnosed asthma and EIB significantly decreased their fall in FEV1 to levels below EIB
diagnosis range. The reduction was due to the increase in aerobic capacity, rather than
an increase in histamine responsiveness, with EIB results being reduced on a
multifunction format, both on a swimming and cycle ergometer (Matsumoto et al., 1999).

Chapter Two – Literature Review MSc by Research
17
2.5.1 World Anti-Doping Agency Guidelines
For athletes who compete and suffer from asthma or EIB, the WADA have guidelines to
follow to allow for the use of β2-agonists (WADA, 2015). Previously, all β2-agnoists
required proof of airway hyper-responsiveness when submitting therapeutic use
exemptions forms, but recent changes have allowed for the exemption of inhaled
salbutamol, formoterol and salmeterol, depending on dosage. For salbutamol, a
maximum of 1600 micrograms (µg) are allowed over 24 hours. For formoterol, a
maximum delivery dose of 54 µg is allowed over 24 hours. Salmeterol can be used in
accordance with therapeutic regimen (WADA, 2015).
For those who require an assessment of their asthmatic status, a test for the reversibility
of bronchospasm can be performed, whereby an increase of ≥12% in FEV1 after an
inhaled β2-agonists demonstrates the need for asthma medication. For evaluation of EIB,
the ECT and EVH tests are recommended with a ≥10% fall in FEV1 meeting the criteria
for the use of β2-agonists (WADA, 2015). For those athletes who just require exempt β2-
agonists, the need for EIB evaluation is not necessary, but encouraged to evaluate
current medication status (ATS., 1999).
2.6 American Thoracic Society Guidelines for the Diagnosis of EIB
The ATS model is broken down into two predominant areas; an ECT and spirometry
assessment. The ECT aims to subject the participant to exercise which induces
significant ventilation (V̇E), measured through a percentage of predicted heart rate max
(%HRmax). An 80-90% HRmax (220 - age in years) provides vigorous exercise conditions
whilst eliciting a V̇E rate of 40-60% predicted max (Anderson et al., 2010). ATS. (1999)
concur that physical variances such as anaerobic/aerobic fitness and body weight may
hinder a participant’s ability to obtain a %HRmax or percentage of predicted max

Chapter Two – Literature Review MSc by Research
18
ventilation (%V̇Emax), but also state the HR protocol is generally effective and practical.
However, Trumper et al. (2009) suggested that these physical variations, specifically
based in HR, means applying a prediction based formula creates an increased risk of
misjudging the optimum exercise intensity. Rundell et al. (2002) also suggests that due
to the increased level of conditioning attained by athletes, there is the potential to under
stimulate the ventilatory system through an underestimation of the exercise intensity.
Similarly, these theories should be both addressed to the range of physical conditions,
with people below their predicted HRmax being over stimulated during an ECT, becoming
unable to maintain that 80-90% HRmax. Although assessment via ECT based on %HRmax
is an efficient and well documented method, the physical variance can be a factor when
it comes to an accurate diagnosis. As EIB occurs within the ventilatory tract, focusing the
intensity of exercise upon a subject’s %V̇Emax would remove ambiguity caused by fitness
levels and physical conditioning.
2.6.1 Evaluation of the Heart Rate Protocol
As previously stated, ATS guidelines suggest that a ventilatory protocol can be
completed rather than a HR protocol (ATS., 1999), but it remains unclear whether it is a
potentially superseding method. Research by Trumper et al. (2009) aimed to equivocally
address the proposed statement that a HR based protocol does not ensure sufficient
intensity for inducing EIB. The pretence of the study focused on the aerobic to anaerobic
pathway shift, with evaluation of lactate concentrations [La+] and variance between
subjects was the key measure within the study. Depending on [La+], subjects FEV1
scores were divided into groups who experienced anaerobic conditions, with [La+]
>6mmol/L, against those who stayed within the aerobic pathways with [La+] <6mmol/L.
The results found that out of the 100 subjects, 56 did not reach the anaerobic pathway,
remaining below the required conditions. When both groups got compared with FEV1
data, those who had achieved a >6mmol/L [La+] had significantly reduced lung function
compared with those who remained aerobic.

Chapter Two – Literature Review MSc by Research
19
Although the research by Trumper et al. (2009) would claim that a HR based method is
insufficient to induce EIB, some stipulations must be made about the research model
undertaken, before a true judgement can be formed. Firstly, subject selection, whereby
100 clinically healthy individuals were selected, but literature into EIB is clear that the
prevalence of the condition is much greater in those who have a pre-diagnosed asthmatic
condition (Lacroix, 1999; Stoloff et al., 2011; Mainardi et al., 2012). The symptoms of EIB
have been recorded in those who do not have asthma (Anderson, 2011), but a review of
method should seemingly be performed upon those at highest risk. Secondly, data
comparison; although the data collected could be enough to conclude that a HR based
method lacks intensity in certain populations, choices of physiological markers remained
vague, such as the choice of a >6mmol/L [La+]. Finally, spirometry assessments were
completed only once, 10 minutes post exercise. The peak fall in FEV1 has been recorded
between 6 – 12 min post exercise (Rundell et al., 2002), suggesting that the individual
time choice would be significant, but the question of physical variances between subjects
should seemingly require multiple assessments like the original method (ATS., 1999).
The study by Trumper et al. (2009) concluded that a HR protocol was seemingly
insufficient when testing a wide range of individuals, but the method deviated from the
current standard. To suggest that a method is flawed would require a comparative
method design which aims to remove those physiological variances and create and
individualist testing protocol, such as analysis of HRmax prior, rather than a predicted
percentage, or as EIB is a ventilatory condition, focus exercise intensity upon a
percentage of V̇Emax. As stated, an EIB ECT diagnosis should look more towards a
ventilatory method rather than a %HRmax, as EIB has the causal link with the respiratory
system (Storms, 2003; Trumper et al., 2009; van Leeuwen et al., 2012), although current
methods use %HRmax to elicit a sufficient V̇E (ATS., 1999). Research onto the validity of
the respiratory method by Anderson et al. (2010) found that the current ATS method is

Chapter Two – Literature Review MSc by Research
20
of sufficient intensity to induce V̇E rates required to induce hyperventilation, in both adults
and children (Adults: 56.8% & 58.0% V̇Emax, Children: 54.7% & 56.3% V̇Emax).; However,
EIB positive diagnoses were only seen in 161 out of 373 of asthmatic subjects,
suggesting subjects remained under stimulated when compared to other methods of
testing (Cabral et al., 1999; Holzer et al., 2002; Stensrud et al., 2006)
Trumper et al. (2009) focused predominantly upon the level of physical exertion during
the test, stating that subjects must achieve a state of anaerobic exercise. A current
ventilator marker that can be used to assess anaerobic threshold is the gas exchange
threshold (GxT). The GxT method for assessing anaerobic threshold is a non-invasive
procedure whereby a breakpoint is seen within the breath by breath values of carbon
dioxide elimination (V̇CO2) against oxygen consumption (V̇O2), caused by the increase
in V̇CO2 from bicarbonate buffering of lactic acid (Magalang & Grant, 1995; McArdle et
al., 2009). Research by Haverkamp et al. (2005) onto the GxT within asthmatics and
diagnosis of EIB found that, when subjects performed an ECT at 90% maximum oxygen
consumption (V̇O2max), rather than 80-90% HRmax, post ECT FEV1 was significantly
reduced in both subjects who are EIB positive and negative, although the gas exchange
disturbance took sizably longer in EIB negative subjects (3 min positive; 35 min
negative). The GxT method for assessing anaerobic threshold, and subsequently EIB
would seem a more refined marker of ventilation than 80-90% HRmax, although
determination of exercise intensity which induces GxT is required before undertaking
and EIB assessment.
The benefits for a ventilation based protocol would be the removal of any individual
physiological variations which may occur due to physical background (Trumper et al.,
2009), although it would require an initial assessment to define a ventilation level
required to elicit a sufficient intensity. Research into the ATS relationship with V̇E has
found that the use of %HRmax is sufficient enough to induce an V̇E that caused EIB

Chapter Two – Literature Review MSc by Research
21
(Anderson et al., 2010), it remains questionable whether a more specific ventilatory point
would be more exacting, such as the GxT, to induce the respiratory and vascular
conditions sufficient enough to cause EIB. The stipulation would be whether an initial
assessment would be beneficial, when current methods requiring one session with
minimal equipment still find positive results.
2.7 Exercise Challenge Test
The ECT uses exercise to stimulate a high minute ventilation through the mouth to
increase the airway dehydration stimulus of conditioning inspired air, which can
performed both in a laboratory or field environment (Holzer & Brukner, 2004; Anderson,
2011). Field tests benefit from the availability to perform a range of vigorous, sports
specific exercises, with the increase in portable spirometry devices making complete
assessments much easier, although the large range of equipment needed, and the limit
control of air quality may effect results (Anderson, 2011). Laboratory tests, although
restrictive of sports specific testing, normally completed on treadmill or cycle ergometer,
have the benefit of control of inspired air conditions, as well as online gas meters (Holzer
& Brukner, 2004; Anderson, 2011). Limitations and false negative results occur due to
the exercise intensity and method undertaken. ATS state that exercise intensity should
ramp up rapidly over the first 2 min and be adjusted afterwards to maintain HR at the
target level (ATS., 1999). An intensity level too low can lead to the release of
bronchodilation constrictors, such as PGE2 which serve to protect the airways
(Anderson, 2011).
ATS guidelines for the ECT (ATS., 1999) are currently regarded as the standardised
method for testing using exercise as a stimulus. The method design aims to stimulate
the airways by exercising at 80-90% HRmax, or at a 40-60% V̇E of predicted MVV for ≥4
min in a dry air environment (ATS., 1999). Control of inspired air is vital as low water

Chapter Two – Literature Review MSc by Research
22
content is needed to stimulate the conditioning process (Rundell et al., 2002; Anderson,
2011). ATS. (1999) state that participants should inspire air of 20-25˚C and <50% relative
humidity. Optimally, water content of the inspired air should be <10mg/L. At air
temperatures of ≤10˚C, inspired air is sufficiently dry, specifically when testing those who
complete exercise in cold environments (ATS., 1999; Rundell et al., 2002; Anderson,
2011).
Exercise duration is also a key factor to the diagnosis of EIB, as time needed to achieve
target HR or V̇E may vary for age, physical fitness and body weight (ATS., 1999;
Anderson, 2011). For children, target HR or V̇E may be achieved quicker than adults,
affecting exercise time. For children, an exercise duration of 6-7 min may be needed to
elicit EIB, where adolescents or adults may need up to 8 min (ATS., 1999; Rundell et al.,
2002; Holzer & Brukner, 2004; Anderson, 2011). Once target HR is achieved, it should
be maintained for ≥4 min, but it is important to reach this point rapidly over the first 2-3
min (ATS., 1999; Anderson, 2011). Although two ergometer methods have been
developed, the treadmill method is preferred over the cycle ergometer, due to the more
rapid increase in V̇E in response to running, and the higher peak oxygen uptake achieve
compared to the cycle method (ATS., 1999).
FEV1 is the current most reliable marker for the assessment of EIB, with a fall of ≥10%
from baseline being regarded as a positive diagnosis, although ≥15% has been used,
specifically for field based testing (ATS., 1999; Anderson & Holzer, 2000; Holzer &
Brukner, 2004). Rundell et al. (2000) has also stated that a fall in FEV1 of ≥7% indicated
an abnormal airway response in the elite athlete population, as to try and reduce the
number of false positives. Assessment of FEV1 should be performed following the ATS
and European Respiratory Society (ERS) method for spirometry testing (Miller et al.,
2005). An appropriate spirometry testing procedure consists of pre ECT, 5, 10, 15, 20

Chapter Two – Literature Review MSc by Research
23
and 30 min post, although earlier testing at 1 and 3 min may be completed as EIB may
appear at the cessation of exercise. On average, the lowest FEV1 values are achieved
between 5-12 min after the completion of the ECT (ATS., 1999; Anderson, 2011). When
testing, a minimum of 2, preferably 3 assessments should be obtained, with highest and
second highest FEV1 values not differing by 0.15L (Miller et al., 2005). After 30-60 min,
FEV1 spontaneously recovers to 95% of the baseline value, although if participants do
not recover to less than 10% of baseline value, a bronchodilator may be administered if
the participant has a previous asthmatic condition.
Although the laboratory ECT has some benefits, such as control of environmental
conditions and testing protocols, the field test or sports specific has been used by
previous research (Rundell et al., 2000; Wilber et al., 2000; Rundell et al., 2004). The
variability in environmental conditions and exercise intensity and duration with field
testing makes test-retest difficult to control (Rundell et al., 2004). Similarly, although
laboratory tests have a more controlled environment, the environments in air conditioned
laboratories may not be sufficiently provocative, as air water content may not be
sufficiently low to induce EIB (Dickinson et al., 2006). The use of environmental
chambers may impact in the control of air temperature, RH and water content. Limited
research has been completed in regards to completing an ECT within a controlled
environment. Stensrud et al. (2007) used an environmental chamber to evaluate the
effect of performing an ECT in room temperature and subfreezing temperatures,
20.2°C±1.1 and -18°C±1.4 respectively, on EIB diagnosis. Using an adjusted ECT
protocol, where a 4 min phase was used to reach target HR of above 95% HRmax, with 4
min at target HR, significant increases in FEV1 were found after exposure to cold weather
compared to room temperature. During cold weather assessment, peak oxygen
consumption (V̇O2peak) was reduced in the last 4 min, correlating with participants
response that respiration was more difficult compared with regular conditions, possibly

Chapter Two – Literature Review MSc by Research
24
due to starting high intensity exercise in a cold environment without a warm-up, or the
reduced running speed (Stensrud et al., 2007).
2.8 Eucapnic Voluntary Hyperpnoea
Indirect challenges to assess bronchial hyper-responsiveness are becoming increasingly
used for both research and assessment (Anderson, 2011).The bronchial provocation
tests most used to identify EIB include; ECT (Laboratory based or Field), EVH and
pharmacological agents such as hypertonic saline and mannitol inhalation (Anderson &
Holzer, 2000; Rundell et al., 2004; Anderson, 2011).
The EVH assessment was developed, standardised and validated by the US Army at the
Walter Reed Medical Centre, as a surrogate to the ECT, in order to reduce the likelihood
of false negatives and increase safety issue related with the ECT (Anderson et al., 2001;
Anderson, 2011). The test design is a bronchial provocation test, aiming to stimulate the
airways via the respiration of dry air, causing osmotic and thermal consequences due to
humidifying the inspired air, without the requirement to complete exercise (Anderson et
al., 2001; Rundell et al., 2002). The IOC-MC validated the EVH as the recommended
method for analysis of the need for asthmatic medication, specifically in athletes, with
the benefits over an ECT such as; lower cost, induced V̇E rates greater than exercise
and increased safety (Argyros et al., 1995; Anderson et al., 2001; Holzer & Brukner,
2004; Rundell et al., 2004; Anderson, 2011). The usefulness of the EVH method is in
reducing the over or under diagnosis of EIB (Anderson, 2011).
The current method for EVH involves respiring dry air at 30 times FEV1 (85% MVV) for
6 min (Anderson et al., 2001; Sue-Chu et al., 2010; Anderson, 2011). Specific aspects
should be followed when completing an EVH and ECT assessment. Prior, no

Chapter Two – Literature Review MSc by Research
25
bronchodilators should be used 48hr before, although should not be withheld if needed.
Caffeine should not be consumed via food or drink 24hrs prior, although may vary
depending on laboratory. Vigorous exercise should not be undertaken 4hrs prior,
preferably not on the day of testing (Anderson et al., 2001). The condition of the inspired
air is vitally important for a valid assessment, with early studies performing in cold air
environments (Anderson, 2011). Medical grade mixture gas cylinder containing 21%
oxygen, 4.9-5.1% carbon dioxide with balanced nitrogen can be used (Anderson et al.,
2001; Holzer & Brukner, 2004; Rundell et al., 2004; Sue-Chu et al., 2010). The higher
CO2 content is used to maintain eucapnia over the range of ventilation (Holzer & Brukner,
2004; Anderson, 2011).
Certain limitations are present. The need to maintain eucapnia throughout a wide range
of ventilation rate means ventilation needs to be between 40-105 L·min-1. If ventilation is
outside these limits, end tidal CO2 needs to be monitored, as hypocapnia is a
bronchoconstricting stimulus which can cause acidosis (Anderson, 2011). Secondly, the
standard protocol of 30 times FEV1 (85% MVV) for 6 min is only appropriate for athletes
or participants who perform regular exercise, as high ventilation rates can cause a severe
reduction in FEV1 (Anderson, 2011). For asthmatics, adaptation to the method by the
reduction of ventilation rate to 21 times FEV1 or duration of 4 min would induce an MVV
of ~60% in asthmatics or untrained participants (Brummel et al., 2009).
A positive diagnosis during an EVH assessment is a fall in FEV1 at ≥10% that of baseline
(Holzer & Brukner, 2004). An appropriate spirometry procedure consists of pre EVH,
post, 5, 10, and 20 min after testing, with the lowest value at each time point used to
calculate percentage fall (Argyros et al., 1996). Other studies have used varying time
points during post EVH testing, Sue-Chu et al. (2010), tested at 3, 5, 7, 10 and 20 min
post EVH, with Rundell et al. (2004) testing at 5, 10, and 15 min.
Chapter Two – Literature Review MSc by Research
26
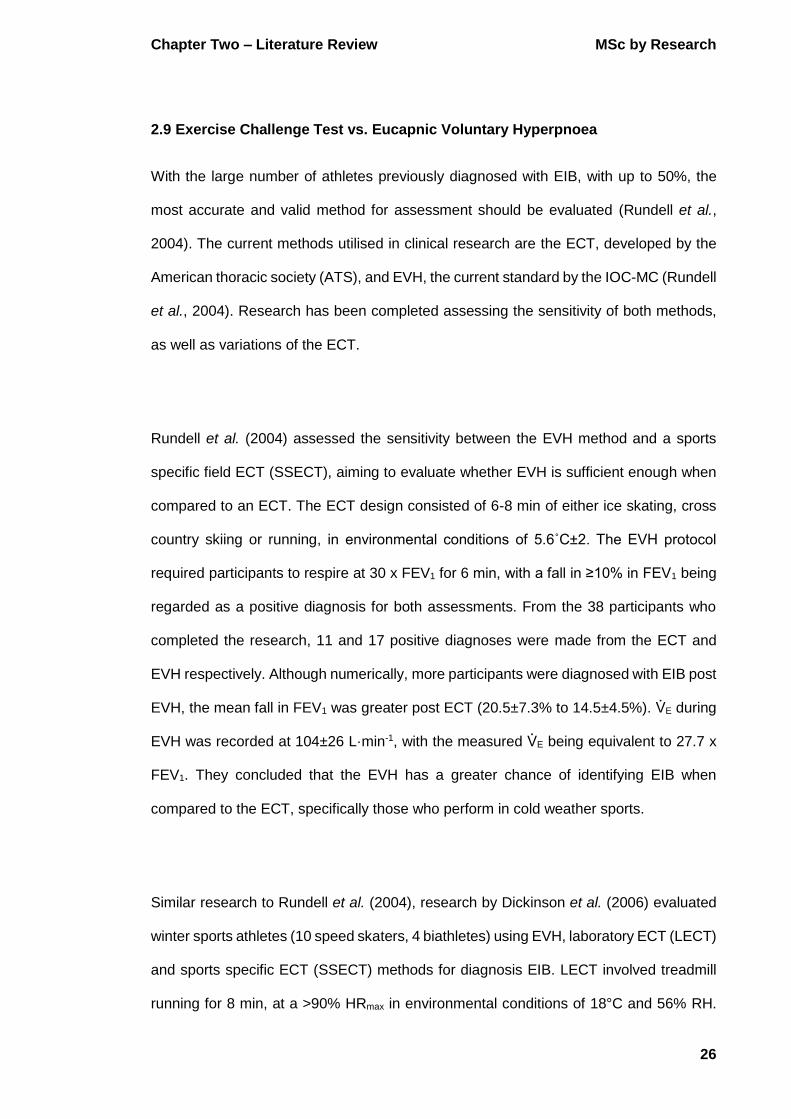
2.9 Exercise Challenge Test vs. Eucapnic Voluntary Hyperpnoea
With the large number of athletes previously diagnosed with EIB, with up to 50%, the
most accurate and valid method for assessment should be evaluated (Rundell et al.,
2004). The current methods utilised in clinical research are the ECT, developed by the
American thoracic society (ATS), and EVH, the current standard by the IOC-MC (Rundell
et al., 2004). Research has been completed assessing the sensitivity of both methods,
as well as variations of the ECT.
Rundell et al. (2004) assessed the sensitivity between the EVH method and a sports
specific field ECT (SSECT), aiming to evaluate whether EVH is sufficient enough when
compared to an ECT. The ECT design consisted of 6-8 min of either ice skating, cross
country skiing or running, in environmental conditions of 5.6˚C±2. The EVH protocol
required participants to respire at 30 x FEV1 for 6 min, with a fall in ≥10% in FEV1 being
regarded as a positive diagnosis for both assessments. From the 38 participants who
completed the research, 11 and 17 positive diagnoses were made from the ECT and
EVH respectively. Although numerically, more participants were diagnosed with EIB post
EVH, the mean fall in FEV1 was greater post ECT (20.5±7.3% to 14.5±4.5%). V̇E during
EVH was recorded at 104±26 L·min-1, with the measured V̇E being equivalent to 27.7 x
FEV1. They concluded that the EVH has a greater chance of identifying EIB when
compared to the ECT, specifically those who perform in cold weather sports.
Similar research to Rundell et al. (2004), research by Dickinson et al. (2006) evaluated
winter sports athletes (10 speed skaters, 4 biathletes) using EVH, laboratory ECT (LECT)
and sports specific ECT (SSECT) methods for diagnosis EIB. LECT involved treadmill
running for 8 min, at a >90% HRmax in environmental conditions of 18°C and 56% RH.

Chapter Two – Literature Review MSc by Research
27
SSECT required speed skaters to skate for 6 min at 11 and 12 s per 250m, with biathletes
required to complete a 20 min simulated race in 1-2°C at 31-34% RH. EVH followed
standard protocol of 30 x FEV1 for 6 min, recommended by Anderson et al. (2001). Based
on the ≥10% fall in FEV1 being regarded as positive, 10 of the 14 had a positive response
to EVH, with 3 and 0 being diagnosed from the SSECT and LECT respectively,
concluding that the EVH is the more sensitive challenge for the detection of EIB in
athletes. Although EVH has been regarded as the more sensitive by Dickinson et al.
(2006), stipulations should be made about the control of each study. EVH allows for
greater control over the two main contributors; inspired air water content and V̇E
(Dickinson et al., 2006).
Research by Castricum et al. (2010) followed the structure that Rundell et al. (2004) and
Dickinson et al. (2006) had previous used. Castricum et al. (2010) evaluated a group of
33 elite swimmers using the EVH, field swim test and LECT. Similarly to both Rundell et
al. (2004) and Dickinson et al. (2006), the EVH was the most sensitive test with 18 of the
33 subjects experiencing a positive test compared to the one for the field swim and four
for the LECT.
Although colder environmental conditions have proven significantly effect at stimulating
EIB mediators (Stensrud et al., 2007), it is not the sole factor in stimulating a positive
response. Dickinson et al. (2006) reported that even when exercise was performed in
temperatures sufficiently low enough for elicit EIB, 1°C and 8°C respectively, only 3
diagnoses were found compared to EVH, performed in 19.1°C, which diagnosed 10. The
water content of the inspired air may be a more important factor, rather than cold air
alone (Evans et al., 2005).

Chapter Two – Literature Review MSc by Research
28
The ability to control environmental conditions during an ECT, where the inspired air is
considered sufficiently dry (<10°C) (Anderson, 2011), could correct for misdiagnosis
when comparing LECT and EVH tests. No specific studies have been found where LECT
has been performed in a controlled environment following the current ATS guidelines
(ATS., 1999), and compared to an EVH assessment following IOC-MC and Anderson et
al. (2001) guidelines measuring sensitivity, although Evans et al. (2005) evaluated cold
temperature and room temperature air ECT and EVH respectively, using chilled air from
a dry gas cylinder. At approximate temperatures of 22°C and -1°C, a significant
difference was found when comparing room temperature EVH and cold temperature ECT
(-15.22% vs -10.70%), where other comparisons were non-significant.
2.10 Spirometry
Spirometry is the physiological test which measures how individuals inhale or exhale
volumes of air over a function of time, aimed at assessing respiratory health (Miller et al.,
2005). Miller et al. (2005) describes the current standardised method of spirometry,
which consists of three distinct phases; 1) maximal inspiration, 2) a rapid exhalation and
3) continuation of exhalation until test end. Prior to the initial phase, demonstration of the
appropriate technique should be performed by the technician, with descriptive
information about equipment and usage. During phase one, completion of maximum
inspiration should be performed by the subject. During phase two, subjects should be
encouraged to push or blast, rather than just blow when exhaling. A standard spirometry
assessment should be performed without hesitation, specifically delays when
transitioning from inspiration to rapid exhalation which can cause reductions in both peak
expiratory flow (PEF) and FEV1 (D'Angelo et al., 1993). Finally, phase three, where
continued encouragement is used so that the subject fully exhales. A sufficient

Chapter Two – Literature Review MSc by Research
29
assessment is achieved when three tests are completed that are free from artefact, such
as coughing, with FEV1 results no less than 0.15 L apart (ATS., 1999; Miller et al., 2005).
A positive diagnosis of EIB is primarily achieved when FEV1 has a ≥10% reduction post
provocation test when compared with a baseline measure (ATS., 1999), with severity of
the EIB symptoms being measured through the FEV1 time curve (Anderson et al., 2010).
Guidelines by the ATS. (1999) state that spirometry should be completed at baseline,
then periodically post provocation test. Guidelines state appropriate post provocation
testing should be completed at 5, 10, 15, 20, and 30 min, although earlier time points of
1 and 3 min have been found to record lowest FEV1 due to severe EIB becoming present
(Anderson et al., 1991; ATS., 1999). Research by Trumper et al. (2009) only sampled
once at 10 min post-test, due to technical reasons. Although within reported range for
greatest reduction in FEV1, it cannot be disputed that subjects may have been diagnosed
negatively, due to the cessation of EIB occurring earlier or later than the 10 min test time.
Similarly, Seear et al. (2005), completed spirometry at only 5 and 15 min post exercise,
and out of the 52 children tested, only 8 were diagnosed with EIB, which, although not
stated, could be down to the limited assessment. Wilber et al. (2000) research into the
prevalence of EIB in Olympic athletes use time points of 5, 10 and 15 min, and even
though it was not exact to the ATS guidelines, results remained similar to both Trumper
et al. (2009) and Seear et al. (2005). Although positive results may be found when one
or two time points are used post provocation test, individual variances may cause a shift
in the time where fall in FEV1 is greatest (Anderson et al., 1991), so completion of more
assessment will remove ambiguity and increase the validity within the data. Spirometry
assessments up to 30 min post exercise has been recorded as the time of lowest FEV1
(Brudno et al., 1994), and although ATS guidelines suggest recording up to 30 min, it
remains controversial as a delay of such length is infrequently seen (ATS., 1999).

Chapter Two – Literature Review MSc by Research
30
2.11 Standardisation
Although research has been completed using the ECT, EVH and comparing both
provocation tests, it has been brought into question whether the methods they had used
were valid and reliable, and following the current guidelines. A review by Stickland et al.
(2010) found that some previous research had failed to follow the current ECT guidelines,
which could have affected the overall results. Out of nine studies, only one followed the
current ATS guidelines, with deviations being; uncontrolled room temperature and
relative humidity, no nose clip, duration was too long or graded exercise was used. For
the four studies which looked to evaluate the ECT against the EVH, none of the studies
followed the ATS guidelines, so the sensitivity of the EVH relative to the ECT is unclear.
Alongside provocation method deviations, previous research has lacked adherence to
the spirometry guidelines. Current ATS/ERS methods state that spirometry should be
completed at 5,10,15,20 and 30 min post provocation test, with optional 1 and 3 min. Of
the studies found, none of them completed spirometry at all-time points, ranging from
one to three samples (Wilber et al., 2000; Rundell et al., 2004; Seear et al., 2005;
Dickinson et al., 2006; Trumper et al., 2009). Although it has been stated that peak fall
in FEV1 occurs between 5-12 min (Anderson, 2011), the physical variances between
individuals and response to provocation tests could affect the onset of EIB, causing an
under or over diagnosis.

Chapter Three - Method MSc by Research
31
CHAPTER THREE
METHOD

Chapter Three - Method MSc by Research
32
3.1 Participants
Twenty-two participants initially volunteered to participate in this study. Four participants
were unable to complete all of the trials due to injury and a fifth was removed from the
trial by the investigator due to a severe airway response to the ECT, with a FEV1 fall of
49%. The remaining seventeen participants (mean (SD) age 25.2 (5.1) yr, stature 1.81
(.06) m, mass 85.4 (13.7) kg), were either University level athletes, who competed in a
variety of British Universities & Colleges Sport (BUCS) leagues (n=10; 9 male, 1 female),
or were professional rugby league players (n=7 male). Three of the participants had a
prior history of asthma of which two were professional rugby league players. Research
was completed in accordance with the University of Gloucestershire regulations and the
Universities Ethical Committee. Prior to testing, all participants were required to complete
a health history questionnaire and a questionnaire to identify any potential
contraindications to inhaled salbutamol, and to provide informed consent. By the
recommendations of Anderson et al (2010), prior to any testing participants with a pre-
diagnosed history of asthma were asked to withhold medication (Short-acting β2-agonist
8 hr, long-acting β2-agonist 24 hr). Participants were, however, instructed to use their
medication if required and to inform the study investigator so that testing could be
rescheduled. A short-acting β2-agonist (100 mcg salbutamol) was available to
participants at all times to offer immediate relief if required. All participants completed
testing of their own free will and could stop at any point with no repercussions.
3.2 Procedures
In a repeated measures design participants visited the laboratory on two occasions. At
each visit participants first completed baseline spirometry followed by either a randomly
assigned ECT or EVH test. Immediately following the provocation test participants
performed follow-up spirometry to assess the effect of the provocation test on lung

Chapter Three - Method MSc by Research
33
function. Participants attended the laboratory in their usual exercise clothing and
footwear and were asked to maintain similar dietary habits for each visit. In addition to
withholding medication, participants were requested to avoid caffeine and strenuous
exercise for 12 hr prior to each visit (Anderson et al. 2010).
3.3 Spirometry
Spirometry was performed in accordance with ATS/ERS guidelines (Miller, Hankinson et
al. 2005) using an electronic flow measurement spirometer (Microloop, Micromedical,
Rochester, Kent, UK) connected to a PC running dedicated software (SPCS,
Micromedical, Rochester, Kent, UK). Prior to each test a verbal and visual demonstration
was provided. For each manoeuvre, a maximal forced exhalation procedure was
performed in a seated position, with the participant wearing a nose clip. Participants
began with two to three tidal breaths before fully inhaling, followed immediately with a
maximal forced exhalation with limited delay. Verbal encouragement was given during
exhalation to encourage maximal effort and to ensure exhalation was complete.
At each visit to the laboratory, and prior to each provocation test participants’ baseline
lung function was measured. Lung function was also assessed immediately post-test
and at 0, 3, 5, 10, 15, 20 and 30 min. At baseline a minimum of three acceptable FVC
manoeuvres (maximum of 8) were performed. On completion of three acceptable tests
the results were assessed for reproducibility. Specifically, if the difference between the
highest and next highest FEV1 and FVC was ≤ 0.15 L. The largest FVC and FEV1 were
selected from all the useable tests with other indices such as PEF and FEV1/FVC,
derived from the test with the largest sum of FVC and FEV1. For the post provocation
tests, spirometry was performed in duplicate with each test approximately 30 s apart,
with the best test being used to assess fall in FEV1

Chapter Three - Method MSc by Research
34
3.4 Exercise Challenge Test
The ECT protocol followed current ATS guidelines. Each test was performed on a
motorised treadmill (ELG 55, Woodway, Gmbh, Weil am Rhein, Germany) within an
environmental chamber (9388 Athlete Training Room, Sanyo Gallenkamp PLC,
Loughborough, UK) at an ambient temperature of 8 ˚C. This temperature assumed that
the water content of the inspired air was < 10 mg·L-1. Temperature and humidity was
continuously monitored by a temperature and humidity probe (RHT-G-Z5-0, Grant
Instruments, Cambridge, UK), which sampled from the centre of the chamber and was
interfaced to a Squirrel SQ2020 data logger (Grant Instruments, Cambridge, UK).
The protocol design was chosen to produce 4-6 min of high-intensity exercise with a total
duration of 6-8 min (ATS., 1999). Over the first 2 min the treadmill speed and gradient
were rapidly increased until the target HR was achieved. Once target HR had been
reached the participants completed 4-6 min of continuous exercise, with treadmill speed
and gradient adjusted to maintain target HR. HR was recorded via chest heart rate
monitor (RCX5, Polar Electro Oy, Kempele, Finland) recording data every 5 s and
monitored throughout to ensure HR was within the target zone.
3.5 Eucapnic Voluntary Hyperpnoea
The EVH test was conducted following the recommendations of the IOC-MC (Anderson,
Argyros, Magnussen & Holzer, 2001). All tests were performed using the EucapSys™
EVH system (SMTEC SA, Nyon, Switzerland). Participants inhaled a medical grade dry
gas mixture of 5% CO2 and 21% O2 via a face mask connected to the EVH system via
flexible tubing. Participants were instructed to hyperventilate at a rate equivalent to 30
times baseline FEV1 for 6 min (Anderson, Argyros et al. 2001). Throughout the test,

Chapter Three - Method MSc by Research
35
visual and verbal feedback was provided to encourage the participant to maintain V̇E at
the target rate.
3.6 Treatment of Data
Raw spirometry and HR data was exported into Excel. At each time point FEV1, FVC,
PEF and FEV1/FVC were recorded into individual spreadsheets. Predicated values for
target HR and target ventilation were calculated in Excel. For the ECT, target HR was
calculated via (220 - Age in yr) x 0.85. The target ventilation needed for the EVH was
calculated prior via (Baseline FEV1 x 30). For diagnosis of EIB, a fall in FEV1 of ≥10%
from baseline must be observed, calculated via:
3.7 Statistical Analysis
Descriptive data are reported as means and standard deviation (Mean (SD)). Statistical
analysis was completed on SPSS (version 22, IBM, Armock: NY, United States) with an
α value of p<0.05. Data was analysed for normality and found to be normally distributed.
A series of individual paired samples t-tests were performed to compare baseline FEV1,
FVC, PEF and FEV1/FVC for both positive and negative results. A series of individual
paired samples t-tests were performed to compare predicted FEV1, FVC, PEF and
FEV1/FVC for both positive and negative results. A paired samples t-test was performed
comparing target HR achieved during the ECT for positive and negative results. A paired
samples t-test was performed comparing target V̇e achieved during the EVH for positive
and negative results. A series Individual paired samples t-test were performed to
compare the peak delta (Δ) in FEV1peak, FVCpeak PEFpeak, and FEV1/FVCpeak during the
ECT and EVH. A series of repeated measures 2-way analysis of variance (ANOVA) were
(FEV1post – FEV1baseline)
FEV1baseline
X 100

Chapter Three - Method MSc by Research
36
performed to determine whether differences were present at each post provocation time-
point between percentage Δ in FEV1, FVC, PEF, and FEV1/FVC for both the ECT and
EVH tests. If a significant difference was present, follow up Bonferroni paired samples t-
tests were performed to determine whether differences were present at each post
provocation time-point (0, 3, 5, 10, 15, 20, and 30) for the ECT and EVH. A Bland and
Altman plot was produced to evaluate limits of agreement between the lowest %ΔFEV1.

Chapter Four - Results MSc by Research
37
CHAPTER FOUR
RESULTS

Chapter Four - Results MSc by Research
38
4.1 Summary
All seventeen participants completed both of the provocation tests. As seen in Table 1,
nine had a positive response (those highlighted) to at least one of the challenges based
with a fall in FEV1 ≥10%. Out of those, five experienced a ≥10% fall in both the ECT and
EVH, with two during the ECT and two during the EVH alone. For the following analysis
all seventeen participants were included unless otherwise stated.
Table 1: Participant response to provocation testing
Participant Baseline FEV1 (L) Predicted FEV1 (%) ECT ΔFEV1 (%) EVH ΔFEV1 (%)
1 4.36 103 -5 1
2 5.02 111 -10 -8
3† 3.83 83 -9 -7
4* 3.67 100 -13 -26
5†* 5.00 98 -4 -4
6 4.53 101 -1 -4
7† 4.81 103 1 -7
8 4.45 111 -11 -7
9 4.34 110 -7 -10
10†* 4.13 92 -16 -28
11 4.57 94 -29 -26
12† 4.76 102 -4 -8
13† 5.32 104 -23 -23
14 4.52 103 -5 -14
15† 5.07 103 -2 -2
16 3.94 90 2 -6
17 5.20 121 -16 -11
Mean (SD) 4.56 (0.48) 102 (8.96) -8.99 (8.35) -11.19 (9.11)
* Past history of Asthma. † Professional Rugby League Players Participants with positive responses for EIB are highlighted in bold and greyed. ΔFEV1 values rounded to nearest whole number Baseline FEV1 taken from second visit.
4.2 Baseline Lung Function
All participants had a baseline FEV1 that was >75% of the predicted value and an
FEV1/FVC >70%. Consequently, all participants were considered to be free of an airway
obstruction at rest and suitable for testing. Actual and predicted values for FEV1, FVC,

Chapter Four - Results MSc by Research
39
PEF and FEV1/FVC and FEF25-75%, were not significantly different between EIB positive
and EIB negative participants. There was a significant difference in percent predicted
FVC between EIB positive and negative participants (p=0.048) but no differences in any
of the other percent predicted parameters.
4.3 Achievement of Target Heart Rate during the Exercise Challenge Test
There was no significant difference in percentage of target HR achieved during the
exercise challenge test between the ECT positive and negative participants (102 ± 2%
vs 100 ± 2%; p=0.20). The HR that was achieved by all participants during the ECT
ranged from 96 to 104% of the target HR (Figure 1).
Figure 1: Percentage of target HR achieved against peak fall in FEV1
4.4 Achievement of Target Ventilation during the Eucapnic Voluntary Hyperpnoea
There was no significant difference in the percentage of target V̇E achieved during EVH
between EVH positive and negative participants (91 ± 4.8% vs 87.6 ± 72%; p=0.29). The
percentage of target MVV achieved during the EVH ranged from 79 to 99%. All
-35
-30
-25
-20
-15
-10
-5
0
5
94% 96% 98% 100% 102% 104% 106%
Maxim
um
ch
an
ge i
n F
EV
1fr
om
b
aselin
e (
%)
Percentage of mean target heart rate achieved during the ECT challenge

Chapter Four - Results MSc by Research
40
participants achieved a level of V̇E greater than 21 times FEV1 (range 23.6 – 29.4 x
FEV1), which is considered to be the minimum rate for a test to be considered valid
(Brummel et al., 2009). Due to missing data on mean ventilation, three participants were
not represented in Figure 2.
Figure 2: Percentage of target V̇E achieved against peak fall in FEV1
4.5 Effect of Provocation Test on the Airway Response: ECT and EVH
There were no significant differences between the provocation tests for ΔFEV1peak
(p=0.143, MD = 2.20, 95% CI 0.83 - 5.22, ΔFVCpeak (p=0.291, MD = -1.14, 95% CI 3.34
- 1.07), or ΔPEFpeak (p=0.300, MD = 2.14, 95% CI -2.09 - 6.36). However, ΔFEV1/FVCpeak
was significantly lower in the EVH compared to the ECT (p=0.018, MD = 5.04, 95% CI
0.97 - 9.11) (Table 2).
-35
-30
-25
-20
-15
-10
-5
0
70% 75% 80% 85% 90% 95% 100% 105% 110%
Maxim
um
ch
an
ge i
n F
EV
1fr
om
b
aselin
e (
%)
Percent of mean target ventilation achieved during the EVH challenge

Chapter Four - Results MSc by Research
41
Table 2: Mean (SD) for paired samples t-tests for peak fall in: ΔFEV1, ΔFVC, ΔPEF, and
ΔFEV1/FVC.
ΔFEV1peak (%) ΔFVCpeak (%) ΔPEFpeak (%) ΔFEV1/FVCpeak (%)*
ECT EVH ECT EVH ECT EVH ECT EVH
-8.99 -11.19 -3.98 -2.85 -8.72 -10.86 -3.62 -8.66
(8.35) (9.11) ±(5.09) ±(3.43) (9.05) (9.62) (5.58) (8.18)
* Significant difference (p≤0.005) between ECT and EVH Mean and standard deviation as; M (SD)
4.6 Effect of Provocation Test on the Airway Response: Positive and Negative
A series of paired samples t-tests were conducted to determine whether was were
significant differences between the positive and negative results for both the ECT and
EVH for the dependent variables: ΔFEV1peak, ΔFVCpeak, ΔPEFpeak and ΔFEV1/FVCpeak
(table 3). Significant differences occurred between the positive and negative results for
both the ECT and EVH for ΔFEV1peak (ECT p≤0.001 and EVH p≤0.001), ΔFVCpeak (ECT
p≤0.001 and EVH p=0.05) and ΔFEV1/FVCpeak (ECT p=0.01 and EVH p=0.02). For
ΔPEFpeak, significant difference occurred within EVH (p≤0.001) but not for ECT (p=0.27).
Table 3: Mean (SD) for the paired samples t-tests in positive and negative results peak fall in
ΔFEV1, ΔFVC, ΔPEF, and ΔFEV1/FVC.
n ΔFEV1peak (%)*˟ ΔFVCpeak (%)*˟ ΔFEV1/FVCpeak (%)*˟ ΔPEFpeak (%)˟
ECT + 7 -16.81 (6.85) -8.03 (3.88) -15.14 (9.59) -5.47 (8.23)
- 10 -3.52 (3.44) -1.16 (3.80) -4.23 (5.45) -2.32 (2.40)
EVH + 7 -19.78 (7.93) -4.76 (3.90) -16.96 (9.06) -15.65 (8.46)
- 10 -5.17 (2.79) -1.51 (2.45) -6.59 (7.78) -3.77 (2.60)
*Significant difference between positive and negative means for ECT.
˟ Significant difference between positive and negative means for EVH.
Mean and standard deviation as; M (SD)

Chapter Four - Results MSc by Research
42
4.7 Post Provocation Lung Function
As seen in Table 4, a series of two-way repeated measures ANOVAs were used to
determine possible differences for the main effects (provocation test and time) as well
as the interaction (provocation test by time) for the dependent variables ΔFEV1, ΔFVC,
ΔPEF and ΔFEV1/FVC across the seven post provocation test time-points (Post 0, Post
3, Post 5, Post 10, Post 15, Post 20, Post 30).

Chapter Four - Results MSc by Research
43
Table 4: Mean (SD) for ΔFEV1, ΔFVC, ΔPEF and ΔFEV1/FVC over the seven post provocation
test time points for positive and negative groups.
ΔFEV1*˟ Post 0 Post 3 Post 5 Post 10 Post 15 Post 20 Post 30
ECT
+ -7.32 -11.79 -11.28 -11.10 -8.10 -7.73 -7.25
(6.70) (7.62) (6.99) (7.47) (5.86) (6.83) (5.91)
- -0.57 -1.67 -2.16 -1.98 -1.11 -0.75 -0.91
(2.05) (3.37) (3.78) (3.59) (3.52) (3.30) (2.42)
EVH
+ -10.43 -15.64 -13.39 -10.95 -7.14 -7.72 -6.23
(8.95) (9.27) (8.98) (7.57) (11.50) (5.05) (2.95)
- -1.73 -3.97 -3.35 -0.12 -1.70 -1.60 -1.37
(2.83) (3.51) (2.70) (6.83) (2.75) (2.96) (2.49)
ΔFVC Post 0 Post 3 Post 5 Post 10 Post 15 Post 20 Post 30
ECT
+ -4.86 -3.57 -3.99 -3.07 -1.94 -2.46 -1.75
(3.93) (3.52) (5.17) (3.83) (3.80) (3.32) (5.02)
- -1.10 0.66 0.33 -0.55 0.27 0.28 -0.02
(3.91) (3.81) (3.59) (4.36) (4.02) (4.04) (3.71)
EVH
+ -2.20 -3.48 -2.65 -1.86 -1.28 -1.18 -0.59
(1.73) (2.90) (2.38) (2.75) (3.73) (2.68) (4.17)
- 0.42 -0.37 -0.75 -0.64 0.08 0.30 -0.45
(1.99) (2.58) (2.44) (2.41) (3.37) (3.62) (2.36)
ΔPEF Post 0 Post 3 Post 5 Post 10 Post 15 Post 20 Post 30
ECT
+ -7.00 -9.97 -9.34 -11.54 -10.36 -10.44 -8.85
(9.88) (10.78) (9.80) (7.28) (7.22) (7.06) (7.75)
- -3.45 -4.74 -2.35 -2.90 -4.34 -2.94 -3.17
(4.38) (4.82) (6.26) (7.14) (5.92) (4.53) (5.26)
EVH
+ -9.59 -11.27 -11.21 -11.19 -14.08 -9.01 -6.46
(10.71) (8.92) (10.65) (7.81) (8.59) (8.50) (8.14)
- -5.99 -4.49 -3.90 -6.31 -4.47 -4.54 -3.15
(6.76) (5.03) (5.72) (7.06) (4.77) (4.92) (7.30)
ΔFEV1/FVC*˟ Post 0 Post 3 Post 5 Post 10 Post 15 Post 20 Post 30
ECT
+ -3.99 -5.36 -7.61 -8.25 -6.17 -5.21 -5.52
(7.00) (6.72) (5.47) (6.30) (5.37) (6.13) (3.72)
- 1.18 -2.14 -2.15 -1.05 -0.95 -0.75 -0.41
(3.37) (1.83) (2.51) (2.34) (2.07) (2.48) (2.84)
EVH
+ -8.60 -12.68 -10.98 -9.22 -8.21 -6.70 -5.52
(8.46) (8.77) (8.24) (7.67) (6.49) (6.16) (3.48)
- -2.12 -3.78 -2.60 -2.42 -1.65 -1.96 -0.91
(3.56) (2.84) (2.02) (2.71) (2.57) (2.66) (2.88) * Significant interaction between the two provocation tests.
˟ Significant main effect for time.

Chapter Four - Results MSc by Research
44
4.7.1 ΔFEV1
The two-way repeated measures ANOVA for the dependent variable ΔFEV1 revealed a
significant interaction between the two provocation tests (F(6,90)=2.261, p=0.044). Follow
up post-hoc Bonferroni paired samples t-tests revealed no significant differences
between the ECT and EVH at any of the seven time-points. A non-significant main effect
was found for the provocation tests (F(1,15)=0.139, p=0.715), however there was a
significant main effect for time (F(6,90)=5.167, p≤0.001). For the ECT test, follow up post-
hoc one-way repeated measures ANOVA revealed a significant difference over time
(F(6,90)=3.629, p=0.003), with follow up Bonferroni tests showing no significant differences
between all time-points. For the EVH test, a significant difference over time was found
(F(6,90)=4.537, p≤0.001), with follow up Bonferroni revealing that post 0 min was
significantly higher than post 3 min (MD=3.768, 95% CI=0.13-7.40) and post 3 min was
significantly lower than post 20 min (MD=5.182, 95% CI=10.18-0.19).
4.7.2 ΔFVC
The two-way repeated measures ANOVA for the dependent variable ΔFVC revealed a
non-significant interaction between the two provocation tests over time (F(6,90)=1.301,
p=0.265). A non-significant main effect was found for the provocation tests (F(1,15)=0.323,
p=0.578) as well as the main effect for time (F(6,90)=1.874, p=0.094).
4.7.3 ΔPEF
A two-way repeated measures ANOVA for the dependent variable ΔPEF revealed a non-
significant interaction between the two provocation tests over time (F(6,90)=0.706,
p=0.646). A non-significant main effect was found for the provocation tests (F(1,15)=0.232,
p=0.637) as well as the main effect for time (F(6,90)=1.732, p=0.123).

Chapter Four - Results MSc by Research
45
4.7.4 ΔFEV1/FVC
A two-way repeated measures ANOVA for the dependent variable ΔFEV1/FVC revealed
a significant interaction between the two provocation tests over time (F(6,90)=2.911,
p=0.012). Follow up post-hoc Bonferroni paired samples t-tests revealed that the EVH
test was significantly lower than the ECT at time-points 0 min (p=0.022, MD = 4.00, 95%
CI 0.68 - 7.32) and 3 min (p=0.017, MD = 4.64, 95% CI 0.94 - 8.34). A non-significant
main effect was found for the provocation tests (F(1,15)=2.598, p=0.128), however there
was a significant main effect for time (F(6,90)=4.666, p≤0.001). For the ECT test, a follow
up post-hoc one-way repeated measures ANOVA revealed a non-significant difference
over time (F(6,90)=1.969, p=0.078). For the EVH, a significant difference over time was
found (F(6,90)=7.900, p≤0.001), with follow up Bonferroni revealing that post 0 min was
significantly higher than post 3 min (MD=2.874, 95% CI=0.034-5.74) and that post 3 min
was significantly lower than both post 15 min (MD = -3.167, 95% CI 6.05 - 0.29) and post
20 min (MD = -3.701, 95% CI 7.19 - 0.22).

Chapter Four - Results MSc by Research
46
4.8 Agreement between ECT and EVH
Figure 3: Correlation between peak fall in FEV1 during the ECT and EVH.
As expected a strong positive correlation (R=0.78) was found between the ΔFEV1
responses to ECT and EVH. The line of identity provides an indication to the degree of
spread amongst the data points, which would all lie along the line if agreement was
perfect (figure 3).
-35%
-30%
-25%
-20%
-15%
-10%
-5%
0%
5%
-35%-30%-25%-20%-15%-10%-5%0%5%
EV
H Δ
FE
V1 (
%)
ECT ΔFEV1 (%)

Chapter Four - Results MSc by Research
47
Figure 4: Bland and Altman plot for the mean scores and difference in peak for FEV1
between the ECT and EVH.
The mean difference is 2.2% indicating that ECT tended to give a ΔFEV1 reading
between 0.8% lower and 5% higher than EVH. The upper and lower limits of agreement
(13.7 and -9.3% respectively) were large indicating that the ECT may result in a ΔFEV1
between 13.7% higher and 9.3% lower than EVH. Furthermore, the confidence intervals
for the upper and lower limit of agreement (8.5 to 18.6% and -14.5 to -4.4% respectively)
are wide also indicating poor agreement (figure 4).
-15%
-10%
-5%
0%
5%
10%
15%
-30%-25%-20%-15%-10%-5%0%
Dif
fere
nce i
n Δ
FE
V1p
eak
sco
res
(L·s
-1)
Fo
r E
CT
an
d E
VH
Mean Scores for ΔFEV1 (%) between ECT and EVH

Chapter Five - Discussion MSc by Research
48
CHAPTER FIVE
DISCUSSION

Chapter Five - Discussion MSc by Research
49
5.1 Key Findings
The main findings of our study found that out of seventeen participants who completed
both provocation tests, nine experienced a ≥10% fall in FEV1. Five experienced a fall of
≥10% in both the ECT and EVH, with two in the ECT or EVH alone. Out of the nine, only
two had a previous history of asthma, with our screening identifying seven who had no
previous respiratory issues. Our study suggests that athletes need to be tested for EIB,
regardless if a history of asthma is present or not. Our results, although varied from
previous research, may be inconclusive due to limitations (Dickinson et al., 2006;
Trumper et al., 2009; Castricum et al., 2010).
5.2 Literature Comparison
The object of the present study was to follow the recommendations of Stickland et al.
(2010), which called for the need to standardise the methods employed during the
screening process within research, specifically with the control of inspired air water
content, spirometry and intensity. The methods used during the study followed that of
the current ATS guidelines for ECT and current methods for the EVH (ATS., 1999;
Anderson et al., 2001). Above the guidelines, ECT testing was performed within an
environmental chamber to control air temperature to reduce air water content, and
spirometry was completed with increased post provocation test sampling times.
Our research found that there was no significant difference between the ECT and EVH
when performing them following the standardised guidelines. Out of the seventeen
participants who completed both provocation tests, nine experienced a fall of ≥10% in
FEV1. Five of those had ≥10% falls in both the ECT and EVH, with two in the ECT and
EVH alone. Our results showed that, if performed using current guidelines, both the ECT

Chapter Five - Discussion MSc by Research
50
and EVH are sufficient tests for inducing the EIB response in athletes. The results of this
study go against previous research (Rundell et al., 2004; Dickinson et al., 2006; Trumper
et al., 2009), which has stated that the EVH was conclusively the more sensitive test
when compared to the ECT (Rundell et al., 2004; Dickinson et al., 2006; Castricum et
al., 2010).
Trumper et al. (2009) research suggested that the ECT was not sufficient for the
assessment of EIB. This is due to the predicted HR formula used for the target exercise
intensity does not put the body in a state of anaerobic exercise for exercise bronchial
provocation. This variance, specifically in the athletic population, could be due to physical
fitness or participants sporting event. When comparing the two methods, Dickinson et al.
(2006) found a greater number of positive EIB assessments during the EVH, stating that
this is due to the greater amount of control compared to the ECT. Although we used the
predicted HR formula to follow the current ATS guidelines, we focused control of the ECT
by controlling the inspired air temperature to reduce the inspired water content. The aim
of our research was to assess EIB via ECT and EVH protocols following the standardised
methods.
5.3 Pathological Interpretation
The variations from previous research would coincide with the review of Stickland et al.
(2010) with the lack of adherence to the current guidelines causing a possible under or
over estimation of the results. As stated, the key areas which previous research had
failed to control was the inspired air water content, exercise intensity and spirometry.
Environmental conditions during the ECT may be the contributing factor when comparing
the difference in results. Dickinson et al. (2006) stated that the key factors for the EVH

Chapter Five - Discussion MSc by Research
51
tests superiority was the level of control over the inspired air water content and V̇E.
Ensuring that the inspired air is sufficiently dry would stimulate the osmotic hypothesis
for the mechanisms of EIB, causing water to move from nearby cells to condition the
inspired air (Anderson & Daviskas, 1997). From our results, increasing control over
inspired air water content can be completed by performing the ECT in an environmental
chamber set at 8˚C. When comparing our results to Dickinson et al. (2006) and
Castricum et al. (2010), who performed the ECT in 18˚C, 46% RH and 21˚C, 60.5 RH
respectively, our results suggest that completing the ECT in 8˚C creates an environment
with sufficiently low air water content to stimulate the osmotic mechanisms of EIB. The
movement from 8˚C during the ECT to 20˚C during post spirometry may have assisted
in the rewarming of the airway, aiding to the fall in FEV1. The range in temperature if not
as large as those where rapid rewarming occurs (McFadden et al., 1986), suggesting
that it was unlikely that any thermal mechanisms affected the fall in FEV1. Consideration
must be made into the accessibility of environmental chambers or systems which can
control environmental conditions such as temperature and air water content. Although
controlling temperature and air water content has a direct effect on the stimulation of EIB,
more research would have to be done to fully ensure that controlling temperature and
water content should be standard in testing.
Control of V̇E was also a key factor for the superiority of the EVH (Dickinson et al., 2006).
During the ECT, target HR ranged between 96 to 104% 85% HRmax, with EVH target V̇E
ranged between 79 to 99% 80% MVV. From our data, the ECT had much greater control
of target HR compared to target ventilation for EVH. The lack of control comes down to
the EVH being a voluntary action compared to a treadmill protocol. Although all the
participants achieved a level of ventilation over the minimum rate of 21 times FEV1
(Brummel et al., 2009), the failure of participants achieving the target 30 times FEV1 may
have caused an under diagnosis in the EVH results. Although target HR during the ECT
was controlled, it does not take into account the V̇E during testing. Research by Trumper

Chapter Five - Discussion MSc by Research
52
et al. (2009) cast doubt on the HR based protocol for the ECT. Trumper et al. (2009)
concluded that using a percent predicted HR ECT does not allow for the physical
variances seen within the athletic population. Although the ATS state that 80 to 90%
HRmax protocol is sufficient to induce 40 to 60% MVV, physical variances may affect
these ratios.
Spirometry remains a key part of the screening process, and an area in which previous
research has failed to follow current guidelines (Stickland et al., 2010). Our results found
that peak falls in FEV1 ranged throughout the sample times emphasising the need to
sample regularly. Slightly askew from the current guidelines, the most peak falls post
EVH occurred after 3 min, which is currently an optional time point suggested by the ATS
(ATS., 1999).
5.4 Clinical Interpretation
With the high prevalence of EIB in the athletic population, it still remains important to
screen even those who have no previous history of asthma. Out of the seventeen
participants screened, 53% achieved a fall in FEV1 ≥10%. Our results suggest that both
the ECT and EVH are sensitive enough tests for stimulating the EIB response, as long
as both are performed under the right conditions.
Trumper et al. (2009) suggests that determining an individual’s aerobic capacity should
be achieved prior to the ECT. Completing this would add an extra step to the current
simple screening process, but would create a more accurate ECT as pre-determined
exercise intensity would already be known. From our data, this step would not be
required for general screening, but for elite athletes, it may provide more accuracy during
the screening process.

Chapter Five - Discussion MSc by Research
53
5.5 Strengths, Limitations and Future Research
The key strength of this research was the testing standards. As suggested by Stickland
et al. (2010), a key criticism of previous research was the need to standardise the
methods when screening athletes. In this study, all tests were performed to a high
standard following the current ATS guidelines for the ECT and the guidelines for EVH
(ATS., 1999). Previous research also failed to follow the standards for spirometry (Wilber
et al., 2000; Rundell et al., 2004; Dickinson et al., 2006; Trumper et al., 2009). This study
address this by completing the standard model with two extra sample times at 0 and 3
min post provocation test. During EVH tests, 10 out of the 17 participants experienced
their peak fall in FEV1 at 3 min post, implying the need to perform spirometry earlier than
the recommended 5 min post.
Our research had some limiting factors. The main factor was the participant number.
During the study, participant recruitment was restricted by the number of University level
athletes interested in the study. A larger sample size would be more create a greater
image of the current condition of EIB in University level athletes, but also strengthen the
data analysis. A larger sample may find a different result compared to our research.
Future research following the practice employed in this study should look to increase the
sample size to strengthen the data. Although our data was sufficient, a greater number
of participants would allow for a more accurate analysis. Measuring the air water content
during the ECT would give a definitive answer to determine whether the environmental
conditions matched that seen in the EVH. Although RH can be controlled using an
environmental chamber, literature states a temperature of <10˚C is sufficiently dry
(Anderson, 2011). Finally, due to software issue we were unable to get the forced

Chapter Five - Discussion MSc by Research
54
expiratory flow (FEF25-75) values during spirometry. Although not a direct measure of EIB,
more respiratory values would have added to the data sets. Overall, the areas for future
research should not have caused false readings within our results.
Although the results of our study are different to those found in previous research, some
limitations must be considered. The conditions that the ECT was performed in were
specifically designed to stimulate the EIB response, rather than related to a sports
specific format. The ability to control air temperature

Chapter Six - Conclusion MSc by Research
55
CHAPTER SIX
CONCLUSION
Chapter Six - Conclusion MSc by Research
56
In summation, the current study aimed to determine whether there was a significant
difference between the ECT and EVH when testing athletes following current guidelines.
Out of the 17 participants who completed both tests, nine experienced a fall ≥10%,
suggesting the presence of EIB. When comparing peak falls in FEV1 achieved during the
ECT and EVH, there was no significant difference, which suggests that both methods
can be used when testing athletes for EIB. However, our Bland and Altman plot revealed
poor agreement, meaning limitation of our study may mean our results are more
inconclusive.
Future research needs to develop on from the model used within this study by increase
the size of the participants tested to strengthen the data set. Although we found a
significant difference between the ECT and EVH for ΔFEV1 across the post-test
spirometry, a larger sample size may provide a clearer answer to the research aims.
Data collection of V̇e during the ECT may also provide an added perspective on the
ventilation achieved compared to the target HR, as it does not allow for physical
variances which may occur in high level athletes. Pre testing for HR would add an
addition step but also give an accurate target HR for the ECT.
The aim of the study was to compare the ECT and EVH when following current
guidelines. From our results, we cannot conclude whether the ECT or EVH is a more
superior test. Although we found a significant difference between the ECT and EVH for
FEV1 across the post-test spirometry, peak FEV1 had no significant difference, and with
poor agreement, our results remain inconclusive due to limitations of the study.

Chapter Seven - References MSc by Research
57
REFERENCES
Anderson S. (2011). Bronchial Challenge Tests: Usefulness, Availability and
Limitations. Breathe 8, 53-60.
Anderson S. (2012). The Prevention of Exercise-Induced Bronchoconstriction: What
Are The Options? Expert review of respiratory medicine 6, 355-357.
Anderson S, Argyros G, Magnussen H & Holzer K. (2001). Provocation by Eucapnic
Voluntary Hyperpnoea to Identify Exercise Induced Bronchoconstriction. British
journal of sports medicine 35, 344-347.
Anderson S & Daviskas E. (1997). Pathophysiology of Exercise-Induced asthma: role
of respiratory water loss. In Allergic and Respiratory Disease in Sports
Medicine, ed. Weiler J, pp. 87-114. Marcel Dekker, New York.
Anderson S & Daviskas E. (2000). The Mechanism of Exercise-Induced Asthma Is ….
Journal of Allergy and Clinical Immunology 106, 453-459.
Anderson S & Holzer K. (2000). Exercise-Induced Asthma: Is It The Right Diagnosis In
Elite Athletes? The Journal of allergy and clinical immunology 106, 419-428.
Anderson S & Kippelen P. (2012). Assessment and Prevention of Exercise-Induced
Bronchoconstriction. British journal of sports medicine 46, 391-396.
Anderson S, Pearlman D, Rundell K, Perry C, Boushey H, Sorkness C, Nichols S &
Weiler J. (2010). Reproducibility of the Airway Response to an Exercise
Protocol Standardized for Intensity, Duration, and Inspired Air Conditions, in
Subjects with Symptoms Suggestive of Asthma. Respiratory research 11, 120.
Anderson S, Rodwell L, Du Toit J & Young I. (1991). Duration of Protection by Inhaled
Salmeterol in Exercise-Induced Asthma. CHEST Journal 100, 1254-1260.

Chapter Seven - References MSc by Research
58
Argyros G, Roach J, Hurwitz K, Eliasson A & Phillips Y. (1995). The Refractory Period
After Eucapnic Voluntary Hyperventilation Challenge and its Effect on
Challenge Technique. CHEST Journal 108, 419-424.
Argyros G, Roach J, Hurwitz K, Eliasson A & Phillips Y. (1996). Eucapnic Voluntary
Hyperventilation as a Bronchoprovocation Technique Development of a
Standardized Dosing Schedule in Asthmatics. CHEST Journal 109, 1520-1524.
ATS. (1999). Guidelines for Methacholine and Exercise Challenge Testing. American
Journal of Respiration and Critical Care Medicine 161, 309-329.
Balzano G, Fuschillo S, Melillo G & Bonini S. (2001). Asthma and Sex Hormones.
Allergy 56, 13-20.
Barrios R, Kheradmand F, Batts L & Corry D. (2006). Asthma: Pathology and
Pathophysiology. Archives of Pathology and Laboratory Medicine 130, 447-451.
Brudno D, Wagner J & Rupp N. (1994). Length of Postexercise Assessment in the
Determination of Exercise-Induced Bronchospasm. Annals of Allergy, Asthma &
Immunology 73, 227-231.
Brummel N, Mastronarde J, Rittinger D, Philips G & Parsons J. (2009). The Clinical
Utility of Eucapnic Voluntary Hyperventilation Testing for the Diagnosis of
Exercise-Induced Bronchospasm. Journal of Asthma 46, 683-686.
Cabral A, Conceicao G, Fonseca-Guedes C & Martins M. (1999). Exercise-Induced
Bronchospasm in Children: Effects of Asthma Severity. American journal of
respiratory and critical care medicine 159, 1819-1823.
Carlsen KH, Anderson SD, Bjermer L, Bonini S, Brusasco V, Canonica W, Cummiskey
J, Delgado L, Del Giacco SR, Drobnic F, Haahtela T, Larsson K, Palange P,
Popov T & van Cauwenberge P. (2008). Exercise-induced asthma, respiratory
and allergic disorders in elite athletes: epidemiology, mechanisms and

Chapter Seven - References MSc by Research
59
diagnosis: part I of the report from the Joint Task Force of the European
Respiratory Society (ERS) and the European Academy of Allergy and Clinical
Immunology (EAACI) in cooperation with GA2LEN. Allergy 63, 387-403.
Castricum A, Holzer K, Brukner P & Irving L. (2010). The Role of the Bronchial
Provocation Challenge Tests in the Diagnosis of Exercise-Induced
Bronchoconstriction in Elite Swimmers. British journal of sports medicine 44,
736-740.
Curran J, Osmond M, Fitzpatrick E, Newton A, Sinclair D, Zee R & Johnson D. (2010).
Interventions to Improve Management and Health Outcomes for Children and
Adults with Asthma Who Present to the Emergency Department (Protocol).
Cochrane database of systematic reviews, 1-8.
D'Angelo E, Prandi E & Milic-Emili J. (1993). Dependence of Maximal Flow-Volume
Curves on Time Course of Preceding Inspiration. Journal of applied physiology
75, 1155-1159.
Dickinson J, Whyte G, McConnell A & Harries M. (2006). Screening Elite Winter
Athletes for Exercise Induced Asthma: A Comparison of Three Challenge
Methods. British journal of sports medicine 40, 179-182.
Dryden D, Spooner C, Stickland M, Vandermeer B, Tjosvold L, Bialy L, Wong K &
Rowe B. (2010). Exercise-Induced Bronchoconstriction and Asthma. Evidence
Report Technology Assessment 189, 1-154.
Evans T, Rundell K, Beck K, Levine A & Baumann J. (2005). Cold Air Inhalation Does
Not Affect the Severity of EIB After Exercise or Eucapnic Voluntary
Hyperventilation. Medicine & Science in Sports & Exercise 37, 544-549.
Falvey E, McCarthy C, O'Connor T, Shanahan F, Molloy M & Plant B. (2010). Exercise-
Induced Bronchoconstriction and Exercise Testing in an International Rugby
Union Team. Thorax 65, 843-844.

Chapter Seven - References MSc by Research
60
Hallstrand T, Debley J, Farin F & Henderson W. (2007). Role of MUC5AC in the
Pathogenesis of Exercise-Induced Bronchoconstriction. The Journal of allergy
and clinical immunology 119, 1092-1098.
Haverkamp H, Dempsey J, Miller J, Romer L, Pegelow D, Lovering A & Eldridge M.
(2005). Repeat Exercise Normalizes the Gas-Exchange Impairment Induced by
a Previous Exercise Bout in Asthmatic Subjects. Journal of applied physiology
99, 1843-1852.
Helenius I, Tikkanen H & Haahtela T. (1997). Association Between Type of Training
and Risk of Asthma in Elite Athletes. Thorax 52, 157-160.
Holzer K, Anderson S & Douglass J. (2002). Exercise in Elite Summer Athletes:
Challenges for Diagnosis. Journal of Allergy and Clinical Immunology 110, 374-
380.
Holzer K & Brukner P. (2004). Screening of Athletes for Exercise-Induced
Bronchoconstriction. Clinical Journal of Sport Medicine 14, 134-138.
Knopfli B, Luke-Zeitoun M, von Duvillard S, Burki A, Bachlechner C & Keller H. (2007).
High Incidence of Exercise-Induced Bronchoconstriction in Triathletes of the
Swiss National Team. British journal of sports medicine 41, 486-491.
Kudo M, Ishigatsubo Y & Aoki I. (2013). Pathology of Asthma. Frontiers in microbiology
4, 1-6.
Lacroix V. (1999). Exercise-Induced Asthma. Physician and Sportsmedicine 27, 75-92.
Langdeau J, Day A, Turcotte H & Boulet L. (2009). Gender Differences in the
Prevalence of Airway Hyperresponsiveness and Asthma in Athletes.
Respiratory medicine 103, 401-406.

Chapter Seven - References MSc by Research
61
Larsson J, Perry C, Anderson S, Brannan J, Dahlen S & Dahlen B. (2011). The
Occurrence of Refractoriness and Mast Cell Mediator Release Following
Mannitol-Induced Bronchoconstriction. Journal of applied physiology 110, 1029-
1035.
Larsson K, Ohlsén P, Larsson L, Malmberg P, Rydström P & Ulriksen H. (1993). High
Prevalence of Asthma in Cross Country Skiers. British medical journal 307,
1326-1329.
Magalang U & Grant B. (1995). Determination of Gas Exchange Threshold by
Nonparametric Regression. American Journal of Respiration and Critical Care
Medicine 151, 98-106.
Mainardi T, Mellins R, Miller R, Acosta L, Cornell A, Hoepner L, Quinn J, Yan B,
Chillrud S, Olmedo O, Perera F, Goldstein I, Rundle A, Jacobson J &
Perzanowski M. (2012). Exercise-Induced Wheeze, Urgent Medical Visits, and
Neighborhood Asthma Prevalence. Pediatrics 131, 127-135.
Marsh D, Neely J, Breazeale D, Ghosh B, Freidhoff L, Ehrlich-Kautzky E, Schou C,
Krishnaswamy G & Beaty T. (1994). Linkage Analysis of IL4 and Other
Chromosome 5q31.1 Markers and Total Serum Immunoglobulin E
Concentrations. Science 264, 1152-1156.
Matsumoto I, Araki H, Tsuda K, Odajima H, Nishima S, Higaki Y, Tanaka H, Tanaka M
& Shindo M. (1999). Effects of Swimming Training on Aerobic Capacity and
Exercise Induced Bronchoconstriction in Children with Bronchial Asthma.
Thorax 54, 196-201.
McArdle W, Katch F & Katch V. (2009). Exercise Physiology: Nutrition, Energy, and
Human Performance. Lippincot Williams & Wilkins, Philadelphia, PA.
McFadden E, Lenner K & Strohl K. (1986). Postexertional Airway Rewarming and
Thermally Induced Asthma. New Insights Into Pathophysiology and Possible
Pathogenesis. The Journal of clinical investigation 78, 18-25.

Chapter Seven - References MSc by Research
62
Metcalfe D, Baram D & Mekori Y. (1997). Mast cells. Physiological reviews 77, 1033-
1079.
Mickleborough T, Lindley M, Ionescu A & Fly A. (2006). Protective Effect of Fish Oil
Supplementation on Exercise-Induced Bronchoconstriction in Asthma. Chest
129, 39-49.
Mickleborough T, Murray R, Ionescu A & Lindley M. (2003). Fish Oil Supplementation
Reduces Severity of Exercise-Induced Bronchoconstriction in Elite Athletes.
American journal of respiratory and critical care medicine 168, 1181-1189.
Miller M, Hankinson J, Brusasco V, Burgos F, Casaburi R, Coates A, Crapo R, Enright
P, Van Der Grinten C, Gustafsson P, Jensen R, Johnson D, Macintyre N,
McKay R, Navajas D, Pedersen O, Pellegrino R, Viegi G & Wanger J. (2005).
Standardisation of Spirometry. European Respiratory Journal 26, 319-338.
Moreira A, Delgado L & Carlsen K. (2011). Exercise-Induced Asthma: Why Is It So
Frequent in Olympic Athletes? Expert review of respiratory medicine 5, 1-3.
Parsons J & Mastronarde J. (2005). Exercise-Induced Bronchoconstriction in Athletes.
Chest 128, 3966-3974.
Philip G, Villaran C, Pearlman D, Loeys T, Dass S & Reiss T. (2007). Protection
Against Exercise-Induced Bronchoconstriction Two Hours after a Single Oral
Dose of Montelukast. The Journal of asthma : official journal of the Association
for the Care of Asthma 44, 213-217.
Postma D. (2007). Gender Differences in Asthma Development and Progression.
Gender Medicine 4, S133-S146.
Rundell K, Anderson S, Spiering B & Judelson DA. (2004). Field Exercise vs
Laboratory Eucapnic Voluntary Hyperventilation To Identify Airway

Chapter Seven - References MSc by Research
63
Hyperresponsiveness in Elite Cold Weather Athletes. CHEST Journal 125, 909-
915.
Rundell K, Im J, Mayers L, Wilber R, Szmedra L & Schmitz H. (2001). Self-Reported
Symptoms and Exercise-Induced Asthma in the Elite Athlete. Medicine &
Science in Sports & Exercise 33, 208-213.
Rundell K, Wilber R & Lemanske Jr R. (2002). Exercise Induced Asthma:
Pathophysiology and Treatment. Human Kinetics, Champaign, IL.
Rundell K, Wilber R, Szmedra L, Jenkinson D, Mayers L & Im J. (2000). Exercise-
Induced Asthma Screening of Elite Athletes: Field Versus Laboratory Exercise
Challenge. Medicine & Science in Sports & Exercise 32, 309-316.
Rundell KW & Jenkinson DM. (2002). Exercise-Induced Bronchospasm in the Elite
Athlete. Sports medicine 32, 583-600.
Rupp N, Guill M & D. B. (1992). Unrecognized Exercise-Induced Bronchospasm in
Adolescent Athletes. American Journal of Diseases of Children 146, 941-944.
Schoene R, Giboney K, Schimmel C, Hagen J, Robinson J, Sato W & Sullivan K.
(1997). Spirometry and Airway Reactivity in Elite Track and Field Athletes.
Clinical Journal of Sport Medicine 7, 257-261.
Seear M, Wensley D & West N. (2005). How Accurate is the Diagnosis of Exercise
Induced Asthma among Vancouver Schoolchildren? Archives of disease in
childhood 90, 898-902.
Stanford K, Mickleborough T, Ray S, Lindley M, Koceja D & Stager J. (2006). Influence
of Menstrual Cycle Phase on Pulmonary Function in Asthmatic Athletes.
European journal of applied physiology 96, 703-710.

Chapter Seven - References MSc by Research
64
Stensrud T, Berntsen S & Carlsen K. (2006). Humidity Influences Exercise Capacity in
Subjects with Exercise-Induced Bronchoconstriction (EIB). Respiratory
medicine 100, 1633-1641.
Stensrud T, Berntsen S & Carlsen K. (2007). Exercise Capacity and Exercise-Induced
Bronchoconstriction (EIB) in a Cold Environment. Respiratory medicine 101,
1529-1536.
Stickland M, Spooner C, Dryden D & Rowe B. (2010). The Need for Standardization in
Exercise Challenge Testing for Exercise-Induced Asthma/Bronchoconstriction.
The Journal of allergy and clinical immunology 126, 878-880.
Stoloff S, Colice G, Hayden M, Craig T, Ostrom N, Eid N & Parsons J. (2011).
Exercise-Induced Bronchospasm: Implications for Patients With or Without
Asthma in Primary Care Practice. International journal of general medicine 4,
779-782.
Storms W. (2003). Review of Exercise-Induced Asthma. American College of Sports
Medicine, 1464-1470.
Sue-Chu M, Brannan J, Anderson S, Chew N & Bjermer L. (2010). Airway
Hyperresponsiveness to Methacholine, Adenosine 5-Monophosphate, Mannitol,
Eucapnic Voluntary Hyperpnoea and Field Exercise Challenge in Elite Cross-
Country Skiers. British journal of sports medicine 44, 827-832.
Suman O, Morrow J, O'Malley K & Beck K. (2000). Airway Function After
Cyclooxygenase Inhibition During Hyperpnea-Induced Bronchoconstriction in
Guinea Pigs. Journal of applied physiology 89, 1971-1978.
Tecklenburg S, Mickleborough T, Fly A, Bai Y & Stager J. (2007). Ascorbic Acid
Supplementation Attenuates Exercise-Induced Bronchoconstriction in Patients
with Asthma. Respiratory medicine 101, 1770-17788.

Chapter Seven - References MSc by Research
65
Trumper C, Maueler S, Vobejda C & Zimmermann E. (2009). Heart Rate-Based
Protocols for Exercise Challenge Testing Do Not Ensure Sufficient Exercise
Intensity for Inducing Exercise-Induced Bronchial Obstruction. British journal of
sports medicine 43, 429-431.
UK A. (2015). Asthma Facts and FAQ's, ed. UK A, pp. Asthma Facts and FAQ's.
http://www.asthma.org.uk/asthma-facts-and-statistics.
van Leeuwen J, Driessen J, de Jongh F, Anderson S & Thio B. (2012). Measuring
Breakthrough Exercise-Induced Bronchoconstriction in Young Asthmatic
Children Using a Jumping Castle. The Journal of allergy and clinical
immunology, 1-7.
Ventura M, Cannone A, Sinesi D, Buquicchio R, Carbonara M, Di Leo E, Bonini M,
Dagnello M & Bonini S. (2009). Sensitization, Asthma and Allergic Disease in
Young Soccer Players. Allergy 64, 556-559.
WADA. (2015). Medical Information to Support the Decisions of TUEC's Asthma. In
World Anti-Doping Program, pp. 1-11.
Walley A & Cookson W. (1996). Investigation of an Interleukin-4 Promoter
Polymorphism for Associations with Asthma and Aopy. Journal of Medical
Genetics 33, 689-692.
Weiler J, Layton T & Hunt M. (1998). Asthma in United States Olympic Athletes Who
Participated in the 1996 Summer Games. Journal of Allergy and Clinical
Immunology 102, 722-726.
Wilber R, Rundell K, Szmedra L, Jenkinson D, Im J & Drake S. (2000). Incidence of
Exercise-Induced Bronchospasm in Olympic Winter Sport Athletes. Medicine &
Science in Sports & Exercise 32, 732-737.
Wills-Karp M, Luyimbazi J, Xu X, Schofield B, Neben T, Karp C & Donaldson D. (1998).
Interleukin-13: Central Mediator of Allergic Asthma. Science 282, 2258-2261.

Chapter Seven - References MSc by Research
66
Yazdanbakhsh M, Kremsner P & van Ree R. (2002). Allergy, Parasites, and the
Hygiene Hypothesis. Science 296, 490-494.

Chapter 8 - Appendix MSc by Research
67
APPENDICES

Chapter 8 - Appendix MSc by Research
68
Appendix 8.1 – Health History Questionnaire

Chapter 8 - Appendix MSc by Research
69

Chapter 8 - Appendix MSc by Research
70

Chapter 8 - Appendix MSc by Research
71

Chapter 8 - Appendix MSc by Research
72

Chapter 8 - Appendix MSc by Research
73

Chapter 8 - Appendix MSc by Research
74
Appendix 8.2 – Respiratory Clinic Health Questionnaire

Chapter 8 - Appendix MSc by Research
75
Appendix 8.3 – Research Participant Information Sheet

Chapter 8 - Appendix MSc by Research
76

Chapter 8 - Appendix MSc by Research
77

Chapter 8 - Appendix MSc by Research
78

Chapter 8 - Appendix MSc by Research
79
Appendix 8.4 – Medication Withhold Times