Embed Size (px)
Citation preview
Exemplar for internal assessment resource Geography for Achievement Standard 91011
Exemplar for Internal Achievement Standard
Geography Level 1
This exemplar supports assessment against:
Achievement Standard 91011
Conduct geographic research, with direction
An annotated exemplar is an extract of student evidence, with a commentary, to explain key aspects of the standard. These will assist teachers to make assessment judgements at the grade boundaries.
New Zealand Qualification Authority
To support internal assessment from 2014
© NZQA 2014
Exemplar for internal assessment resource Geography for Achievement Standard 91011
Grade Boundary: Low Excellence
1. For Excellence the student needs to conduct comprehensive geographic research, with direction.
This typically involves:
• presenting the data in a variety of ways, following all appropriate conventions, showing sound understanding of the context and the spatial nature of the research
• fully describing findings, incorporating the relevance of a geographic concept, using geographic terminology and showing insight
• providing an insightful evaluation of the research process that also discusses the validity of the research findings.
The student demonstrates comprehensive research into Franz Josef glacier through the range and quality of collected and presented data (1), which provides the student with a depth of evidence to comprehensively address the research aim. Some of the findings are fully described (4) incorporating the geographic concept of accessibility (2) and using appropriate geographic terminology (5). Insight is evident where the student acknowledges the actions of DOC which mitigate negative impacts on the glacial area (3). The evaluation of the research process describes in detail a weakness with the data collection (6), and directly links this to the validity of the research findings (7). The evaluation shows insight when the student identifies issues beyond the collected data (8). To reach Excellence more securely, the student would need to describe the findings of all the presented data which would confirm its relevance to the aim. Specific evidence of visitor impact needs to be identified to ensure all aspects of the aim are addressed.
© NZQA 2014
Student 1 - Low Excellence
The presented work also included two tables showing survey data and extra profiles and photographs. Aim: To identify and assess the impact of people on the access route to the Franz Josef
Glacier?
Present data and description of findings
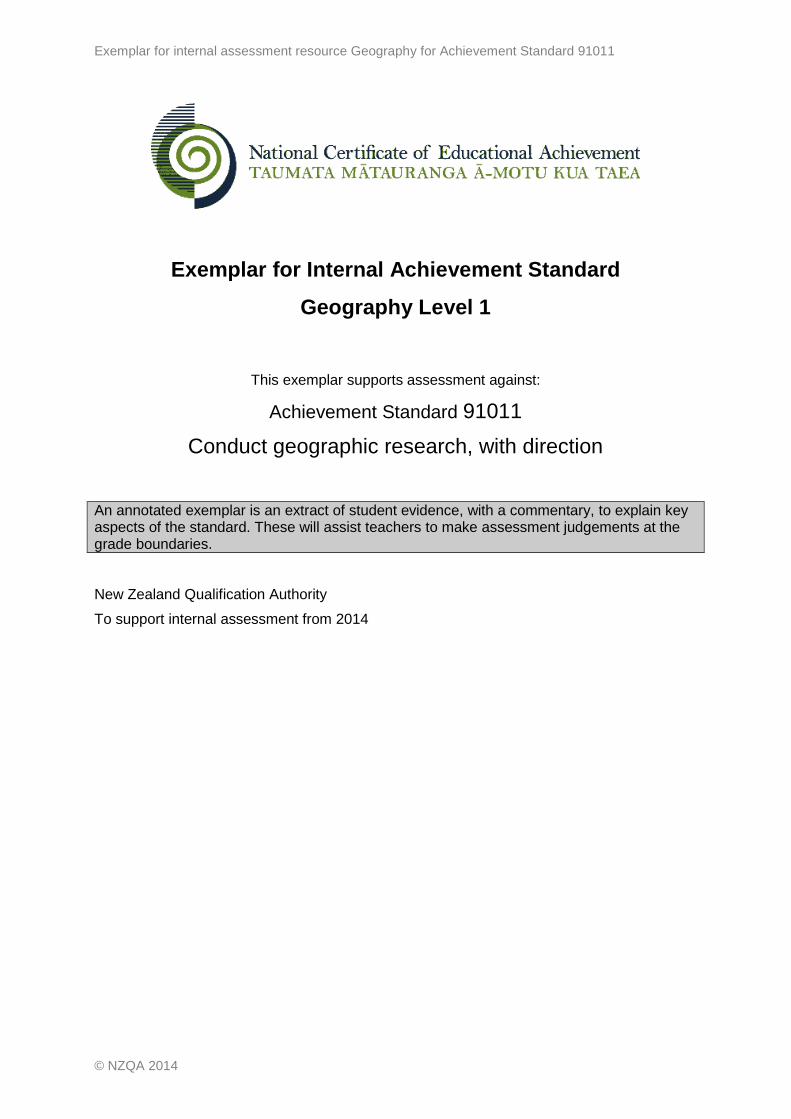
My findings show that the type and extent of impacts of people differ according to the
distance from the car park to the roped off area before the Franz Josef Glacier. Franz Josef
(Ka Roimata o Hine Hukatere) is one of New Zealand’s most accessible glaciers. My map
shows the car park, track and unmarked path with walking distances. The track is well
maintained (see photo 2) providing easy access to the photo stop area. As the car park and
track area are high impact zones DOC has provided sealed access which keeps people to a
[1]
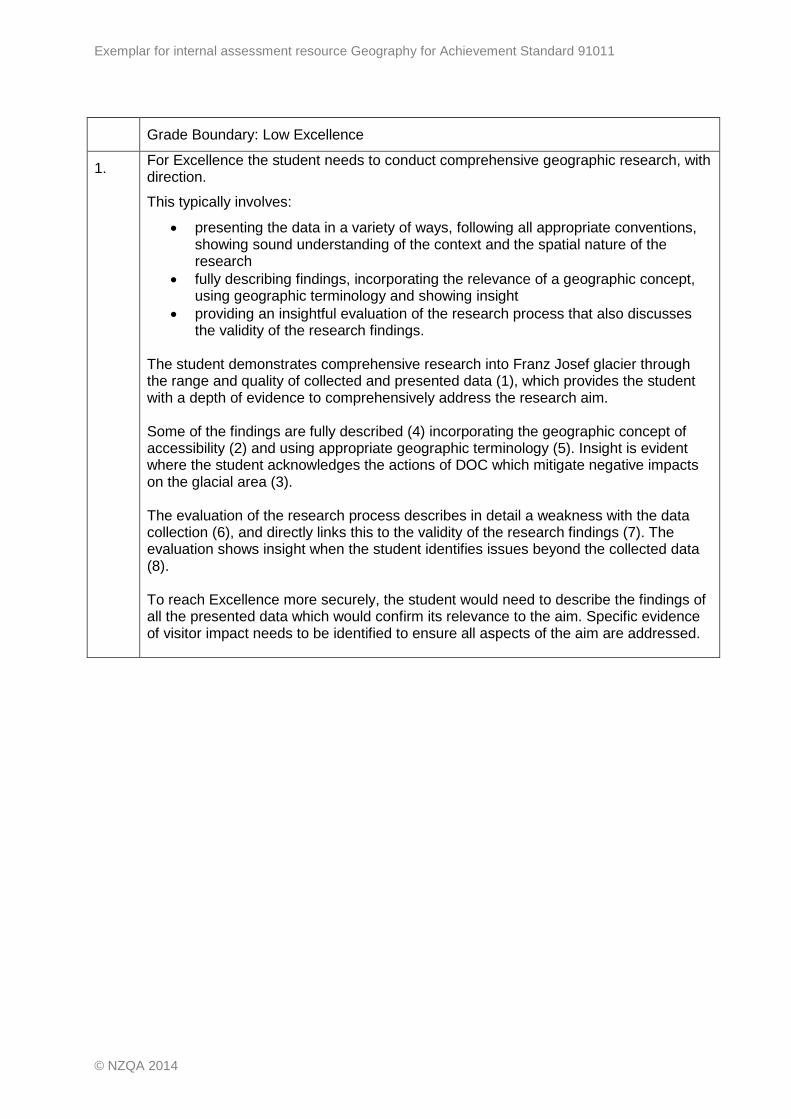
Walking spikes accelerate freeze
thaw weathering on the valley floor
Trampling of soft glacial gravels
Photo 3
Wide area of human impact beyond the track
[1]
Student 1: Low Excellence
defined area and reduces damage to bush around this area…[2] There is evidence where
cars have parked on the edge of the road when the car park was full, causing erosion and
damage to the drains, this is a negative impact… DOC says that over 250,000 people
visited in 2010 and this number is increasing each year… The annotations show the extent
of the changes made by DOC to manage and reduce the negative impact of visitors using
tracks, rubbish bins, and signs etc. [3]
In the zone shown in photo 3, the track is marked part of the way by snow poles across the
moraine, but people tend to wander all over the area at the snout of the glacier [5]. The
glacier is roped off which reduces impact by people and can only be accessed by guided
groups. This area is not accessed by so many people, only 35% of the total counted.
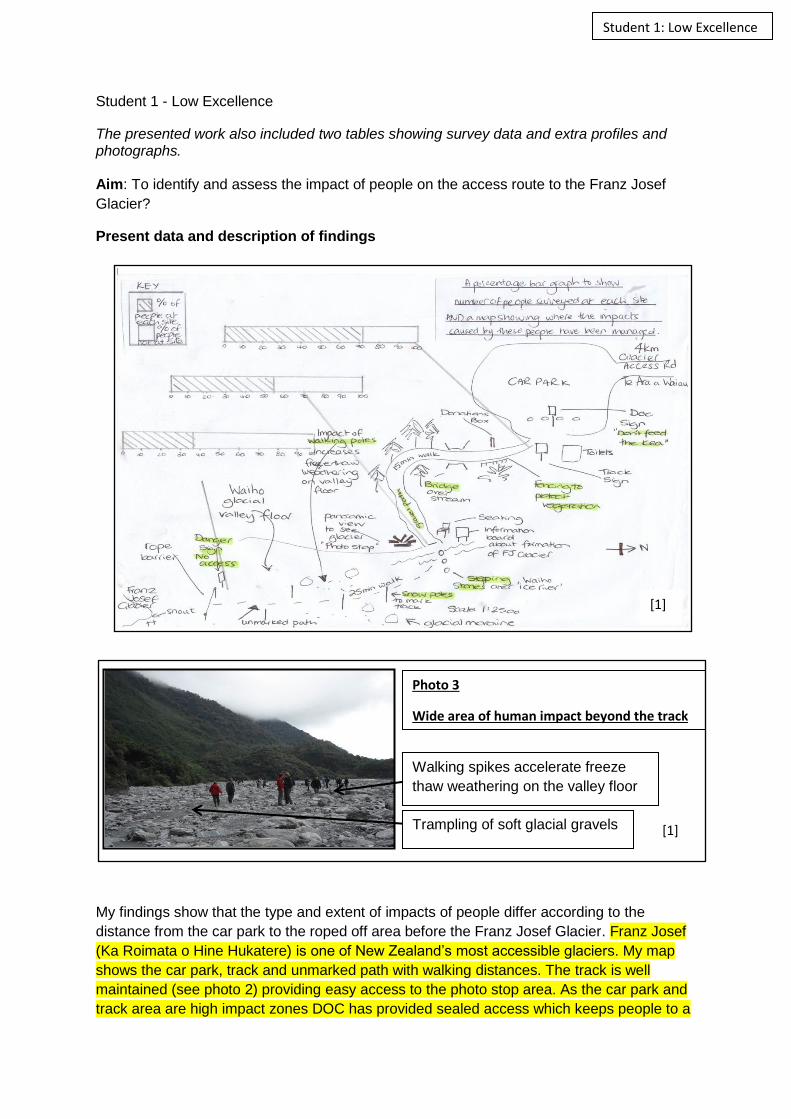
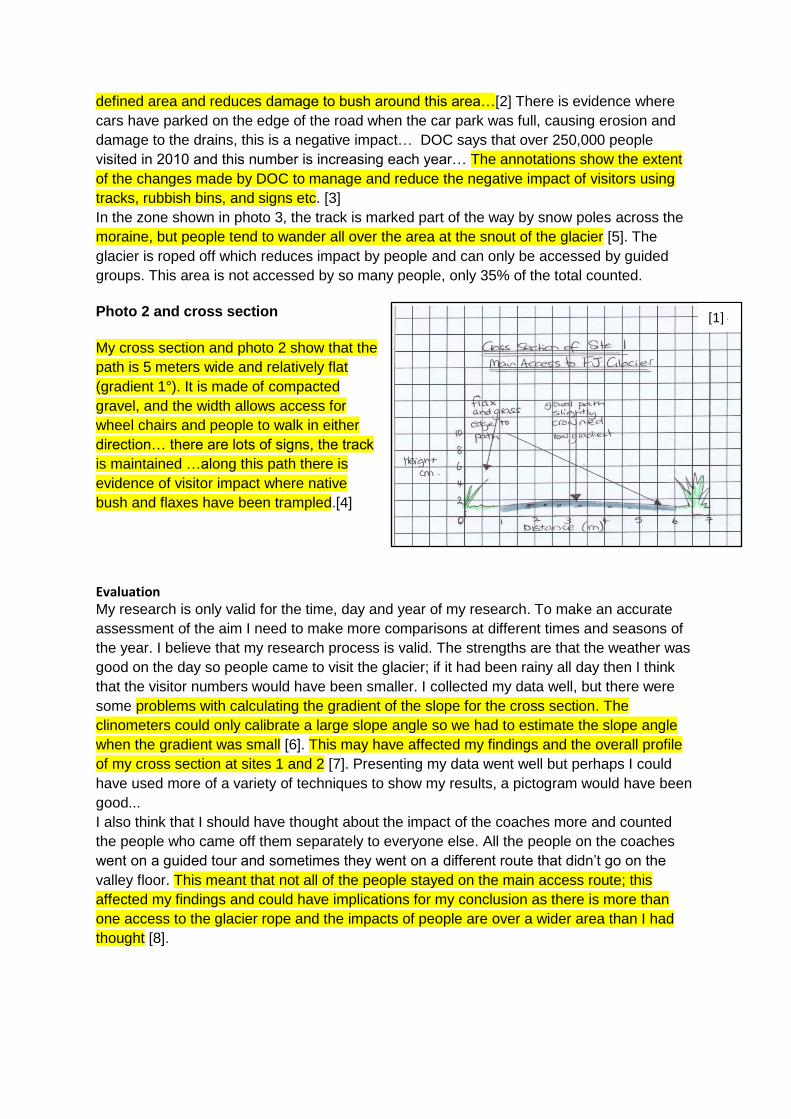
Photo 2 and cross section
My cross section and photo 2 show that the
path is 5 meters wide and relatively flat
(gradient 1°). It is made of compacted
gravel, and the width allows access for
wheel chairs and people to walk in either
direction… there are lots of signs, the track
is maintained …along this path there is
evidence of visitor impact where native
bush and flaxes have been trampled.[4]
Evaluation My research is only valid for the time, day and year of my research. To make an accurate
assessment of the aim I need to make more comparisons at different times and seasons of
the year. I believe that my research process is valid. The strengths are that the weather was
good on the day so people came to visit the glacier; if it had been rainy all day then I think
that the visitor numbers would have been smaller. I collected my data well, but there were
some problems with calculating the gradient of the slope for the cross section. The
clinometers could only calibrate a large slope angle so we had to estimate the slope angle
when the gradient was small [6]. This may have affected my findings and the overall profile
of my cross section at sites 1 and 2 [7]. Presenting my data went well but perhaps I could
have used more of a variety of techniques to show my results, a pictogram would have been
good...
I also think that I should have thought about the impact of the coaches more and counted
the people who came off them separately to everyone else. All the people on the coaches
went on a guided tour and sometimes they went on a different route that didn’t go on the
valley floor. This meant that not all of the people stayed on the main access route; this
affected my findings and could have implications for my conclusion as there is more than
one access to the glacier rope and the impacts of people are over a wider area than I had
thought [8].
[1] 1
Exemplar for internal assessment resource Geography for Achievement Standard 91011
Grade Boundary: High Merit
2. For Merit the student needs to conduct in-depth geographic research, with direction.
This typically involves:
• presenting the data in a variety of ways, following appropriate conventions, showing sound understanding of the context and spatial nature of the research
• describing findings in detail, incorporating the relevance of a geographic concept
• providing a detailed conclusion(s), that relates to the aim • providing a detailed evaluation.
The student demonstrates in-depth geographic research into Franz Josef glacier, through accuracy and detail with each of the research process components identified in Explanatory Note 2. The findings are fully described using detail from the primary data (3) (6), and incorporating the geographic concept of perception (2) (5) (7).
The presented data, specifically the sketch map showing how the impacts change along the access route (1), and the Pole Impact diagram (4) both clearly support the research aim and use appropriate geographic conventions. The data is presented using a variety of methods, showing understanding of the spatial nature of the research.
The conclusion directly relates to the research aim and shows understanding of the data and the Franz Josef environment (8).
The research process is evaluated with reference to the collection and presentation of data. The description includes specific examples as to why a data collection method was a weakness (9).
To reach Excellence, the student would need to improve the accuracy of presented data by following all appropriate conventions, and to show the data collection sites on the map. The evaluation needs to discuss the validity of the research findings.
© NZQA 2014
Student 2 - High Merit
Aim: To identify and assess the impact of people on the main access route to the Franz Josef Glacier?
Presenting data and describing findings
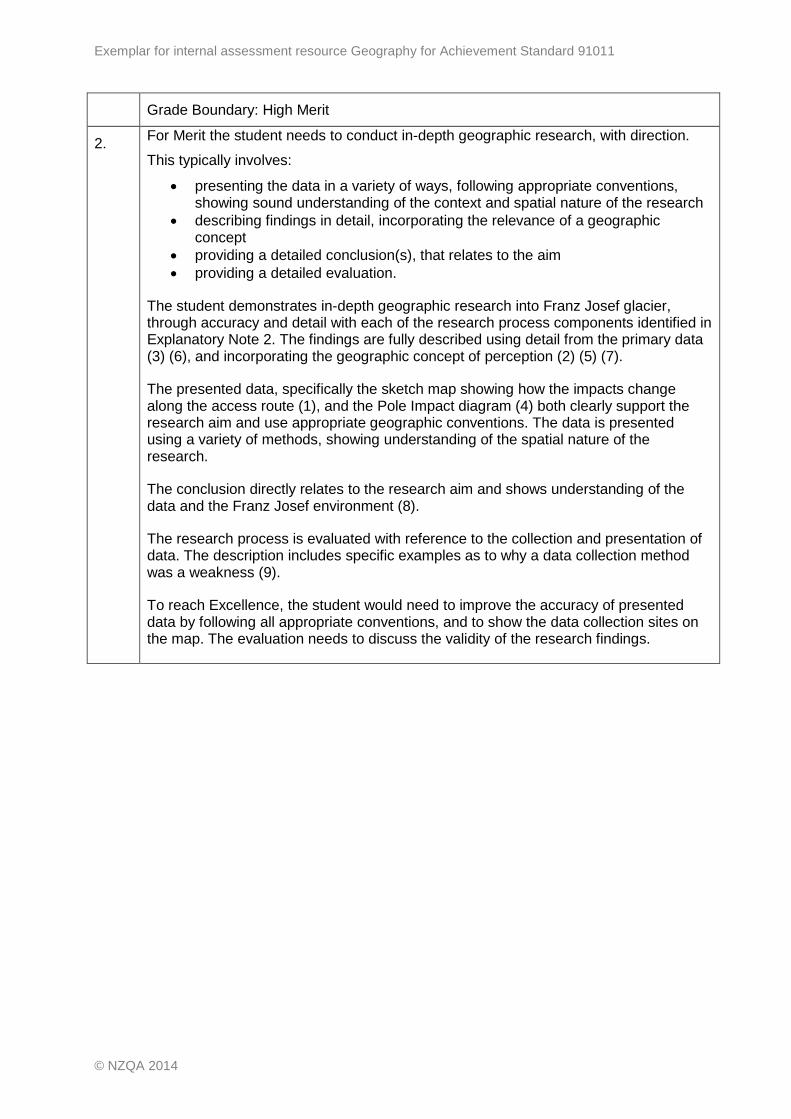
A sketch map to show the impacts of people on the main access route
My sketch map shows that there are many impacts that people have caused on the main access
route to the Franz Josef Glacier. …The car park acts as a ‘honey pot’ for the visitors. DOC perceives
this area to be of the biggest risk as this is where all of the visitors start their enjoyment of the
glacier, so this is the area which is most highly managed to minimise the impacts of the visitors [2].
The car park is graded with gravel to avoid pot holes … parking sites are allocated for the different
types of vehicle, there are also toilets, rubbish bins…There are signs to inform people of the routes …
These measures have all been put into place to manage the impact of such high numbers of people
as over 250,000 people visit the glacier in a year.
The most impact is caused where there are most
people. The majority of people all start from the
car park as this is where the track starts so this is
where the impact will be the greatest. In my
people survey a total of 344 people visited the
site throughout the day. My bar graph shows
that the highest number of people is at site 1,
the track entrance and car park with 96 people…
[3].
[1]
Student 2: High Merit
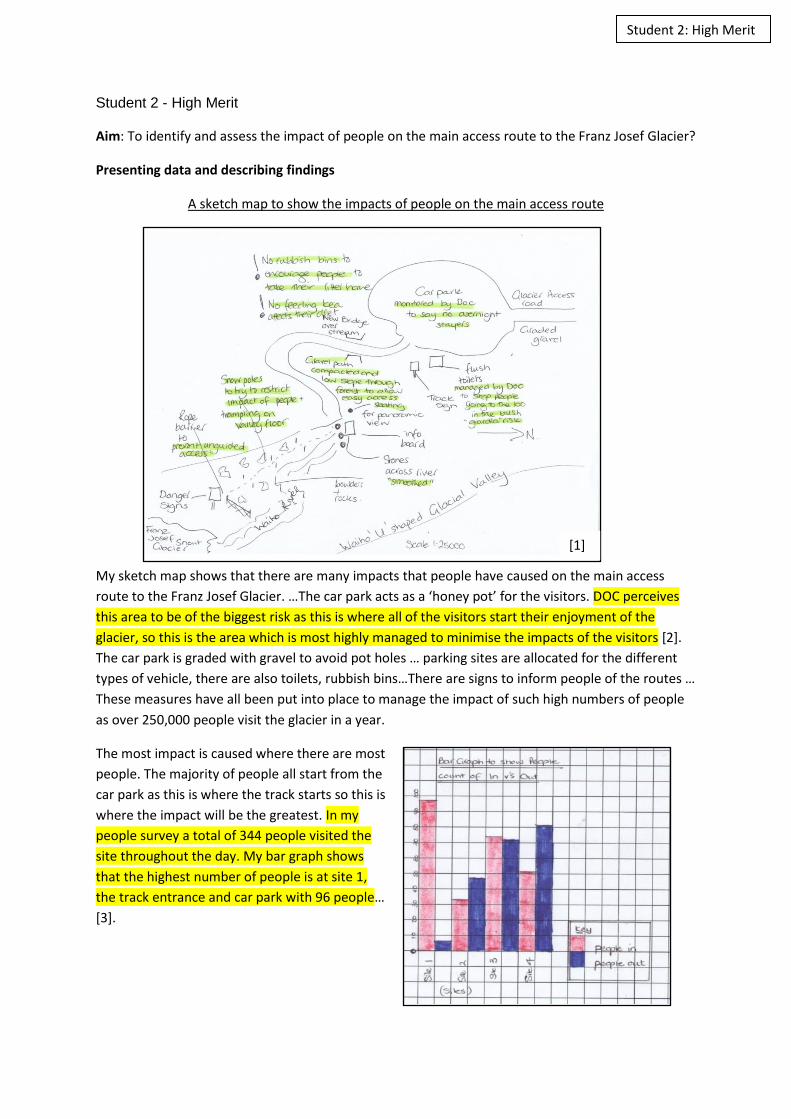
Walking poles are increasingly used by
visitors choosing to walk on the moraine
on the glacial valley floor. Some of these
people (24/36 counted) wander in to
surrounding areas that are not clearly
restricted. Their perception is that [5]
walking on the valley floor does not
impact the environment as they are far
away from the glacier. However, walking
poles are a major negative impact on this
area. The walking pole provides stability
for the walker by… this leaves a hole which
eventually increases erosion… Freeze-thaw
action works in the holes… I counted 13 of
25 walkers at one stage using poles
proving that this is a serious impact [6].
Our interview with the DOC ranger also
included a discussion of the environmental
impacts of walker’s poles and she said
they are perceived as a serious risk [7].
Conclusion I conclude that there are lots of impacts caused by people on the main access route to the Franz
Josef Glacier. The area of most impact is at the car park and entrance to the track; however this area
has been the most managed so the actual impact on the environment is limited [8]. DOC has
provided some sealed parking for cars and coaches, toilets and rubbish bins. Less people actually
make it up to the rope barrier but this area is significantly impacted by people as it is much less
managed. People do not stay within the snow poles on the valley floor (24/36 people seen) so they
have trampled over a larger area, the glacial moraine is compacted and the use of walking poles
means that the glacial valley is more affected by frost shattering.
Evaluation of the research
The strengths of my research are that I was able to collect a range of relevant data on the impacts of
people on the environment. I observed that the impacts changed from the car park to the glacier…
I counted the people at different sites along the track but I should have done this at different times
in the day to see if the trend was the same all of the time [9]. The weaknesses are … I could have
used more methods to present my data… but the annotated map is a strength of my presentation
because it clearly shows the area we studied and relevant data…
[4]
Exemplar for internal assessment resource Geography for Achievement Standard 91011
Grade Boundary: Low Merit
3. For Merit the student needs to conduct in-depth geographic research, with direction.
This typically involves:
• presenting the data in a variety of ways, following appropriate conventions, showing sound understanding of the context and spatial nature of the research
• describing findings in detail, incorporating the relevance of a geographic concept
• providing a detailed conclusion(s), that relates to the aim • providing a detailed evaluation of the research process.
The student researches Franz Josef glacier, demonstrating depth through completion of all components of the research process, with the description of the findings and conclusion clearly at the Merit level.
Findings are described with detail from the primary data (2) (4). The concept of pattern is incorporated through a description of visitor numbers, which is also linked to the management of the track (3). The conclusion uses specific detail (5) (6), and relates directly to the research aim (7). A variety of data presentation methods are used. A sketch map and statistical evidence are combined to clearly show the context and spatial nature of the research (1). The evaluation of the research process focuses on strengths of the data presentation (8). To reach Merit more securely the student would need to use appropriate conventions when presenting data, for example the use of annotations on photographs and title and axis labels on graphs. The evidence shown on the photographs could be included in the description of the findings.
© NZQA 2014

Student 3 - Low Merit
Aim: To identify the changes made by DOC in response to numbers of people on the main access
route to the Franz Josef Glacier?
The presented data also included several unlabelled photographs.
Presenting data and describing findings
My map shows that the area with the most people is at the entrance to the track with 90 people
going in in the morning and 79 people in the afternoon. From the morning sample 60 went to the
panoramic viewpoint and then 50 of these made it to the rope barrier. This shows a definite change
between the start and end of the track [2]. The 10 people who did not go on to the valley floor said it
looked too difficult. 30 people joined a guided walk which …This pattern of visitor number reflects
the management actions that DOC has made to the path and the use of guides to provide access
onto the glacier. Where there are more people the access is more managed, [3]
- The path is made of compacted gravel and it is wide (5-7m)
- A bridge has been built over a stream to improve the access
- Signs and barriers limit the ability of people to stray from the path…
Where there are less people the track is less managed. On the valley floor there are 6 widely spaced
snow poles to guide people over the boulders, and a rope fence and danger signs limit access to the
glacier [4].
[1]
Student 3: Low Merit

Conclusion
DOC has made the most changes at the car park end of the track up to the viewing point. In
conclusion the majority of people (170 surveyed) are at the start of the access to the glacier (car
park). [5]This is where the biggest impacts are likely to occur, but they have been managed by DOC
to reduce their effect. DOC has provided a sealed parking area, toilets, track etc. Where there are
less people (120 surveyed) at the rope barrier there are fewer changes by DOC… roped off area and
snow poles showing the route [6].
I can conclude that where there are more people there is the chance for greater impact and
consequently this is where DOC has responded to protect the environment and also keep people
safe [7].
Evaluation Strengths of the research: -My map showed the site of the research and key changes made by DOC. -Photographs showed each site on the day of the field trip. -Putting my graphs on to the map showed the data for the actual site… This presentation clearly showed the geographic concept of ‘pattern’ [8].
Exemplar for internal assessment resource Geography for Achievement Standard 91011
Grade Boundary: High Achieved
4. For Achieved the student needs to conduct geographic research, with direction.
This typically involves:
• identifying the research aim(s) • collecting and recording relevant data • presenting relevant data using basic appropriate conventions • describing findings, incorporating the relevance of a geographic concept • providing a conclusion(s) that relates to the aim • providing an evaluation of the research process.
The student researches Franz Josef glacier, demonstrating depth with the description of the findings and evaluation, which support a high Achieved grade. The findings are described including detail from the collected data (3). The inclusion of a geographic concept (perspectives) in the aim, helps the student incorporate it in the findings (2) (4). The research evaluation contains clear reasoning for both strengths and weaknesses, and shows understanding of the importance of data collection (6). Data is presented in a variety of ways which are appropriate to the aim; photographs, pie graph and environmental quality index graph and basic geographic conventions are followed with the graphs. To reach Merit, the student would need to show a sound understanding of the spatial nature of the research within the presented data. This could be achieved by including a map or using methods of displaying other data that focus on the spatial dimension. A conclusion that relates to the aim is given (5), but evidence from the collected and presented data needs to be used to provide detail. A wider aim (1) may encourage the collection of more data and provide opportunity for a more in-depth research.
© NZQA 2014
Student 4 - High Achieved
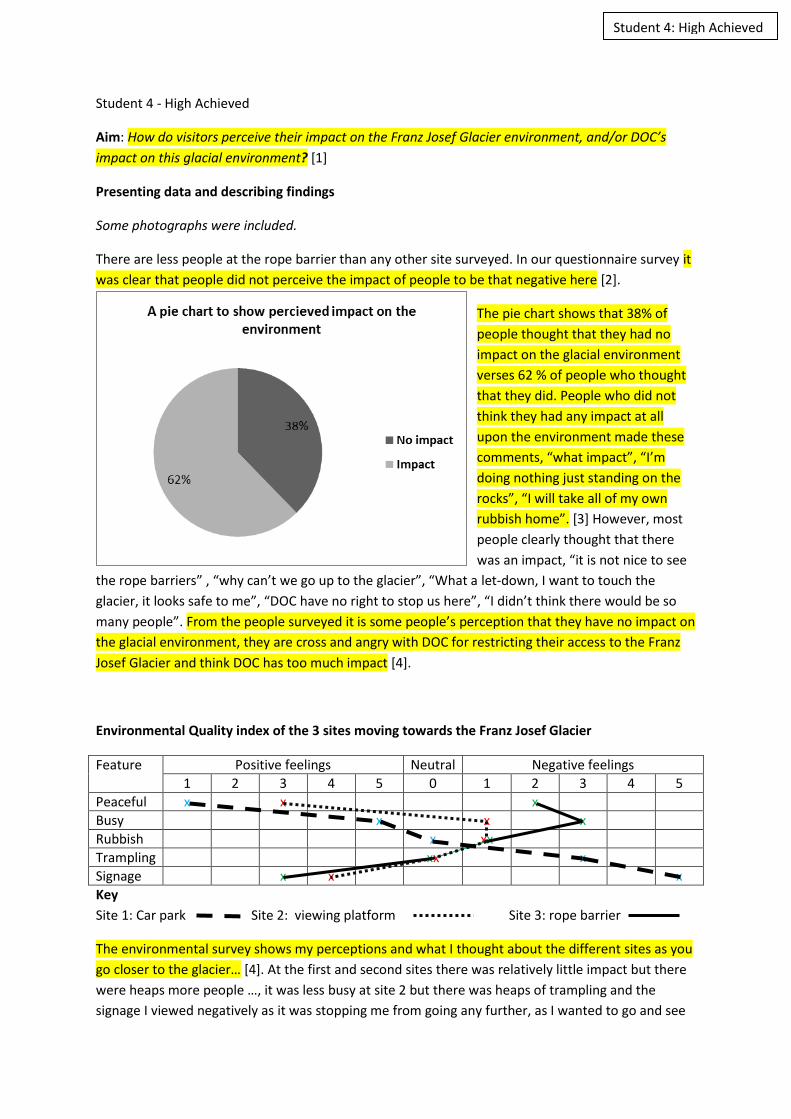
Aim: How do visitors perceive their impact on the Franz Josef Glacier environment, and/or DOC’s
impact on this glacial environment? [1]
Presenting data and describing findings
Some photographs were included.
There are less people at the rope barrier than any other site surveyed. In our questionnaire survey it
was clear that people did not perceive the impact of people to be that negative here [2].
The pie chart shows that 38% of
people thought that they had no
impact on the glacial environment
verses 62 % of people who thought
that they did. People who did not
think they had any impact at all
upon the environment made these
comments, “what impact”, “I’m
doing nothing just standing on the
rocks”, “I will take all of my own
rubbish home”. [3] However, most
people clearly thought that there
was an impact, “it is not nice to see
the rope barriers” , “why can’t we go up to the glacier”, “What a let-down, I want to touch the
glacier, it looks safe to me”, “DOC have no right to stop us here”, “I didn’t think there would be so
many people”. From the people surveyed it is some people’s perception that they have no impact on
the glacial environment, they are cross and angry with DOC for restricting their access to the Franz
Josef Glacier and think DOC has too much impact [4].
Environmental Quality index of the 3 sites moving towards the Franz Josef Glacier
Feature Positive feelings Neutral Negative feelings
1 2 3 4 5 0 1 2 3 4 5
Peaceful x x x
Busy x x x
Rubbish x xx
Trampling xx x
Signage x x x
Key
Site 1: Car park Site 2: viewing platform Site 3: rope barrier
The environmental survey shows my perceptions and what I thought about the different sites as you
go closer to the glacier… [4]. At the first and second sites there was relatively little impact but there
were heaps more people …, it was less busy at site 2 but there was heaps of trampling and the
signage I viewed negatively as it was stopping me from going any further, as I wanted to go and see
Student 4: High Achieved
the glacier close up I was more negative about this than any other feeling I had at the other three
sites.
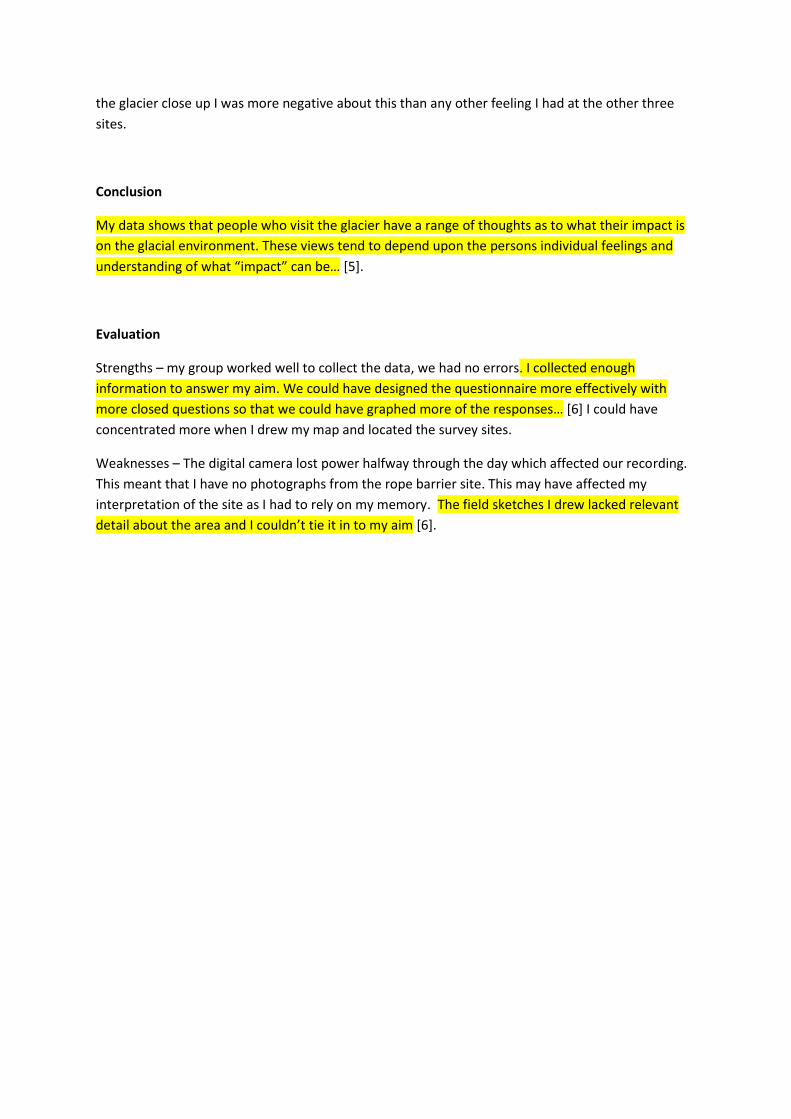
Conclusion
My data shows that people who visit the glacier have a range of thoughts as to what their impact is
on the glacial environment. These views tend to depend upon the persons individual feelings and
understanding of what “impact” can be… [5].
Evaluation
Strengths – my group worked well to collect the data, we had no errors. I collected enough
information to answer my aim. We could have designed the questionnaire more effectively with
more closed questions so that we could have graphed more of the responses… [6] I could have
concentrated more when I drew my map and located the survey sites.
Weaknesses – The digital camera lost power halfway through the day which affected our recording.
This meant that I have no photographs from the rope barrier site. This may have affected my
interpretation of the site as I had to rely on my memory. The field sketches I drew lacked relevant
detail about the area and I couldn’t tie it in to my aim [6].
Exemplar for internal assessment resource Geography for Achievement Standard 91011
Grade Boundary: Low Achieved
5. For Achieved the student needs to conduct geographic research, with direction.
This typically involves:
• identifying the research aim(s) • collecting and recording relevant data • presenting relevant data using basic appropriate conventions • describing findings, incorporating the relevance of a geographic concept • providing a conclusion(s) that relates to the aim • providing an evaluation of the research process.
The student demonstrates an ability to conduct geographic research by investigating Franz Josef glacier, and following the research process with three components; the description of findings, conclusion and evaluation clearly at the Achieved level. Findings are described for each piece of relevant data, (2 and 4) and the concept of location has been incorporated (5). A simple conclusion is made that links directly to the research aim (6). The evaluation focuses on two aspects of the research process (collecting and presentation) (7), showing clearly that the student recognises the importance of these two components of the research process. To reach Achieved more securely, the student could have included a map to illustrate the spatial dimension. This would be particularly well suited to this research, as the aim (1) has a clear spatial focus. The student would need to more carefully select data that is relevant to the aim of the research. For example, the table relating to transport (3) needs to provide evidence to support the aim. The geographic concept of location could be incorporated in the description of the findings, rather than in the summary of findings, where it tends to form a conclusion statement.
© NZQA 2014
Student 5 - Low Achieved
Aim: How does the impact of people change as you get closer to the glacier? [1]
Another field sketch and a range of photographs were included in the presentation, some
were annotated.
Presenting data and describing findings
Field sketch of site 2
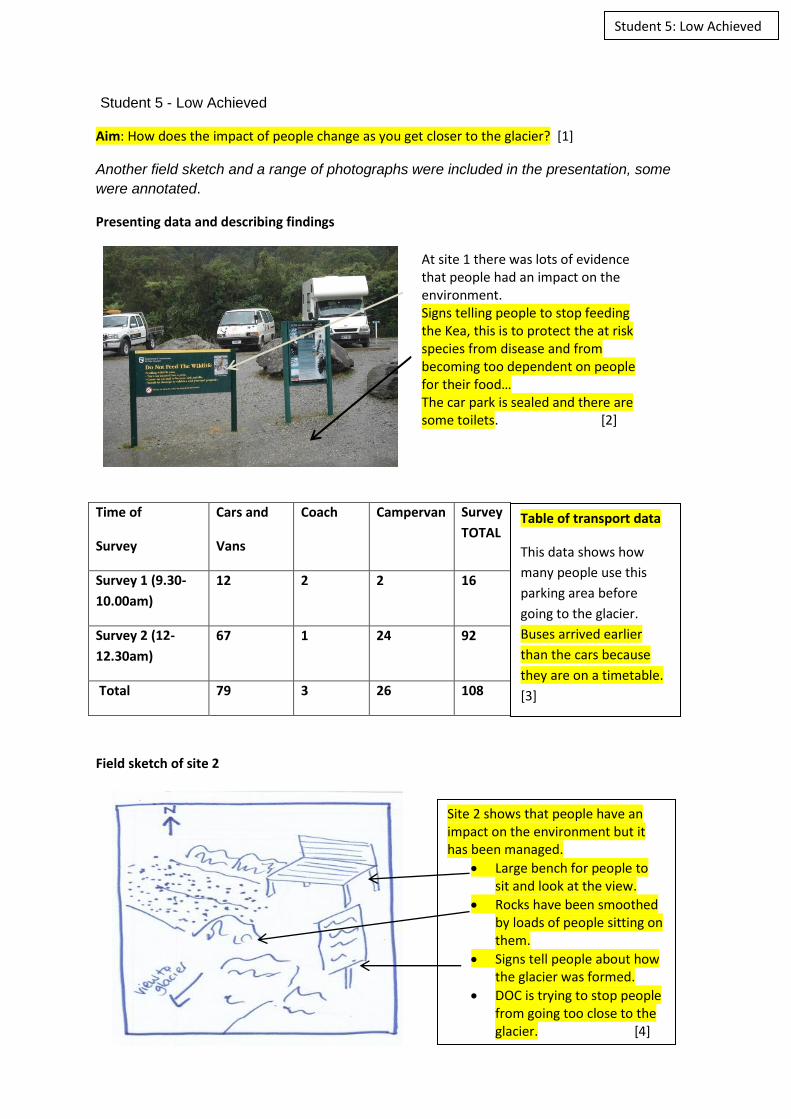
Time of
Survey
Cars and
Vans
Coach Campervan Survey
TOTAL
Survey 1 (9.30-
10.00am)
12 2 2 16
Survey 2 (12-
12.30am)
67 1 24 92
Total 79 3 26 108
Table of transport data
This data shows how
many people use this
parking area before
going to the glacier.
Buses arrived earlier
than the cars because
they are on a timetable.
[3]
At site 1 there was lots of evidence that people had an impact on the environment. Signs telling people to stop feeding the Kea, this is to protect the at risk species from disease and from becoming too dependent on people for their food… The car park is sealed and there are some toilets. [2]
Site 2 shows that people have an impact on the environment but it has been managed.
Large bench for people to sit and look at the view.
Rocks have been smoothed by loads of people sitting on them.
Signs tell people about how the glacier was formed.
DOC is trying to stop people from going too close to the glacier. [4]
Student 5: Low Achieved
My findings show that location is very important to the impacts from people in this environment.
There is less evidence that the use of the environment is controlled by DOC the closer you get to the
glacier [5]. DOC use signs and rope barriers to try to keep people on the tracks, and this prevents
damage in the bush areas. Further away from the glacier people are more managed and so the
impacts are more controlled.
Conclusion
My data shows that the impacts of people are less as you get closer to the glacier, because DOC is
less able to control this wider environment. The impacts around the car park are most obvious and
these changes try to reduce negative impacts. [6]
Evaluation
I worked really hard to collect my data, but I think I could have collected more evidence of the
impacts. The photos show the key areas of the research but I needed to also draw a map to show
where things like the car park and glacier are… All the people in my group wanted to take photos
and that is why we had so many. [7]
Exemplar for internal assessment resource Geography for Achievement Standard 91011
Grade Boundary: High Not Achieved
6. For Achieved the student needs to conduct geographic research, with direction.
This typically involves:
• identifying the research aim(s) • collecting and recording relevant data • presenting relevant data using basic appropriate conventions • describing findings, incorporating the relevance of a geographic concept • providing a conclusion(s) that relates to the aim • providing an evaluation of the research process.
The student investigates Franz Josef glacier, and demonstrates ability to complete some components of the research process identified in Explanatory Note 2. A clear aim for the research is identified (1) and supported with annotated photographs. Some of the findings for presented data are described (3) and an attempt has been made to incorporate the geographic concept of change (2) (4). A simple conclusion is given, which relates to the research aim (5). To reach Achieved, the student would need to use a combination of methods when presenting data, such as précis sketching and surveying (as outlined in Explanatory Note 5). While a research log is completed, it needs to be developed as an evaluation of the research process (6), as specified in Explanatory Note 6.
© NZQA 2014

Student 6 - High Not Achieved
Recorded data included a sketch map, but it was not developed to an acceptable standard or included with the presented data. Aim: Do the impacts from people increase as you get closer to the glacier? [1]
Presenting data and findings
At site 1 it was clear that there was impact from people. There were lots of signs telling you what to do and what not to do. The area had lots of changes like the sealed car park, signs and toilets etc. [2]
Signs were telling people not to feed the Kea.
At site 3 up near the glacier, the impacts of people were less controlled by DOC. People could go anywhere they want and climbed all over the rocks [3]. People haven’t made as many changes here apart from some areas roped off and signs [4]. The tracks are hard to follow this close to the glacier. Only people here were our class and young tourists.
Conclusion The data I collected on my field trip shows that the impacts don’t increase as you get closer to the glacier. There were more people around the track and car park and this is where most of the impact was. Some people only walked as far as the view platform because that’s where the track stopped [5].
Franz Josef Glacier
Danger sign
Rope barrier
People are spread out everywhere
taking photos
Student 6: High Not Achieved

Evaluation Day 1: Today we read over the research task sheet and made up our groups and research aim… Day 3: It was a fine day but cold. We visit Franz Josef glacier and my group did surveys, took photos and walked around… Day 5: This was the first writing up day… [6]