Embed Size (px)
Citation preview

Preparing NEMS for the New Energy Market Landscape
Presented by Paul PohExecutive Vice President
Market Administration
1

Agenda
2
• Market Reform Milestones
• National Electricity Market of Singapore (NEMS)
• Lack of Investments in Other Markets
• Australia
• Europe
• What about NEMS?

Market Reform Milestones
3
May 1963Formation of Public
Utilities Board• Supplies water/electricity/gas to Singapore Mar 2000
Decision to deregulate further
Oct 1995Corporatisation of
electricity/gas
Apr 1998Formation of Singapore Electricity Pool (SEP)
Holding Company (Singapore Power)• 2 gencos (Power Senoko, Power
Seraya)• 1 T&D company (PowerGrid)• 1 electricity retail company (Power
Supply)• 1 gas supply company (PowerGas)
Temasek Holdings
•1 genco (Tuas Power)
Apr 2001Further restructuring
• PUB restructured as water authority under MEWR
• EMA to regulate electricity and gas industries
• PSO to take over system operations• EMC formed to operate and administer
wholesale electricity market

Market Reform Milestones
4
Jan 2003Commencement of NEMS• Real-time wholesale
market for electricity• Phased contestability of
consumers
2008Sale of Gencos
May 2013LNG terminal
began operation
• Mar - Tuas sold to Huaneng Group
• Oct - Senoko Power sold to Lion Power
• Dec - Power Serayasold to YTL Power
Jun 2015Launch of Electricity
Futures Market • USEP Quarterly
Base Load futures
Jan 2004• Implementation of
Vesting Contracts• Implementation of
Interruptible Load
Apr 2016Implementation of Demand Response
Programme

5

Industry Stakeholders
6
Regulator (EMA)
System Operator
(PSO)
MarketOperator
(EMC)
MSSL(SP Services)
Generators
SP PowerAssets
• Sembcorp Cogen• NEA• Keppel Merlimau Cogen• Senoko WTE
• Shell Eastern Petroleum• Keppel Seghers Tuas WTE• ExxonMobil Asia Pacific• PacificLight Power
• YTL PowerSeraya• Tuaspring• TP Utilities• Singapore Refining Company
Wholesale Traders Electricity Retailers• Diamond Energy
Managers• Pfizer Asia Pacific• MSD International
GmbH• Banyan Utilities• Green Power Asia• Singapore LNG• GSK• ECO Special Waste
Management
• CGNPC• Sunseap Leasing• LYS Genco Beta• Solar C&I• Singapore District Cooling• Nanyang Technological
University• GreenSync Holdings• Sun Electric Energy Assets• Air Liquide Singapore• Changi Mega Solar
• Keppel Electric• Sembcorp Power• Senoko Energy Supply• Seraya Energy• Tuas Power Supply• Diamond Energy
Merchants• PacificLight Energy• Hyflux Energy• Red Dot Power• Buri Energy
• Sun Electric Power• Sunseap Energy• Best Electricity Supply• I Switch• Charis Electric• Environmental Solutions• Union Power• Just Electric• Cleantech Solar Management• Energy Supply Solutions
Non-Contestable Consumers Contestable Consumers

Products Traded
• Real-time spot market (half-hourly trading intervals)
• Energy
• 3 classes of reserves (can be provided by gencos and load)• Primary (8-second)• Secondary (30-second)• Contingency (10-minute)
• Regulation
• Procured contracts (annually)• Black-start ancillary services
7

Location Map of NEMS Generators (Existing & Upcoming, excluding EG)
Electricity interconnectionwith Malaysia
Keppel Cogen
▲ Represents incineration plants
Note: The Locations indicated on this map have been approximated and stylised. They do not accurately represent the actual physical location of individual facilities
Embedded generators and small generators (below 10MW) are not depicted in this map.
Senoko Energy
Tuas PowerGeneration PowerSeraya
SembCorp
Natural gas pipelinefrom Malaysia
Natural gas pipeline from(West Natuna)
Natural gas pipeline fromSumatra (Asamera)
PacificLight
LNG Terminal
▲ ▲▲
▲
TuaspringExxonMobil
Shell
SRC
8

Objectives• Promote competition • Efficient prices to guide investment, production and consumption
decisions
Market structure• Relatively concentrated market with a high degree of vertical
integration in generation and retail
• Vesting contracts in place to mitigate market power
Consumers• Retailers charged at Uniform Singapore Energy Price (USEP)
• Contestable consumers – buy from retailers/ MSSL (at spot prices)
• Non-contestable consumers – buy from MSSL at a regulated electricity tariff
Features of NEMS
9

Mandatory Energy-Only Real-Time Gross Pool• Spot market for 5 products - energy, 3 types of reserves and
regulation
• ½ hourly trading periods with 65 minute gate-closure
• Supply offer market with interruptible load and demand bidding being demand-side participation
• Market settled daily (20 days in arrears)
Dispatch of electricity• Market clearing engine: co-optimisation of energy, reserves and
regulation, modeling of power flows
• Locational marginal pricing, with about 860 nodes
Features of NEMS
10

Lack of Investments in Other Markets
11

Australia National Electricity Market
12

13
Annual Average Prices
• The Australia NEM has high wholesale electricity prices since 2016
$-
$20.00
$40.00
$60.00
$80.00
$100.00
$120.00
NSW1 QLD1 SA1 TAS1 VIC1
Annual average prices by region (AU$/MWh)
2011
2012
2013
2014
2015
2016
2017

14
Electricity Prices
• Australian Energy Market Commission expects Wholesalepower costs to rise between 5% and 15% each year until2019
• Average electricity bills have more than doubled over thepast decade to about $2,020 a household, making electricitythe fastest rising household expense

15
High Electricity Prices
Issues with renewables
• Decline in traditional generation (i.e. coal-fired power plants)• Limited management of renewable energy’s intermittency• Traditional sources of energy are pertinent when renewable generation
dips• Renewables do not have characteristics to support and stabilise the
electricity system

16
High Electricity Prices
High domestic gas price
• 3 massive new LNG terminals at Gladstone contracted to supply Asiawith gas
• Exporters struggle to fulfil contracted orders written years ago - Raidgas from the domestic market to meet their contracts
• Suppliers took advantage to raise prices and place onerous conditionson buyers
• Lack of financial incentive for landowner hampers development of newgas fields to increase domestic supply

High Electricity Prices
Constrained Interconnectors
• Reliant on the Basslink interconnectorfrom Victoria
• E.g. In December 2015 (faultyinterconnector)• Tasmania could not generate
sufficient hydro power• Necessary to restart a closed gas-
fired power station and commissionemergency diesel generators
Basslink Interconnector• High penetration of wind/solar
generators led to closures ofsynchronous generators
• Became very reliant on importingenergy from Victoria
• The interconnector is required to keepthe system frequency in balance
Heywood Interconnector
17

High Electricity Prices
Issues with renewables
High domestic gas price
Constrained Interconnectors
High WholesaleElectricity Prices
Provideinvestment signal
However, investment in generation is still low! !
18

19
Lack of Generation Investment
Uncertainty of government policies
• Policy instability and uncertainty driven by numerous reviews into therenewable energy target and a lack of clarity about the policies toreduce emissions after 2020
• Overlapping renewable energy (emissions reductions) targets at thestate and federal levels
• Carbon policy indecision led to uncertainties in investment of newpower generation

20
Closure of Coal-Fired Plants
WA
NT
SA
QLD
NSW
VIC
TAS
NORTHERN
240MWClosed 2016
PLAYFORD B
240MWClosed 2012
ANGLESEA
150MWClosed 2015
MORWELL
165MWClosed 2014 HAZELWOOD
1600MWClosed 2017
WALLERAWANG1000MWClosed 2014
MUNMORAH
600MWClosed 2012
REDBANK
151MWClosed 2014
SWANBANK B
480MWClosed 2012
COLLINSVILLE
190MWClosed 2012

21
Lack of Generation Investment
Uncertainty of domestic gas prices
• Uncertainty as to whether sufficient gas will be available to meet futuredomestic demand. This is due to supplies being diverted to meetinternational LNG supply contracts.
• Low levels of exploration, restrictions on onshore exploration andinfrastructure constraints resulted in uncertainty in domestic gas supply,which ultimately creates uncertainty for investment in new powergenerations

22
Australia Energy Plan
Future Energy Plan
South Australia
In March 2017, the state government unveiled AUD550 million power plan• Build a state-owned – 250MW gas-fired power station for emergencies• Support building the nation’s largest battery to store renewal energy• Encourage the construction of a new privately-owned power station by
tendering 75% of State Government electricity over next 10 years• Giving the state energy minister powers to direct generators to operate
and NEM to control flows on the interconnector

23
Australia Energy Plan
Future Energy Plan
Australia NEM
In June 2017:• Australia’s chief scientist Dr Alan Finkel made 50 recommendations to
improve the NEM• Federal Government has agreed to 49 of the recommendations• Except for the Clean Energy target recommendation

Europe Electricity Markets
24
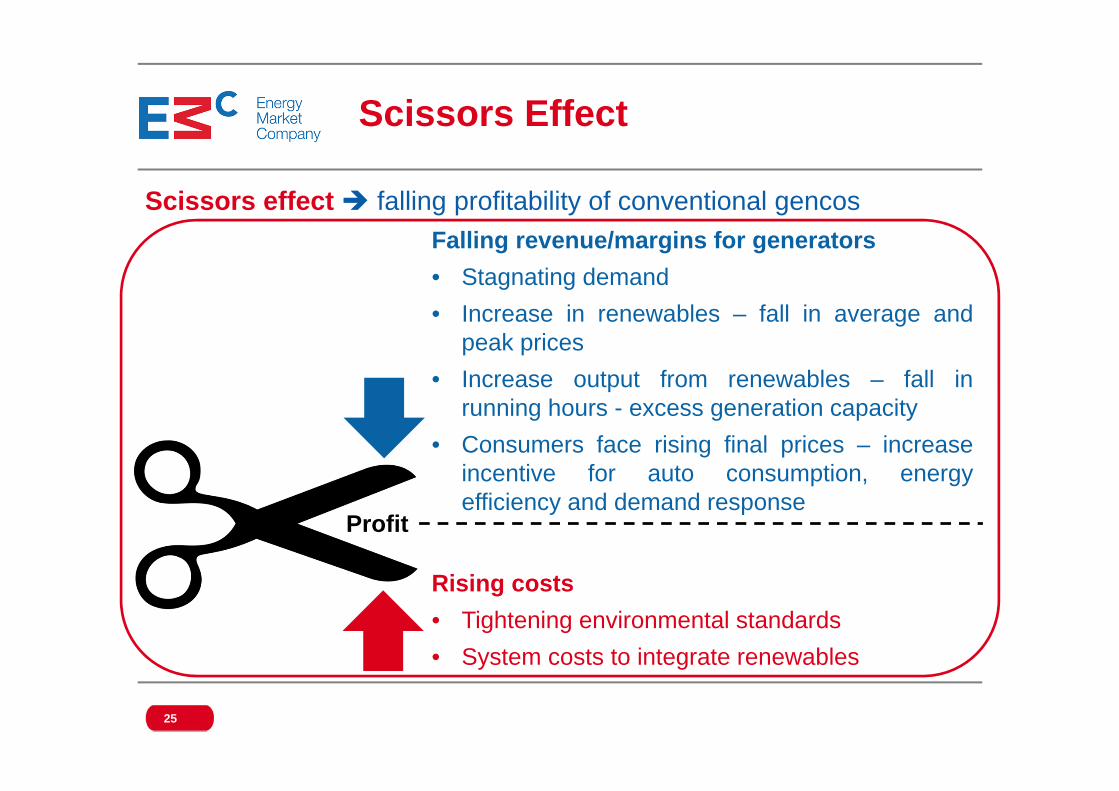
Scissors effect falling profitability of conventional gencos
Scissors Effect
Rising costs• Tightening environmental standards• System costs to integrate renewables
Falling revenue/margins for generators• Stagnating demand• Increase in renewables – fall in average and
peak prices• Increase output from renewables – fall in
running hours - excess generation capacity• Consumers face rising final prices – increase
incentive for auto consumption, energyefficiency and demand response
25
Profit

Electricity Demand in the EU-27, 2000–13
Stagnant Demand in Europe
Source: Power Statistics and Trends, Eurelectric, various years
26
Growth of renewables• Policy driven
• Has been leader in industrial development andinstallation of renewables especially wind and solar
• EU governments have levied significant funds throughelectricity tariffs to finance out-of-market payments todevelopers of renewable power
• Past 10 years, 80% of new generation capacity in OECDEurope has been renewable capacity
Renewables in Europe
27
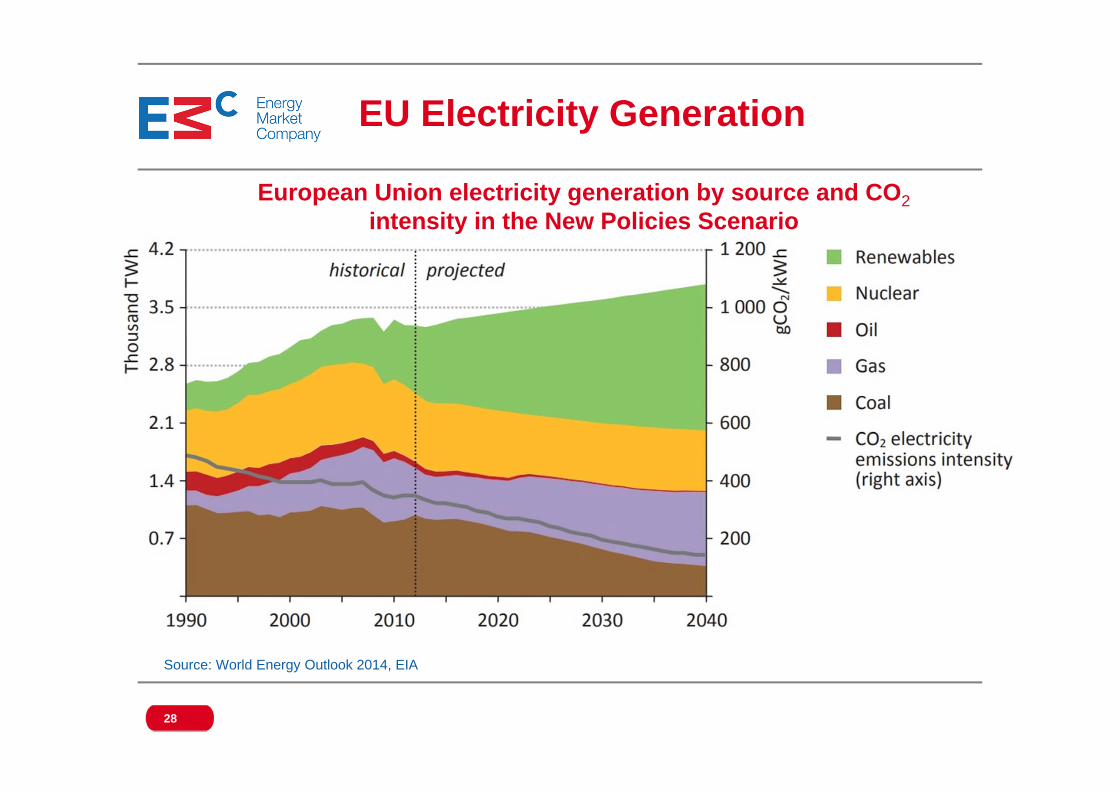
EU Electricity Generation
28
European Union electricity generation by source and CO2intensity in the New Policies Scenario
Source: World Energy Outlook 2014, EIA

EU Primary Energy Generation
29
Generation by primary energy - 2030 outlook in the EU 27
Source: Power Statistics and Trends 2013, Eurelectric

Renewables impact conventional generators’ revenue/margins
Impact of Renewables
30
Lowers average wholesale electricity prices
Peak prices falls lead to inability of conventional generatorsto recover fixed cost; as such plants rely solely on energymarket to recover their cost
Output effect – For conventional generators to recover theirfixed cost they must run sufficient hours where prices aregreater than their marginal cost. Growth of renewables haslowered capacity utilisation of conventional generators.

Wholesale market prices in selected EU countries, 2008-14
Falling Wholesale Prices in Europe
31
Source: OMIE, EEX
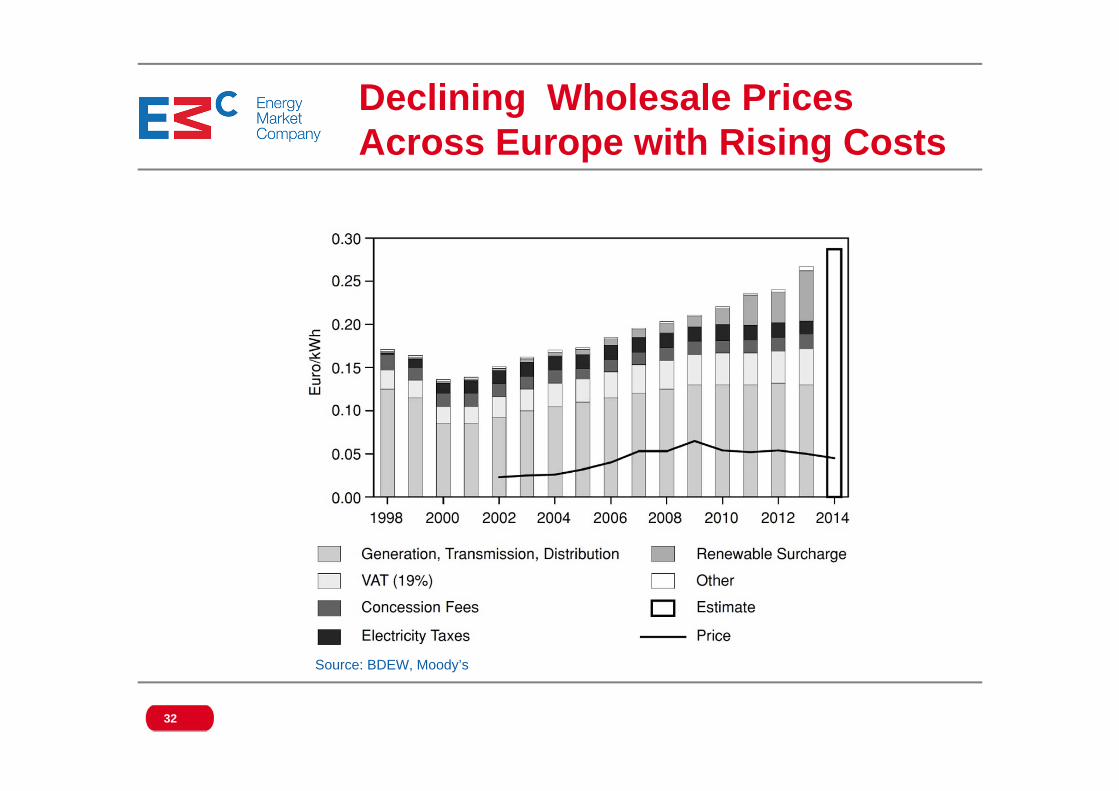
Declining Wholesale Prices Across Europe with Rising Costs
32
Source: BDEW, Moody’s

Operation of Gas Fired Plants (Spain)
Source: CNMC
Hours of effective operation of gas fired plants in Spain (2004-2014)
33

More auto consumption, energy efficiency and demandresponse lower demand and lower capacity utilisation ofconventional generators
Growth in Demand Response
34
High final prices faced by consumers incentivise autoconsumption, energy efficiency and demand response
Smart technologies reduce the cost of coordination andaggregation makes demand response more feasible

• Current electricity markets are designed for thetechnology of the 20th century
• The primary objective is to reflect the industry’s cost inprices
• Conventional plants fall naturally into a merit-orderapproach
• Low marginal cost and inflexible plants like nuclear at thebottom, high marginal cost flexible plants like OCGTs atthe top and base load plants like coal in the middle
Current Electricity Market Design
35

Stylised Merit Order
36
Source: Hunt, 2002

There is thus no incentive to invest in peaking plants orthose needed to balance the system due to variability ofrenewables’ energy output
Lack of Generation Investment
37
But increasing share of renewables in the energy mix whichdoes not have flexibility and essentially zero marginal costshas depressed both average and peak prices resulting in themissing money problem for conventional generators

Central planning and control of system – i.e.abandon liberalisation and revert to more centralisedapproaches but retain some market elements (e.g.auctions for capacity)
Potential Solutions
38
Range of potential “solutions” mooted
Refine energy only markets (e.g. introduce capacity mechanisms)
Drop out of market support for renewable resources

Investments Markets• Hive off the investment problem by creating a
market for the long term operating on the basis ofcompetitive arrangements like auctions
• Retain short-term markets along same lines aspresent
Potential Solutions
39
Introduce more flat rate or demand relatedelements into pricing (e.g. charge consumer anaccess fee to cover fixed charges and a separatemarginal cost to cover incremental cost)

A Two-Market System• Create two separate power markets for
generators
• Consumer choice between 2 different sets of supply
• As available power at relative low prices at times when sufficient supply available from low-carbon inflexible generators
• On demand power available at all times but at significant higher prices
40
Potential Solutions
X 2

41
The Two-Market System
On demand (flexible)
generators
As available intermittent generators
Support for low carbon
generators
System operator
Operator dispatches generators
Suppliers
On demand consumption
As available consumption
Electricity consumers
Income from as available
market
Income from flexibility market
Suppliers draw power
from grid

What About NEMS?
42

43
Installed Capacity
0
2,000
4,000
6,000
8,000
10,000
12,000
14,000
16,000
2003 2004 2005 2006 2007 2008 2009 2010 2011 2012 2013 2014 2015 2016 2017
MWInstalled Capacity (MW) CCGT/Cogen/Trigen (MW)Average Forecasted Demand (MW) Peak Forecasted Demand (MW)

44
Quarterly Average USEP vs Vesting Price, 2003 - 2016
$40
$90
$140
$190
$240
2003Q1
2004Q1
2005Q1
2006Q1
2007Q1
2008Q1
2009Q1
2010Q1
2011Q1
2012Q1
2013Q1
2014Q1
2015Q1
2016Q1
$/M
Wh
QuarterlyAverageUSEP
HedgePrice(PNG)
BVP
LVP(LNG)
2. PNG supplies
became scarce
1. Ample supply of PNGThe Lantau Group
defines three periods in NEMS
3. Increase in availability of natural gas

45
Energy-Only Market
• Generator’s sole remuneration is only from energy spot payment• In a competitive market, spot price = short run marginal cost (SRMC)• During supply scarcity, spot price > SRMC. Price spikes allow
generators to recover fixed capital costs.
Economic Theory of Energy-Only MarketEnergy-only markets with scarcity pricing provide efficient price signals for generation investments
Demand (normal)
Demand (high)
Price
Quantity (MW)
BaseloadMarginal
Cost
Peaker Marginal
Cost
• Use prices as signals• Prices spike when supply cushion is tight• Incentivise generation investment in the
long run

46
Quarterly USEP VS Estimated SRMC
0.00
50.00
100.00
150.00
200.00
250.00
300.00
$/M
Wh Quarterly
AverageUSEP
QuarterlyAverageEstimatedSRMC
2013 Q4

47
Vesting Contracts
10
20
30
40
50
60
70
Vest
ing
Con
trac
t Cov
erag
e (%
)
Year
Vesting Contract Rollback Schedule (Initial vs Actual)
InitialRollbackSchedule
ActualSchedule

48
Rise of Solar
Target of 1000MWp
>2020
0
100
200
300
400
500
600
700
800
900
1000D
ec-0
8Ju
n-09
Dec
-09
Jun-
10D
ec-1
0Ju
n-11
Dec
-11
Jun-
12D
ec-1
2Ju
n-13
Dec
-13
Jun-
14D
ec-1
4Ju
n-15
Dec
-15
Jun-
16D
ec-1
6Ju
n-17
Dec
-17
Jun-
18D
ec-1
8Ju
n-19
Dec
-19
Jun-
20D
ec-2
0
MW
pInstalled Capacity of Grid-Connected Solar PV Systems
Source: EMA Statistics

49
Demand Profile with 1000MW Solar
4500
5000
5500
6000
6500
7000
1 3 5 7 9 11 13 15 17 19 21 23 25 27 29 31 33 35 37 39 41 43 45 47
Dem
and
(MW
)
PeriodWeekday Weekend/ Public HolidaysNet Weekday profile (with 1000MW solar) Net Weekend profile (with 1000MW solar)
6:30am to 7:30pm (Period 14 – Period 39)
*Estimated using 2016 data

50
USEP Profile (2016)
0
10
20
30
40
50
60
70
80
90
100
1 2 3 4 5 6 7 8 9 10 111213 1415 161718 1920 212223 2425 2627 282930 3132 333435 3637 383940 4142 434445 4647 48
USE
P ($
/MW
h)
Weekday Weekend/Public Holidays

51
Carbon Pricing in Singapore
• Singapore government will introduce a carbon tax on large directemitters of greenhouse gases (GHGs) such as power stations from2019
• Singapore is looking at a carbon tax rate of $10-$20 per tonne of carbondioxide-equivalent GHG emissions
• The final tax rate (to be decided) needs to provide sufficient price signalto incentivise behavioural change and energy efficiency improvement
• Singapore has committed to reducing emissions intensity by 36% by2030 compared to 2005 levels

Thank you
52
Disclaimer:
This presentation is being made available for general information only and is subject to change without notice. While EMC has taken reasonable care EMC does not representand makes no warranty whatsoever whether express, implied or statutory that the information provided in this presentation is current, accurate, complete, fit, suitable or valid forany purpose or use whatsoever and EMC shall not be liable for any loss or damage of any kind (whether direct, indirect or consequential losses or other economic loss of anykind) suffered due to any omission, error, inaccuracy, incompleteness, or otherwise, and/or any reliance on such information.
Any recirculation, transmission or distribution of this presentation or any part thereof to and/or by any third party requires the prior written permission of EMC.