Embed Size (px)
Citation preview

Dividends are not guaranteed. Stock investing involves risk and possible loss of principal.
The Compelling Case for Dividend
Stocks in 2015 and Beyond
Executive Summary
• Dividend income and its reinvestment has comprised a significant
portion of long-term stock gains – For example, the Dow Jones
Industrial Average was at 10,800 on December 31, 2004 and 17,800 on
December 31, 2014 for a 10-year price advance of 7,000 points, or 65%,
but when dividends are included, the index gained 114% on a total
return basis.
• Dividend-paying stocks actually have delivered better long-term
total return performance than non-dividend payers by a score of
10.4% per annum to 8.5% per annum from 1927-2014, according to data
compiled by Professors Fama & French.
• Dividend-paying stocks have enjoyed lower volatility as the standard
deviation measure from 1927-2014 equals 18.3%, compared to 30.1% for
non-dividend payers.
• Dividends today compare very favorably to income that can be
generated from competing investments as the S&P 500 yields 2.0%,
a little better than the yield on the 10-year U.S. Treasury, the first time
stocks have looked so appealing on this comparison since 1958, aside
from a few months during the 2008-2009 Financial Crisis.
• Dividend-paying stocks have performed well in the past in periods
of rising interest rates, not to mention in the months before and after
an initiation of Federal Reserve tightenings of monetary policy.
Spring 2015

2
Recent Market History
Some have been warning that with the Federal Reserve likely to soon raise
interest rates, income-producing stocks will no longer be appealing. However,
such statements ignore the fact that investors actually have been more enthused
about non-dividend-paying companies for three years running as stocks without
a payout in the S&P 500 outperformed by a score of 14.7% to 13.6% in 2014, 46.5%
to 30.9% in 2013 and 20.2% to 15.5% in 2012. Looking at broader market data com-
piled by Professors Eugene F. Fama and Kenneth R. French, the story was similar
in two of the last three years. The duo evaluated all NYSE, AMEX and NASDAQ
stocks, breaking the list down into non-dividend payers as well as the lowest 30%,
the middle 40% and the highest 30% of dividend payers. While non-dividend pay-
ers outperformed in 2012 and 2013, they were a weaker performer in 2014, gaining
only 10.0% compared to 9.6%, 15.2% and 10.8% for the low-30%, mid-40% and high-
30%, respectively. Illustrating that it was a mixed picture for dividend payers last
year, the high-yielding Utilities sector enjoyed the best return (29%) of the 10 S&P
500 sectors, while payout-rich sectors like Energy, Telecommunications and Con-
sumer Staples received the least amount of love.
We suspect that few are complaining about returns the last three years, divi-
dends or no. And despite those gains, the forward (next 12 months) yield on the
S&P 500 is still 2.0%, while the Russell 3000 boasts an annual payout rate of 1.9%,
so we would think that dividends would continue to be appealing to the many folks
seeking income from their portfolios. This is especially true after non-income-pro-
ducing and formerly high-flying gold and silver have become a lot less precious,
while fixed income markets have seen volatility pick up even as interest rates rest
near historically low levels.
Miserable Traditional Options for IncomeNo doubt, numerous folks today are still more concerned with return of capi-
tal than return on capital and they are sitting in the safety of cash and cash-like
investments. Cash is the proper vehicle for those that can’t stomach any risk, but
placing one’s money into the modern-day equivalent of the mattress allows the
chance to earn a whopping two basis points (0.02%) on average in taxable money
market funds, according to iMoneyNet.com. Growth of capital is obviously not the
objective, but at the current money-market rate, cash will double in 3,467 years!
Others prefer U.S. Treasuries, where the yield on the 10-year note is currently
hovering around 1.9%, the yield on the 20-year bond is near 2.3% and the yield on
the 30-year bond is in the 2.5% range. Considering that inflation has averaged 3%
per annum over the past eight decades, those willing to accept the current yields
on 10-, 20- and 30-year Treasuries are likely to see a reduction in purchasing power
and little in the way of real return if they hold to maturity. And should they wish to
cash out prior to 2025, 2035 and 2045, respectively, they risk capital losses.
Looking across the pond, 2-year government bonds throughout much of Europe
have negative or near-zero yields, while Switzerland just cracked the zero barrier
with a 10-year bond issuance. And, believe it or not, we actually saw recently what
appeared to be the first instance ever of a corporate bond with maturity of more

3
than one year reach a negative yield when Swiss food giant Nestle’s €500 million
bond maturing in October 2016 slipped below zero. Certainly, we understand that
there are other factors at play in Europe as investors bet on currency movements,
deflation and the impact of the European Central Bank’s massive bond buying pro-
gram. Also, tremendous sums have poured into passive indexed products, mean-
ing that the managers have no choice but to buy, but we believe that the fact that
corporations can borrow at the lowest rates in history bolsters the appeal of stocks.
Dividend Yields Are FavorableClearly, equity investors must continue to steel their nerves for heightened
volatility, as concerns remain about the strong dollar and its impact on corporate
profit growth, the commodity price collapse, the slowdown in China, the Greek
debt drama, the crisis in Ukraine, the age of the Bull Market and elevated P/E ra-
tios. Also, the strength of the global economy is still very much in question, while
the Federal Reserve will most likely move to lift interest rates later this year. Nev-
ertheless, relative to Treasuries, dividend yields are about as attractive as they’ve
been in more than 50 years (see Figure 1). Aside from several months at the height
of the ’08-’09 Global Financial Crisis, the last time the yield on the S&P 500 was as
close as it is today to the yield on the 10-year Treasury was 1958.
What’s more, corporations have actually been boosting their payouts, as 381
members of the S&P 500 either raised or initiated a dividend in 2013 and 375 did
the same in 2014. And we do not see any reason for that trend to change, as Stan-
dard & Poor’s (as of April 17, 2015) estimates that (bottom-up) operating EPS will
rise from $113.01 in 2014 to $118.02 in 2015 and $134.27 in 2016, while corporate
balance sheets continue to be loaded with record levels of cash.
Yields on Treasuries have risen off their recent
lows, but they remain extraordinarily low by
historical standards, while dividend payouts
have been on the rise.
Figure 1:
Equities versus Treasuries
4
Value stocks (those trading for lower fundamental valuation metrics) are provid-
ing even more generous income streams. Breaking down our benchmark Russell
3000 index into its Value and Growth components, one finds the former sporting a
current forward yield of 2.3%, as of March 31, 2015, compared to 1.4% for the latter.
The forward yield of the Dow Jones Industrials is currently 2.3%, so the attractive
payouts are also available in the most well-known index.
While some may be less enthused about yields on stocks these days, dividends
and their reinvestment have long been a substantial contributor to the total return
on equities. The series was discontinued in 2013, but Morningstar calculated that
from 1927 through the end of 2012, the income component of total return amount-
ed to 42% for Large-Cap Stocks, 36% for Mid-Caps and 31% for Small-Caps.
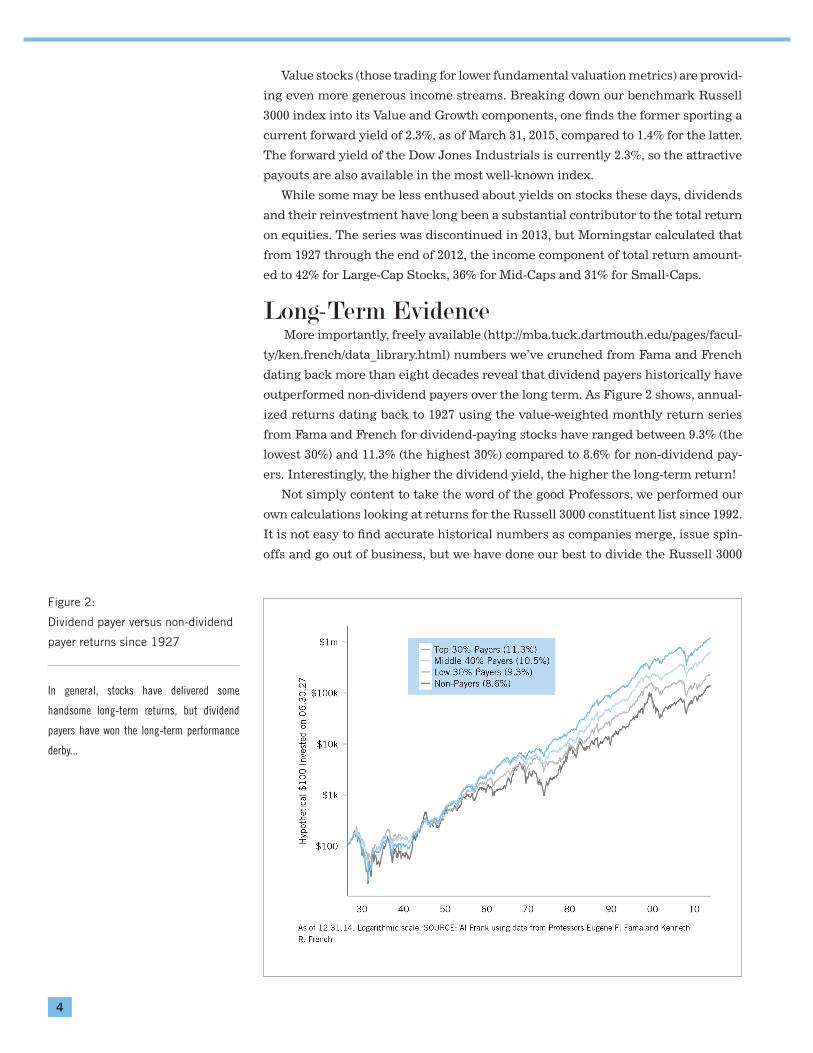
Long-Term Evidence More importantly, freely available (http://mba.tuck.dartmouth.edu/pages/facul-
ty/ken.french/data_library.html) numbers we’ve crunched from Fama and French
dating back more than eight decades reveal that dividend payers historically have
outperformed non-dividend payers over the long term. As Figure 2 shows, annual-
ized returns dating back to 1927 using the value-weighted monthly return series
from Fama and French for dividend-paying stocks have ranged between 9.3% (the
lowest 30%) and 11.3% (the highest 30%) compared to 8.6% for non-dividend pay-
ers. Interestingly, the higher the dividend yield, the higher the long-term return!
Not simply content to take the word of the good Professors, we performed our
own calculations looking at returns for the Russell 3000 constituent list since 1992.
It is not easy to find accurate historical numbers as companies merge, issue spin-
offs and go out of business, but we have done our best to divide the Russell 3000
In general, stocks have delivered some
handsome long-term returns, but dividend
payers have won the long-term performance
derby...
Figure 2:
Dividend payer versus non-dividend
payer returns since 1927
5
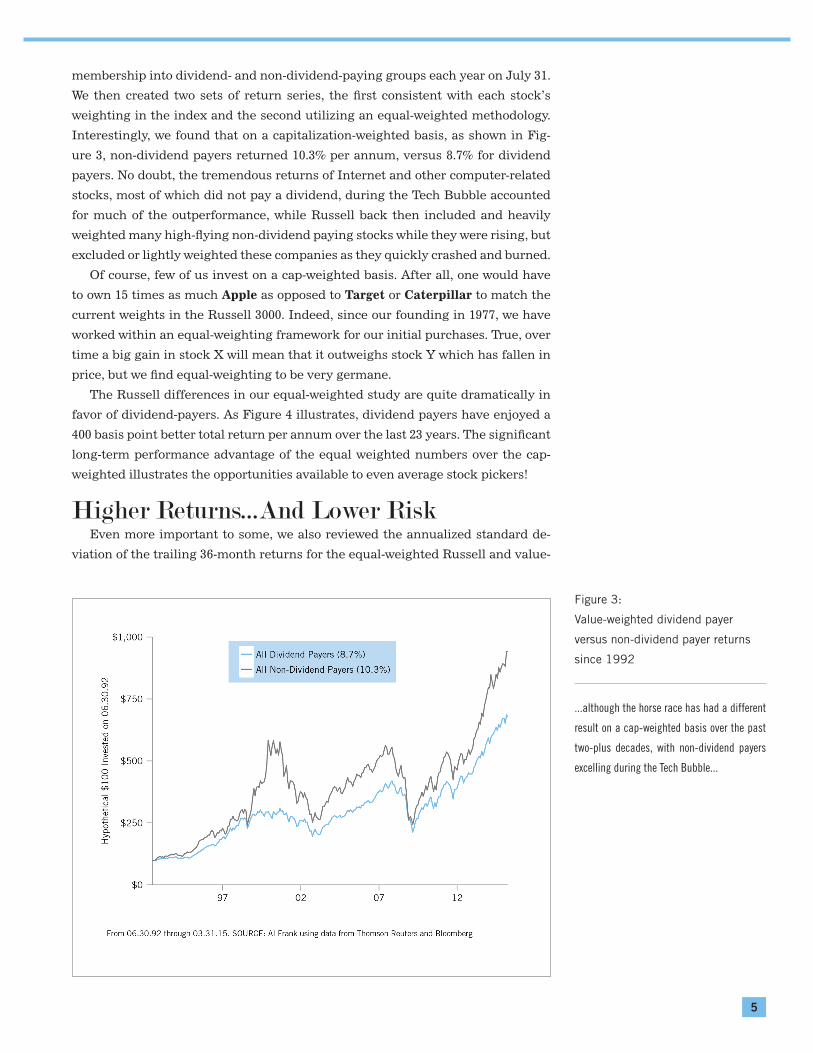
membership into dividend- and non-dividend-paying groups each year on July 31.
We then created two sets of return series, the first consistent with each stock’s
weighting in the index and the second utilizing an equal-weighted methodology.
Interestingly, we found that on a capitalization-weighted basis, as shown in Fig-
ure 3, non-dividend payers returned 10.3% per annum, versus 8.7% for dividend
payers. No doubt, the tremendous returns of Internet and other computer-related
stocks, most of which did not pay a dividend, during the Tech Bubble accounted
for much of the outperformance, while Russell back then included and heavily
weighted many high-flying non-dividend paying stocks while they were rising, but
excluded or lightly weighted these companies as they quickly crashed and burned.
Of course, few of us invest on a cap-weighted basis. After all, one would have
to own 15 times as much Apple as opposed to Target or Caterpillar to match the
current weights in the Russell 3000. Indeed, since our founding in 1977, we have
worked within an equal-weighting framework for our initial purchases. True, over
time a big gain in stock X will mean that it outweighs stock Y which has fallen in
price, but we find equal-weighting to be very germane.
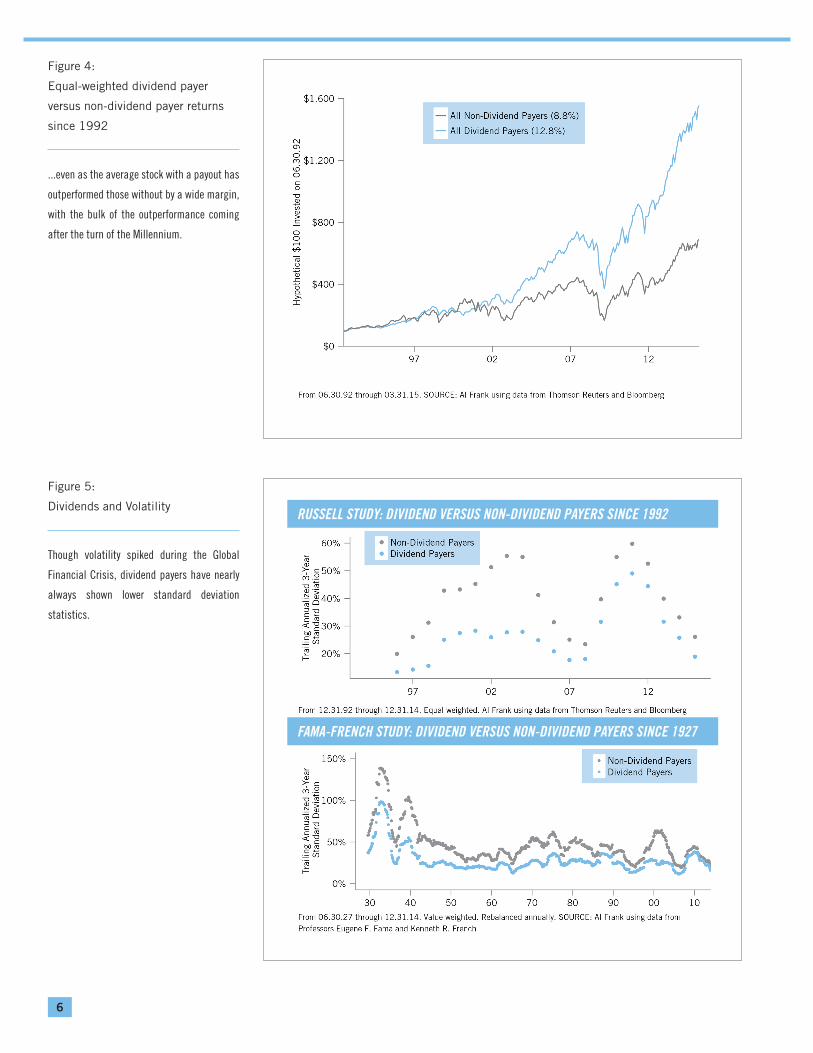
The Russell differences in our equal-weighted study are quite dramatically in
favor of dividend-payers. As Figure 4 illustrates, dividend payers have enjoyed a
400 basis point better total return per annum over the last 23 years. The significant
long-term performance advantage of the equal weighted numbers over the cap-
weighted illustrates the opportunities available to even average stock pickers!
Higher Returns...And Lower RiskEven more important to some, we also reviewed the annualized standard de-
viation of the trailing 36-month returns for the equal-weighted Russell and value-
...although the horse race has had a different
result on a cap-weighted basis over the past
two-plus decades, with non-dividend payers
excelling during the Tech Bubble...
Figure 3:
Value-weighted dividend payer
versus non-dividend payer returns
since 1992
6
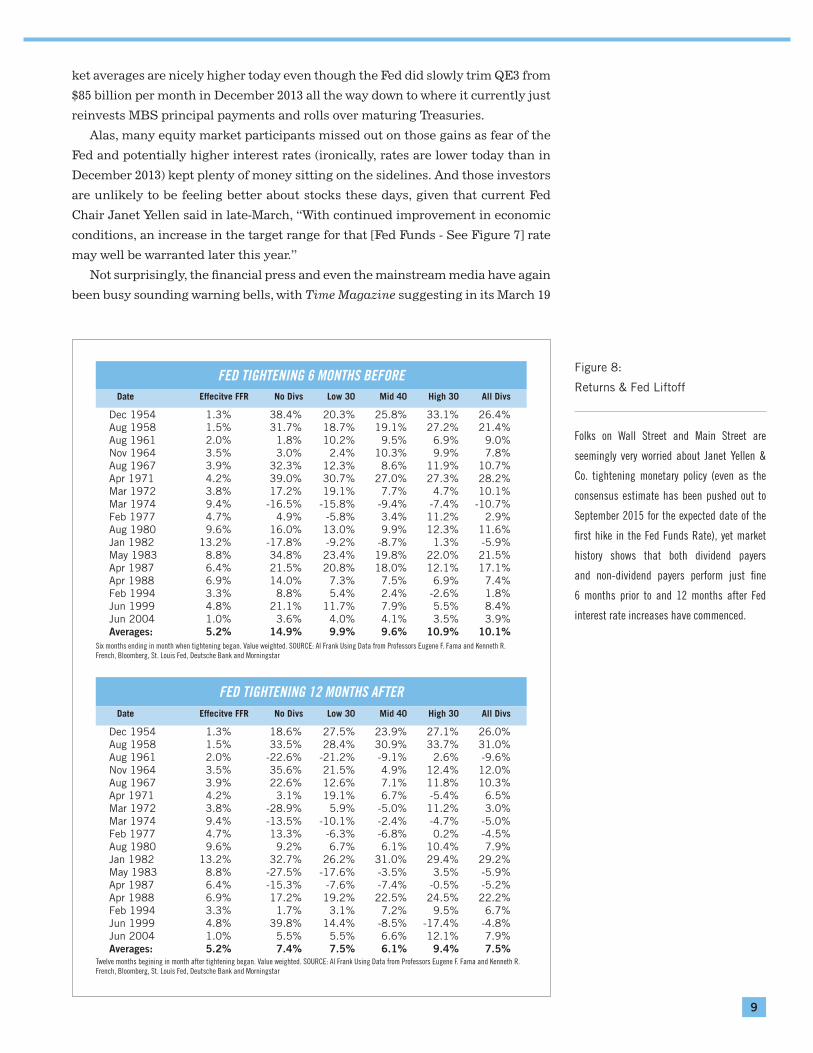
Though volatility spiked during the Global
Financial Crisis, dividend payers have nearly
always shown lower standard deviation
statistics.
Figure 5:
Dividends and Volatility RUSSELL STUDY: DIVIDEND VERSUS NON-DIVIDEND PAYERS SINCE 1992
FAMA-FRENCH STUDY: DIVIDEND VERSUS NON-DIVIDEND PAYERS SINCE 1927
...even as the average stock with a payout has
outperformed those without by a wide margin,
with the bulk of the outperformance coming
after the turn of the Millennium.
Figure 4:
Equal-weighted dividend payer
versus non-dividend payer returns
since 1992

7
weighted Fama-French (combining the dividend payers) data sets to determine the
spread of the numbers. Standard deviation is the square root of the variance, with
the variance defined as the average of the squared differences from the mean. In
simpler terms, the greater the standard deviation, the more volatile the return and
the higher the risk that the return will deviate from the norm. As shown in Figure
5, dividend payers, despite their strong return characteristics, have actually had
meaningfully lower standard deviation.
Given the historical evidence, we believe that dividend-payers deserve a large
portion of any equity allocation, and we’ve been incorporating dividends into our
valuation analytics for a long time now. However, we remain equal opportunity
stock pickers and we won’t discriminate against an undervalued company that
chooses not to currently pay a dividend. Our long-time holding of Apple, which
only in 2012 initiated a payout, provides one such example, though we must con-
fess that our recent recommendation of Gilead Sciences was made easier when
the biotech heavyweight issued a dividend for the first time this year.
We also note that dividend payers do not always outperform non-dividend pay-
ers. Figure 6 shows that there have been stretches over the past eight decades
when the tables have been turned. Interestingly, the periods of underperformance
include four of the last five full calendar years, with a significant gap in the returns
during 2009. That said, as contrarians, we don’t mind this recent trend, as the long-
term evidence overwhelmingly favors dividend payers. Thus the majority of our
recommendations offer a dividend yield, which we hope provides a little added
comfort in a very uncertain geopolitical and economic environment.
They’ve been the best long-term performers,
but over several multi-year occasions,
dividend payers have lagged behind, including
several of the more recent three-year periods.
Figure 6:
Three-year annualized returns since
1927

8
Adding Value To The MixOf course, we do not favor dividend-paying stocks for their yield alone, espe-
cially as the aforementioned historical data reveal that only 30% to 40% of the total
returns enjoyed by equities have come from income. With capital appreciation ac-
counting for the lion’s share of total return, we seek stocks that trade for inexpen-
sive valuations (low multiples of sales, earnings and book value, as the historical
data shows these are also excellent indicators of future price appreciation) first and
foremost, with dividends always a secondary factor in our analysis.
This in mind, we do not simply buy the highest yielding stocks, a strategy that
helped us in 2013, when rich-payout industry groups like Telecom Services, Utili-
ties and Real Estate Investment Trusts were the weakest performers, but hurt us
in 2014, when the latter two enjoyed gains in excess of 25%. The general underper-
formance of stocks with a yield over the last three years (in Q1 2015, the 81 non-
dividend payers in the S&P 500 actually outperformed the 419 dividend payers
by a score of 5.5% to 0.2%), in our view, suggests that there are more reasonable
market valuations for companies that return capital to holders via dividends.
Don’t Fear the FedMany attribute the latest weakness in relative performance for dividend payers
to worries about a possible tightening of monetary policy by the Federal Reserve.
Of course, stock prices managed to survive and thrive despite the May 2013 Taper
Tantrum, when then-Chairman Ben Bernanke suggested that the Fed would soon
start to reduce its massive bond buying program. QE3, as the quantitative easing
stimulus is known, then encompassed purchasing additional agency mortgage-
backed securities (MBS) at a pace of $40 billion per month and longer-term Trea-
sury securities at a pace of $45 billion per month. Likewise, the major equity mar-
Accommodative monetary policy eventually
will change, but it is a long way from near-
zero today on Fed Funds to the 4.87% median.
Figure 7:
S&P 500 Yield versus Fed Funds
Effective Rate
9
ket averages are nicely higher today even though the Fed did slowly trim QE3 from
$85 billion per month in December 2013 all the way down to where it currently just
reinvests MBS principal payments and rolls over maturing Treasuries.
Alas, many equity market participants missed out on those gains as fear of the
Fed and potentially higher interest rates (ironically, rates are lower today than in
December 2013) kept plenty of money sitting on the sidelines. And those investors
are unlikely to be feeling better about stocks these days, given that current Fed
Chair Janet Yellen said in late-March, “With continued improvement in economic
conditions, an increase in the target range for that [Fed Funds - See Figure 7] rate
may well be warranted later this year.”
Not surprisingly, the financial press and even the mainstream media have again
been busy sounding warning bells, with Time Magazine suggesting in its March 19
Folks on Wall Street and Main Street are
seemingly very worried about Janet Yellen &
Co. tightening monetary policy (even as the
consensus estimate has been pushed out to
September 2015 for the expected date of the
first hike in the Fed Funds Rate), yet market
history shows that both dividend payers
and non-dividend payers perform just fine
6 months prior to and 12 months after Fed
interest rate increases have commenced.
Figure 8:
Returns & Fed Liftoff
Six months ending in month when tightening began. Value weighted. SOURCE: Al Frank Using Data from Professors Eugene F. Fama and Kenneth R. French, Bloomberg, St. Louis Fed, Deutsche Bank and Morningstar
FED TIGHTENING 6 MONTHS BEFORE
Twelve months begining in month after tightening began. Value weighted. SOURCE: Al Frank Using Data from Professors Eugene F. Fama and Kenneth R. French, Bloomberg, St. Louis Fed, Deutsche Bank and Morningstar
Date Effecitve FFR No Divs Low 30 Mid 40 High 30 All Divs
Dec 1954 1.3% 18.6% 27.5% 23.9% 27.1% 26.0%Aug 1958 1.5% 33.5% 28.4% 30.9% 33.7% 31.0%Aug 1961 2.0% -22.6% -21.2% -9.1% 2.6% -9.6%Nov 1964 3.5% 35.6% 21.5% 4.9% 12.4% 12.0%Aug 1967 3.9% 22.6% 12.6% 7.1% 11.8% 10.3%Apr 1971 4.2% 3.1% 19.1% 6.7% -5.4% 6.5%Mar 1972 3.8% -28.9% 5.9% -5.0% 11.2% 3.0%Mar 1974 9.4% -13.5% -10.1% -2.4% -4.7% -5.0%Feb 1977 4.7% 13.3% -6.3% -6.8% 0.2% -4.5%Aug 1980 9.6% 9.2% 6.7% 6.1% 10.4% 7.9%Jan 1982 13.2% 32.7% 26.2% 31.0% 29.4% 29.2%May 1983 8.8% -27.5% -17.6% -3.5% 3.5% -5.9%Apr 1987 6.4% -15.3% -7.6% -7.4% -0.5% -5.2%Apr 1988 6.9% 17.2% 19.2% 22.5% 24.5% 22.2%Feb 1994 3.3% 1.7% 3.1% 7.2% 9.5% 6.7%Jun 1999 4.8% 39.8% 14.4% -8.5% -17.4% -4.8%Jun 2004 1.0% 5.5% 5.5% 6.6% 12.1% 7.9%Averages: 5.2% 7.4% 7.5% 6.1% 9.4% 7.5%
Date Effecitve FFR No Divs Low 30 Mid 40 High 30 All Divs
Dec 1954 1.3% 38.4% 20.3% 25.8% 33.1% 26.4%Aug 1958 1.5% 31.7% 18.7% 19.1% 27.2% 21.4%Aug 1961 2.0% 1.8% 10.2% 9.5% 6.9% 9.0%Nov 1964 3.5% 3.0% 2.4% 10.3% 9.9% 7.8%Aug 1967 3.9% 32.3% 12.3% 8.6% 11.9% 10.7%Apr 1971 4.2% 39.0% 30.7% 27.0% 27.3% 28.2%Mar 1972 3.8% 17.2% 19.1% 7.7% 4.7% 10.1%Mar 1974 9.4% -16.5% -15.8% -9.4% -7.4% -10.7%Feb 1977 4.7% 4.9% -5.8% 3.4% 11.2% 2.9%Aug 1980 9.6% 16.0% 13.0% 9.9% 12.3% 11.6%Jan 1982 13.2% -17.8% -9.2% -8.7% 1.3% -5.9%May 1983 8.8% 34.8% 23.4% 19.8% 22.0% 21.5%Apr 1987 6.4% 21.5% 20.8% 18.0% 12.1% 17.1%Apr 1988 6.9% 14.0% 7.3% 7.5% 6.9% 7.4%Feb 1994 3.3% 8.8% 5.4% 2.4% -2.6% 1.8%Jun 1999 4.8% 21.1% 11.7% 7.9% 5.5% 8.4%Jun 2004 1.0% 3.6% 4.0% 4.1% 3.5% 3.9%Averages: 5.2% 14.9% 9.9% 9.6% 10.9% 10.1%
FED TIGHTENING 12 MONTHS AFTER

10
edition, “The Fed has initiated a tightening cycle 16 times since the end of World
War II. In 13 instances, the market fell in the six months leading up to the rate in-
crease.” Sounds ominous, especially as numbers from the reputable data provider
S&P Capital IQ are cited, until one takes a look at what has actually occurred (see
Figure 8) for the full time-spans before and after the Fed has begun to tighten.
We do not mean to infer that equities would rather rates were rising (even as
the stronger economic growth necessary to compel the Fed to move today is hardly
a negative backdrop for corporate profits), but the analysis we’ve undertaken (the
good folks at S&P confirmed via email that our data was correct) suggests that one
should not believe everything that appears in print. Indeed, stocks have actually
gained ground for the full six months prior to the start of Fed tightenings on all
but a couple of occasions. Same thing goes for 12 months after. No doubt, there has
been plenty of volatility surrounding major Fed moves, with sizable short-term
losses sometimes suffered by those who can’t stomach the fluctuations (which we
are told was the gist of the S&P data), but those willing to remain patient have
been rewarded more often than not.
Of course, given that the U.S. economy grew by only 2.2% in Q4 2015, with the
strong dollar and nasty weather likely to hamper Q1 2015 GDP growth, while the
Fed’s longer-run goals of maximum employment and inflation of 2% currently are
not being met, the timing of the first rate increase is very much in question. Con-
sensus estimates have been pushed out to September, but the Fed continuously
has stated that any monetary policy moves will be data, not calendar, dependent.
And lest there be fear that rates will soon spike sharply, Ms. Yellen said recently,
“The average pace of tightening observed during previous recoveries could well
provide a highly misleading guide to the actual course of monetary policy over the
next few years.” Also easing worries, the Fed has been very clear that economic
conditions may, for some time, warrant keeping the Fed Funds rate below levels it
views as normal in the longer run, while Federal Reserve Vice-Chair Stanley Fisch-
er recently said, “When we raise the interest rate, we will be moving from an ultra-
expansionary monetary policy to an extremely expansionary monetary policy.”
In ConclusionWe at AFAM Capital do not simply accept conventional wisdom—we do our own
homework and crunch our own numbers to ensure that what we believe philosoph-
ically actually corresponds to what has proven to be successful from a historical
perspective. While past performance can never predict future results, our long-
time emphasis on undervalued dividend-paying stocks (on the page that follows,
we have selected a diversified listing of 25 of our current favorites, each of which
yields at least 1.5%) is validated by more than eight decades of market history. Not
quite the Holy Grail of investing, but it is nice to see that over the long term divi-
dend-paying stocks on average historically have outperformed non-paying stocks
and they have done so with lower volatility!
For more information on our private managed accounts, please call 512.600.1818 or email [email protected].

11
AAPL Apple 124.75 142.56 16.8 3.6 6.4 8.9 25% 1.5% 726,637 Technology Hardware
AMGN Amgen 163.58 196.06 22.0 6.2 nmf 15.6 nmf 1.9% 123,979 Pharma/Biotech/Life Sci
AUY Yamana Gold 4.02 7.79 nmf 2.5 0.7 nmf 32% 1.5% 3,784 Materials
BAX Baxter International 69.91 95.07 13.6 2.3 17.5 11.7 351% 3.0% 37,998 Health Care Equip/Srvcs
BMR BioMed Realty Trust 21.01 28.95 21.4 nmf 1.4 nmf nmf 5.0% 4,277 Real Estate
CAT Caterpillar 83.28 106.64 13.1 0.9 7.2 6.5 398% 3.4% 50,482 Capital Goods
CM Canadian Imperial Bank 78.51 96.20 8.7 nmf 2.0 nmf nmf 5.4% 31,184 Banks
ESV Ensco PLC 24.85 40.96 3.9 1.2 0.7 nmf 75% 2.4% 5,823 Energy
ETN Eaton Corp PLC 69.11 85.63 14.8 1.4 nmf 14.5 nmf 3.2% 32,310 Capital Goods
ETR Entergy 77.29 90.21 13.3 1.1 1.4 6.6 130% 4.3% 13,952 Utilities
HFC HollyFrontier 37.92 56.01 13.6 0.4 2.5 9.1 35% 3.4% 7,401 Energy
IBM Int’l Business Machines 160.67 223.41 9.8 1.7 nmf 8.9 nmf 2.7% 158,810 Software & Services
INTC Intel 32.47 40.23 13.7 2.8 3.8 6.1 30% 3.0% 153,979 Semiconductors
JNJ Johnson & Johnson 99.58 117.06 16.6 3.8 13.4 10.7 73% 2.8% 276,888 Pharma/Biotech/Life Sci
MDC MDC Holdings 27.93 42.97 17.6 0.8 1.1 18.9 74% 3.6% 1,364 Consumer Durables
MOS Mosaic Co 45.32 69.88 17.1 1.9 1.9 8.9 42% 2.2% 17,007 Materials
MSFT Microsoft 41.62 52.09 15.5 3.7 5.4 8.7 33% 3.0% 341,401 Software & Services
NM Navios Maritime Holdings 4.02 7.04 nmf 0.7 0.5 9.4 204% 6.0% 420 Transportation
ONB Old National Bancorp 13.96 20.89 13.3 nmf 1.8 nmf nmf 3.4% 1,643 Banks
PRU Prudential Financial 79.13 110.15 8.6 0.7 1.0 nmf 42% 2.9% 35,940 Insurance
SFL Ship Finance Int’l 15.52 19.91 11.7 4.4 1.3 13.8 134% 10.8% 1,447 Energy
SPLS Staples 16.03 19.21 16.4 0.5 4.5 13.9 45% 3.0% 10,267 Retailing
STX Seagate Technology PLC 57.43 71.33 11.8 1.3 9.9 6.7 205% 3.8% 18,856 Technology Hardware
T AT&T 32.51 39.04 13.0 1.3 nmf 8.1 nmf 5.8% 168,732 Telecom Services
WMT Wal-Mart Stores 77.88 95.84 15.4 0.5 4.0 8.2 69% 2.5% 251,246 Food & Staples Retailing
Our approach focuses on broadly diversified invest-
ments in undervalued stocks for their long-term ap-
preciation potential. Does that mean we build portfolios
of 20 stocks...30...? More like 50 and up. We like stocks.
And we like a lot of ‘em. We don’t rely nearly as much on
“how many” as we do “in which,” but we tend to invest in
far more names than most. This expansive diversification,
we find, potentially serves us well in two ways: we can
further minimize the risk of individual stock ownership,
while maximizing the likelihood of finding the truly big
winners among the undervalued masses.
As for the “in which” part, readers should know we dis-
criminate among potential investments primarily by their
relative valuation metrics and our assessments of stock-
specific risk. We buy only those stocks we find underval-
ued along several lines relative to their own trading his-
The Prudent Speculator’s Dividend Favorites
tory, those of their peers or that of the market in general.
The prices at which we’ll buy and sell stocks incorporate
a range of fundamental risks (e.g. credit, customer and
competitive dynamic) that we believe the companies may
face over our normal 3-to-5-year investing time horizon.
Each stock is trading for a significant discount to our
determination of long-term fair value and/or offering fa-
vorable risk/reward profiles. Note that, while we always
seek substantial capital gains, we require lower appre-
ciation potential for stocks that we deem to have more
stable earnings streams, more diversified businesses and
stronger balance sheets. The natural corollary is that risk-
ier companies must offer far greater upside to warrant a
recommendation. Further, as total return is how perfor-
mance is ultimately judged, we explicitly factor dividend
payments into our analytical work.
As of 04.17.15. A list of all previously recommended stocks are available on our Web site: https://theprudentspeculator.com/sample-pieces/#form6. N/A=Not applicable. nmf=Not meaningful. 1Tangible book value. 2Enterprise value-to-earnings before interest taxes depreciation and amortization. 3Tangible equity. SOURCE: Al Frank using data from Bloomberg
Target Price Multiples EV/ Debt/ Div Mkt Symb Company Price Price EPS S TBV1 EBITDA2 TE3 Yld Cap Industry Group
Al Frank Asset Management, Inc
30 Enterprise, Suite 210
Aliso Viejo, CA 92656
P: 949.499.3215 / 888.994.6827 F: 949.606.1905
A division of:
AFAM Capital, Inc.
12117 FM 2244, Bldg. 3, Suite 170
Austin, TX 78738
AFAM Capital is committed to assisting our clients build wealth. We are a resource for
value-based investor information in the financial community, where we combine our
simple philosophy of buying securities that we believe are undervalued for their long-
term capital appreciation. We use our experience, hard work and intensive research to
provide actionable investment information that can be used by individual investors.
For information regarding managed accounts,
please call us toll free at 888.994.6827
or visit us at alfrank.com.
Important Information
Readers should know we discriminate among potential investments primarily by their relative valuation metrics and our assessments of stock-specific risk. We buy only those stocks we find undervalued along several lines relative to their own trading history, those of their peers or that of the market in general. The prices at which we’ll buy and sell stocks incorporate a range of fundamental risks (e.g. credit, customer and competitive dynamic) that we believe the companies may face over our normal 3-to-5-year investing time horizon.
It is important to note that the Russell study period is quite short compared to the history of the market and that the findings from this portion of the study would not necessarily hold over to future periods.
To perform the Russell portion of the study from 1992 to present, we constructed a portfolio that mimics the Russell 3000 index. We first utilized a dividend payment series developed with Thomson Reuters and Russell Investments to categorize each member of the Russell 3000 into dividend- and non-dividend-paying groups for each month from July 1992 through December 2013. A stock was considered a dividend payer if it had paid a dividend in the last twelve months. We utilized the last day of each July as, generally speaking, index membership subsequent to that day each year accounts for changes from the annual reconstitution of the index. From those two groups we then generated an equal-weighted portfolio return series, in addition to a capitalization-weighted return series consistent with each stock’s actual weighting in the Russell 3000. Companies in the Russell 3000 without performance history were removed each month, after the companies were broken into the various groups. The resulting returns series, combined with the actual Russell 3000 return series, form the basis of this study.
To perform the portion of the study from 1927 to present, we utilized the dividend-weighted portfolio data from Eugene F. Fama and Kenneth R. French. The dataset is broken into five groups: non-dividend paying, top 30% of dividend payers, middle 40% of dividend payers, bottom 30% of dividend payers and all dividend payers (weighted 30% of top dividend payers, 40% of middle dividend payers and 30% of low dividend payers).
Opinions expressed are those of Al Frank Asset Management, a division of AFAM Capital, Inc., are subject to change without notice and are not intended to be a forecast of future events, a guarantee of future results or investment advice.
Past performance may not be indicative of future results. Therefore, you should not assume that the future performance of any specific investment or investment strategy will be profitable or equal to corresponding past performance levels.
AFAM Capital, Inc. is registered with the Securities & Exchange Commission, is editor of The Prudent Speculator (TPS) newsletter and is the Investment Advisor to certain no-load proprietary mutual funds and individually managed client accounts. Registration of an investment advisor does not imply any level of skill or training.
AFAM adheres to the same investment principles and philosophies in managing value-oriented individual client accounts, its proprietary value mutual funds and in the information that appears in its investment advisory newsletter, which is long-term growth of capital by owning a diversified portfolio of securities that are undervalued and holding them for their long-term potential appreciation. Diversification does not protect against loss in declining markets.
As adviser to its own proprietary mutual funds and manager of individual client accounts, AFAM may purchase, sell or hold positions in the securities that appear in this presentation. Also, employees may hold, purchase or sell any of the stocks that appear in this presentation subject to AFAM’s Code of Ethics, Insider Trading, and Personal Trading policies.
166-AFAM-4/17/2015