Embed Size (px)
Citation preview

Great Expectations Evaluation, 2003-2004 i
Executive Summary Great Expectations (GE) is a teacher/administrator professional development program that provides teachers and administrators with the skills and knowledge needed to improve academic achievement, school climate, attendance, and parent involvement. GE is founded on the fundamental belief that education is the key to solving the problems of our society, that educators want to become more skilled in their quest to educate students, and that students want to learn. The founders of GE believe that, while there is discussion of educational reform, too little is being done to positively affect student achievement. The main objective of GE is to increase students’ intellectual knowledge, self-esteem, and social competencies. To accomplish this, GE focuses on the transformation of educators (through professional development) and the transformation of schools (through organizational change). GE strives to help educators re-examine their teaching methods and interactions with students as well as assist them in redefining their values and beliefs about learning processes. The GE Board of Directors meets regularly to review program activities, monitor financial status, assess program strengths and weaknesses, and make decisions about future endeavors. GE professional development activities are high quality, sustained, intensive, and classroom-focused in order to have a positive and lasting impact on classroom instruction and the teacher’ performance in the classroom and are not one-day or short-term workshops or conferences. • Great Expectations training consists of 28 hours of actual class time. Follow-up
opportunities include the following: • One regional training day in the fall consisting of five hours • Two Saturday sessions in the fall consisting of three hours each • One regional training day in the spring consisting of five hours • One Saturday session in the spring consisting of three hours • Mentor services available upon request • Ongoing opportunities available through the use of the website-blogs,
forums, electronic newsletter, etc. • Distance learning sessions. According to the SEDL evaluation of Great Expectations professional development, “Teachers who implement Great Expectations at a high level create a learning community in their classrooms. Students engage each other in learning tasks and there is a sense of congeniality and togetherness exhibited by both teacher and students. Students in these classrooms are ready, willing, and eager to take on learning activities and challenges presented to them.”

Great Expectations Evaluation, 2003-2004 ii
Given the need for scientifically based data on program effectiveness, an independent research unit, the Educational Training, Evaluation, Assessment and Measurement Department (E-TEAM) in the College of Continuing Education at the University of Oklahoma designed and conducted this quasi-experimental study to determine if students in classrooms of teachers implementing Great Expectations demonstrate greater gains in achievement on a standardized student achievement test during the school year as compared to students in demographically similar classrooms not implementing Great Expectations (GE). Principals, teachers, students, and parents were surveyed to examine attitudes and beliefs relevant to implementation of GE practices and other aspects of the environment that could affect student achievement. Participating classrooms were observed to document implementation of GE Practices, and administrative data was collected on referrals, absences, and suspensions. This study utilizes scientific methodologies that meet the silver standard of research identified by the What Works Clearinghouse. To meet the silver standard, at least one variable that might theoretically affect outcomes cannot be controlled. In this study it was not possible to randomly assign students to treatment conditions. Consequently, to minimize the potential for initial student differences that affect outcomes, researchers matched students in the treatment and comparison groups on race, English proficiency, and pre-test scores on the TerraNova. Eleven hundred fifty students of 78 teachers in 46 elementary schools located in 33 Oklahoma towns participated in the study. Participating schools reported an average of 250-400 students and 25 staff. Slightly less that half of the students qualified for free/reduced price lunch. There were no demographic differences between GE and non-GE teachers. Most participating teachers were female and white, and most had completed a bachelor’s degree. There was no significant difference between GE and non-GE teachers in the number of years they reported teaching school or in the number of years they reported teaching their current grade. Most participating teachers teach in a self-contained classroom. There were no significant differences between principals of GE and non-GE teachers in the percentage reporting regularly scheduled grade-level planning meetings, regularly scheduled cross-grade-level planning meetings, or instructional planning meetings attended by the principal. Principals of GE teachers did not differ significantly from principals of non-GE teachers on their perceptions of interactions with teachers or in their beliefs regarding their ability to make a difference in student achievement. There were significant differences between GE and non-GE teachers and principals in reports of attitudes and behavior related to GE and in their perceptions of students. GE principals and teachers were more likely to designate students as greeters; use quotes to refocus students' attention, remind
Great Expectations Evaluation, 2003-2004 iii
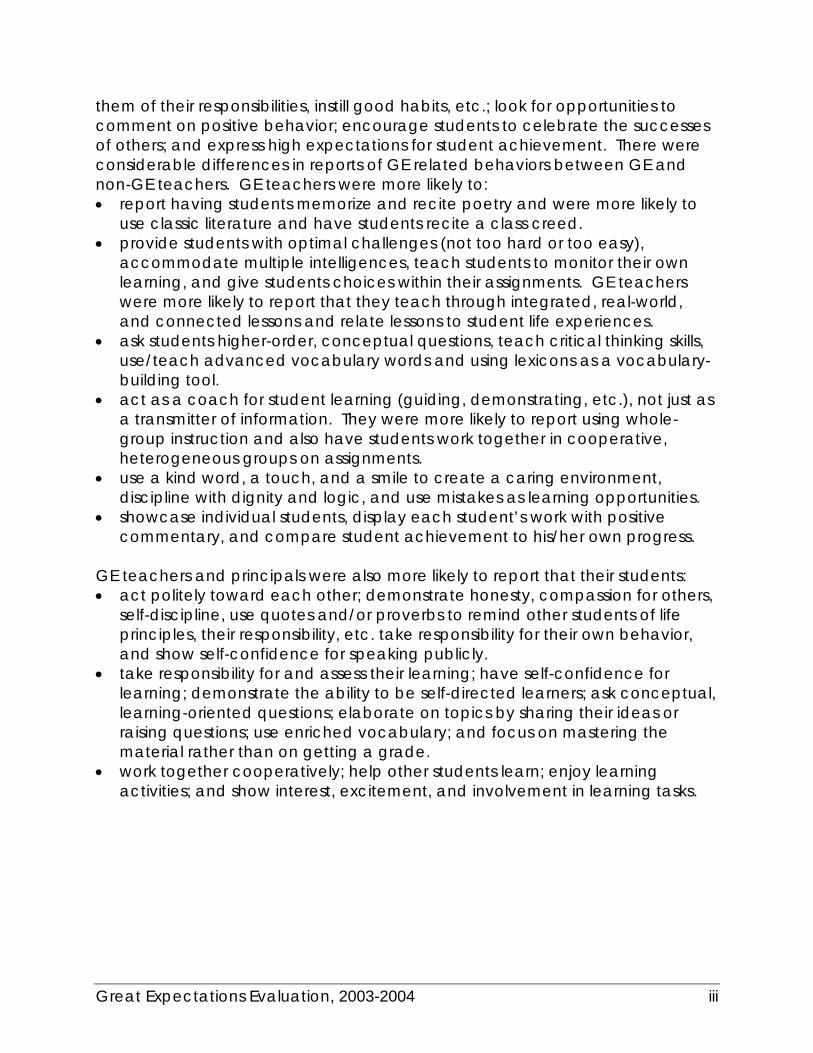
them of their responsibilities, instill good habits, etc.; look for opportunities to comment on positive behavior; encourage students to celebrate the successes of others; and express high expectations for student achievement. There were considerable differences in reports of GE related behaviors between GE and non-GE teachers. GE teachers were more likely to: • report having students memorize and recite poetry and were more likely to
use classic literature and have students recite a class creed. • provide students with optimal challenges (not too hard or too easy),
accommodate multiple intelligences, teach students to monitor their own learning, and give students choices within their assignments. GE teachers were more likely to report that they teach through integrated, real-world, and connected lessons and relate lessons to student life experiences.
• ask students higher-order, conceptual questions, teach critical thinking skills, use/teach advanced vocabulary words and using lexicons as a vocabulary-building tool.
• act as a coach for student learning (guiding, demonstrating, etc.), not just as a transmitter of information. They were more likely to report using whole-group instruction and also have students work together in cooperative, heterogeneous groups on assignments.
• use a kind word, a touch, and a smile to create a caring environment, discipline with dignity and logic, and use mistakes as learning opportunities.
• showcase individual students, display each student’s work with positive commentary, and compare student achievement to his/her own progress.
GE teachers and principals were also more likely to report that their students: • act politely toward each other; demonstrate honesty, compassion for others,
self-discipline, use quotes and/or proverbs to remind other students of life principles, their responsibility, etc. take responsibility for their own behavior, and show self-confidence for speaking publicly.
• take responsibility for and assess their learning; have self-confidence for learning; demonstrate the ability to be self-directed learners; ask conceptual, learning-oriented questions; elaborate on topics by sharing their ideas or raising questions; use enriched vocabulary; and focus on mastering the material rather than on getting a grade.
• work together cooperatively; help other students learn; enjoy learning activities; and show interest, excitement, and involvement in learning tasks.

Great Expectations Evaluation, 2003-2004 iv
Parents of GE students (especially first grade students) also were more likely to report observing GE-related behaviors from their children. Across first, third and fifth grades, parents of GE students were more likely to say their child:
All Grades First Grade Third Grade Fifth Grade • Talks about classic
literature • Shows interest,
excitement, and involvement in learning
• Enjoys learning activities
• Takes responsibility for his or her learning
• Takes responsibility for his or her own behavior
• Talks about classic literature
• Takes responsibility for his or her own behavior
• Uses critical thinking skills
• Displays compassion for others
• Is responsible • Speaks in complete
sentences • Shares ideas or
raises questions • Is polite with his or
her friends
• Talks about classic literature
• Is self-disciplined • Shows interest,
excitement, and involvement in learning
• Uses quotes he or she learned at school
• Enjoys learning activities
Across all grades and for first grade, GE parents were significantly more likely to rate their children’s teachers as “Excellent” or “Exceptional” than were non-GE parents. Students were also given a survey that asked for ratings of various GE-related attitudes and behavior. There were no significant differences noted between GE and non-GE first graders on reports of feelings toward school or the things they learn in school, specifically reading and math. The majority of students indicated they have positive feelings about their teacher, their friends, students in their class, and themselves. Approximately three quarters of students indicated they have positive feelings about how other students in their class treat them. Differences between GE and non-GE first graders approached statistical significance for two items, 1) how students felt about their teacher and 2) how students felt about how other students treat them. GE third graders scored significantly higher on Self-Management than did non-GE third graders. This difference was primarily due to GE students being more likely to indicate they can stay calm when others are upset. GE fifth graders scored significantly higher on Self-Awareness, Self-Management and Higher Order Thinking Skills than did non-GE fifth graders. GE fifth graders were more likely to report that they think about what will happen before they do something, that it is up to them to do well in school, and that they like to find out the facts and make up their own mind about things.
Great Expectations Evaluation, 2003-2004 v
Administrative data was collected to look at other behavioral indicators. There were no differences evident between GE and non-GE teacher or student absences during the school year. There were also no significant differences between GE and non-GE classrooms in the number of referrals, number of students referred, repeat referrals, or number of suspensions. A structured protocol was used by trained observers (blind to experimental condition) to observe both GE and non-GE classrooms. The majority of observations were conducted during reading or language arts instruction. As expected, observers noted that the GE classrooms were significantly more likely to display GE program components than were non-GE classrooms. GE teachers were twice as likely to have classic literature in their classrooms and were three times more likely than non-GE teachers to display a word of the week in the classroom. Non-GE teachers observed were three times more likely than the GE teachers to have a defined time out area evident in their classroom or to display a behavior management system. GE students were ten times more likely to have created a lexicon than non-GE students. GE teachers were significantly more likely than non-GE teachers to be rated as positive, respectful, encouraging, and facilitative to their students and significantly less likely to be rated as rude, punitive, critical, or authoritative. Observers indicated that 100% of GE teachers and 90% of non-GE teachers were rarely critical or rude. The difference between GE and non-GE teachers was more pronounced for ratings of punitive teacher-to-student interactions. One hundred percent of GE teachers were rated as being rarely punitive, compared to only 77% of non-GE teachers. Two percent of GE teachers were rated as being authoritative during the observation, compared to 39% of non-GE teachers. GE students were 1 to 1.5 times more likely than non-GE students to be rated as positive, respectful, and encouraging in their interactions with other students. The percentage of GE classrooms for which there was either moderate or strong evidence of Practice implementation varied. Ten Practices were implemented in 90% or more GE classrooms, six Practices were implemented in 80-89% of GE classrooms, and one Practice was implemented in 68% of classrooms. The percentage of no-GE classrooms for which there was either moderate or strong evidence of Practice implementation varied. Seven Practices were implemented in 50% or more non-GE classrooms, six Practices were implemented in 25-49% of GE classrooms, and four Practices were implemented in less than 25% of non-GE classrooms. Observers rated GE classrooms significantly higher on implementation of all 17 GE Practices. These differences were evident for observer ratings of both teachers and students. There was substantial variation in the magnitude of

Great Expectations Evaluation, 2003-2004 vi
differences in implementation of GE Practices between GE and non-GE classrooms. GE classrooms were: • 25.1 times more likely to have a student greet visitors than were non-GE
classrooms (Practice 16). Observers reported moderate to strong evidence of overall Practice 16 implementation in 81.0% of GE classrooms, compared to 3.2% of non-GE classrooms.
• 7.6 times more likely to contain evidence that memory work, recitations, and/or writing occur daily (Practice 7). Observers reported moderate to strong evidence of overall Practice 7 implementation in 97.6% of GE classrooms, compared to 12.9% of non-GE classrooms.
• 6.8 times more likely than were non-GE classrooms to exhibit evidence of enriched vocabulary drawn directly from challenging writings and/or wisdom literature (Practice 8). Observers reported moderate to strong evidence of overall Practice 8 implementation in 68.3% of GE classrooms, compared to 10.0% of non-GE classrooms.
• 3.6 times more likely than non-GE classrooms to exhibit evidence that a school, class, or personal creed is recited or reflected upon daily to reaffirm commitment to excellence (Practice 13). Observers reported moderate to strong evidence of overall Practice 13 implementation in 92.9% of GE classrooms, compared to 25.8% of non-GE classrooms.
• 3.5 times more likely than non-GE classrooms to exhibit evidence that word identification skills are used as a foundation for expanding the use of the English language (Practice 11). Observers reported moderate to strong evidence of overall Practice 11 implementation in 82.1% of GE classrooms, compared to 23.3% of non-GE classrooms. As part of Practice 11, GE teachers were almost three times more likely to use lexicons to enhance understanding of vocabulary, 1.6 times more likely to use vocabulary development strategies and to use systematic and explicit instruction on the relationship between spoken sounds and written letters, 1.5 times more likely to use explicit strategies to increase reading comprehension of students, and 1.4 times more likely to use systematic and explicit instruction on identifying and manipulating sounds in spoken words.
• 2.5 times more likely than were non-GE classrooms to exhibit evidence that students assume responsibility for their own behavior and understand that their choices determine consequences (Practice 12). Observers reported moderate to strong evidence of overall Practice 12 implementation in 88.1% of GE classrooms, compared to 35.5% of non-GE classrooms.
• 2.5 times more likely than were non-GE classrooms to exhibit evidence of the Magic Triad, a positive and caring environment, and discipline with dignity and logic (Practice 9). Observers reported moderate or strong evidence of overall Practice 9 implementation in 95.2% of GE classrooms, compared to 38.7% of non-GE classrooms.
• 2.5 times more likely than were non-GE classrooms to exhibit evidence that every student's work is displayed in some form. Teachers provide positive
Great Expectations Evaluation, 2003-2004 vii
commentary through oral and/or written feedback (Practice 10). Observers reported moderate to strong evidence of overall Practice 10 implementation in 95.2% of GE classrooms compared to 38.7% of non-GE classrooms.
• 2.3 times more likely than were non-GE classrooms to exhibit evidence that students and teachers speak in complete sentences and address one another by name, demonstrating mutual respect and common courtesy (Practice 2). Observers reported moderate to strong evidence of overall Practice 2 implementation by 83.3% of GE teachers, compared to 35.5% of non-GE teachers.
• 1.9 times more likely than were non-GE classrooms to exhibit evidence that lessons are integrated, related to the real world, reviewed consistently, and connected to subsequent curricula (Practice 4). Observers reported moderate to strong evidence of overall Practice 4 implementation by 85.7% of GE teachers, compared to 45.2% of non-GE teachers
• 1.8 times more likely than were non-GE classrooms to exhibit evidence that all students experience success; teacher compares students to their own past performance, not the performance of others; students are showcased, and past failures are disregarded (Practice 14). Observers reported moderate to strong evidence of overall Practice 14 implementation in 97.6% of GE classrooms, compared to 54.8% of non-GE classrooms.
• 1.7 times more likely than were non-GE classrooms to exhibit evidence that the teacher models desired behaviors and attitudes such as those set forth in the Life Principles and the Eight Expectations for Living (Practice 1). Observers reported moderate to strong evidence of Practice 1 implementation by 92.9% of GE teachers, compared to 54.8% of non-GE teachers.
• 1.7 times more likely than were non-GE classrooms to exhibit evidence that critical thinking skills are taught (Practice 5). Observers reported moderate to strong evidence of overall Practice 5 implementation by 97.6% of GE teachers, compared to 58.1% of non-GE teachers.
• 1.6 times more likely than were non-GE classrooms to exhibit evidence that teachers and students celebrate the successes of others (Practice 17). Observers reported moderate to strong evidence of overall Practice 17 implementation in 87.8% of GE classrooms, compared to 55.4% of non-GE classrooms.
• 1.5 times more likely than were non-GE classrooms to exhibit evidence that a non-threatening environment, conducive to risk-taking, is evident. Mistakes are okay. Students are taught to learn from their mistakes and to correct them (Practice 6). Observers reported moderate to strong evidence of overall Practice 6 implementation in 97.6% of GE classrooms, compared to 64.5% of non-GE classrooms.
• 1.3 times more likely than were non-GE classrooms to exhibit evidence that students are taught as a whole group, thoroughly and to mastery, with intensive and specific modifications insuring success for all (Practice 3). Observers reported significantly more evidence of implementation of

Great Expectations Evaluation, 2003-2004 viii
Practice 3 in GE classrooms, compared to non-GE classrooms. Observers reported moderate to strong evidence of overall Practice 3 implementation by 100% of GE teachers, compared to 77.4% of non-GE teachers.
• 1.2 times more likely than were non-GE classrooms to exhibit evidence that the teacher teaches on his/her feet, engages students personally, holds high expectations of students, and does not limit them to grade level or perceived ability (Practice 15). Observers reported moderate to strong evidence of overall Practice 15 implementation in 95.2% of GE classrooms, compared to 80.6% of non-GE classrooms.
Percentage of Classrooms Rated as Moderate or Strong Evidence of Students Demonstrating Critical Thinking Skills in GE and non-GE Classrooms
Students in GE classrooms were rated significantly higher on demonstrating critical thinking skills including knowledge, comprehension, application, synthesis, and evaluation. The differences were more pronounced for the higher-level skills of application, analysis, synthesis and evaluation. Observers
were 1.2 times more likely to indicate they saw either moderate or strong evidence of students demonstrating comprehension in GE classrooms, 1.7 times more likely to indicate they saw either moderate or strong evidence of students demonstrating application, 2.3 times more likely to indicate they saw either moderate or strong evidence of students analysis, 2.2 times more likely to indicate they saw either moderate or strong evidence of students demonstrating synthesis, and 1.9 times more likely to indicate they saw either moderate or strong evidence of students demonstrating evaluation in GE classrooms. Overall, the classroom observation data confirms that both teachers and students in GE classrooms are implementing the majority of GE Practices, and that GE classrooms are more likely to be implementing GE Practices than are non-GE classrooms. With the exception of Practice 8 (enriched vocabulary drawn directly from challenging writings and/or wisdom literature), smaller differences between GE and non-GE classrooms in Practice implementation were due to a higher proportion of non-GE teachers implementing the Practice.
34.6%
34.5%
34.5%
51.7%
83.3%
93.3%
65.8%
76.3%
78.6%
87.8%
100.0%
100.0%
0% 20% 40% 60% 80% 100%
Evaluation
Synthesis
Analysis
Application
Comprehension
Knowledge
Moderate or Strong Evidence
GENon-GE
Great Expectations Evaluation, 2003-2004 ix
595.3 627.1
595.1
635.2
400
500
600
700
Fall Spring
Mean
Sca
le Sc
ore
Non-GEGE
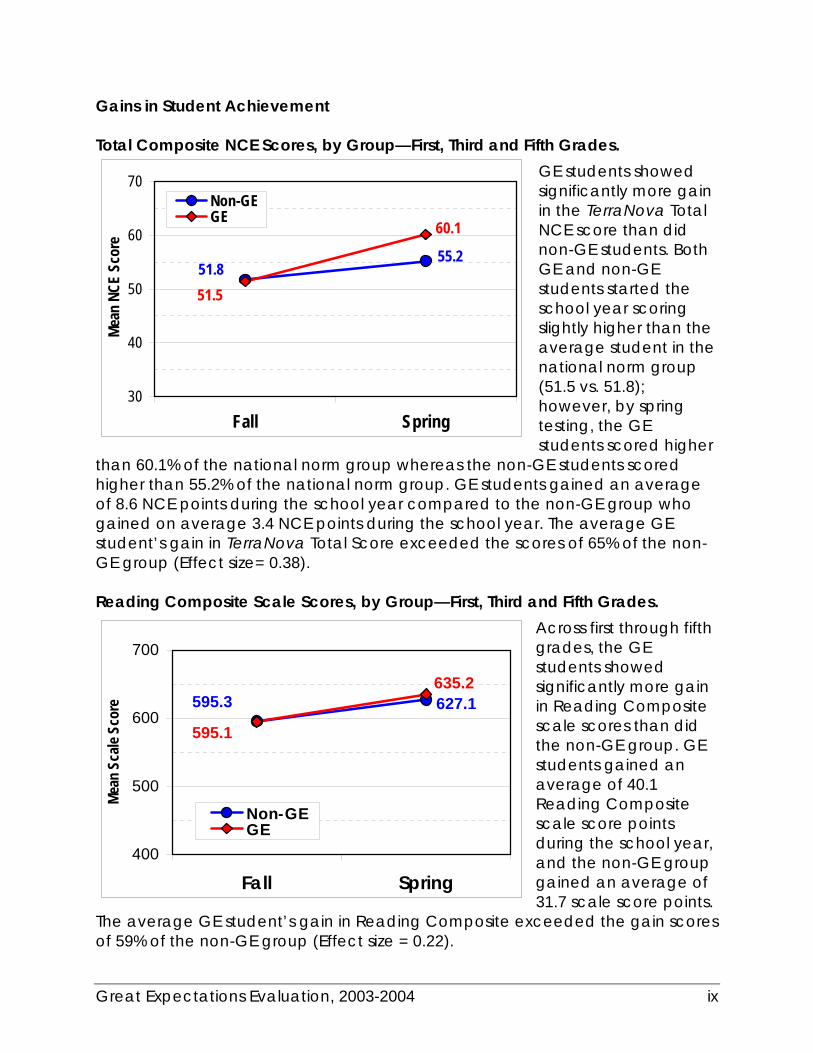
Gains in Student Achievement Total Composite NCE Scores, by Group—First, Third and Fifth Grades.
GE students showed significantly more gain in the TerraNova Total NCE score than did non-GE students. Both GE and non-GE students started the school year scoring slightly higher than the average student in the national norm group (51.5 vs. 51.8); however, by spring testing, the GE students scored higher
than 60.1% of the national norm group whereas the non-GE students scored higher than 55.2% of the national norm group. GE students gained an average of 8.6 NCE points during the school year compared to the non-GE group who gained on average 3.4 NCE points during the school year. The average GE student’s gain in TerraNova Total Score exceeded the scores of 65% of the non-GE group (Effect size= 0.38). Reading Composite Scale Scores, by Group—First, Third and Fifth Grades.
Across first through fifth grades, the GE students showed significantly more gain in Reading Composite scale scores than did the non-GE group. GE students gained an average of 40.1 Reading Composite scale score points during the school year, and the non-GE group gained an average of 31.7 scale score points.
The average GE student’s gain in Reading Composite exceeded the gain scores of 59% of the non-GE group (Effect size = 0.22).
51.855.2
51.5
60.1
30
40
50
60
70
Fall Spring
Mean
NCE
Sco
re
Non-GEGE

Great Expectations Evaluation, 2003-2004 x
52.154.452.256.9
30
40
50
60
70
Fall Spring
Mea
n N
CE
Scor
e
Non-GEGE
552.3595.0
552.2
603.2
400
500
600
700
Fall Spring
Mea
n Sc
ale
Scor
e
Non-GEGE
Language Composite NCE Scores, by Group—Third and Fifth Grades. The gain in TerraNova Language Composite test NCE scores for GE first grade students approached statistical significance. GE students gained an average of 4.7 NCE points in Language Composite during the school year, and the non-GE group gained an average of 2.3 NCE points. The average GE student’s gain in
Language Composite NCE scores exceeded the gain scores of 57% of the non-GE group (Effect size = 0.18). Mathematics Composite Scale Scores, by Group—First through Fifth Grades
Across first through fifth grades, the GE students showed significantly more gain in the Mathematics Composite test scale scores than did the non-GE group. GE students gained an average of 51.0 scale score points in Mathematics Composite during the school year, and the
non-GE group gained an average of 42.7 scale score points. The average GE student’s gain in Mathematics Composite scale scores exceeded the gain scores of 60% of the non-GE group (Effect size = 0. 25).

Great Expectations Evaluation, 2003-2004 xi
Across all available grades GE students made significantly higher gains than did non-GE students on nine of ten available TerraNova scores.
• The average GE student's gain on the Total Composite score exceeded the gain scores of 65% of the non-GE group (effect size = .38).
• The average GE student's gain on the Reading Composite score exceeded the gain scores of 59% of the non-GE group (effect size = .22).
• The average GE student's gain on the Reading test score exceeded the gain scores of 59% of the non-GE group (effect size = .24).
• The average GE student's gain on the Vocabulary test exceeded the gain scores of 58% of the non-GE group (effect size = .19).
• The average GE student's gain on the Language Composite score exceeded the gain scores of 57% of the non-GE group (effect size = .18).
• The average GE student's gain on the Language Mechanics test exceeded the gain scores of 57% of the non-GE group (effect size = .19).
• The average GE student's gain on the Mathematics Composite score exceeded the gain scores of 60% of the non-GE group (effect size = .25).
• The average GE student's gain on the Mathematics test exceeded the gain scores of 58% of the non-GE group (effect size = .21).
• The average GE student's gain on the Mathematics Computation test exceeded the gain scores of 56% of the non-GE group (effect size = .16).
Gains across all available grades for GE students approached statistical significance for the remaining TerraNova score.
• The average GE student's gain on the Language test exceeded the gain scores of 59% of the non-GE group (effect size = .23).
Gains in student achievement for first graders were striking. GE first graders made significantly higher gains than did non-GE first graders on seven of nine available TerraNova scores.
• The average GE student's gain on the Total Composite score exceeded the gain scores of 75% of the non-GE group (effect size = .67).
• The average GE student's gain on the Reading Composite score exceeded the gain scores of 70% of the non-GE group (effect size = .52).
• The average GE student's gain on the Reading test score exceeded the gain scores of 61% of the non-GE group (effect size = .28).
• The average GE student's gain on the Vocabulary test exceeded the gain scores of 68% of the non-GE group (effect size = .46).
• The average GE student's gain on the Language test exceeded the gain scores of 71% of the non-GE group (effect size = .56).
• The average GE student's gain on the Mathematics test exceeded the gain scores of 66% of the non-GE group (effect size = .40).
• The average GE student's gain on the Word Analysis test exceeded the gain scores of 61% of the non-GE group (effect size = .28).

Great Expectations Evaluation, 2003-2004 xii
Gains for the GE first graders approached statistical significance for the remaining two TerraNova scores.
• The average GE student's gain on the Mathematics Composite score exceeded the gain scores of 60% of the non-GE group (effect size = .25).
• The average GE student's gain on the Mathematics Computation test exceeded the gain scores of 58% of the non-GE group (effect size = .19).
GE third graders made significantly higher gains than did non-GE first graders on one of ten available TerraNova scores.
• The average GE student's gain on the Mathematics test exceeded the gain scores of 61% of the non-GE group (effect size = .29).
Gains for the GE third graders approached statistical significance for three of ten available TerraNova scores.
• The average GE student's gain on the Total Composite score exceeded the gain scores of 59% of the non-GE group (effect size = .22).
• The average GE student's gain on the Vocabulary test exceeded the gain scores of 58% of the non-GE group (effect size = .21).
• The average GE student's gain on the Language Mechanics test exceeded the gain scores of 57% of the non-GE group (effect size = .19).
GE fifth graders made significantly higher gains than did non-GE first graders on three of ten available TerraNova scores.
• The average GE student's gain on the Total Composite score exceeded the gain scores of 64% of the non-GE group (effect size = .37).
• The average GE student's gain on the Reading test score exceeded the gain scores of 66% of the non-GE group (effect size = .40).
• The average GE student's gain on the Language Composite score exceeded the gain scores of 64% of the non-GE group (effect size = .35).
Gains for the GE third graders approached statistical significance for five of ten available TerraNova scores.
• The average GE student's gain on the Reading Composite score exceeded the gain scores of 57% of the non-GE group (effect size = .17).
• The average GE student's gain on the Language test exceeded the gain scores of 59% of the non-GE group (effect size = .22).
• The average GE student's gain on the Language Mechanics test exceeded the gain scores of 58% of the non-GE group (effect size = .19).
• The average GE student's gain on the Mathematics Composite score exceeded the gain scores of 58% of the non-GE group (effect size = .21).
• The average GE student's gain on the Mathematics Computation test exceeded the gain scores of 58% of the non-GE group (effect size = .21).
Great Expectations Evaluation, 2003-2004 xiii
Across the 18 OPIs for which first grade scores were available, the GE first grade group scored at least somewhat higher in gains on 94.4% of OPIs (17 of 18 OPIs) than did the non-GE first grade group. GE first grade students showed significantly higher gains on 44.4% of available OPIs. An additional 22.2% of OPI gains for first graders approached statistical significance (p values between .06 and .19). Across the 22 OPIs for which third grade scores were available, the GE third grade group scored at least somewhat higher in gains on 90.9% of OPIs (20 of 22 OPIs) than did the non-GE third grade group. GE third grade students showed significantly higher gains on 9.1% of available OPIs. An additional 27.3% of OPI gains for third graders approached statistical significance. Across the 22 OPIs for which fifth grade scores were available, the GE fifth grade group scored at least somewhat higher in gains on 95.5% of OPIs (21 of 22 OPIs) than did the non-GE fifth grade group. GE fifth grade students showed significantly higher gains on 50.0% of available OPIs. An additional 18.2% of OPI gains for fifth graders approached statistical significance. Across the 22 OPIs for which more than one grade’s scores were available, the GE group scored higher in gains on 100% of OPIs than did the non-GE group. GE students showed significantly higher gains on 54.4% of available OPIs. An additional 31.8% of gains approached statistical significance. These findings indicate that students in classrooms implementing Great Expectations methodology showed greater gains in student academic achievement during the school year compared to demographically similar students not exposed to GE. Findings from principal, teacher, parent, and student surveys, the classroom observations, and student achievement all differed in ways that would be expected based on GE implementation. The fact that parents noticed differences in their children’s behavior indicates that the skills students learn in GE classrooms are also being used outside the classroom. Across all three grades, GE parents were significantly more likely to report that their children show interest, excitement, and involvement in learning and enjoying learning activities. This is consistent with teacher and principal self-reports as well as observer ratings of classroom behavior. It is clear from this study that GE not only increases student achievement, but it also creates positive attitudinal and behavioral changes for principals, teachers and students at schools, in classrooms as well as in other domains.