Embed Size (px)
Citation preview

Education Renewal and Innovation Formative Evaluation
EXECUTIVE SUMMARY JK-12 Education Performance Measures Report
February 2020

Page 1 of 12
Introduction The NWT Education Renewal and Innovation (ERI) Framework is situated in a global and national context where education is beginning to embrace a more holistic way of teaching and learning with a goal of supporting students to become capable and contributing people. This model better respects the NWT’s Indigenous cultures as well as the needs and expectations of the 21st century. Learning and knowing how to survive on the land and contribute to your community requires a complex and flexible skillset, one that spans across the capacities of the whole person. The ERI Framework is a 10-year initiative that was first implemented in 2013. It is aimed at improving the NWT education system such that it is more relevant to northern students and can better foster their growth into whole and capable people. As you read this document, it is important to keep in mind that the ERI Framework is only half-way through its 10-year lifespan. The changes hoped to be achieved by ERI are complicated, multi-sided, and need time. Persistent gaps in student outcomes, especially in small communities, are a result of numerous factors which require the efforts of the GNWT, Indigenous Governments, communities and families to effect change.
This Report The purpose of this document is to report on the current state of the NWT education system with respect to the changes implemented by the ERI Framework in 2013. It provides results from measures that have been chosen to speak to the performance of the education system. Like many systems, the education system is a complex, interconnected compilation of many parts. It is a network of organizations, people, programs, resources, materials, and actions. As such, it is important to understand how the education system functions as a system. The measures reported in this document each fall into one of three system categories: system inputs, activities, and outcomes. An education system’s inputs are things that go into the system, like money, teachers and students. They are what the education system has to work with. An education system’s activities are those things that the system does, like programs, courses, and assessment practices. They comprise the different ways the education system is mobilized to teach and support students. Finally, an education system’s outcomes are the results of the system. They are things like grades, graduation rates, and the wellbeing of students. They are what the system produces at the end. Ideally, the

Page 2 of 12
outcomes of a good education system will be students who are happy, well, capable, and ready to start the next phase of their lives. Understanding the results of this report in the context of inputs, activities, and outcomes helps shed light on how the education system is doing as an integrated whole.
The remainder of this introduction offers a summary of the results of the inputs, activities, and outcome measurements of the NWT’s education system. This summary will talk about the significance of the results and highlight achievements of the education system as well as some areas for growth.
Activities

Page 3 of 12
Executive Summary
Inputs The inputs to an education system are perhaps what the education system has the least control over. To provide an understanding of what the NWT’s education system inputs are, this report offers information on the following measures:
• Children’s development upon entering grade 1 • Student mental health and wellbeing during school • Number of schools • Number of students • Number of teachers • Budget per education body
Monitoring inputs is useful because they let us know what the system needs in order to do its work. For instance, knowing how children are doing developmentally just before they enter the school system at grade 1 can tell us whether the education system should invest in extra supports for children in younger grades such as food programs, speech and language supports, or options for medical supports (like hearing aids). As it turns out, many children in the NWT do need extra supports due to how they are faring developmentally. This report presents results from the Early Childhood Development Instrument, a developmental survey that 5-year-olds in the NWT participate in every year. These numbers show that overall, less than half of children in the NWT are developmentally on track by the time they enter grade 1. Results in Yellowknife and regional centres are more positive than in small communities. This has been the case since the Early Childhood Development instrument was introduced in the NWT in the 2011-2012 school year. These results provide important information because they tell us what the education system needs to be prepared for. In this case, a large portion of the incoming NWT student body needs extra care, attention, and accommodation. For this reason, some of the key activities undertaken through the ERI Framework focus explicitly on providing early childhood development supports, including launching the Junior Kindergarten program and designing and launching a made-in-the NWT Junior Kindergarten/Kindergarten curriculum. Similarly, knowing student mental health and wellbeing throughout the school-aged years is important to understand the student body that the education system is aiming to support. A student body with mental health and wellbeing needs suggests the education system could invest in extra supports such as school-based health professionals or educational programming focused on mental health and wellbeing. The Middle Years

Page 4 of 12
Development Instrument is a questionnaire that is completed by elementary school students in grades 4 and 7. The results of this annual questionnaire show that less than half of grades 4 and 7 students are thriving in terms of their mental health and wellbeing, since the tool was introduced in the 2015-2016 school year. As with the Early Childhood Development Instrument, the Middle Years Development Instrument results are more positive for Yellowknife and regional centres than small communities. These results suggest that the education system and all partners involved in supporting school-aged children need to take care to support child and youth mental health and wellbeing in all of the work that they do. For this reason, some of the key activities undertaken through the ERI Framework focus explicitly on wellness, including renewing the NWT Health and Wellness curriculum, and bringing child and youth counsellors into NWT schools. Information gathered from inputs is also useful in that it gives us a snapshot of what the makeup of the education system is. How many students are there in the NWT, across regions, per education body? How many teachers are there to teach these students? How much money do education bodies have to support teachers and students? Is the money distributed fairly? These are all questions that data (information) from input measures can answer. For instance, Figure 1 below helps answer the question about whether school funding is fairly distributed. The bars in the chart show the relation between what proportion of the education budget a given education body receives and what proportion of NWT students that education body is responsible for. With the exception of YK1 and YCS who have their own funding as well as ECE funding, the grey and brown bars are generally very close in height for all the education bodies. This means that there is a close relationship between how many students an education body is responsible for and how much money they receive from ECE. As you read the rest of this report, however, it will become clearer that perhaps the answer to the question the bar chart is tackling is not that simple. In particular, just because funding for schools is evenly distributed does not mean it is fairly distributed. Information from other measures will show that despite the fact that many schools in small communities receive equal funding, they have many additional challenges that schools in regional centres (Hay River, Fort Smith, and Inuvik) and Yellowknife do not have. In other words, schools in small communities might need extra funding in order to obtain the same outcomes that schools in regional centres and Yellowknife do. While such a funding structure would not be equal, it could be a fairer structure because all schools would be better able to get the same results. Figure 1 Percent of ECE education funding received by education bodies compared to how many students education bodies are responsible for

Page 5 of 12
Activities The activities of the education system are the different programs and strategies that go into enabling happy, well, and capable students. Some of the activity measures included in this report are:
• Student enrollment in JK/K • Student enrollment in Indigenous language programs • Student enrollment in French language programs • Number of students with Student Support Plans • Number of students with Individual Education Plans • Number and type of developed/renewed or piloting curricula occurring across the NWT • NWT curriculums with standard / common assessments • Grade 6 and 9 Alberta Achievement Tests (AATs) results • NWT diploma exam results • Number of hours of personal time spent by teachers on tasks related to teaching position • Educator participation in the New to the NWT Educators Conference
These measures differ from the input measures discussed earlier because they can tell us how effective the education system’s efforts are in fulfilling ERI commitments. There are
0%
5%
10%
15%
20%
25%
30%
% of total ECE educationbudget received by educationbody
% of NWT students educationbody is responsible for
Page 6 of 12
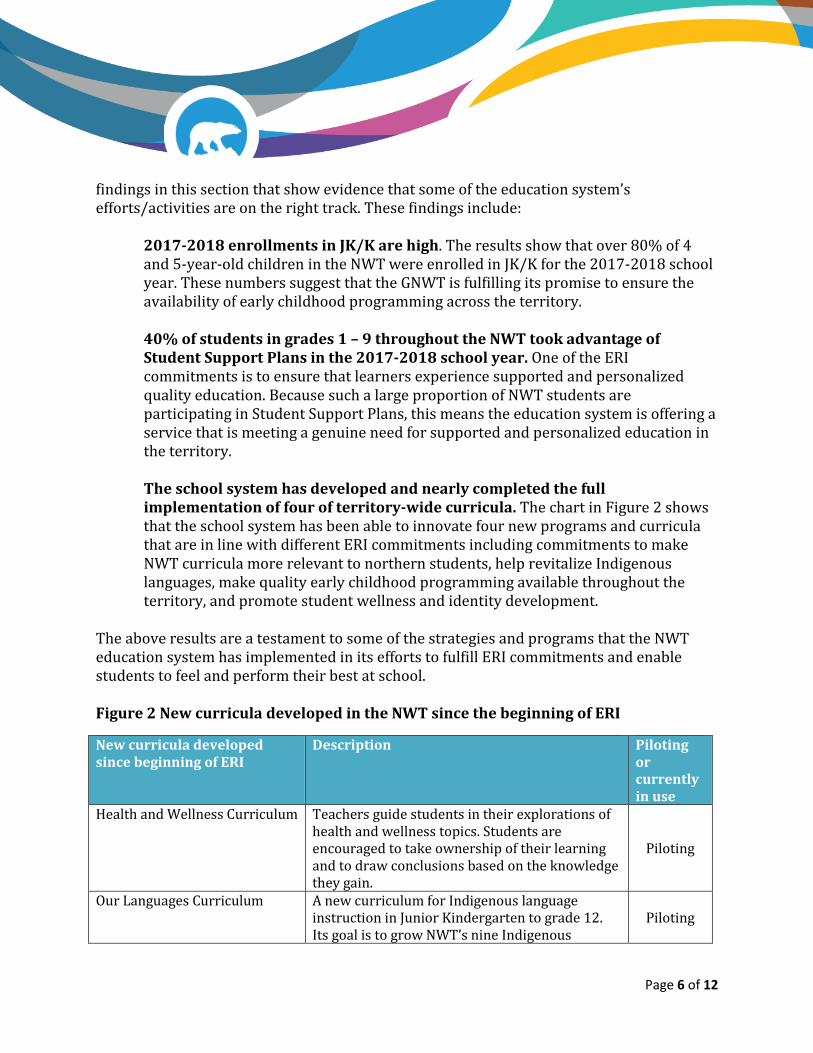
findings in this section that show evidence that some of the education system’s efforts/activities are on the right track. These findings include:
2017-2018 enrollments in JK/K are high. The results show that over 80% of 4 and 5-year-old children in the NWT were enrolled in JK/K for the 2017-2018 school year. These numbers suggest that the GNWT is fulfilling its promise to ensure the availability of early childhood programming across the territory. 40% of students in grades 1 – 9 throughout the NWT took advantage of Student Support Plans in the 2017-2018 school year. One of the ERI commitments is to ensure that learners experience supported and personalized quality education. Because such a large proportion of NWT students are participating in Student Support Plans, this means the education system is offering a service that is meeting a genuine need for supported and personalized education in the territory.
The school system has developed and nearly completed the full implementation of four of territory-wide curricula. The chart in Figure 2 shows that the school system has been able to innovate four new programs and curricula that are in line with different ERI commitments including commitments to make NWT curricula more relevant to northern students, help revitalize Indigenous languages, make quality early childhood programming available throughout the territory, and promote student wellness and identity development.
The above results are a testament to some of the strategies and programs that the NWT education system has implemented in its efforts to fulfill ERI commitments and enable students to feel and perform their best at school. Figure 2 New curricula developed in the NWT since the beginning of ERI
New curricula developed since beginning of ERI
Description Piloting or currently in use
Health and Wellness Curriculum Teachers guide students in their explorations of health and wellness topics. Students are encouraged to take ownership of their learning and to draw conclusions based on the knowledge they gain.
Piloting
Our Languages Curriculum A new curriculum for Indigenous language instruction in Junior Kindergarten to grade 12. Its goal is to grow NWT’s nine Indigenous
Piloting

Page 7 of 12
languages, and to help students on their journey of becoming/living as capable people.
Junior Kindergarten Program and Curriculum
A play-based curriculum for 4 year olds, designed to foster curiosity, learning, a sense of identity, communication, teamwork, problem solving, creativity, and the basics of reading, writing and math.
In use
Northern Studies Curriculum An expanded version of Northern Studies 10 developed in 1991. Its goal is to help all students know about NWT land, languages, histories and cultures. It is mandatory for graduation.
In use
Unfortunately, not all the results for the activities measures in this report are good results. There are a handful of results which suggest that some of the programs and strategies that the education system is employing need to do more in order to promote the ideal outcomes ERI is aiming for. For instance, some of the results for NWT standardized tests (AATs and diploma exams) raise questions about the appropriateness of the administration of AATs in particular in the NWT. Results show that, over time, between 20% and 35% of NWT students have been either excused or absent from writing AATs. This is a substantial proportion of students. Given that one of the main purposes of standardized tests is to be able to assess the level of academic achievement of students within a given region, it seems the NWT is not achieving this purpose given the large numbers of students who do not write AATs. While results show that between 40% and 55% of grade 6 and 9 students score acceptable or higher on AATs, we cannot be certain that these numbers are representative of student scoring in the NWT because we do not know how the students who have not written the AATs would score. Given the sizeable portion of students excluded from this information, it may be time to consider implementing a more appropriate assessment. Data from AATs and diploma exams, as well as results from a few of the other activity measures, reveal another concern with the education system’s activities more broadly. Results from across these measures show that current activities in the school system (e.g. the curriculum, teaching methods, assessments) are not well designed for students in small communities. Scores on AATs and diploma exams in particular show quite starkly that students from small communities are scoring well below the scoring level of students from regional centres and Yellowknife. Numbers of students who are on Student Support Plans for working below grade level are also substantially higher in small communities than in regional centres and Yellowknife. Both of these types of result reveal that NWT school system activities are not doing enough to support students in small communities to reach a level of academic achievement that is equal with the rest of the territory. Small communities face ongoing and complex difficulties in terms of infrastructure, teacher shortages, high costs, and poverty. These difficulties often make matters much worse for

Page 8 of 12
student achievement. Because of this, supporting students in their academic achievement must go hand in hand with initiatives that support wellness and the quality of life in small communities more generally. As seen in the inputs with respect to the Early Childhood Development Instrument and Middle Years Development Instrument results, and as you will see in the next section, inequity between small communities and regional centres and Yellowknife is a reoccurring and troubling result. All students in the NWT should have equitable opportunity to benefit from the school system.
Outcomes Remember that the outcomes of the education system are the end results of the system. If the goal of the education system is to produce well and capable students, then the outcome measures will be those measures that tell us how close the education system has come to this goal. Some examples of outcome measures reported in this document include:
• EDI on track rates by JK participation • MDI relationship with adult at school results • Health Behavior in School-Age Children feel accepted by their teacher results • Attendance rates • Transition and reenrollment rates by grade • Course completion rates for core subject high school courses • High school graduation rate • Percent of grade 12 students going onto postsecondary certificate, diploma, or
degree programs • Difference between diploma exam and course marks for senior secondary students • Teacher satisfaction with New to the NWT Educators Conference • Teacher satisfaction with NWT JK/K Training Opportunities • Teacher satisfaction with job
The results of these measures speak to certain successes of the education system including student achievement, student health and wellbeing, student engagement in school (attendance), and teacher satisfaction. If all the results in this section were positive, then the NWT could be confident in the success of its education system. Happily, some of the results are indeed positive. Here are some of the highlights:
Preliminary findings suggest Junior Kindergarten may be contributing positively to early childhood development. Children who attend Junior Kindergarten are more likely to be developmentally on track than children who do not attend Junior Kindergarten. This result is positive because it shows that quality early learning opportunities offered through NWT educational programming can

Page 9 of 12
help children at a developmental level. It takes a community to raise a child and the school is part of the community. It is good, then, to see evidence that NWT schooling is contributing positively to the efforts needed to raise happy and healthy children. Between 75% and 80% of students in grades 6 to 10 feel their teachers accept them for who they are. This result is a good one because it means that most NWT students feel safe in their identities with their teachers. For a comparison, these percentages are very similar to historical Canadian averages for this measure. This is important for healthy identity development and feeling calm and relaxed in the class room. This result speaks well about NWT teachers. They are doing something right to be gaining this kind of trust with so many of their students. Between 80% and 90% of high school students pass their core subject courses every year. Core high school subject courses are math, English, social studies, French, science, and Northern Studies. This is a strong overall pass rate. This number shows that NWT students are engaged in their courses enough that a vast majority of them are able to meet all the requirements for passing. 65% of NWT high school graduates go on to take post-secondary education or training. This is a good result because it shows that a majority of NWT high school graduates are able to use their high school training to get them into the next stage of their lives. It would also be valuable to know what percent of high school graduates move into the workforce after high school. Post-secondary education and training is not everyone’s first choice for life after high school, so it would be meaningful to have a more representative picture of the different options students pursue after high school. ECE is currently working to develop such a measure. 84% of NWT teachers are satisfied with their jobs. This is very important as teachers are possibly the most critical component of the education system. They are at the very front lines supporting students and helping them grow into themselves as learners and thinkers. An education system full of tired, unhappy teachers will be an education system full of tired, unhappy students. It is a great thing to see that a large percentage of NWT teachers are satisfied in their places of work.
The above results are encouraging and signal that many NWT students are receiving what they need from the school system in order to feel and do well at school. However, not all results for the outcome measures are positive. There are many results that suggest the outcomes of the education system are not ideal. In particular, the data show time and time again that there are inequities between outcomes of schools in small communities and outcomes of schools in Yellowknife and regional centres. These inequities show up beginning in early childhood and follow right through to high school, graduation, and

Page 10 of 12
participation in post-secondary education/training. Consider some of these results. Compared to students in regional centres and Yellowknife, fewer children in small communities:
• are developmentally on track before entering grade 1; • are thriving in terms of their mental health and wellbeing in grades 4 and 7; • feel they belong at school; • attend school 90% of the time; • pass their diploma exams; • graduate in their first year of enrolling in grade 12; • take post-secondary education/training.
These results are very clear. Students in small communities face difficulties that many students in Yellowknife and regional centres do not face, but these difficulties are not being offset by the current supports of the school system. The school system must invest more substantially in programming that is specific to enabling students in small community schools to benefit more from school. More supports are especially needed for students in senior high grades (i.e., grades 10, 11, and 12). The NWT’s inclusive schooling policy for grades 1 to 9 is informed by research that shows the benefits of keeping children in class with their peers even if they are working at a grade level that is below their peers. Because of this policy, students in grades 1 to 9 transition smoothly from one grade to the next. The policy changes after grade 9 as high school (grades 10 to 12) courses have prerequisites and minimum requirements. As a result, there is a bottleneck in grade 10 where many students need to remain in the grade for longer than a year because they need more time to work up to a grade 10 level. This result is shown in Figure 3, where the grade 10 enrollment results are the highest of any grade in the JK-12 system. More generally, students repeat grades at relatively high rates at the senior high level in the NWT. Results on this measure over time show that between 20% and 30% of grade 10 students repeat grade 10, and between 25% and 35% of grade 12 students repeat grade 12. These percentages suggest more extensive inclusive schooling supports need to be offered in high school grades. Changes to the high school system and approach are coming through the introduction of High School Pathways in the 2019-2020 school year. These changes will be monitored and reported on after the next 5 years of the ERI Framework.

Page 11 of 12
Figure 3 NWT student enrollments by grade, full-time equivalent (FTE)
Scope of Report This report does not provide an exhaustive picture of the JK-12 system. Rather, it offers a snapshot of current JK-12 education system activities and outcomes. System activities are what happen within the system, such as course offerings and assessment practices, to produce the resulting outcomes of the system, such as student wellbeing and success. The collection of input, activity and outcome performance measures in this report was developed by ECE staff, management, and partners.
Data Sources and Limitations The numbers for this report primarily come from the ECE system including NWT education bodies, as well as the NWT Department of Human Resources, and the NWT Bureau of Statistics.
Depending on the source of data, there can be delays of a year or more for when the data are available for use.
The numbers and rates in this report may be revised in the future and are not necessarily comparable to numbers in other tabulations and reports. The numbers and rates in this
594 633 609.5 584.5 609 635
577 555 535
750.75
583.5
710.25
1 2 3 4 5 6 7 8 9 10 11 12
Num
ber
of s
tude
nts
enro
lled
(FTE
)
Grade level (1-12)

Page 12 of 12
report rely on information systems and estimates that are continually updated and often revised. Any changes that do occur are usually small.
The quality of data available varies across the various data systems that this report collects from and is dependent on the techniques available for collection. Some information systems are paper based, and others are electronic. Some have long histories and others are relatively new. Some collect a lot of detail and others do not.
Future Directions Future reports will see new performance measures added or eliminated depending on data availability and ongoing development of the performance measures. As performance measures are tracked, significant changes over the years will be noted. Feedback on this report is welcome and should be directed to ECE ([email protected]).
List of Appendices
• Appendix 1: Input Performance Measures
• Appendix 2: Activity Performance Measures
• Appendix 3: Outcome Performance Measures


![Food security and nutrition: building a global narrative ... · EXECUTIVE SUMMARY EXECUTIVE SUMMARY EXECUTIVE SUMMARY EXECUTIVE SUMMAR Y [ 2 ] This document contains the Summary and](https://img.dokumen.tips/doc/110x75/5ff5433612d22125fb06e6b5/food-security-and-nutrition-building-a-global-narrative-executive-summary-executive.jpg)