Embed Size (px)
Citation preview
Solar Energy Development on DoD Installations in the Mojave & Colorado Deserts January 2012
Executive Summary 1
Executive Summary
ES.1 Key Findings
This analysis determined that over 7,000 megawatts (MWAC) of solar energy
development is technically feasible and financially viable at several Department of
Defense (DoD) installations in the Mojave and Colorado Deserts of California.
Approximately 25,000 acres are “suitable” for solar development and another 100,000
acres are “likely” or “questionably” suitable for solar.
This level of solar potential exists even though 96 percent of the surface area of the
installations is unsuitable for solar energy development due to conflicts between solar
energy development and military mission activities occurring at the installations or due to
steep slope, flash flood hazards, biological resource conflicts, cultural resource conflicts,
and other factors.
Private developers can tap the solar potential with no capital investment requirement
from the DoD.
The Federal Government could potentially receive approximately $100 million/year in
the form of rental payments, reduced cost power, in-kind considerations, or some
combination among them.
There are a range of technical, policy and programmatic barriers that can slow or, in
some cases, stop solar development. Transmission capacity and the management of
withdrawn lands are the two most important issues.
ES.2 Report Purpose
This study addresses current solar development activities and includes an evaluation of the
potential for solar energy development inside the boundaries of nine large military installations
located in the Mojave and Colorado Deserts of southern California and Nevada (see Figure ES.1
and Table ES.1). In addition to assessing the solar energy potential of the military installations,
this report also discusses the potential mission compatibility and energy security impacts of on-
installation solar energy development and the broader context for solar energy development in
the Mojave and Colorado Deserts. The Department initiated the study in response to a
congressional request.
Solar Energy Development on DoD Installations in the Mojave & Colorado Deserts January 2012
Executive Summary 2
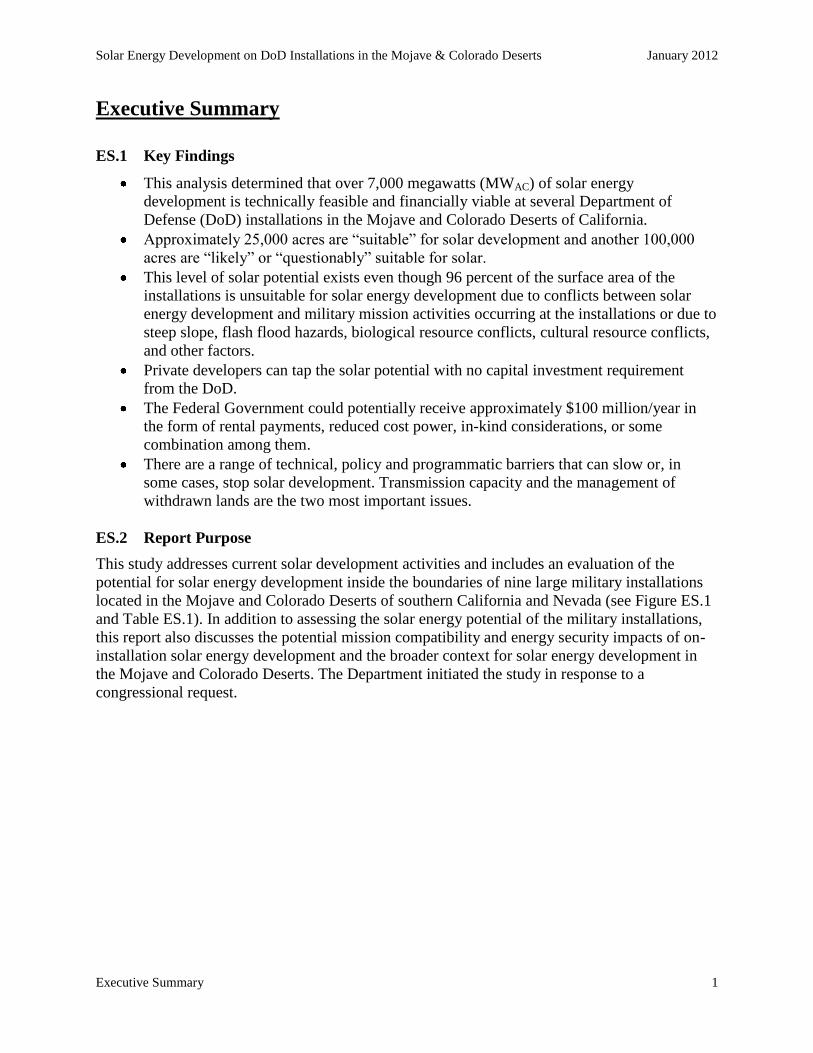
Figure ES.1 – DoD Installations Addressed by this Study
The nine installations are diverse, and each needs to be considered in the context of its unique
mission role, land endowment, utility service arrangements, and solar development flexibility.
The installations include representation from the Army, Air Force, Navy and Marine Corps.
Their mission roles span a wide range of activities, including air, ground and combined arms
training; weapons system research and development; human- and technical-factor weapons
system testing and evaluation; and logistics support and management. Most of these installations
already have 1-2 megawatts (MW) of solar energy systems in operation, and Nellis AFB is host
to the largest photovoltaic (PV) system sited on a military facility in the U.S., a 14.2 MW solar
PV facility completed in 2007.
Table ES.1 – U.S. Department of Defense Installations Reviewed in Study
Installation Service State Geographic Region
Marine Corps Air Ground Combat Center
(MCAGCC) Twentynine Palms Marine Corps CA Mojave Desert
Marine Corps Logistics Base (MCLB) Barstow Marine Corps CA Mojave Desert
Chocolate Mountain Aerial Gunnery Range
(CMAGR) Marine Corps CA Colorado Desert
Naval Air Weapons Station (NAWS) China
Lake Navy CA Mojave Desert
Naval Air Facility (NAF) El Centro Navy CA Colorado Desert
Edwards Air Force Base (AFB) Air Force CA Mojave Desert

Solar Energy Development on DoD Installations in the Mojave & Colorado Deserts January 2012
Executive Summary 3
ES.3 Mission Compatibility
The military services use the nine military installations as key assets for training, test and
evaluation, and research and development. Their size and relatively remote locations offer the
military the ability to train personnel and conduct research and development on technology in
ways that would not be possible at other locations. The military’s need for large, unrestricted
landholdings has increased in recent years because modern systems and platforms – aircraft,
missiles, sensors, etc. – have effective ranges and impacts vastly larger than their predecessors
from the 1940s, when most of the installations in this study were established. Large areas are
needed to test, evaluate and train with these systems, both to exploit their full capabilities, and to
ensure that any unanticipated incidents occur over controlled ranges, rather than populated areas.
Although the effective battlespace requirement is growing, the military’s landholdings are not.
Because it is unlikely that any new major installations will be created in the region, the existing
installations should be considered irreplaceable, and any degradation of their ability to perform
their missions has an impact on both the near and long term capabilities of the military to protect
and defend the U.S. Any plan for large-scale solar development on these installations needs to
acknowledge and start with that premise.
There are two broad categories of conflict between solar technology and mission activities. The
first category comprises “spectrum” issues, where the conflict between solar technology and
military activities occurs through interactions in the radio frequency, infrared or visual spectra
(see Table ES.2).
Table ES.2 – Function and Band of Military EM Spectrum Use
Spectrum Sensors Weapons Communications
UV Threat Warning Missile Guidance Data Link
Visible Optical, Telescopic
sights, NVD, Electro-
Optical imaging,
precision tracking
Aiming and Guidance,
Fuzing
Light signals,
Navigation lights
IR Threat warning, NVD,
IR Imaging, Laser
warning, Laser ranging,
Precision tracking
Active and passive
Laser guidance, IR
passive guidance, Laser
Proximity fuzing, High
Power Laser
IR beacons, Modulated
Laser Data link, voice
Radio Threat Warning,
Electronic Support,
Radar, IFF, GPS,
Navigation, Telemetry,
Precision measurement
HPM, Electronic Attack
(Jammers), Anti-
Radiation Missiles,
Radar and Radio guided
Missiles, Proximity
Fuzing
AM, FM, HF Voice,
Data Link, SATCOM,
Telemetry, UAS Control
See Appendix C for full names of the acronyms in the table.
Fort Irwin Army CA Mojave Desert
Creech Air Force Base (AFB) Air Force NV Mojave Desert
Nellis Air Force Base (AFB) and the Nevada
Test and Training Range (NTTR) Air Force NV
Mojave and Great
Basin Deserts

Solar Energy Development on DoD Installations in the Mojave & Colorado Deserts January 2012
Executive Summary 4
The second category comprises “physical” issues, where the conflict arises from hazardous or
destructive interaction between military vehicles, ordnance, and other hardware on the one hand,
and solar technology on the other (see Table ES.3).
Table ES.3 – Summary of Training and Testing Activities on Bases and Ranges
Fo
rt I
rwin
NA
WS
Ch
ina
La
ke
El
Cen
tro
NA
F
MC
AG
CC
Tw
enty
nin
e P
alm
s
MC
LB
Ba
rst
ow
Ch
oco
late
Mtn
. A
GR
Ed
wa
rds
AF
B
Nel
lis
AF
B &
NT
TR
Cre
ech
AF
B
Live Training X X X X X X X X X
Dismounted Maneuver Training X X X X
Mounted Maneuver Training X X X
Air Operations Training X X X X X X X X
Individual & Unit Live Fire Weapons
Training X X X X X X X X
Joint/Combined Arms Maneuver
Training X X X X X
Joint/Combined Arms Live Fire and
Maneuver Training X X X X X X
Test and Evaluation X X X X X
Support Facilities X X X X X X X X
Because the installations support the complex scope of the Nation’s military activities, the range
of interactions between their activities and solar development is also complex and wide-ranging.
Certain issues are more prevalent on some installations, while others are present at all of the
installations. Some conflicts can be mitigated, while others cannot. It is also important to note
that each installation is home to a diversity of activities, so that while mission conflicts may
exclude solar development from active range areas, other areas of the installation may be free of
mission conflicts. Each proposed facility needs to be evaluated in the context of its specific
location and the current, and potential future, mission activities occurring there.
Although the study provides a screening level review of potential mission conflicts, there are
gaps in data and analysis on mission compatibility. Very few detailed studies of conflicts
between mission activities and solar development are available in the public domain.

Solar Energy Development on DoD Installations in the Mojave & Colorado Deserts January 2012
Executive Summary 5
ES.4 Solar Potential Assessment
Results
Because the two installations in Nevada lack significant solar development potential in addition
to projects already developed or planned, the solar potential assessment portion of this study
focuses on the seven military installations located in southern California. For the seven
California installations, 96 percent of the land surface, largely active range land, is unsuitable for
solar development. About 25,000 acres are “suitable” for solar development and another 100,000
acres are “likely” or “questionably” suitable for solar.
Assuming that 100 percent of the “suitable” acreage plus 25 percent of the “likely” and
“questionable” acreage is available for solar development, the study determined that over 7,000
MWAC of technically and economically feasible solar capacity could be sited on these lands. In
this study “economically feasible” means that the solar projects would be financially attractive
from the perspective of the project investor. However, the study found that only private investors
would find it attractive to invest in these projects because private investors have access to
Federal and State tax-based incentives, which permit them to earn an attractive rate of return on
their investments. The study found that government investment (e.g., direct DoD funding of
construction) would be financially unattractive in all cases. The most important federal solar tax
incentive is mandated to be available through the end of 2016, but it is possible that legislative
action in the interim could phase-out or eliminate this incentive, which would make private
project investment less viable.
Assuming private development and ownership of economically-viable solar capacity on the
seven California installations, the Federal Government could expect to receive over $100 million
of annual value, in the form of rental payments, discounted power, in-kind considerations, or
some combination thereof. Full development would also result in the avoided emissions of
millions of tons of greenhouse gases and criteria air pollutants.
These available acreage and solar capacity figures represent the maximum potential for solar
electricity development, if one placed solar on all sites that could feasibly host it from the
technical and economic perspectives. The actual level of solar energy development on these
military installations is likely to remain well below the maximum potential number for a wide
variety of reasons, including a shortage of available transmission in the region, environmental
constraints that could not be incorporated into this study, administrative and legal complexity,
and competition from other generation sources.
The potential annual electricity generation from this solar energy capacity would be equivalent to
two-thirds of the current annual electricity consumption of the entire DoD, nationwide. While
complete development of all of the identified solar energy potential is unlikely, allowing full
solar development on approximately 6% of the identified, economically-viable lands would
generate enough electricity to meet all of the DoD’s EPAct 2005 renewable energy goals while
solar development on less than half of the identified lands would be sufficient to meet all of the
DoD’s NDAA 2010 renewable energy goals (25% of facility energy supplied by renewable
energy sources in 2025).

Solar Energy Development on DoD Installations in the Mojave & Colorado Deserts January 2012
Executive Summary 6
It is important to note that the geographical and technical aspects of this analysis were not
designed to be a detailed engineering analysis of specific solar projects, nor was the economic
analysis intended to be of sufficient detail for investment decision-making for any particular site.
Rather, this process provides a reasonable estimate of the technical and economic potential for
solar development across millions of acres of complex landscape within a constrained study
schedule and budget. However, while bearing this disclaimer in mind, it is reasonable to treat the
results of this study as a robust screening of potential solar development areas. Each installation
and each Service’s center of expertise for solar development (e.g., NAVFAC, AFCESA, Corps
of Engineers, MCI, etc.) can use the outputs of this analysis as inputs to their own process of
solar site selection and development.
Methodology
The study organized the many issues affecting solar viability into three categories – geographic,
technological, and economic.
Geographic Analysis
The study analyzed these issues in a step-by-step manner, with geographic screening analyses
occurring first. The geographic analysis identified potential sites for roof, parking, and ground-
mounted solar projects from among the military installations’ total inventory of buildings,
parking facilities, and lands. Five distinct “site types” were used: building rooftops; shading
structures over paved parking lots; shading structures over unpaved parking lots; cantonment1
ground sites; and, range ground sites. Hundreds of layers of Geographic Information System
(GIS) data were obtained from public, Service and installation databases in support of this study
(see Figure ES.2).
1 Each installation except for Chocolate Mountain AGR, was segmented into a cantonment area representing the
developed zone of the installation, and a range area representing the undeveloped zone. The study applied different
criteria and decision rules for solar projects in the two zones, except Edwards AFB where transmission calculations
for the installation’s cantonment and range zones were combined because they are especially co-mingled.

Solar Energy Development on DoD Installations in the Mojave & Colorado Deserts January 2012
Executive Summary 7
Figure ES.2 – GIS Data Collection Methodology
For the ground sites that comprise the vast majority of this study, GIS techniques were used to
overlay 20 to 40 independent variables per installation to identify areas where solar development
can and cannot occur. The GIS variables were typically in the categories of built infrastructure,
construction plans, biological resources, cultural resources, environmental resources and hazards,
military mission and operational activities including explosive arcs, topography, shading, and
buffers around various areas. Figure ES.3 summarizes the GIS analysis process.
Figure ES.3 – Geographic Information Systems Analysis Flow
1
• Obtain Regional GIS Data (e.g., from Desert Renewable Energy Conservation Plan)
2
• Obtain GIS Data (many data layers) from Individual Military Installations and from Service-Level or Regional Military Sources
3
• Generate Integrated GIS Model and Map of Solar Suitability for each Installation
4 • Review Initial GIS Map with Installation Staff and Other Military Stakeholders
5
• Obtain and Formally Integrate Installation Feedback (including additional data layers) into GIS Model
6 • Generate Final GIS Model and Map of Solar Suitability for each Installation

Solar Energy Development on DoD Installations in the Mojave & Colorado Deserts January 2012
Executive Summary 8
As shown in Figure ES.4 below (an example drawn from NAWS China Lake), at most of the
installations studied, the vast majority of the land surface was screened out during the geographic
analysis phase due to mission compatibility conflicts.
Figure ES.4 – Mission Compatibility at NAWS China Lake
Solar Energy Development on DoD Installations in the Mojave & Colorado Deserts January 2012
Executive Summary 9
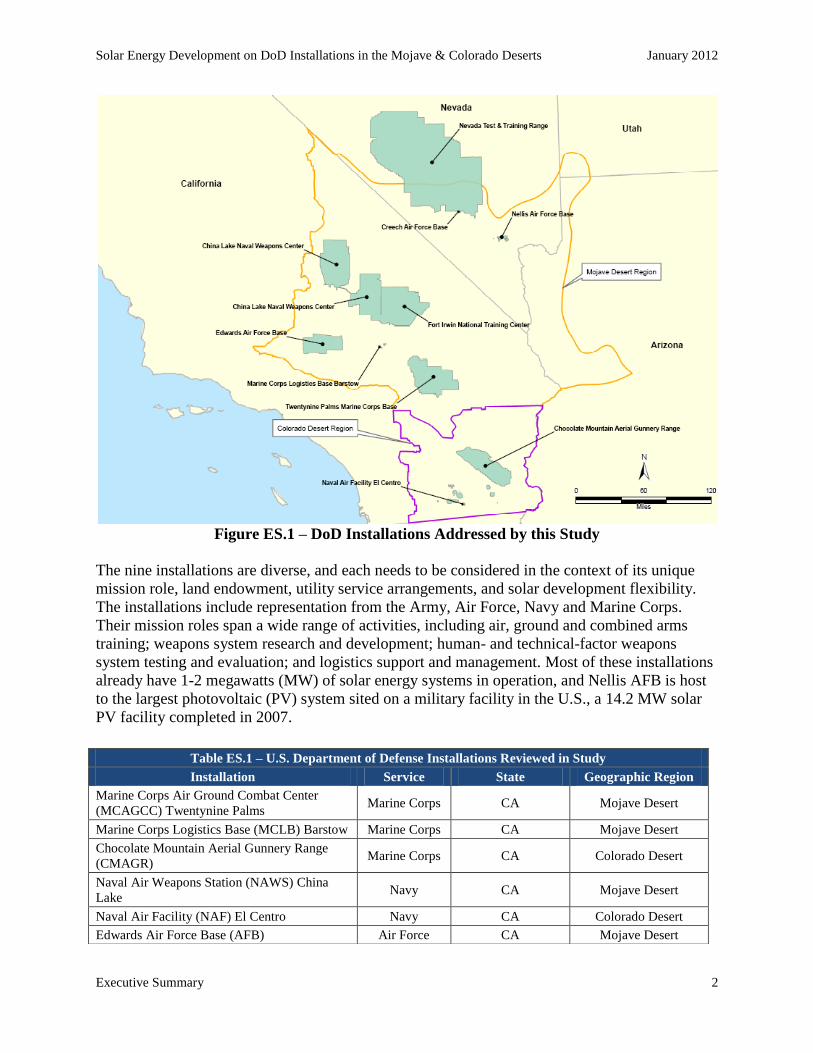
However, as show in Figure ES.5, even the relatively small area surviving this screening process
still has significant solar potential.
Figure ES.5 – Solar Suitability at NAWS China Lake
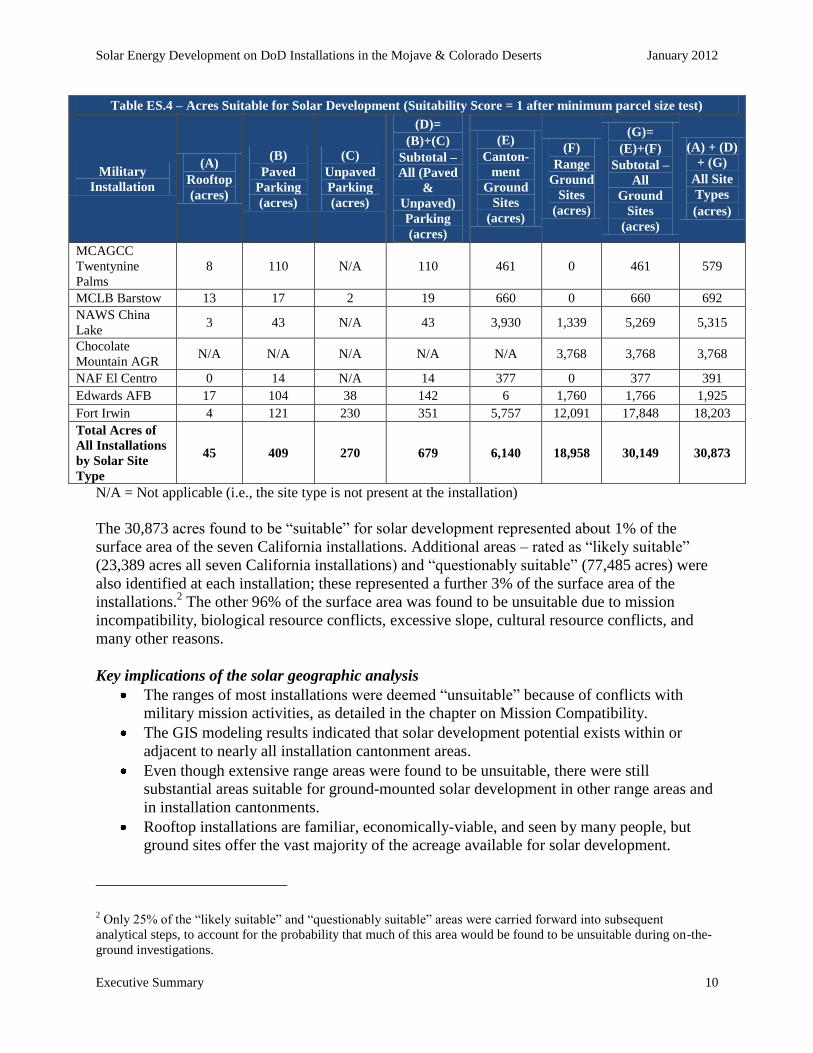
The geographic analysis calculated the acres of roof, parking, and ground sites that are suitable
for solar development on each installation. Table ES.4 presents the total number of acres for each
military installation that passed all the screening variables resulting in a “suitable” rating
(suitability score = 1) for solar development for each type of solar site.
Solar Energy Development on DoD Installations in the Mojave & Colorado Deserts January 2012
Executive Summary 10
Table ES.4 – Acres Suitable for Solar Development (Suitability Score = 1 after minimum parcel size test)
Military
Installation
(A)
Rooftop
(acres)
(B)
Paved
Parking
(acres)
(C)
Unpaved
Parking
(acres)
(D)=
(B)+(C)
Subtotal –
All (Paved
&
Unpaved)
Parking
(acres)
(E)
Canton-
ment
Ground
Sites
(acres)
(F)
Range
Ground
Sites
(acres)
(G)=
(E)+(F)
Subtotal –
All
Ground
Sites
(acres)
(A) + (D)
+ (G)
All Site
Types
(acres)
MCAGCC
Twentynine
Palms
8 110 N/A 110 461 0 461 579
MCLB Barstow 13 17 2 19 660 0 660 692
NAWS China
Lake 3 43 N/A 43 3,930 1,339 5,269 5,315
Chocolate
Mountain AGR N/A N/A N/A N/A N/A 3,768 3,768 3,768
NAF El Centro 0 14 N/A 14 377 0 377 391
Edwards AFB 17 104 38 142 6 1,760 1,766 1,925
Fort Irwin 4 121 230 351 5,757 12,091 17,848 18,203
Total Acres of
All Installations
by Solar Site
Type
45 409 270 679 6,140 18,958 30,149 30,873
N/A = Not applicable (i.e., the site type is not present at the installation)
The 30,873 acres found to be “suitable” for solar development represented about 1% of the
surface area of the seven California installations. Additional areas – rated as “likely suitable”
(23,389 acres all seven California installations) and “questionably suitable” (77,485 acres) were
also identified at each installation; these represented a further 3% of the surface area of the
installations.2 The other 96% of the surface area was found to be unsuitable due to mission
incompatibility, biological resource conflicts, excessive slope, cultural resource conflicts, and
many other reasons.
Key implications of the solar geographic analysis
The ranges of most installations were deemed “unsuitable” because of conflicts with
military mission activities, as detailed in the chapter on Mission Compatibility.
The GIS modeling results indicated that solar development potential exists within or
adjacent to nearly all installation cantonment areas.
Even though extensive range areas were found to be unsuitable, there were still
substantial areas suitable for ground-mounted solar development in other range areas and
in installation cantonments.
Rooftop installations are familiar, economically-viable, and seen by many people, but
ground sites offer the vast majority of the acreage available for solar development.
2 Only 25% of the “likely suitable” and “questionably suitable” areas were carried forward into subsequent
analytical steps, to account for the probability that much of this area would be found to be unsuitable during on-the-
ground investigations.

Solar Energy Development on DoD Installations in the Mojave & Colorado Deserts January 2012
Executive Summary 11
Technological Analysis
The second step – technological analysis – defined the characteristics for each of six solar
technology packages on areas that survived the geographic screening process. These packages
included crystalline PV, thin film PV, solar trough and Dish/Stirling engine technology. The
technological analysis calculated the maximum “technical potential” for solar electricity on each
site – i.e., the potential, in capacity and annual electricity output, for solar development
unconstrained by project economics.
Economic Analysis
The capacity and output results from the technological analysis was then passed on to last step in
the analytic process – economic analysis. The heart of the economic analysis was a financial
model that calculated the 20-year investment returns for each potential solar project under
private or military ownership. The analysis assumed that all construction would occur in 2015 (to
allow the DoD sufficient time to complete program planning, site studies and procurement
actions), and that PV prices would fall approximately 20% from their Spring 2011 levels.
Concentrating solar technology prices in 2015 were assumed to remain level with 2011 prices.
The model included a wide range of other cost inputs:
Capital costs (e.g., panels, racking, trackers, balance of system, installation labor)
Running costs (e.g., O&M labor, insurance, inverter replacement accrual,
decommissioning accrual)
Water cost (for concentrating solar power plants only)
Land lease rates for 3rd party owned projects
Transmission extension costs
The following revenue and tax-related incentives were included in the model:
Electricity prices (20-year wholesale and self-generation projection)
Renewable Energy Certificate (REC) prices (20-year projection)
Solar incentives taken by private developers (which are not available if funded by
MILCON)
o Business Investment Tax Credit (30% of installed cost)
o Modified Accelerated Cost Recovery System (MACRS) Depreciation
The 20-year discounted cash-flow model calculated the Net Present Value (NPV) and Internal
Rate of Return (IRR) for each technology on each parcel of land for which it was technically
suitable. Those “projects” whose IRRs exceeded the investor’s discount rate were deemed
financially feasible.
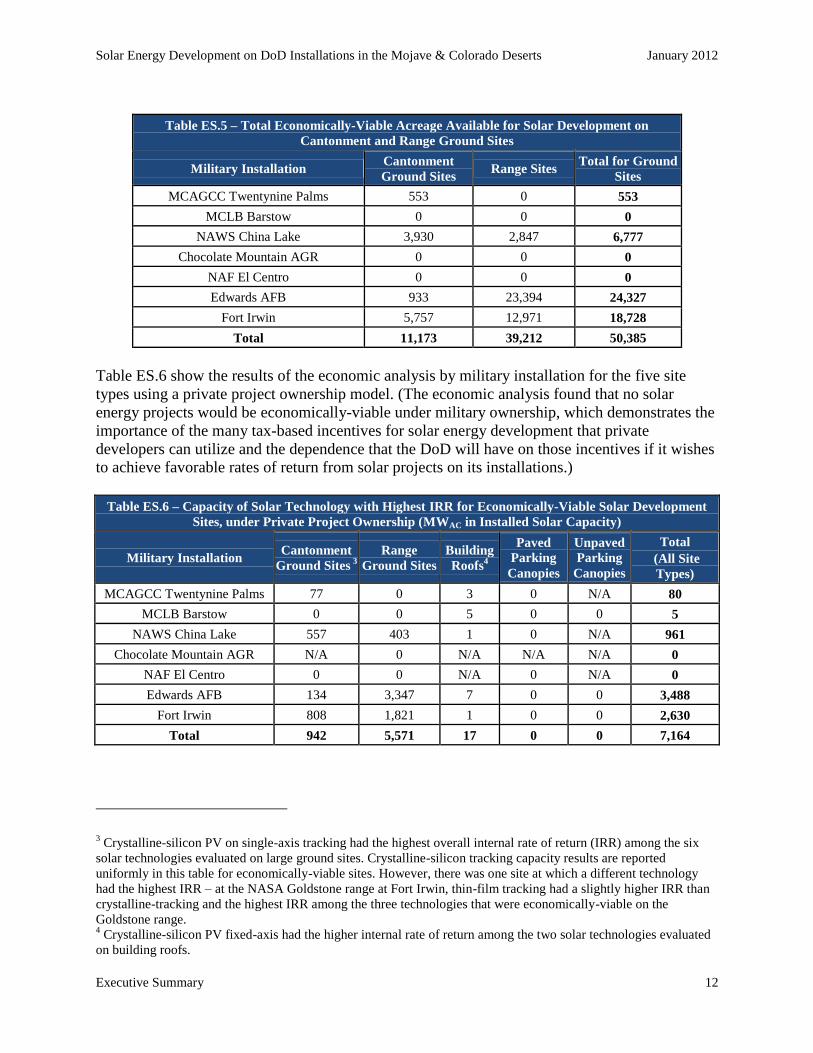
Table ES.5 shows the total economically-viable acreage available for development on
cantonment and range ground sites. The table’s acreage figures reflect 100% of the military
installation acreage with a suitability rating of 1 (“suitable”) and 25% of the military installation
acreage with a suitability rating of 2 (“likely suitable”) or 3 (“questionably suitable”) that are
also economically-viable.
Solar Energy Development on DoD Installations in the Mojave & Colorado Deserts January 2012
Executive Summary 12
Table ES.5 – Total Economically-Viable Acreage Available for Solar Development on
Cantonment and Range Ground Sites
Military Installation Cantonment
Ground Sites Range Sites
Total for Ground
Sites
MCAGCC Twentynine Palms 553 0 553
MCLB Barstow 0 0 0
NAWS China Lake 3,930 2,847 6,777
Chocolate Mountain AGR 0 0 0
NAF El Centro 0 0 0
Edwards AFB 933 23,394 24,327
Fort Irwin 5,757 12,971 18,728
Total 11,173 39,212 50,385
Table ES.6 show the results of the economic analysis by military installation for the five site
types using a private project ownership model. (The economic analysis found that no solar
energy projects would be economically-viable under military ownership, which demonstrates the
importance of the many tax-based incentives for solar energy development that private
developers can utilize and the dependence that the DoD will have on those incentives if it wishes
to achieve favorable rates of return from solar projects on its installations.)
Table ES.6 – Capacity of Solar Technology with Highest IRR for Economically-Viable Solar Development
Sites, under Private Project Ownership (MWAC in Installed Solar Capacity)
Military Installation Cantonment
Ground Sites 3
Range
Ground Sites
Building
Roofs4
Paved
Parking
Canopies
Unpaved
Parking
Canopies
Total
(All Site
Types)
MCAGCC Twentynine Palms 77 0 3 0 N/A 80
MCLB Barstow 0 0 5 0 0 5
NAWS China Lake 557 403 1 0 N/A 961
Chocolate Mountain AGR N/A 0 N/A N/A N/A 0
NAF El Centro 0 0 N/A 0 N/A 0
Edwards AFB 134 3,347 7 0 0 3,488
Fort Irwin 808 1,821 1 0 0 2,630
Total 942 5,571 17 0 0 7,164
3 Crystalline-silicon PV on single-axis tracking had the highest overall internal rate of return (IRR) among the six
solar technologies evaluated on large ground sites. Crystalline-silicon tracking capacity results are reported
uniformly in this table for economically-viable sites. However, there was one site at which a different technology
had the highest IRR – at the NASA Goldstone range at Fort Irwin, thin-film tracking had a slightly higher IRR than
crystalline-tracking and the highest IRR among the three technologies that were economically-viable on the
Goldstone range. 4 Crystalline-silicon PV fixed-axis had the higher internal rate of return among the two solar technologies evaluated
on building roofs.

Solar Energy Development on DoD Installations in the Mojave & Colorado Deserts January 2012
Executive Summary 13
Table ES.7 shows the significant difference in the economic viability between solar energy
technologies assessed in the study. While fixed-mount crystalline silicon PV resulted in the most
MW of economically-viable installed capacity, single-axis tracking crystalline silicon PV had the
highest overall internal rate of return (IRR) among the six solar technologies evaluated on
ground sites. In comparison, the economic viability of concentrating solar power (CSP)
technologies was limited, because of higher installation costs, fewer parcels of land within the
military installations that met the size, shape, and continuity requirements for these technologies,
and special mission conflicts for Dish/Stirling technology at one installation.
Table ES.7 – Capacity for Economically-Viable Solar Development Across Installations, by Solar
Technology under Private Project Ownership (MWAC)
PV Technologies CSP Technologies
Military Installation
Crystalline-
Silicon
Fixed-Mount
Thin-Film
Fixed-Mount
Crystalline-
Silicon
Tracking
Thin-Film
Tracking Dish/Stirling Trough
MCAGCC Twentynine Palms 116 72 77 49 88 0
MCLB Barstow 5 3 0 0 0 0
NAWS China Lake 1,452 901 960 602 0 0
Chocolate Mountain AGR 0 0 0 0 0 0
NAF El Centro 0 0 0 0 0 0
Edwards AFB 5,308 3,295 3,481 2,184 0 0
Fort Irwin 3,930 1 2,629 1,144 0 0
Total 10,811 4,272 7,147 3,979 88 0
The key implications of the economic analysis include:
Large ground sites on the installations in California are economically viable for PV
technologies. Depending on installation specifics, solar development potential may exist
in an installation’s cantonment and/or range areas.
Solar development on building roof sites is economically viable, but cannot make a large-
scale contribution to the installations’ utility scale solar development compared with
ground sites.
Solar development opportunities on paved and unpaved parking facilities at installations
are significant, but their economics are currently poor due to the added cost of metal
parking canopies.
Crystalline-silicon PV with single-axis tracking is the solar technology with the highest
projected investment returns in the study, due to its combination of low cost of
installation and high electricity output. The other PV technology packages analyzed also
generate attractive financial returns on many large ground sites.
The CSP technologies studied were not economically viable in most cases due to their
higher installed costs, though great uncertainty exists about present and future CSP costs
due to the scarcity of recent CSP projects in the U.S.
Only privately developed projects were economically viable. Projects funded by the
government (e.g., using military construction funds) were not viable, given the current
costs of the technology and the tax-based nature of federal solar incentives.

Solar Energy Development on DoD Installations in the Mojave & Colorado Deserts January 2012
Executive Summary 14
ES.5 Energy Security
Energy security for the DoD means having assured access to reliable supplies of energy and the
ability to protect and deliver sufficient energy to meet operational needs. Solar energy can
potentially address one key facet of the energy security question: an installation’s vulnerability to
disruptions of the public electricity grid that powers the installation.
Currently, the DoD relies on individual diesel generators tied to individual critical loads to insure
power in case of a grid outage. As the DoD moves toward using secure micro-grids to meet
energy security needs, solar power on the installations can play an increasingly important role.
Due to the intermittent nature of solar it is unlikely to provide 100% of the required energy and
will require energy storage to fully integrate into a micro-grid. The cost and value of solar energy
to meet DoD’s installation energy security needs is sensitive to individual installation
requirements, the future costs of energy storage, and the design and value of the required micro-
grid.
ES.6 Solar Development Context
Solar development on the nine DoD installations addressed by this study is governed by a
complex web of laws, regulations, and market rules, administered by public and quasi-public
entities at the Federal, State, and local levels. Few if any of these rules were designed with solar
in mind; several were promulgated long before solar energy began its real penetration in the
marketplace in the past 10 years. DoD staff and the private developers they increasingly work
with need to fully understand these rules to avoid or mitigate policy barriers and to maximize the
benefit of any available incentives.
The Federal Government has challenging goals for renewable energy development on DoD
installations. In addition, Federal and state governments created a number of incentives for the
development of solar energy. These incentives can reduce the installed cost of a solar energy
facility by half or more depending upon the size and location of the facility. In addition, the DoD
has more flexibility than other Federal agencies to enter into long-term contracts with third-
parties; under these contracts, the third-party developer builds, owns, and operates the solar
facility, and the DoD purchases the electricity generated by the solar facility and/or leases the
DoD land used for solar development. However, a number of challenges to large-scale solar
development on Federal lands exist, most notably the lack of transmission capacity in the
Mojave and Colorado Deserts.
A second challenge is the uncertainty related to developing solar projects on withdrawn lands
within the boundaries of the nine installations (see Table ES.8). These lands are part of the public
domain supervised by the Bureau of Land Management (BLM), but have been withdrawn from
the operation of public land laws to serve military mission needs. There is disagreement among
the DoD, the Services, and the BLM regarding which organization has the lead for authorizing
and managing renewable energy development on withdrawn lands; this creates uncertainty in the
development process and leaves private-sector developers unclear as to who their counterparty
is.
In addition, the large footprint of utility-scale solar energy facilities means that ground-mounted
systems must be individually reviewed to determine their impact on biological, cultural, and

Solar Energy Development on DoD Installations in the Mojave & Colorado Deserts January 2012
Executive Summary 15
visual resources and a wide variety of construction, interconnection, and other permits must be
acquired before a potential solar development can move forward. Finally, there is inconsistency
within the DoD, and between the DoD and other Federal agencies, in how certain laws,
mandates, and processes should be applied; these inconsistencies slow the solar development
process and create uncertainty for private sector solar developers.
Table ES.8 – Withdrawn Lands5
Base Acres Withdrawn Total Acres Withdrawn %
Edwards AFB 83,110 308,123 27%
Fort Irwin 725,062 754,134 96%
China Lake 1,108,956 1,108,956 100%
Chocolate Mtn. 226,711 463,623 49%
El Centro 47,870 56,289 85%
29 Palms 472,649 595,578 79%
MCLB Barstow 3,683 6,176 60%
Nellis AFB 10,290 14,000 74%
Nevada T&TR 2,919,890 2,919,890 100%
Creech AFB 2,940 2,940 100%
Total 5,601,161 6,229,709 90%
Source: (Pease, 2011)
ES.7 Conclusions and Recommendations
The study quantifies the technically feasible and economically viable solar potential on several
DoD installations. This potential can be harnessed without impact on mission performance and
can result in substantial value delivery to the DoD. However, to realize this opportunity, the DoD
would need to develop a thoughtful program, with the necessary funding, leadership support, and
capacity building to see it to fruition. The following actions may improve the opportunities to
develop solar energy in a manner consistent with the military mission:
1 Clarify withdrawn lands policy with the Department of the Interior (DOI)
Withdrawn lands make up the majority of the lands within the boundaries of the nine
installations considered in this study, and resolving their status and potential use in third-
party financed projects with the DOI is critical if the DoD intends to develop utility-scale
solar energy projects.
2 Work with stakeholders to accelerate transmission development
The lack of transmission capacity is the single largest barrier to large-scale solar
development on the seven California installations. The DoD and the many other
stakeholders affected by this constraint could increase their efforts to encourage
transmission owners and planners to expand capacity on existing transmission lines and
expedite the necessary transmission build-out.
5 The withdrawn land acreage figures reported in this table are currently under review by the DoD/DOI Interagency
Land Use Coordinating Committee and should be considered preliminary data only. For example, other sources
indicate that 8% of China Lake is DoD fee land and 92% is withdrawn land.

Solar Energy Development on DoD Installations in the Mojave & Colorado Deserts January 2012
Executive Summary 16
3 Clarify DoD policy on REC ownership and accounting
In the third-party finance model that will likely dominate renewable energy development
on military installations, it is the developer, not the installation that is the initial owner of
any RECs arising from a project. While an added expense, the DoD will likely have to
join the larger renewable energy market in retaining or purchasing RECs in order to make
progress towards complying with its renewable energy mandates and goals.
4 Clarify and develop programs to achieve energy security goals
The DoD should continue to demonstrate secure micro-grid technologies on military
installations. The DoD could also develop guidance about what types of energy security
challenges military installations need to be prepared to overcome, the types of actions
that can be taken to improve energy security, and the “price” or value that could be
assigned to energy security benefits in the investment process so that the DoD can launch
targeted programs to address its energy security needs.
5 Increase coordination and integration of renewable energy projects and initiatives
between military installations and Services
The DoD should consider making a greater effort to keep energy managers and other key
personnel involved in renewable energy project planning at each military installation
informed about the efforts, initiatives, and lessons learned by other military installations
and Services. This could be one element of a broader effort to build renewable energy
analysis and development capacity at the installation and support organization levels. As
part of this activity, the DoD could also identify and work to address the inconsistent
interpretation of goals, rules, and procedures that currently exists across installations and
Services.
6 Develop a consistent and incentive-focused formula to allocate project benefits and
costs between the host installation and parent organizations
Providing clear incentives for military installations to invest the considerable time and
effort required to host renewable energy projects will likely generate increased interest
and support from military installation staff.
7 Work with BLM to ensure that the Federal Government is maximizing its
compensation from land rentals consistent with fair market value while allowing
solar developers to make an attractive rate of return BLM’s solar land lease rates could increase substantially and still provide an attractive
rate of return for private developers under the study’s assumptions. The DoD should
consider working with BLM to evaluate whether Federal compensation could be re-
calibrated under the BLM’s solar rental formula to continue to capture fair market value
for the Federal Government against the backdrop of rapidly-changing and regionally-
variable solar economics. The DoD and BLM should maintain a cooperative approach so
that private solar developers won’t have an incentive to work with one agency over the
other because of more attractive land rental rates.

Solar Energy Development on DoD Installations in the Mojave & Colorado Deserts January 2012
Executive Summary 17
8 Develop and apply a consistent methodology for mission compatibility analysis
within DoD installations, and analyze DoD lands in advance of programmatic scale-
up
“Conflicts with mission performance” was the single most important factor limiting the
potential for solar development across the nine installations evaluated. This study relied
on discussions with range operators and training managers for most of the mission
compatibility analysis. Because the results relied, to a great degree, on the best
professional judgment of range management staff, they were non-reproducible and
difficult to generalize to other installations or to communicate to the solar development
community. In the future, the DoD should consider developing a mission compatibility
assessment methodology that can be applied within its own installations to address the
full range of renewable energy technologies and the full range of mission activities.
Developing this methodology will require coordination of representative installation-level
staff; managers in the Service-level range management offices; OSD’s Training,
Readiness, Test and Evaluation offices; OSD's Facilities Energy office; as well as the
existing DoD Siting Clearinghouse.
The steps listed above may greatly improve the implementation environment for solar energy on
DoD lands. The results of the study’s Solar Potential Assessment provide a useful starting point
from which each installation can identify high priority areas for further investigation. Private
developers could respond to competitive solicitations to conduct the necessary due diligence and
to offer the DoD some combination of rental payments, discounted power, in-kind consideration,
and/or energy security capability in return for access to these lands.
It is clear that solar developers are highly motivated to develop projects under present conditions,
and those conditions are only expected to improve through 2016 as solar prices continue their
expected decline. However, at the end of 2016 the most important solar tax incentive will
decrease by two thirds. The DoD is in the position to take advantage of the value offered during
this 5-year window. It will take time to address the preparatory steps suggested above and to
create and launch a focused solar development program. By pursuing these challenging
opportunities, the DoD may be able to take advantage of solar resources on military installations
in a manner consistent with the military mission.