Embed Size (px)
Citation preview

Executive Summary• Advantages of Investing in Real Estate• Pittsburgh’s Posed for Growth• Key Investment Considerations• Experienced Management Team• Investment Process• Synergy Capital Investment Portfolio• Investment Risks

Why Invest in Real Estate?

Diversification
Stocks help grow your portfolio
Bonds bring in income
Real estate provides a hedge against inflation and has a low "correlation" with stocks
International investments provide growth and help maintain buying power in an increasing globalized world
Cash gives you and your portfolio security and stability

Stocks vs. Real EstateStock Market
• Intangible Asset• Uninsured• Invest at market price • Returns are unknown• Return subject to market
conditions• Liquid Asset
Private Lending for Real Estate
• Tangible asset you can visit
• Secured by mortgage deed• Collateral is insured• Collateralized below
market value (equity position)
• Returns are known, fixed and agreed upon
• Illiquid asset
What about REITs?
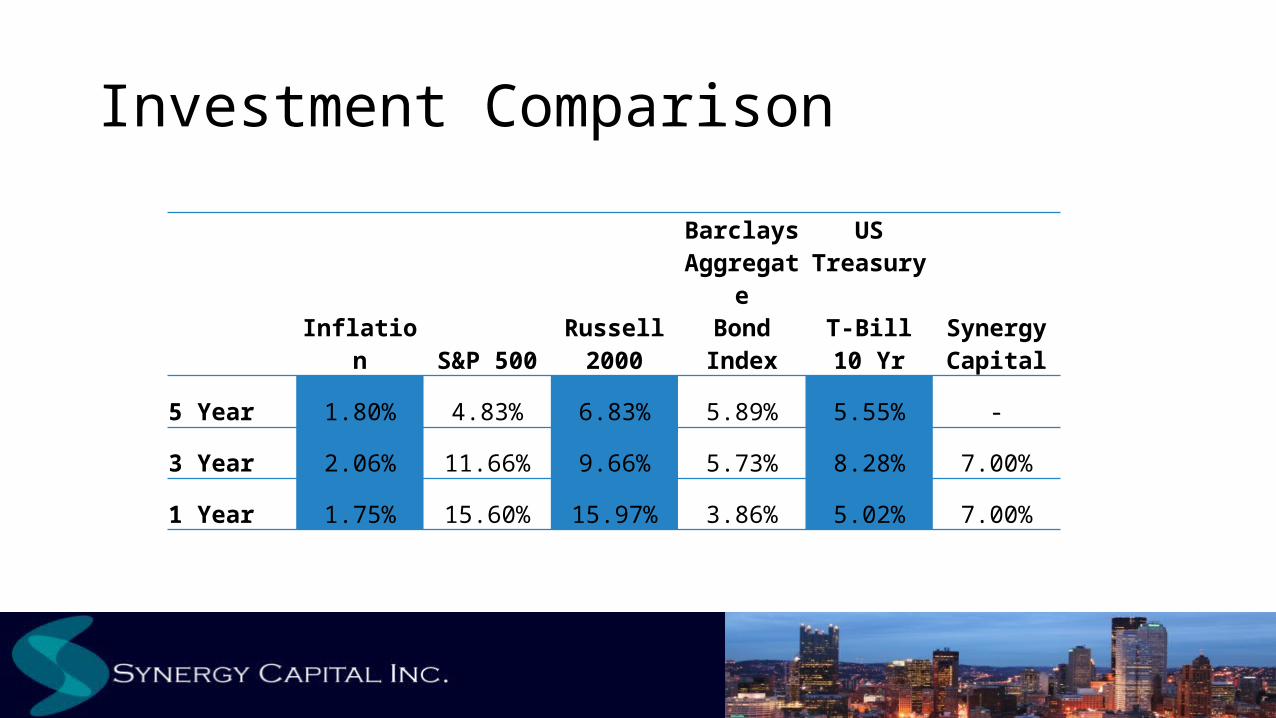
Investment Comparison
Inflation S&P 500Russell2000
BarclaysAggregat
eBondIndex
US Treasury
T-Bill10 Yr
Synergy Capital
5 Year 1.80% 4.83% 6.83% 5.89% 5.55% -
3 Year 2.06% 11.66% 9.66% 5.73% 8.28% 7.00%
1 Year 1.75% 15.60% 15.97% 3.86% 5.02% 7.00%

Why Pittsburgh?

Pittsburgh Accolades• America’s Most Livable City, The Economist and Forbes.com• Best Commercial Real Estate Market, Moody’s Investor
Service• North American City of the Future, fDi• Economically Strongest U.S. Metros, The Brookings
Institution• Top 10 City for Job Growth, Forbes.com• America’s Best Housing Market, Forbes.com• Best Cities for Recent Graduates, Huffington Post• Safe Havens in Real Estate, Kiplinger Magazine
About Pittsburgh• Quality of Life
• Named among the “Best Trips for 2012” by National Geographic Traveler
• Ranked #1 as America's Most Livable City by The Economist in 2011 and Forbes in 2010
• Green Leader• Affordable Housing• Safety & Comfort• World-Class Health Care• Transportation Infrastructure
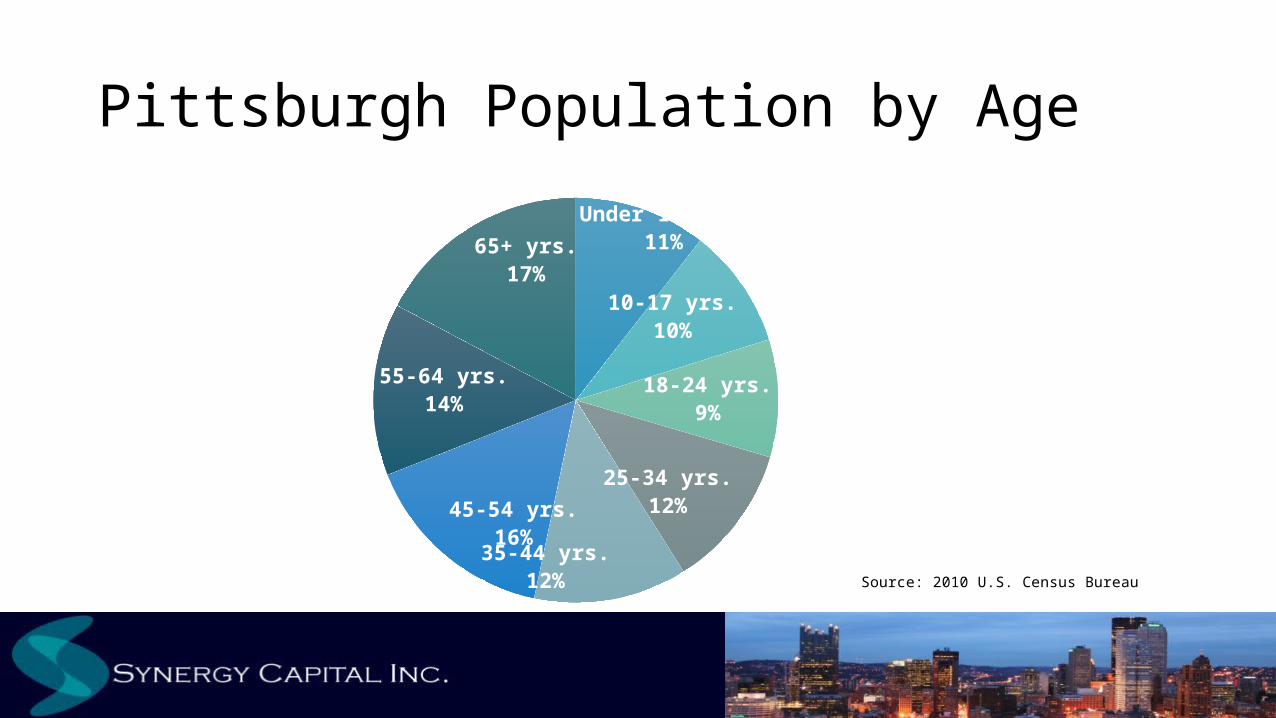
Pittsburgh Population by Age
Under 10 yrs.11%
10-17 yrs.10%
18-24 yrs.9%
25-34 yrs.12%
35-44 yrs.12%
45-54 yrs.16%
55-64 yrs.14%
65+ yrs.17%
Source: 2010 U.S. Census Bureau

Crime Index 2010 (rate per 100,000 inhabitants)
Source: FBI Uniform Crime Report 2010
Metro AreaViolent Crime
Property Crime
Pittsburgh, PA 319.5 1,975.6Boston, MA 406.0 2,189.5San Diego, CA 378.5 2,206.4Raleigh, NC 242.6 2,442.6Richmond, VA 269.3 2,542.9Washington, DC 380.0 2,550.6Philadelphia, PA 551.8 2,662.7Denver, CO 337.1 2,771.4Cleveland, OH 415.7 2,835.6Minneapolis, MN - 2,894.2Portland, OR 268.5 2,929.0Detroit, MI 635.4 2,950.3Baltimore, MD 685.3 3,090.7St. Louis, MO 497.4 3,159.5Cincinnati, OH 314.1 3,340.7Milwaukee, WI 464.1 3,360.3Atlanta, GA 413.8 3,462.6Kansas City, MO 461.3 3,476.1Phoenix, AZ 370.8 3,534.6Indianapolis, IN 627.9 3,827.1Charlotte, NC 528.2 3,902.2Seattle, WA 353.0 3,905.8

Pittsburgh Investment & Development• According to the Brookings Institute, one of only three
U.S. metros to be deemed fully recovered from the Recession• In the last 5 years 217 companies technology
companies attracted $1.3 billion in total investment • Five Years and Running as Top 10 U.S. Location for
Business Investment• Pittsburgh Metro Tops National Average for Job Growth
in High-Wage Industries • Record-High Employment in 2012
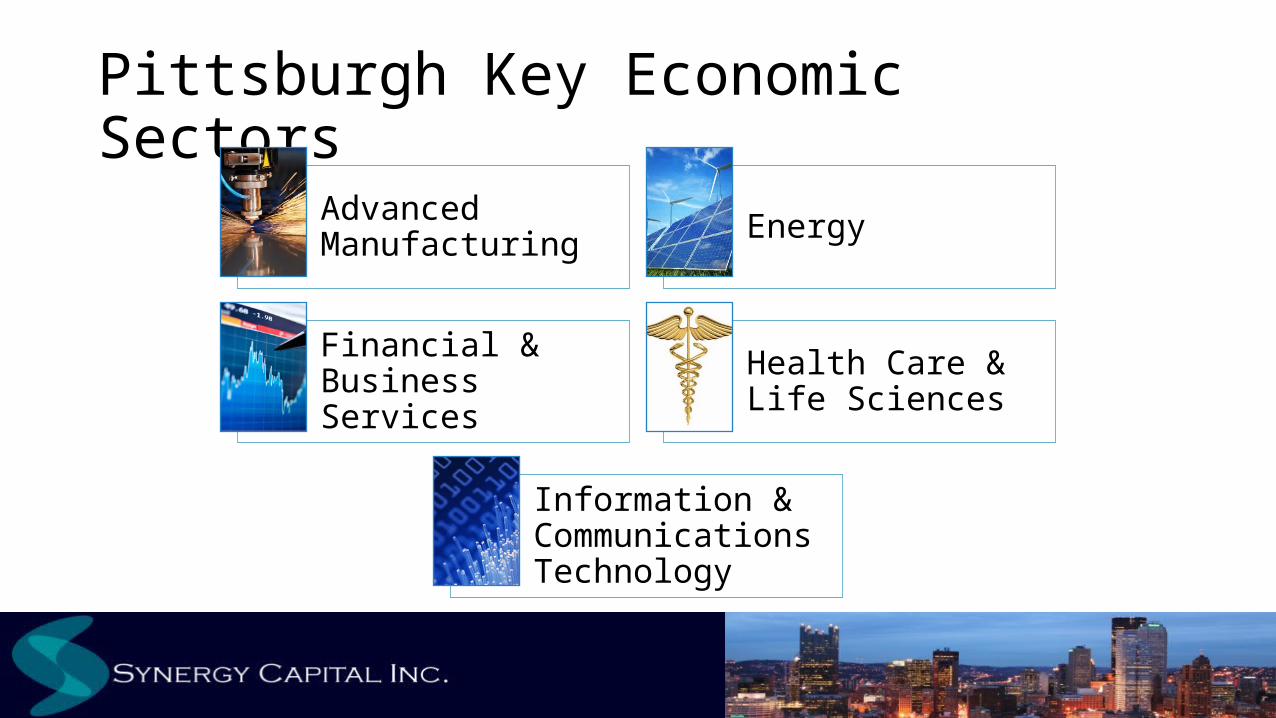
Pittsburgh Key Economic Sectors
Advanced Manufacturing Energy
Financial & Business Services
Health Care & Life Sciences
Information & Communications Technology

Pittsburgh Residential Market• Measured in dollars, Pittsburgh’s December 2012 home sale activity rose $101.2
million, or 34%, from $299.8 million in December 2011 to $401.8 million in December 2012 (RealSTATs: December 2012)
• Residential purchase dollars have jumped 17% in the first ten months of 2012 compared to 2011 (RealSTATs: January 2012 – October 2012)
• In the first ten months of 2012 the Pittsburgh commercial market thrived with non-residential sales activity climbing 28.3% to $1.1 billion in 2012 from $855.4 million in 2011 (RealSTATs: January 2012 – October 2012)
• Pittsburgh topped the U-Haul 2012 National Migration Trend Report with a reported 9.04% increase for the year (Pittsburgh Business Times, April 2013)
• According to a study completed by the Pittsburgh Downtown Partnership, Downtown Pittsburgh's resident population has increased by more than 30% in the past 12 years, and its population is getting younger (Pop City Media, April 2013)
• Lot 24, a 96-unit apartment building built as a second phase of the Cork Factory Lofts in the Strip District, leased up in less than 120 days during typically slow leasing months from December 2012 – March 2013 (Pittsburgh Business Times, April 2013)
Atlanta
, GA
Bal
timor
e, M
D
Bos
ton, M
A
Charlo
tte,
NC
Chicag
o, IL
Cinci
nnati,
OH/K
Y/IN
Cleve
land,
OH
Den
ver, C
O
Det
roit,
MI
Indi
anap
olis, I
N
Mia
mi,
FL
Milw
auke
e, W
I
Min
neapo
lis/S
t. Pau
l, M
N
Philade
lphia
, PA
Phoenix
, AZ
Pittsb
urgh, P
A
Portla
nd, O
R
Richm
ond,
VA
San D
iego
, CA
Seattle
, WA
St. Lo
uis, M
O/IL
Tampa
, FL
Was
hingt
on, D
C/MD/V
A $-
$50,000
$100,000
$150,000
$200,000
$250,000
$300,000
$350,000
$-
$500
$1,000
$1,500
$2,000
$2,500
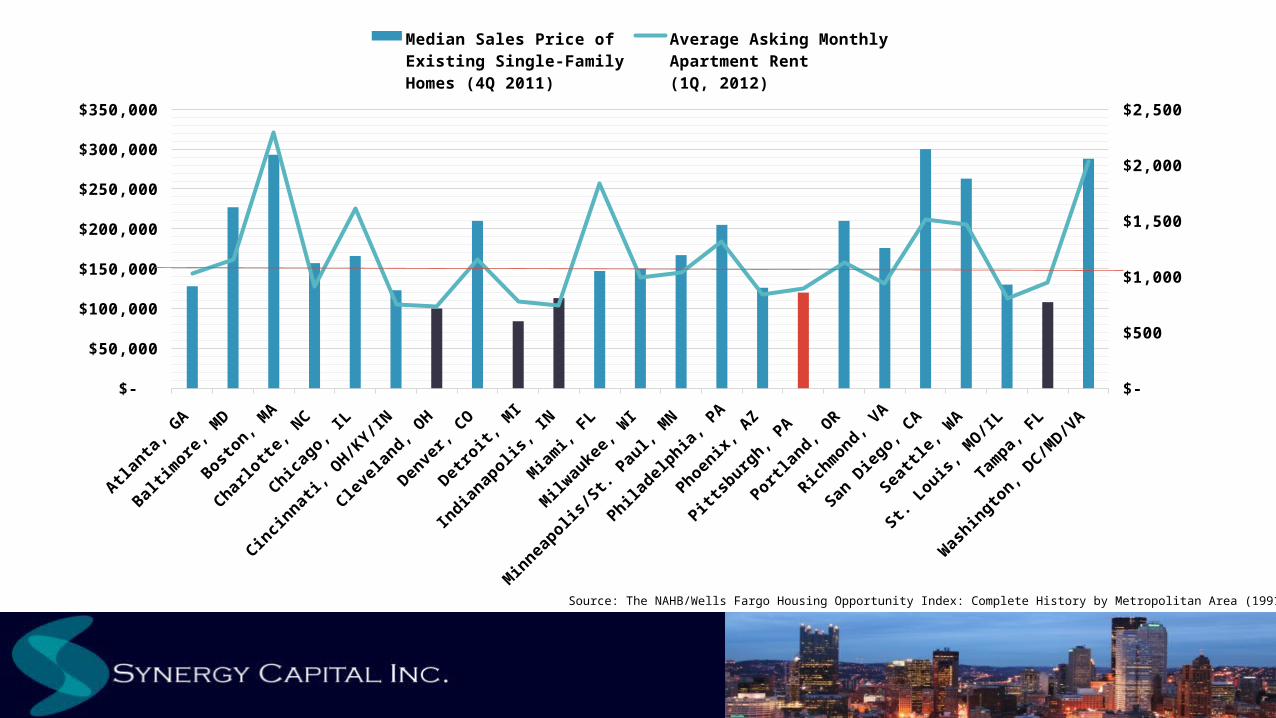
Median Sales Price ofExisting Single-FamilyHomes (4Q 2011)
Average Asking MonthlyApartment Rent(1Q, 2012)
Source: The NAHB/Wells Fargo Housing Opportunity Index: Complete History by Metropolitan Area (1991-Current)

Pittsburgh Commercial Market• The Pittsburgh office market vacancy rate for Q1 of 2013 was 8.0% compared
to a national average of 11.8% (CoStar first quarter 2013, Pittsburgh Market Reports)
• Class A office vacancy remains very low at 6.3% for Q1 of 2013 (CoStar first quarter 2013, Pittsburgh Market Reports)
• Pittsburgh’s retail vacancy rate declined in Q1 of 2013 by 40 basis points to 4.1% which is 260 basis points lower than the national average of 6.7% (CoStar first quarter 2013, Pittsburgh Market Reports)
• Pittsburgh’s industrial market vacancy rate declined in Q1 of 2013 by 20 basis points to 7.9% which is 70 basis points below the national average of 8.6% (CoStar first quarter 2013, Pittsburgh Market Reports)
Pittsburgh’s Posed for Growth
Stability, rising occupancy and rental rates, job growth, and strong key economic sectors- like energy, financial
services and health care - all make for a strong Pittsburgh real estate market.
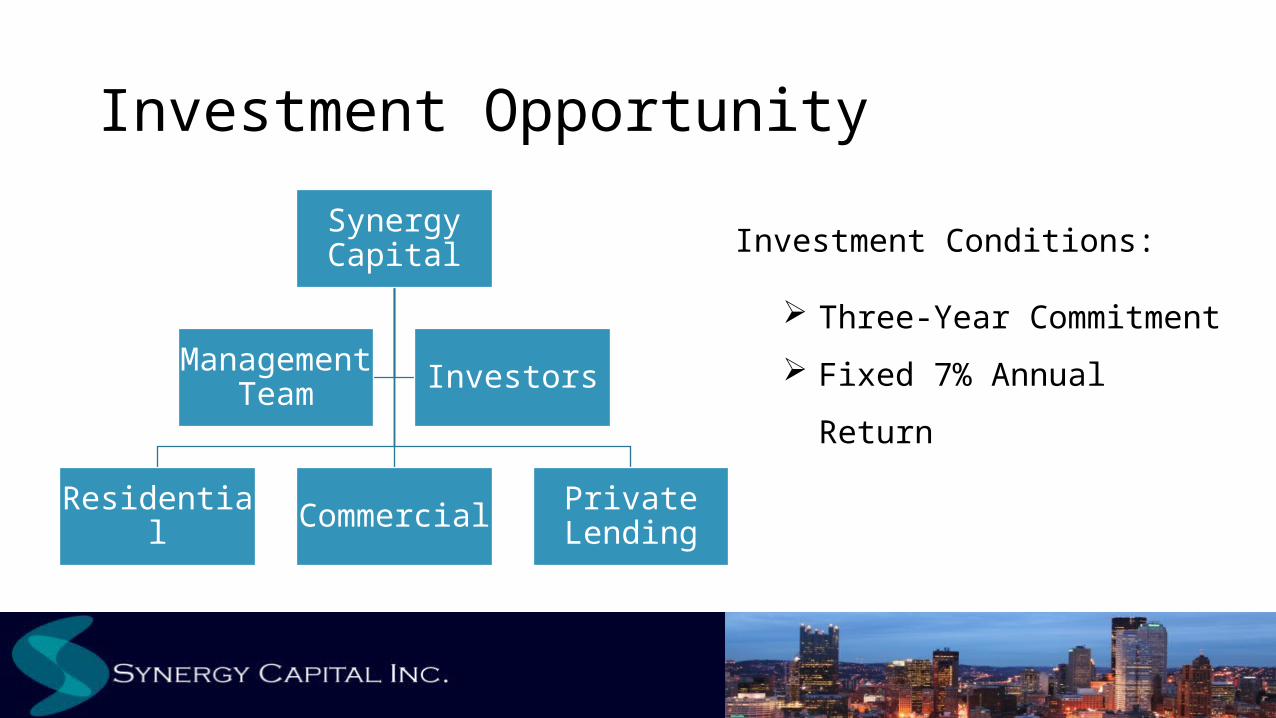
Investment Opportunity
Synergy Capital
Residential Commercial
Private Lending
Management Team Investors
Investment Conditions:
Three-Year Commitment
Fixed 7% Annual Return
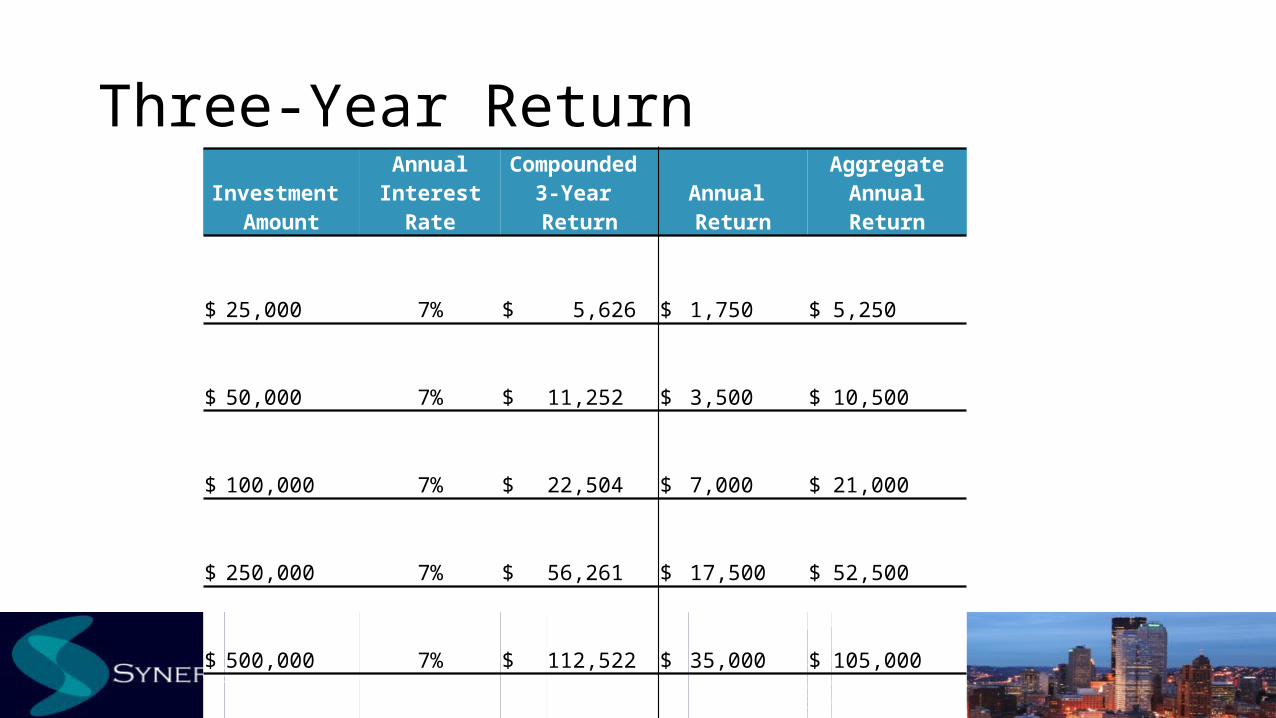
Three-Year Return
Investment Amount
Annual Interest
Rate
Compounded
3-Year Return
Annual Return
Aggregate Annual Return
$ 25,000 7% $
5,626 $
1,750 $
5,250
$ 50,000 7% $
11,252 $
3,500 $
10,500
$ 100,000 7% $
22,504 $
7,000 $
21,000
$ 250,000 7% $
56,261 $
17,500 $
52,500
$ 500,000 7% $
112,522 $
35,000 $
105,000
$ 750,000 7% $
168,782 $
52,500 $
157,500
$ 1,000,000 7% $
225,043 $
70,000 $
210,000

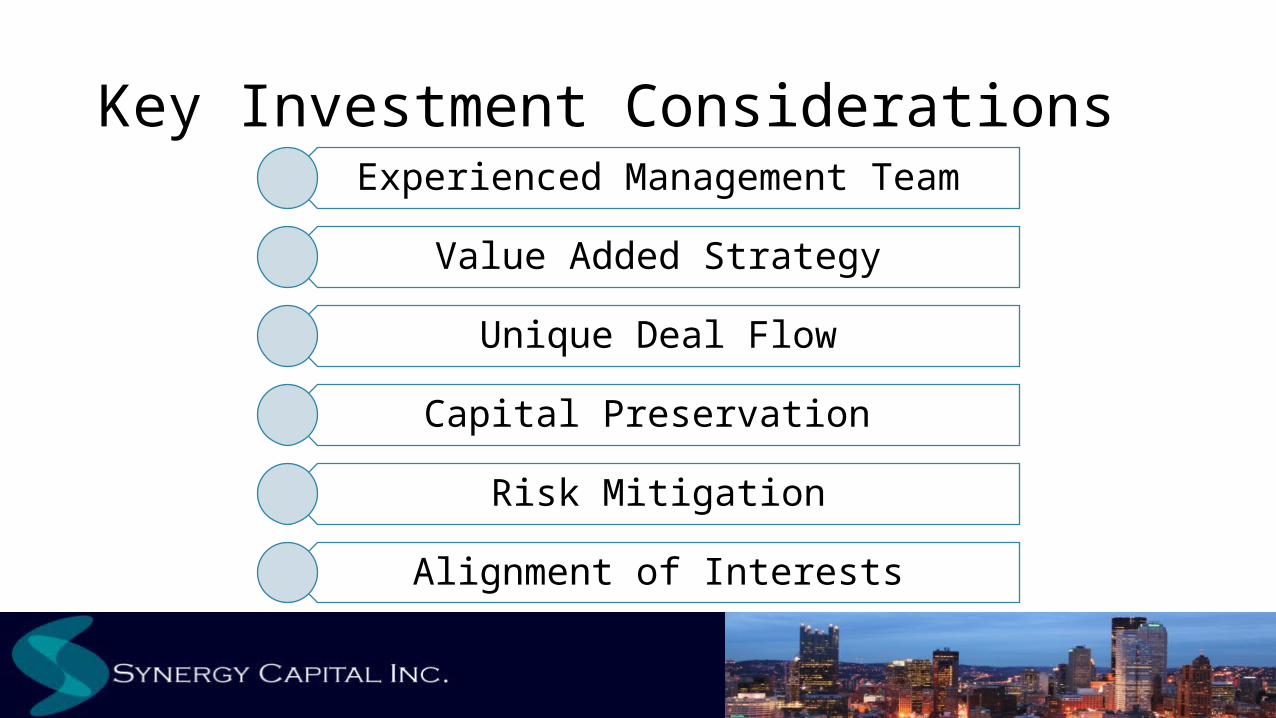
Key Investment ConsiderationsExperienced Management Team
Value Added Strategy
Unique Deal Flow
Capital Preservation
Risk Mitigation
Alignment of Interests
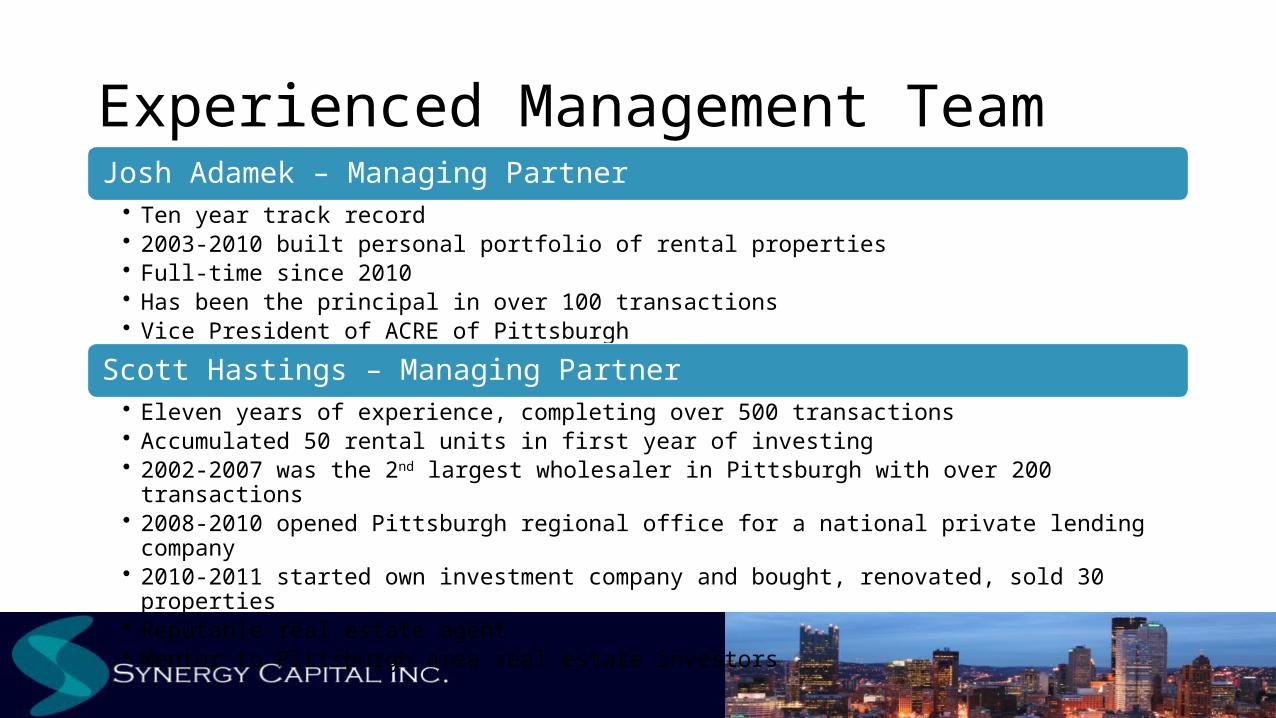
Experienced Management TeamJosh Adamek – Managing Partner
• Ten year track record• 2003-2010 built personal portfolio of rental properties• Full-time since 2010• Has been the principal in over 100 transactions• Vice President of ACRE of Pittsburgh
Scott Hastings – Managing Partner• Eleven years of experience, completing over 500 transactions• Accumulated 50 rental units in first year of investing• 2002-2007 was the 2nd largest wholesaler in Pittsburgh with over 200 transactions• 2008-2010 opened Pittsburgh regional office for a national private lending company• 2010-2011 started own investment company and bought, renovated, sold 30 properties• Reputable real estate agent• Mentor to Pittsburgh area real estate investors
Key Investment ConsiderationsExperienced Management Team
Value Added Strategy
Unique Deal Flow
Capital Preservation
Risk Mitigation
Alignment of Interests

Synergy Capital Track Record• Raised over $3.5 million in private funds • Sold more than 30 single family homes • Over $4.5 million in gross sales revenues • Synergy Capital has never defaulted on an agreement
with an investor • All investors have reinvested funds
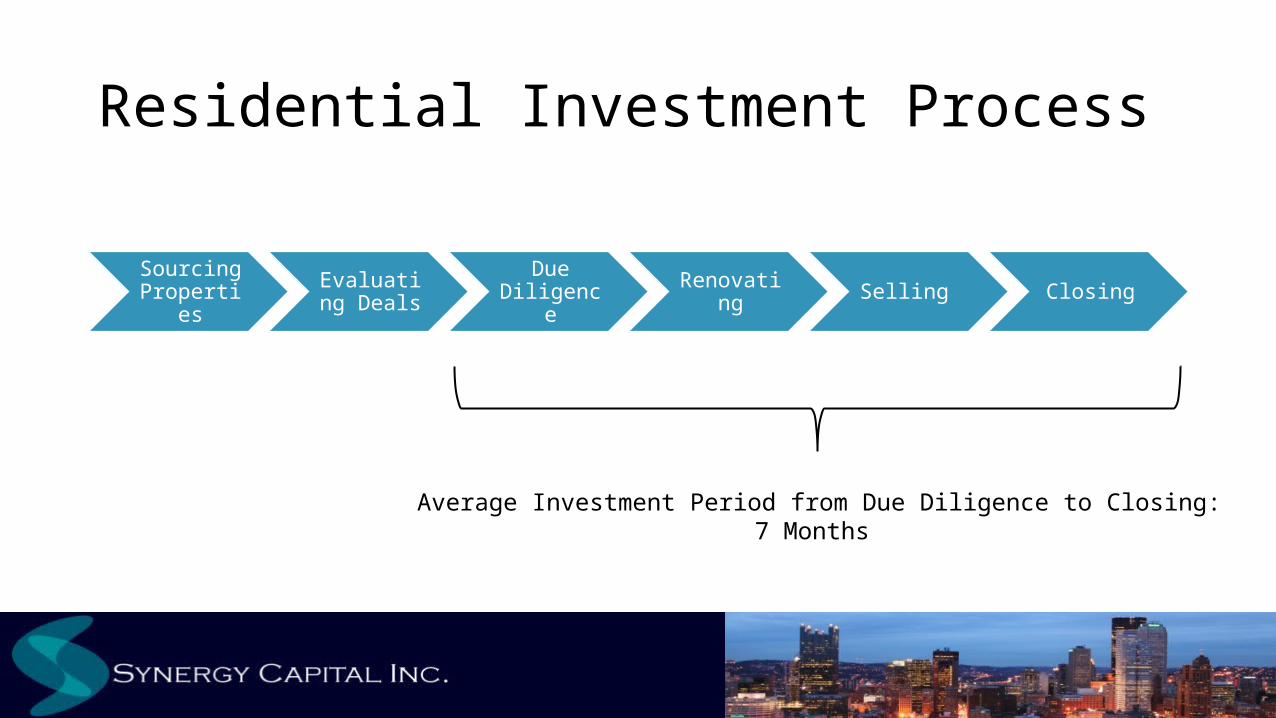
Residential Investment Process
Sourcing Propertie
s
Evaluating Deals
Due Diligence
Renovating Selling Closing
Average Investment Period from Due Diligence to Closing:7 Months

Residential Investment ProcessSourcing Propertie
s
Evaluating Deals
Due Diligence
Renovating Selling Closing
MLS – 60%• Foreclosures• Estate Sales• Distressed Sales• Short Sales
Leads – 40% • Wholesale leads (We Buy Houses etc.)• For Sale by Owner (FSBO): signs/online, craigslist, etc. • Referrals, Other Investors
Residential Investment ProcessSourcing Propertie
s
Evaluating Deals
Due Diligence
Renovating Selling Closing
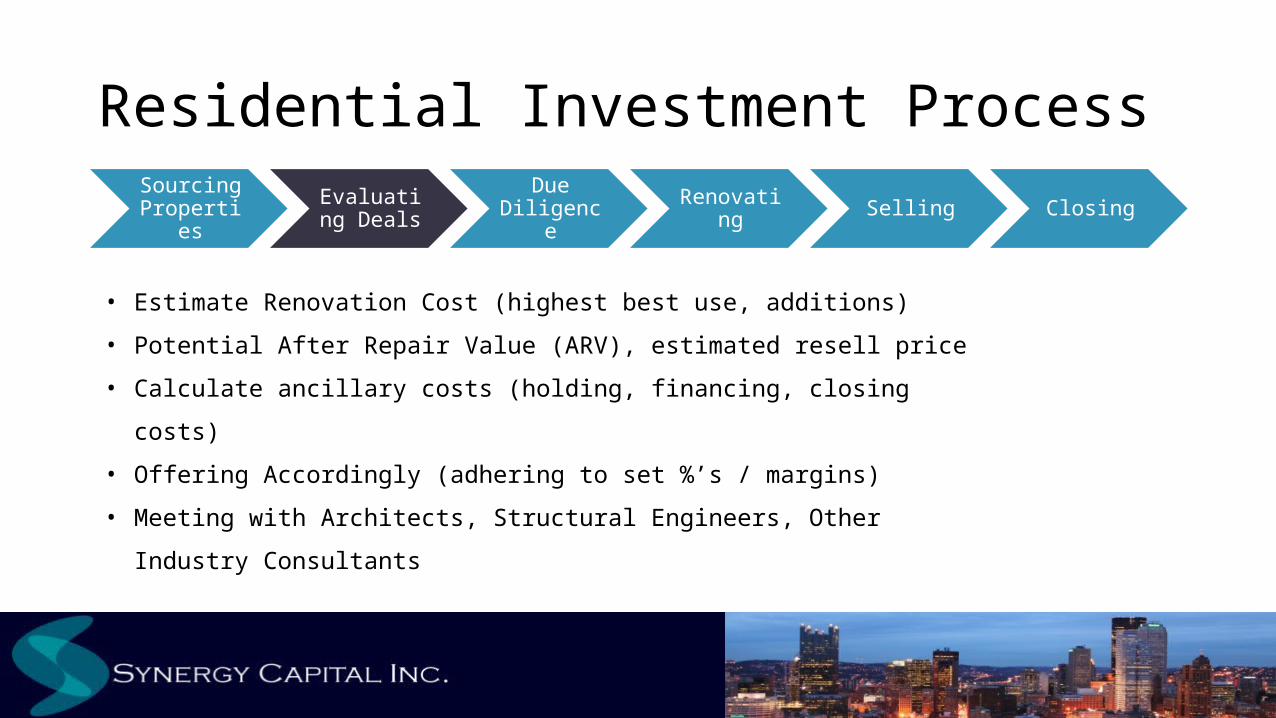
• Estimate Renovation Cost (highest best use, additions)
• Potential After Repair Value (ARV), estimated resell price
• Calculate ancillary costs (holding, financing, closing costs)
• Offering Accordingly (adhering to set %’s / margins)
• Meeting with Architects, Structural Engineers, Other Industry
Consultants
Residential Investment ProcessSourcing Propertie
s
Evaluating Deals
Due Diligence
Renovating Selling Closing
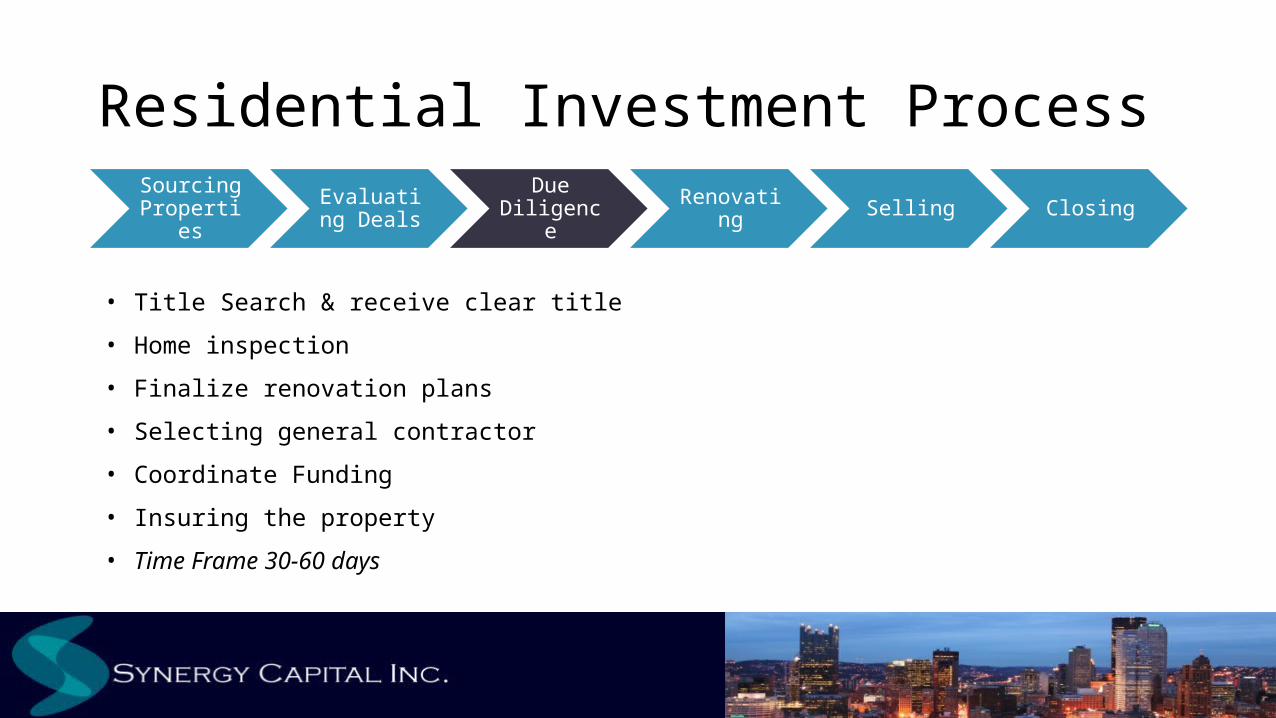
• Title Search & receive clear title
• Home inspection
• Finalize renovation plans
• Selecting general contractor
• Coordinate Funding
• Insuring the property
• Time Frame 30-60 days
Residential Investment ProcessSourcing Propertie
s
Evaluating Deals
Due Diligence
Renovating Selling Closing
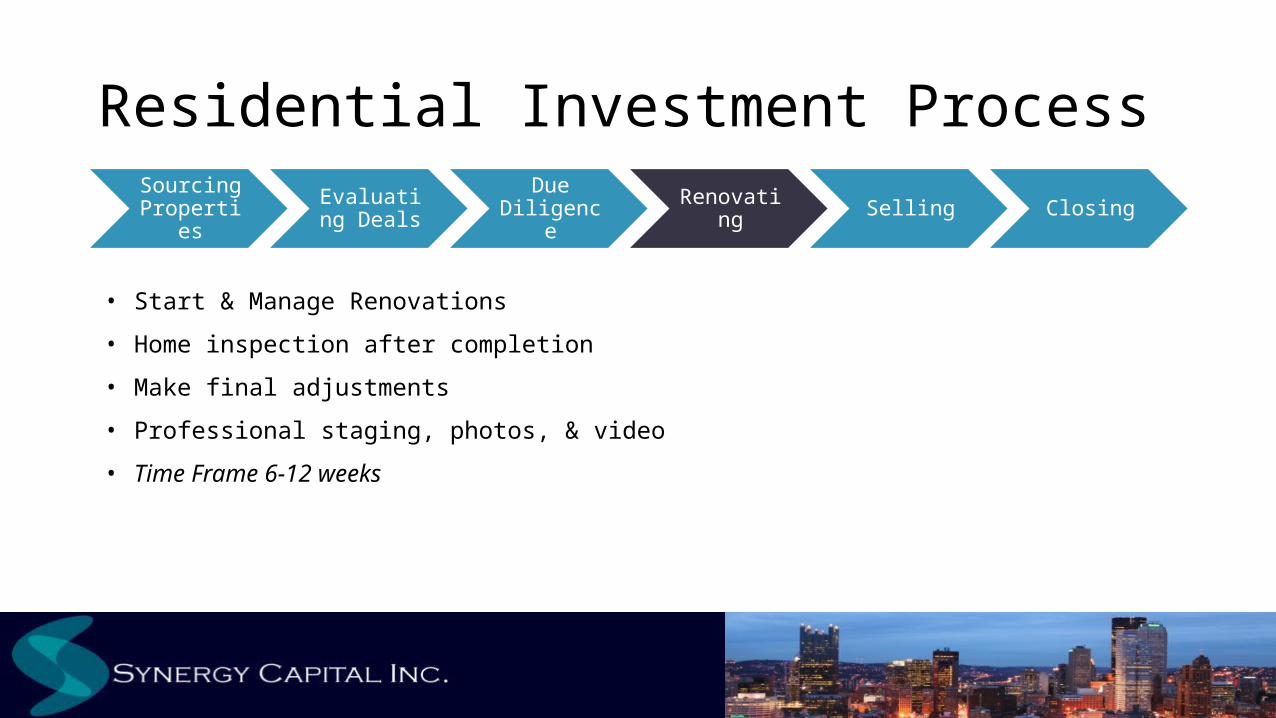
• Start & Manage Renovations
• Home inspection after completion
• Make final adjustments
• Professional staging, photos, & video
• Time Frame 6-12 weeks
Residential Investment ProcessSourcing Propertie
s
Evaluating Deals
Due Diligence
Renovating Selling Closing
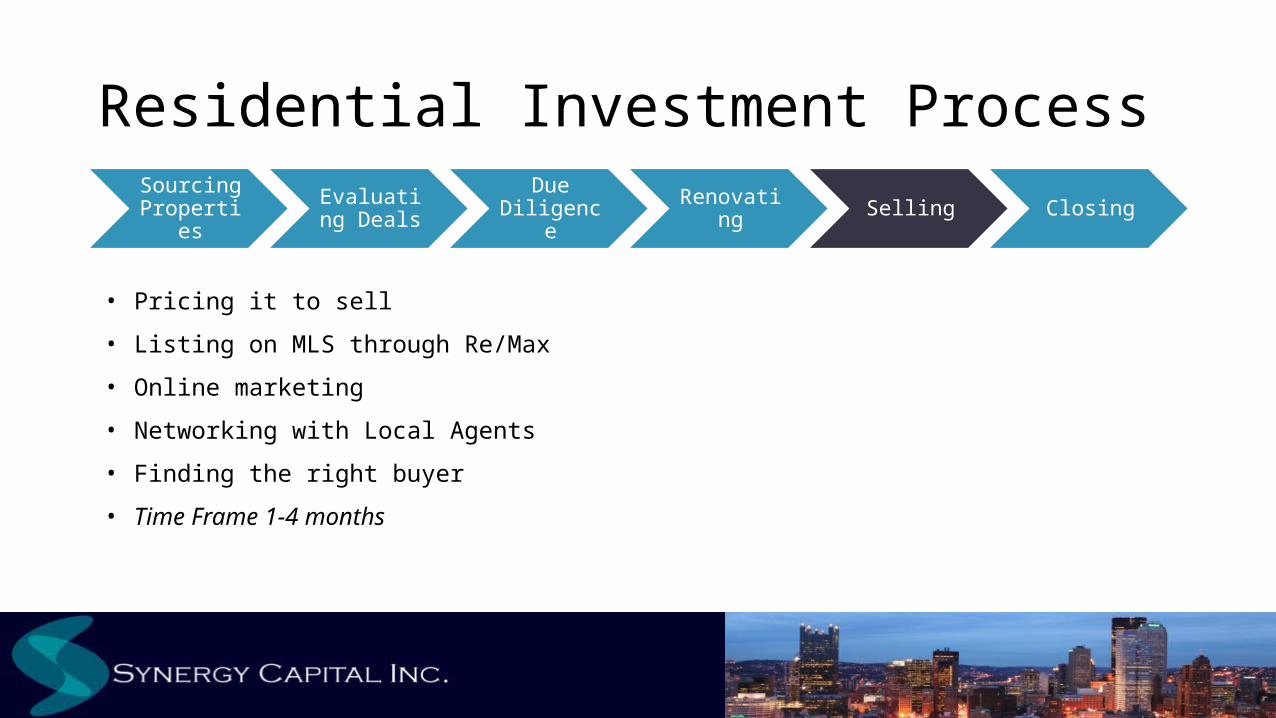
• Pricing it to sell
• Listing on MLS through Re/Max
• Online marketing
• Networking with Local Agents
• Finding the right buyer
• Time Frame 1-4 months
Residential Investment ProcessSourcing Propertie
s
Evaluating Deals
Due Diligence
Renovating Selling Closing
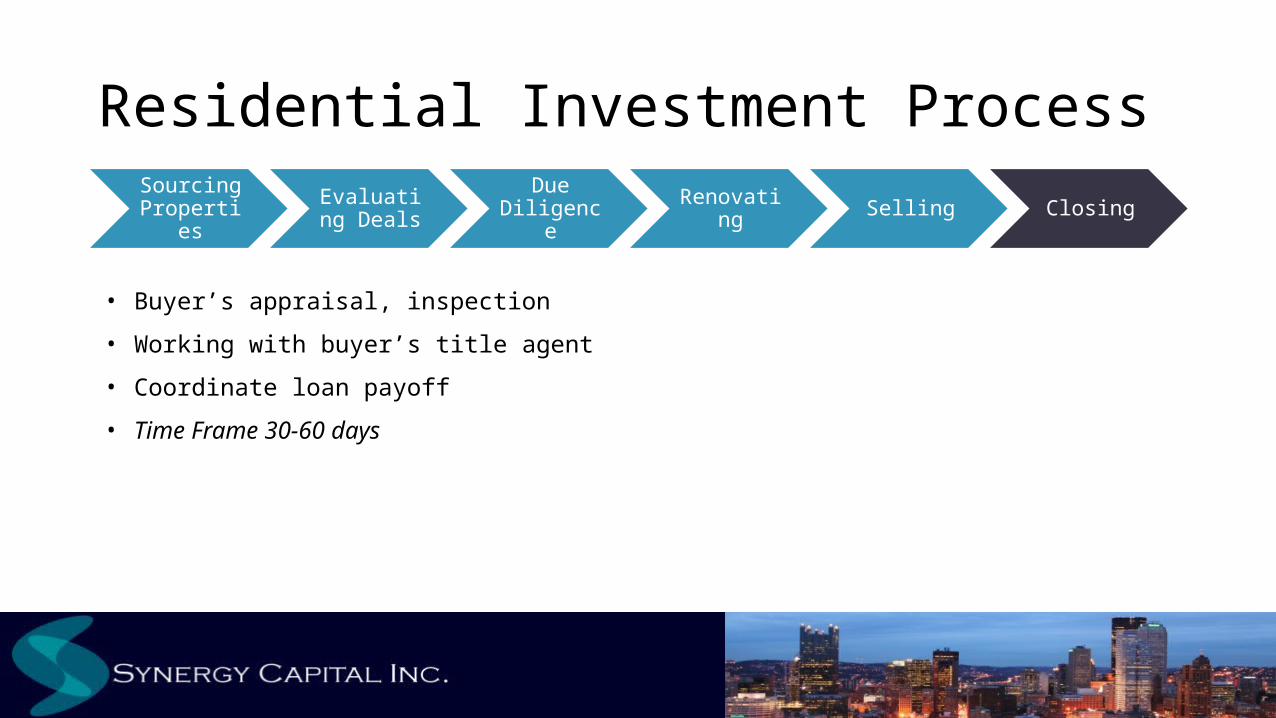
• Buyer’s appraisal, inspection
• Working with buyer’s title agent
• Coordinate loan payoff
• Time Frame 30-60 days

ResidentialInvestment Portfolio
Renovation Projects
Wholesale Deals
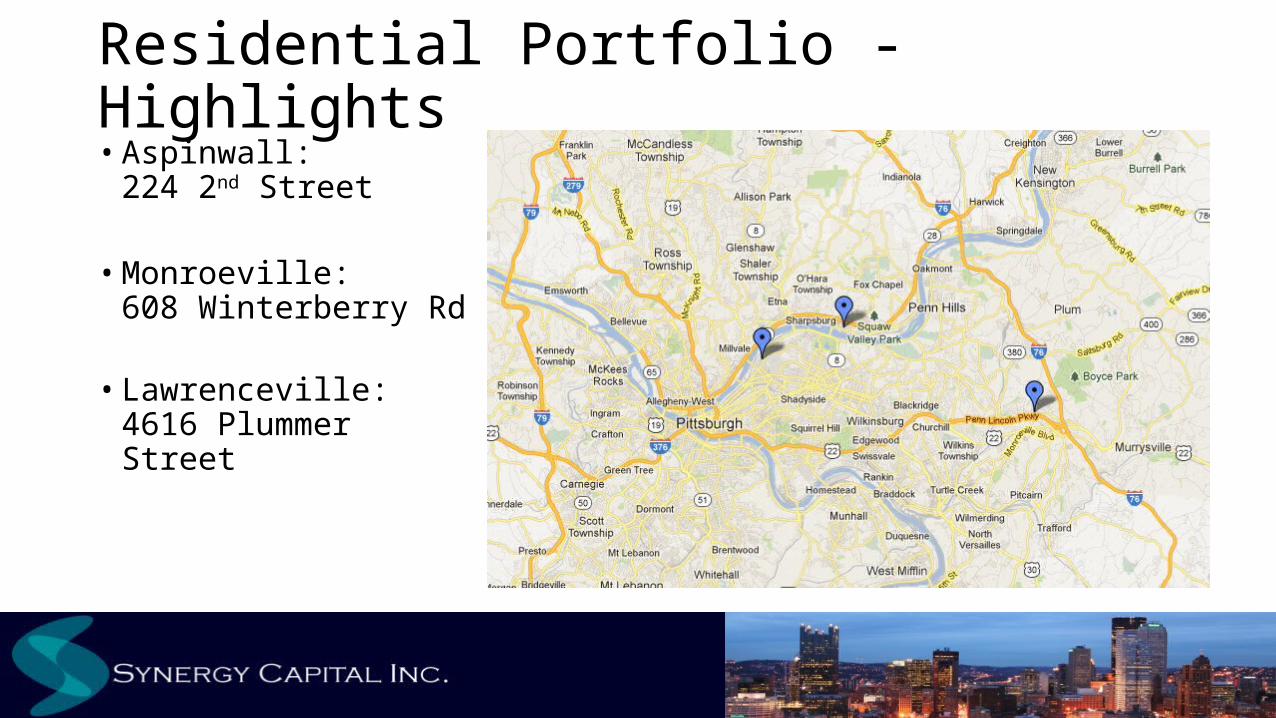
Residential Portfolio - Highlights• Aspinwall:
224 2nd Street
• Monroeville:608 Winterberry Rd
• Lawrenceville:4616 Plummer Street
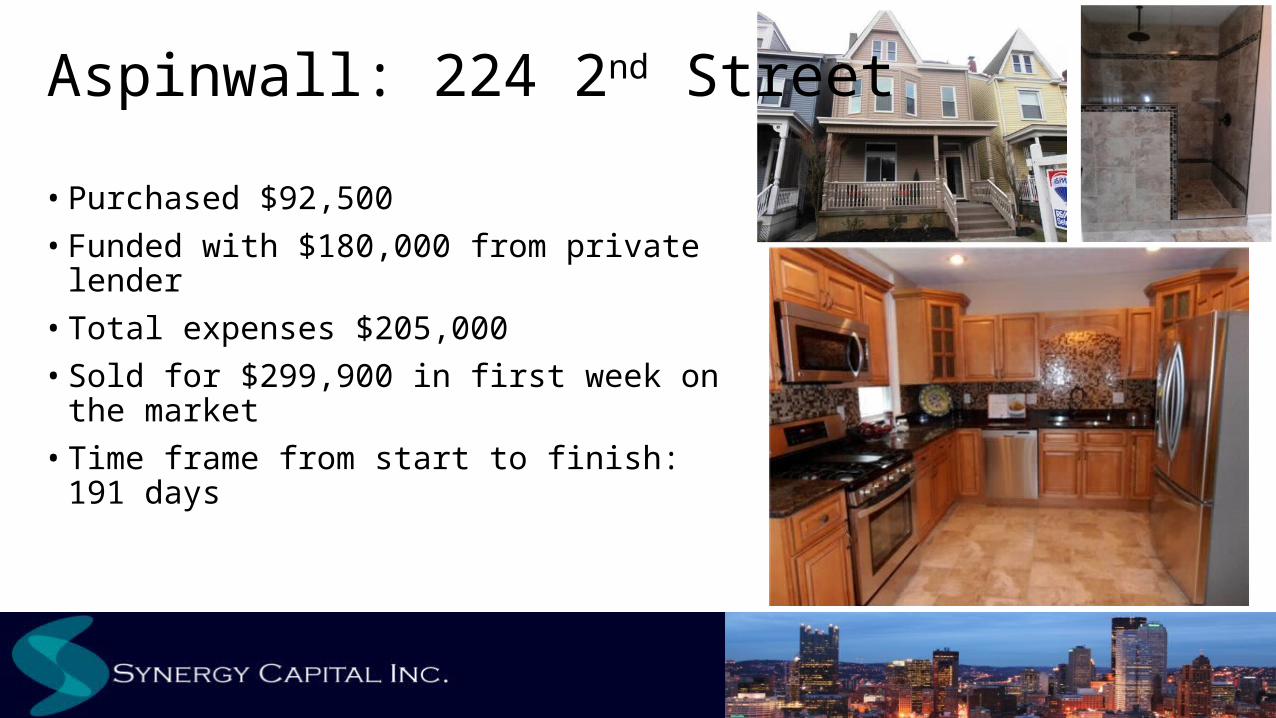
• Purchased $92,500
• Funded with $180,000 from private lender
• Total expenses $205,000
• Sold for $299,900 in first week on the market
• Time frame from start to finish: 191 days
Aspinwall: 224 2nd Street
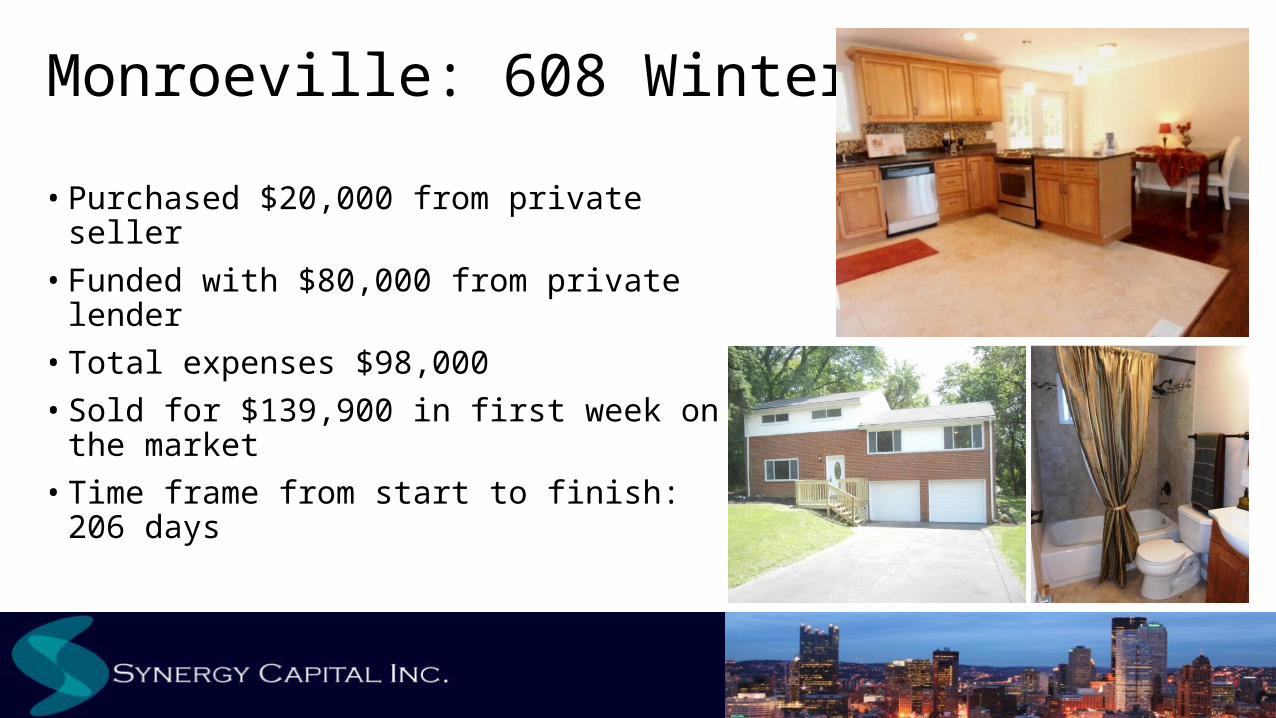
• Purchased $20,000 from private seller
• Funded with $80,000 from private lender
• Total expenses $98,000
• Sold for $139,900 in first week on the market
• Time frame from start to finish: 206 days
Monroeville: 608 Winterberry
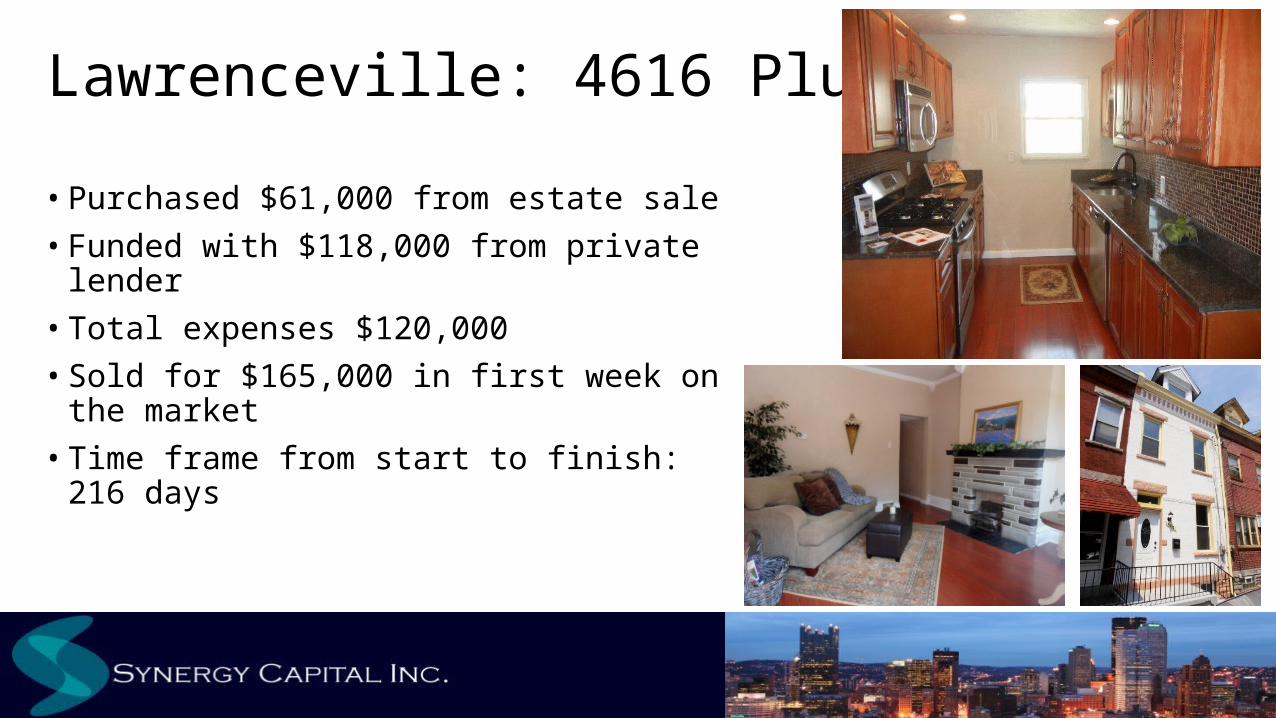
• Purchased $61,000 from estate sale
• Funded with $118,000 from private lender
• Total expenses $120,000
• Sold for $165,000 in first week on the market
• Time frame from start to finish: 216 days
Lawrenceville: 4616 Plummer
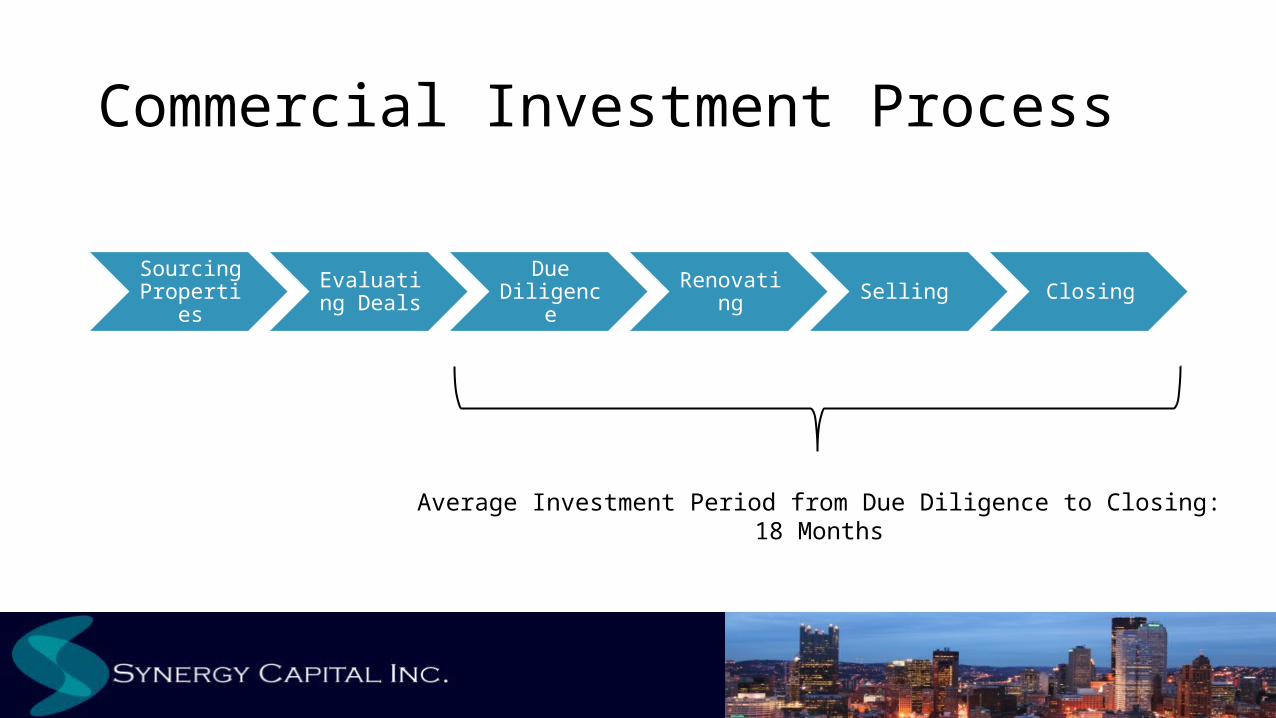
Commercial Investment Process
Sourcing Propertie
s
Evaluating Deals
Due Diligence
Renovating Selling Closing
Average Investment Period from Due Diligence to Closing:18 Months
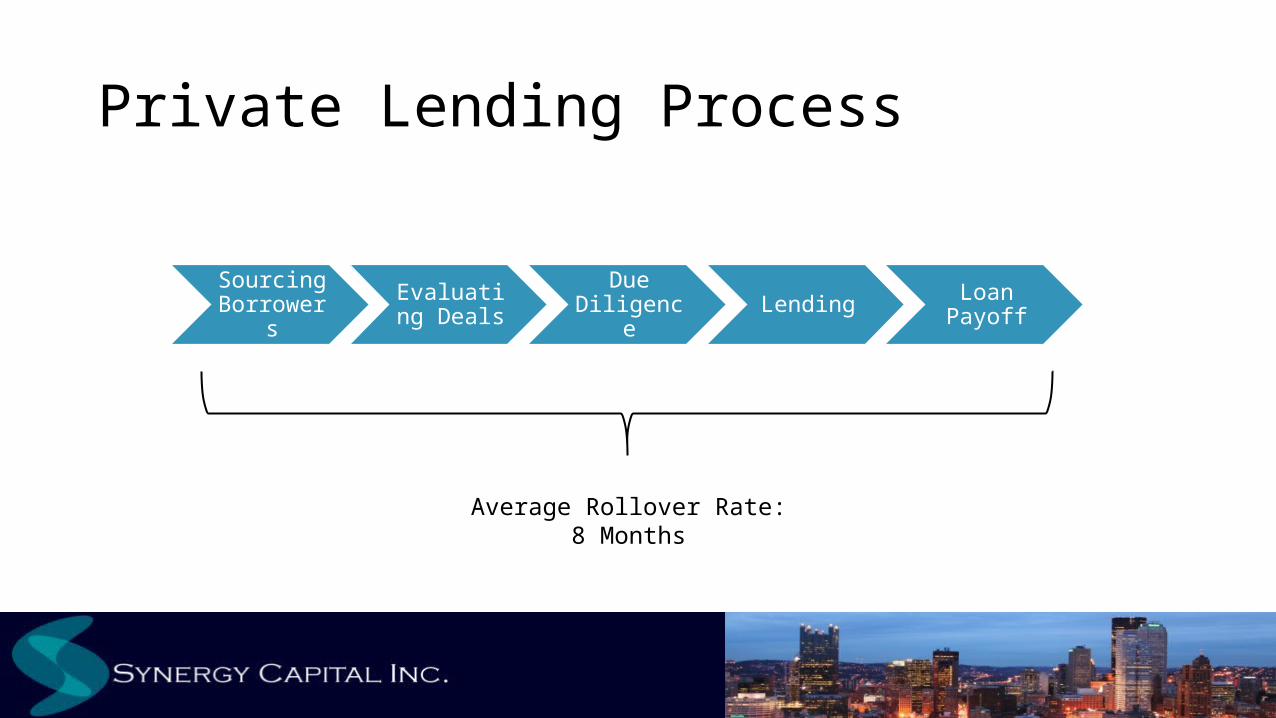
Private Lending Process
Sourcing Borrower
s
Evaluating Deals
Due Diligence Lending Loan
Payoff
Average Rollover Rate:8 Months

Private Lending ProcessSourcing Borrower
s
Evaluating Deals
Due Diligence Lending Loan
Payoff
• Synergy Capital will loan a max LTV of 65% which includes purchase costs, construction costs, closing costs, insurance, a six month interest reserve, and loan origination fees.
• Subject-to-Repair Appraisal: based on construction plans and specs for the renovations to be completed
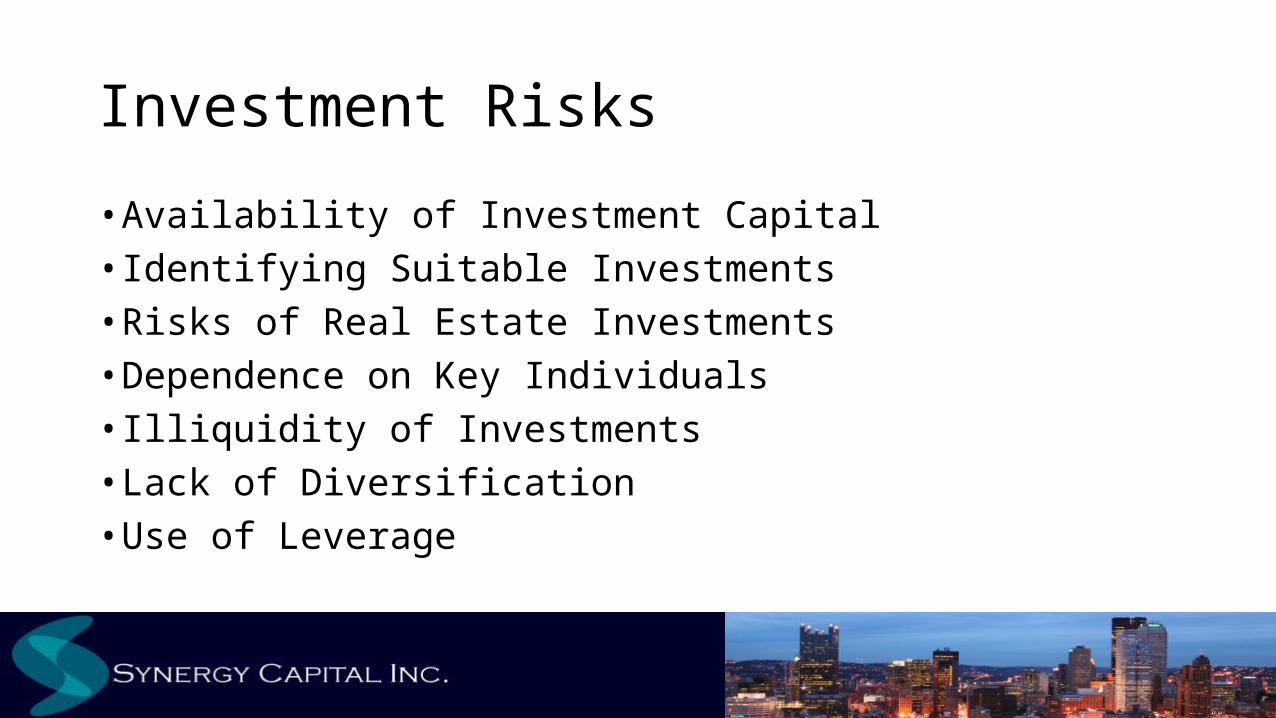
Investment Risks
• Availability of Investment Capital • Identifying Suitable Investments• Risks of Real Estate Investments• Dependence on Key Individuals• Illiquidity of Investments• Lack of Diversification• Use of Leverage
Invest with Synergy Capital• Real estate is a tremendous opportunity to add value and
diversification to investment portfolios and outperform industry averages• Information-intensive aspect of real estate investing favor
experienced and well connected investors like our local firm• Specialized managers with excellent market knowledge add
enormous value• Invested management team encourages thoughtful
acquisitions, careful oversight, and timely dispositions • Management team garners a margin of safety by paying a low
purchase price in which properties are acquired at a discount

Exhibits

Exhibit 1: Self-Directed IRA or 401(k)• All investments must be arms length, meaning the buyer and seller are acting in their own self-
interest and there is no influence from other parties.
• You cannot sell or buy property from a disqualified individual. Disqualified individuals include you, your spouse, your parents, your kids and/or their spouses, grandchildren, grandparents, investment advisors, fiduciaries and entities where the disqualified individual owns 50% or more interest.
• You cannot receive immediate benefit from a property owned by your IRA. No vacation homes, personal residences or office spaces because these would benefit you in some way.
• You cannot lend yourself money to perform rehab work or cosmetic work on the home purchased by your IRA. You can't perform any maintenance on the home or even furnish the home. It's all done via a property management company, which is nice because then you don't have to deal with tenants. All income or rental profits generated from your investment must go back to your self-directed IRA and all expenses like improvements, property taxes and bills directly related to the investment property must be paid from your IRA account.
• Your IRA may invest in: Single-family residences and vacation homes, Certain condominiums and duplexes, Multi-family (5+ units) properties, Commercial properties (retail/office/warehouse), International properties
• A self-directed 401(k) offers the same benefits of pre-tax savings and automated payroll deductions that you'll find with a traditional 401(k) plan. The difference is in your investment choices.
• A self-directed plan is similar to a brokerage account. It's essentially a do-it-yourself 401(k), and you're the fund manager. Rather than choosing 401(k) investments from a short menu of pre-approved mutual funds, participating employees have an entire universe of investments to consider.