Embed Size (px)
Citation preview

ExecutiveSummary1MarketOverview2DemandAnalysis3SupplyAnalysis4SiteAnalysis5Conclusion6
MARKET ANALYSIS
ExecutiveSummary1MarketOverview2DemandAnalysis3SupplyAnalysis4SiteAnalysis5Conclusion6
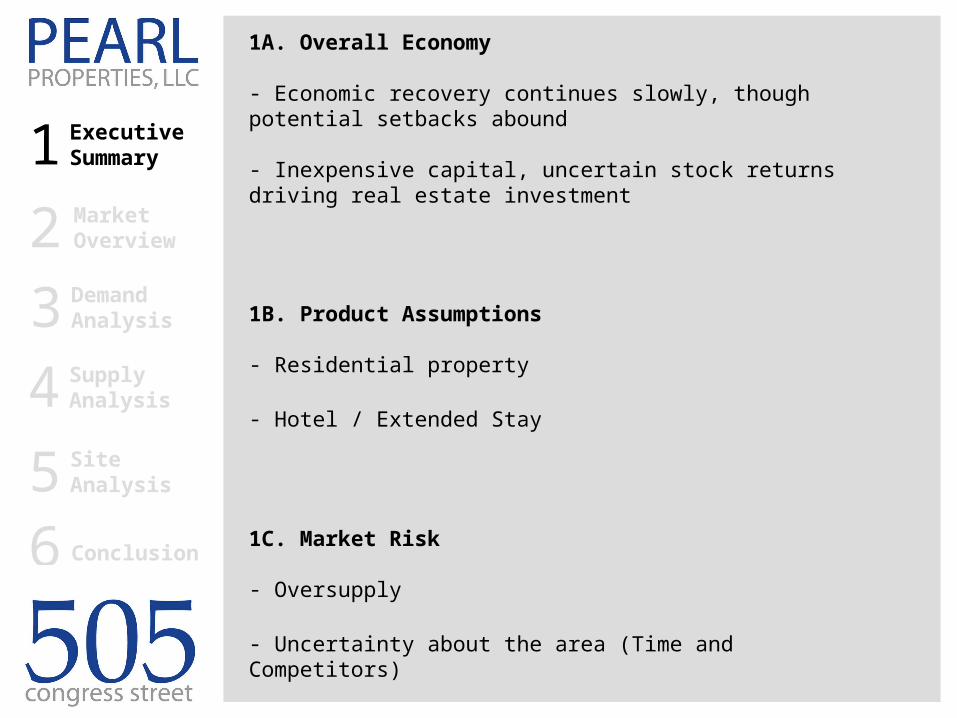
1A. Overall Economy
- Economic recovery continues slowly, though potential setbacks abound
- Inexpensive capital, uncertain stock returns driving real estate investment
1B. Product Assumptions
- Residential property
- Hotel / Extended Stay
1C. Market Risk
- Oversupply
- Uncertainty about the area (Time and Competitors)
ExecutiveSummary1

ExecutiveSummary1MarketOverview2DemandAnalysis3SupplyAnalysis4SiteAnalysis5Conclusion6
2A. Historical Analysis of Boston’s Economy- All indicators show steady growth until 2001, then a substantial drop and rebounded in 2003 and 2004
- Boston’s data corresponds to national trends, although slightly more depressed than overall U.S.
MarketOverview2
2B. Future Trends for Boston’s Economy- Boston’s slow growth continues but with certain segments showing stronger performance (special attention in our case for Professional & Business Service and Hospitality & Leisure)

ExecutiveSummary1MarketOverview2DemandAnalysis3SupplyAnalysis4SiteAnalysis5Conclusion6
3A. Market Area
Assumption 1:Multi-Family Housing
- Geography: 3-mile radius-User: Primarily CBD and Convention Center white-collars- Price: Medium
Assumption 2: Hotel / Extended Stay
- Geography: 5-mile radius-User: Conventioneers, tourists, business travelers- Price: Medium
DemandAnalysis3

ExecutiveSummary1MarketOverview2DemandAnalysis3SupplyAnalysis4SiteAnalysis5Conclusion6
3B. Demand Drivers
Assumption 1:Multi-Family Housing
- Employment sectors with highest projected growth rates are over-represented in S. Boston as compared to MSA. Therefore, demand growth in S. Boston is expected to outpace the overall region
Assumption 2: Hotel / Extended Stay
- Employment Growth- Masterplan “The Seaport Public Realm Plan” (Convention Center)
DemandAnalysis3
- Market continuing to recover slowly, with tepid job growth
- Boston’s economy historically shows similar trends as national scenario

ExecutiveSummary1MarketOverview2DemandAnalysis3SupplyAnalysis4SiteAnalysis5Conclusion6
3C. Absorption
Assumption 1:Multi-Family Housing
- Employment growth
Assumption 2: Hotel / Extended Stay
- Masterplan “The Seaport Public Realm Plan” (Convention Center)
DemandAnalysis3
Occupied Room
Nights / Year
2600
2650
2700
2750
2800
2850
2900
2950
3000
3050
3100
3150
1,996 1,997 1,998 1,999 2,000 2,001 2,002 2,003 2,004 2,005 2,006 2,007 2,008 2,009 2,010
-10000
-8000
-6000
-4000
-2000
0
2000
4000
6000
8000
10000
Total Employment Net Absorption

ExecutiveSummary1MarketOverview2DemandAnalysis3SupplyAnalysis4SiteAnalysis5Conclusion6
4A. Existing Inventory and Near-term Inventory
- Stock growth of 6.5% over last 10 years, outpaced employment growth by 1.5%.
- Recent employment spike driving absorption and vacancies.
- Vacancy rate at LT avg, expected to trend slowly upwards over 5 years.
- 2005 completions 50% over LT avg, will decline beginning in 2006, but remain ahead of absorption going forward.Supply
Analysis4Vacancy rate

ExecutiveSummary1MarketOverview2DemandAnalysis3SupplyAnalysis4SiteAnalysis5Conclusion6
5.5 MSF including 1,559 residential units planned or under construction
744 units plannedor under construction
6.2 MSF including 2,500 residential unitsin pre-planning
Project location505 Congress St.
S. Boston stock = 4% of MSA stock
S. Boston pipeline = 29% of MSA’s projected 5 year net absorption
4B. South Boston Supply Pipeline
SupplyAnalysis4
Convention Center Hotel under construction 800-rooms + 320 second phase

ExecutiveSummary1MarketOverview2DemandAnalysis3SupplyAnalysis4SiteAnalysis5Conclusion6
4C. Business / Building Cycles
- CA/T opportunity for redevelopment- BCEC since 2004- Fort Point Channel, “100 acres development”- Fan Pier, ICA- Pier 4- World Trade Center- South Station Tower (Office + Hotel)- Silver Line
SupplyAnalysis4
ExecutiveSummary1MarketOverview2DemandAnalysis3SupplyAnalysis4SiteAnalysis5Conclusion6
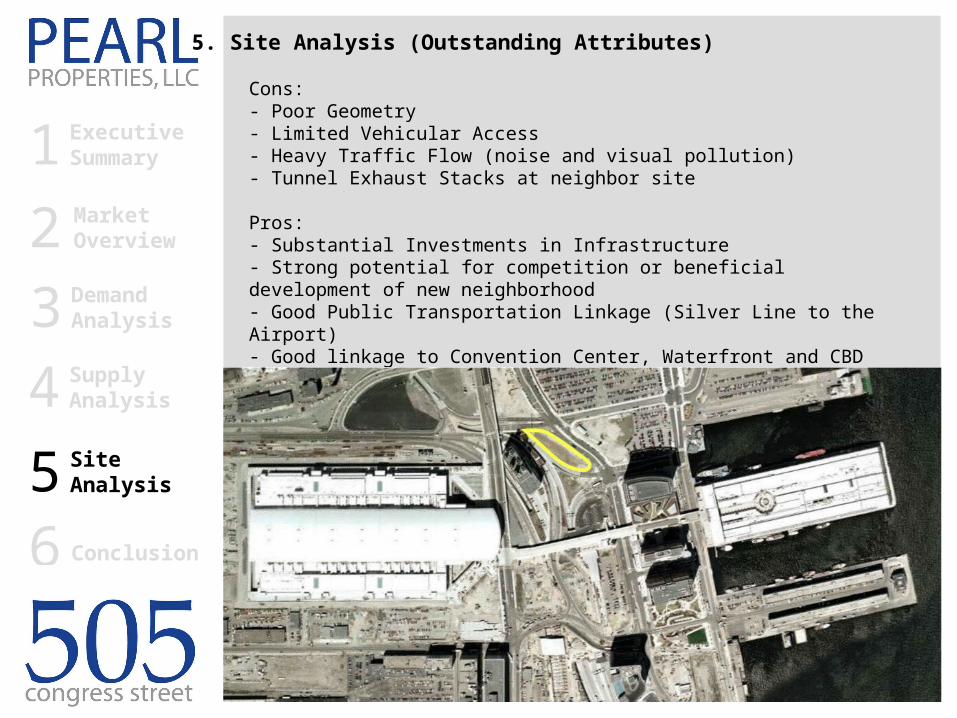
Cons:- Poor Geometry - Limited Vehicular Access- Heavy Traffic Flow (noise and visual pollution) - Tunnel Exhaust Stacks at neighbor site
Pros:- Substantial Investments in Infrastructure- Strong potential for competition or beneficial development of new neighborhood- Good Public Transportation Linkage (Silver Line to the Airport)- Good linkage to Convention Center, Waterfront and CBD
5. Site Analysis (Outstanding Attributes)
SiteAnalysis5
ExecutiveSummary1MarketOverview2DemandAnalysis3SupplyAnalysis4SiteAnalysis5Conclusion6 - Employment growth will spur residential demand over coming
years. However, substantial available land in the market area will require careful product differentiation in order to produce an acceptable capture rate
6A. Opportunity
6B. Risks
6C. Initial Conclusions
- Multi-Family Housing >> opportunity to attend particular demand for single, mid-income employees from CBD and Convention Center (employment rate growth)
- Hotel / Extended Stay >> opportunity to attend particular demand for conventioneers and business travelers from CBD
- Exceeding Current and Projected Supply for above mentioned uses
- Uncertainty about neighborhood development timeline
Conclusion6
ExecutiveSummary1MarketOverview2DemandAnalysis3SupplyAnalysis4SiteAnalysis5Conclusion6