Embed Size (px)
Citation preview

Exchange Rates, Financial Liberalization, andDemocracy: A Cross-National Empirical Analysis of the
Origins of Special Economic Zones
April A. Herlevi ∗
Department of Politics, University of Virginia
June 8, 2017
Abstract
Countries employ a diverse set of fiscal, financial, and regulatory incentives to create jobs and attractforeign direct investment. Special economic zones (SEZs) are an increasingly popular tool to achievethese goals. In 1970, only 80 zones existed in 22 countries. By 2014, over 3000 zones were in place in138 countries. Analysis of the propensity to adopt SEZ policies remains a gap in the literature becauseno systematic cross-national catalog of SEZs previously existed. I use an original dataset of national-level SEZ programs to test economic and political factors that correlate with the propensity to enact. Iargue that countries with a fixed exchange rate are prone to enact as they open their financial systems.In terms of political factors, there is a statistically significant relationship between regime type andSEZ enactment. Counterintuitively, democracies are more likely to enact than non-democracies.
1 Introduction
Countries cite a wide variety of reasons for enacting special economic zones (SEZs) including at-
tracting foreign direct investment (FDI), creating jobs, or implementing certain types of economic
reforms. The most prominent explanations in the economics literature for enacting zones remains
financial opening policies, the desire to access foreign capital, and factors such as trade and the size
of the economy. The political economy literature on FDI, however, has shown us that democracies are∗Please send comments and suggestions to [email protected].
1

better at attracting FDI than non-democracies. Therefore, I test each of the potential explanations and
find that macroeconomic and political explanations jointly explain a country’s propensity to adopt an
SEZ policy.
In terms of the political economy literature, this paper fills two gaps and introduces an original,
cross-national dataset of SEZs to do so. The first gap has been the lack of cross-national empirical
data by which to test the propensity to enact zones. The second problem is the fixation primarily
on outcomes associated with using zones. Examining how SEZs influence economic outcomes such
as growth, GDP, FDI, job creation, and/or productivity is relevant and important but we must also
understand the impetus for their creation, how they are implemented, and why they are used. I argue
that both macroeconomic and political factors drive SEZ enactment.
The macroeconomic reasons for adopting SEZs are to begin a process of trade and financial
opening. Many developing countries, since the 1970s, have attempted to open their financial markets
in the interests of promoting trade and allowing access for foreign direct investors. However, domestic
interests also want certain forms of protectionism and governments may not want to fully open their
financial markets out of fear of the volatility of international capital flows. Thus, enacting an SEZ
is a way to partially open the economy but without allowing full liberalization immediately. More
open capital and ownership policies can be allowed in zones thereby allowing access to the economy
without making the entire economy vulnerable to international financial crises. Thus, countries in
the process of financial opening are more likely to enact zones. The second macroeconomic reason
is the exchange rate. Frieden does not overstate the point when he says, “The exchange rate is the
most important price in any economy, for it affects all other prices.”1 While there are many reasons
for selecting a particular exchange rate regime, most countries in the midst of initial financial opening
1 Frieden (2015, 1).
2

are likely to opt for exchange rate stability over flexibility.
In terms of political factors, the conventional wisdom is that authoritarian regimes use SEZs to
repress labor by limiting both labor protection and preventing collective bargaining. The logic gener-
ated the conventional wisdom that SEZs were primarily a tool of non-democratic countries to increase
exports and exploit their cheap labor. Current analysis indicates that this early conventional wisdom
may be flawed2 but thus far we have been unable to fully adjudicate debates about the relationship be-
tween regime type and the use of SEZ programs. Overall, I find that a combination of macroeconomic
and political factors provides the most consistent and robust explanation for why countries enact.
First, I will summarize the basic logic for testing the macroeconomic and political character-
istics associated with SEZ enactment. Then in the empirical section, I will first discuss the dependent
variable as operationalized for this chapter. I then summarize key independent variables and con-
trols and methods used. Results are then described with a joint model that takes into account both
macroeconomic and political explanations for SEZ creation.
2 Theory of Enactment
There are over 3,000 special economic zones worldwide.3 The World Bank estimates the number of
publicly-funded zones at 872 and privately-funded zones at 1429, for a total of over 2300 zones.4
The wide discrepancy in these estimates stems from multiple causes. First, there is no agreement on
what should or should not be considered a special economic zone. An SEZ is any geographically-
demarcated area where the rules for trade and investment are different from the national-level legal
2 For example, Kucera (2002) finds that countries with poor labor practices do not attract more FDI; in his models, healso controls for the use of SEZs, finding that labor violations in zones do not increase FDI. However, this result isnot statistically significant.
3 Singa-Boyenge (2007).4 World Bank (2008).
3

regime. Figure 1 shows the growth of both FDI and zones since 1970, including the major increases
in both after 1990.
020
0040
0060
0080
00In
war
d F
DI,
as p
erce
nt c
hang
e fr
om 1
970
010
0020
0030
0040
00N
umbe
r of
Zon
es W
orld
wid
e
1970 1980 1990 2000 2010Year
Number of Zones WorldwideInward FDI, as percent change from 1970
Sources: UNCTAD and ILO
Growth of FDI and Zones, 1970-2012
Figure 1: Growth of FDI and Zones Globally
Figure 2: SEZ Enactment Over Time, 1975 versus 2014
4

At present, we have very few systematic measures of FDI incentives.5 SEZs are not a perfect
proxy for FDI attraction policy but nearly all countries explicitly cite attracting FDI as a key goal of
their zone programs.Even if the link between SEZs and increases in FDI are yet to be proven,6 Most
importantly, analysis of why countries enact zones and whether those policies are effective are distinct
questions. We need to understand why countries enact SEZs if we are to devise causal identification
strategies for the connection between SEZs and economic outcomes.
SEZs are a concrete and measurable manifestation of investment promotion policy. Thus,
SEZs and the policies associated with them have a higher level of transparency. That is not to say that
all SEZ are completely transparent but they are a more transparent indicator than corporate tax rates or
the variety of one-off deals that could be offered to potential investors. Zones are measurable in both
a legal and physical sense. As described in the theory chapter, there are at least two distinct stages
of progress in which you could consider a zone program to be “created.” The first is the creation of
the legal architecture establishing the separate and distinct rules for the SEZ. The second is the actual
physical implementation of the zone, i.e. a specific geographic area is anointed as a zone. In the case
of the latter, not only is a physical space demarcated to contain the zone but that area was often fenced
off in order to control the movement of goods and people into and out of the zone. For the zone-level
analysis, it is important to examine physical location and the building of infrastructure associated
with the zone but this is a more subjective measure. At the national-level, the most consistent way to
measure SEZs is based on legal enactment.
5 Jensen et al. (2014) use a survey experiment to evaluate how offering incentives is perceived by voters. Venkatesanand Varma (1998) examine intra-state incentive competition in India. fDiIntelligence, a subsidiary of the FinancialTimes, ranks free trade zones based on the incentives offered and other criteria but these rankings are basedprimarily on self-nomination.
6 The success of early EPZ programs in Mexico, Korea, and Taiwan were largely the result of domestic firms andpreferential financial policies and FDI was not prominent at the outset. However, these three cases all adopted theirzone policies in the 1960s, which is outside the scope of this empirical analysis.
5

Macroeconomic, political, and demographic factors all play a role in economic policy and thus
are likely to matter for zone enactment in any individual country. However, despite extensive study of
ISI, export-led growth (ELG) strategies, and single-country analysis of zone programs, we still know
very little about the general propensity to enact zones or the characteristics associated with countries
who enact SEZs as tool for economic growth and attracting FDI. Single-country studies of special
economic zones provide some useful explanations for why a country may enact an SEZ program.
In Latin America in the 1950s and 1960s, zone were typically associated with import-substituting
industrialization (ISI). In Asia, in the 1960s and 1970s, zones were more commonly associated with
export-oriented measures intended to increase trade. For example, throughout the 1960s, Bangladesh
pursued an ISI strategy but this “inward looking strategy did not solve the fundamental problem of
unemployment and poor economic growth.”7 Then, in 1976, World Bank President Robert McNamara
proposed the idea of an export-processing zone to the president.8 In 1980 Bangladesh’s parliament
passed the Bangladesh Export Processing Zone Authority Act and the Foreign Private Investment Act,
both of which paved the way for SEZs and an export-oriented growth strategy.9
Economic growth is one of the most sought after goals of any politician, whether democrat-
ically elected or appointed. The biggest challenge for poor or developing countries is the lack of
internal demand and the lack of products or resources necessary to create products for sale in export
markets. However, poor countries have one thing in abundance: low-cost labor.10 Thus, poor coun-
tries want to take advantage of their low cost labor but do not necessarily have the capital nor technical
expertise to participate in the global supply chain. Because developing countries do not have export
goods, they are forced to import many commodities, resources, and goods. The reliance on imported
7 Dowla (1997, 561).8 Dowla (1997, 562).9 The Bangladesh Export Processing Zones Authority Act (1980).10 Lewis (1954); United Nations (2008).
6

goods generates chronic balance of payment issues. To rectify these problems, many countries pur-
sue ELG strategies, especially after the success stories of ELG in East Asia.11 While ELG growth
was first associated with the small East Asian “tigers” of South Korea and Taiwan, this development
strategy is now often associated with China. John Williamson, the economist who originally coined
the term “Washington consensus,”12 includes export-led growth as one of the five characteristics that
now define the more recent “Beijing consensus.”13
Thus, a key factor for development, or at least a goal for many developing countries, is turning
current account deficits into current account surpluses. To do so, countries need to increase exports,
decrease imports, or do both simultaneously. For example, Williamson, known for originating the
“Washington consensus,” recommended that “quantitative trade restrictions [should] be rapidly re-
placed by tariffs” and that the exchange rate should be “sufficiently competitive to induce a rapid
growth in nontraditional exports.”14 Related to trade and exchange rate policies, more general finan-
cial liberalization was recommended, such as the “abolition of barriers impeding the entry of FDI”
into the country.15 Essentially, the focus was on “macroeconomic discipline, outward orientation, and
the market economy.”16
Instead of opening the financial system completely,17 markets could be opened in one or sev-
eral distinct enclaves that could be separated from the rest of the country and thus more easily con-
11 To be clear, balance of payments crises are not unique to countries that want to pursue ELG. Hirschman (1968)noted that balance of payments problems were also a problem with ISI.
12 See Williamson (2004) for both the original meaning of the term as well as the ways in which the term has evolvedover the past several decades. The term now is much broader than Williamson’s original conception but has alsobeen used by critics to denote the negative aspects of the role of international financial institutions in development.
13 Williamson defines ELG in the context of China “as relying on a large current-account surplus as a source ofdemand to drive the economy.”(Williamson 2012, 6).
14 Williamson (2004, 196).15 Ibid. Other policy changes such as privatization, tax reform, and ensuring secure property rights were also
recommended. Those policy directives will not be assessed directly in this chapter but I will discuss property rightsfurther in the China-focused and zone-level chapters.
16 Williamson (2004, 197).17 Sometimes referred to the “big bang” theory of reform (Williamson 2012).
7

trolled. In fact, early zones were often physically as well as legally separated from the rest of the
country’s economy. This meant fences around the perimeter of the zone so that the entry of people
and goods could be monitored and managed.18 Moreover, a restrictive financial policy in the broader
economy could be maintained while allowing capital flows and FDI into the approved SEZs only. As
such, countries which are liberalizing financially should be more likely to enact SEZs as one method
of reform but one that does not require full capital mobility, at least at the outset.
Proposition 1: Countries that are opening financially, as measured by a reduction in capital controls,
are more likely to enact SEZs than countries which remain closed financially.
The second key macroeconomic factor is monetary policy. In a closed financial system, it is
relatively straightforward to maintain a fixed exchange rate. Monetary policy, capital controls, and
control over the domestic economy are not separate and distinct realms but instead “capital controls
are used as part of an overall policy of financial repression.”19 In order to maintain some modicum
of control over their own domestic economy, “Governments use capital controls in an attempt to
maintain a fixed exchange rate and to sustain an independent monetary policy; that is, to protect the
value of their currency and to maintain an interest rate that diverges from the world interest rate.”20
Thus, countries that maintain a fixed exchange rate should be less likely to enact SEZs since SEZs
represent an effort to liberalize the financial system.
Proposition 2: Countries with a fixed exchange rate are less likely to enact zones. Thus, a fixed
exchange rate, by itself, should be negatively correlated with SEZ enactment.
18 In the UAE, officials and business people recalled that during the 1980s, long lines could be seen each morning andafternoon on the one road entering and exiting the Jebel Ali Free Zone (Author Interviews, Abu Dhabi, 2015). Onlycertain workers were given access to the zone and goods exiting the zone were closely monitored by customsauthorities. In its early stages, the Shenzhen SEZ in China was fenced off for similar reasons. Today, the AqabaSEZ in Jordan remains completely separated from the neighboring jurisdiction by a long fence, replete with barbedwired to prevent entry (or exit) from the zone.
19 Leblang (1997, 436).20 Leblang (1997, 436).
8

Given the capital mobility hypothesis and the inherent interaction between currency policy,
monetary policy, and the capital account, we must also examine the interactive effect of financial
liberalization and currency policy. Most countries do not simply open their capital account with one
major reform package but gradually alter the legal environment, allowing their financial system to
open slowly over time. In this case, we can think of SEZs as representing one form of partial liber-
alization. However, as the country opens, “to preserve exchange-rate stability, governments will be
compelled to limit either the movement of capital (via restrictions or taxes) or their own policy auton-
omy.”21 So even though the country may be gradually opening, some restrictions will likely remain
in place so that government leaders are able to maintain control over monetary and currency policy.
Thus, in a country that wants to maintain a fixed exchange rate, we should see an interactive effect
between the exchange rate regime, i.e. countries that fix or peg, and increasing financial openness.
Proposition 3: Countries opening financially, as measured by a reduction in capital controls, which
maintain a fixed exchange rate are most likely to enact zones. The interactive effect of financial
opening and a pegged exchange rate should be positively correlated with the propensity to enact.
In terms of political factors, there are two competing logics as it relates to the potential rela-
tionship between regime type and SEZs. The first logic is derived from what could be characterized
as the first generation of FDI scholarship. Essentially, this conventional wisdom argues that SEZs,
especially the EPZs of the 1960s and 1970s, are about labor repression. Labor repression and limita-
tions on labor (such as the ability to organize unions, etc.) are much higher in autocracies. EPZs are
a classic example of vertical rather than horizontal (or market access) FDI.22 Vertical FDI is meant to
take advantage of cheaper labor in developing countries. Thus, the conventional wisdom is that au-
21 Cohen (1993) quoted in Cohen (1996, 280-281).22 At the outset many developing countries did not have a large enough domestic market to make market-oriented FDI
the focus of foreign MNCs. China is the exception to this trend as many firms established operations in China in thehopes of later market access.
9

tocracies that wish to repress labor and attract FDI will do so by using SEZs. Inside SEZs, autocratic
leaders are better able to control personnel movements into and out of the zone, internal labor markets,
and inward FDI. However, the second generation of FDI scholarship has determined that democracies
attract more FDI than non-democracies.23 Pinto (2013) and Pandya (2014a) build on this democracy
and FDI link by examining why democracies receive more FDI. Pandya (2014) argues that FDI re-
strictions have decreased over the past 40 years because democracies favor labor over capital. Pinto
(2013) focuses on the demand-side of FDI and the distributional consequences of FDI finding that
“labor-based [political] coalitions receive more FDI than those countries whose ruling coalitions are
built around domestic capital owners.”24 Kucera (2002) finds poor labor standards in an EPZ have a
negative effective on FDI, rather than a positive effect as predicted by theories of a global “race to the
bottom.”25
Based on these competing logics, I predict that regime type should be correlated with SEZ en-
actment. If the labor repression arguments are correct, then autocracies should have a higher propen-
sity to enact than democracies. If the labor-coalition argument is correct then democratic leaders are
creating SEZs as a mechanism for job creation and catering to labor constituencies. Thus, rather than
controlling labor, SEZs are about attracting FDI to benefit labor. in this case, democracies should
be more likely to enact zone than authoritarian regimes. In the end, an empirical test is necessary to
adjudicate which theory is more accurate.
Proposition 4a: If SEZs are primarily about labor repression, then autocracies will be more likely to
enact zones than democracies.23 Jensen (2003); Li and Resnick (2003); Jensen (2006).24 Pinto (2013, 9).25 Kucera also finds that the relationship between EPZs and FDI is not statistically significant. Kucera’s index is a
binary variable that captures whether or not worker violations have occurred within an EPZ in that particularcountry. Kucera also uses measures that capture freedom of association and collective bargaining based on criteriafrom various international labor agreements (Kucera 2002, 40-43).
10

Proposition 4b: Alternately, if SEZs are about liberalization and favoring domestic labor, then democ-
racies should be more likely to enact than non-democracies.
3 Empirical Analysis
In this section, I will first describe the variables used to measure capital controls, exchange rates,
and regime type as well as all controls. I then discuss methods used to account for temporal depen-
dence. Table 2 summarizes all the propositions described in the theory section above along with the
measures used to operationalize each independent variable and the expected coefficient sign for that
variable. The final portion provides results and marginal effects, which captures both the political and
macroeconomic logic outlined above.
3.1 Bad Data and Binary Calculations: Describing the Dependent Variable
The key dependent variable is whether or not a country enacts a special economic zone program. The
variable is binary and the date of enactment is based on the year in which the legislation was passed
authorizing the zone program. As such, for each year, the country in question either does or does not
have an SEZ program. Coding the variable in this manner was the best way to ensure consistency
across countries and to capture zone enactment over a substantial time period. The current dataset
covers the period from 1970 to 2014 and each observation is a country-year.
I have both substantive and technical reasons for selecting the time period from 1970 to 2014.
Substantively, 1970 offers a useful cut-point for analysis of development strategies in the post-World
War II era. In their volume on finance in developing countries, Haggard, Lee and Maxfield (1993)
divide the debate over finance into three phases. In the immediate post-World War II period there was
an implicit assumption of a strong, capable state and thus government intervention in the economy was
11

expected and encouraged. Subsequent success stories in South Korea and Taiwan further convinced
developing countries that export-led growth, accompanied with financial policies from the government
to promote those exports, was warranted. SEZs were actually a very small part of the success of South
Korea and Taiwan but the notion of using SEZs to achieve growth objectives continued to gain traction
throughout the 1970s. Related to the independent variables of this study, namely financial opening,
exchange rate policy, and regime type, the 1970s also represent a key change. In 1971, the US went
off the gold standard changing the international environment for investment. The post-Bretton Woods
era resulted in increased integration of capital markets.26 Moreover, with the help of institutions such
as the World Bank, many countries also sought to liberalize both financially and politically. Thus, the
post-1970 era saw a decline in capital controls and FDI restrictions.27 Despite more access to capital
for developing countries, these changes also meant increased vulnerability to rapid fluctuations in
capital flows, a major concern for many countries.
The other reason for selecting 1970 as the starting point for the data was the availability of
reliable sources for coding enactment start dates. For all country-years, I used at least two official
publications and often three to five sources in order to verify the date of legal enactment for each
country’s zone programs. In most cases, I used the International Labor Organization’s 2007 report,
ILO Database on Export Processing Zones, World Bank (2008), and the State Department’s Invest-
ment Climate Statement for the country, which includes a section on export processing and free trade
zones. These three sources provided verifiable enactment dates for the 1990s and 2000s. However, to
establish the enactment dates for zones created earlier I had to rely on another source. Frobel, Hein-
richs and Kreye (1980) provided the solution to establishing enactment in this earlier period since their
comprehensive study of EPZs contained several data appendices extending back to the early 1970s.
26 Leblang (2005, 168).27 Pandya (2014b); Leblang (2005).
12

Thus, Frobel, Heinrichs and Kreye (1980) was the most reliable source of country-level enactment.
However, this source contained very little information on zones created in the 1960s and I was unable
to find any other comprehensive or comparable sources that could be used to reliably code enactment
for the 1950s and 1960s. In contrast, from 1970 onwards, I was able to use these combination of
sources to establish a consistent baseline for enactment. All country-years from 1970 to 2014 have
been cross-checked using each of these four sources; in the event that this combination of sources
did not contain country-level enactment data, I consulted country-specific sources.28 In those cases,
I either obtained the official law enacting zones in that country or used a reliable government source
from that country to confirm the year of enactment.
I choose legal enactment of the policy as the key measure for several reasons. First, most in-
vestment promotion policies are relatively opaque. Governments often negotiate behind closed doors
and offer different incentive packages to different firms.29 For example, Christiansen, Oman and
Charlton (2003) note that while “FDI attraction strategies should be communicated to the enterprise
sector (and civil society) in a timely and transparent manner” the realization of these strategies of-
ten occurs at the individual firm level.30 These sort of ad hoc offers and deals are very difficult to
reconstruct. To empirically test the effects of these incentives we would need not only information
on approved deals but the universe of offered deals. Locating or accessing this information cross-
nationally would be nearly impossible. Given the multiple methods by which the legal authority to
enact a zone can be established, at present, I have opted for a binary measure based on the passage of
the initial enabling legislation. A country is coded as having an SEZ program in place, starting from
the year in which the legislation is passed. If a country has never had a zone program or if the country
28 For all country-level coding decisions, see Master Coding Rules in the dissertation’s Data Appendix.29 Oman (2000) .30 Christiansen, Oman and Charlton (2003, 6).
13
abolishes the zone program, then those country-years are coded as zero.31
To summarize, we are testing a theory of the countries in the upper right quadrant to answer
one key research question. In the period from 1970 to 2014, why do the countries that have enacted
zones do so? This is the key scope condition for the cross-national analysis. In the conclusion, I will
briefly address some of the potential reasons for expanding or dismantling programs and discuss how
expanding the dataset to cover the period from 1950 to 1969 would allow us to make “out of sample”
predictions and test the results found in the empirical analysis below. However, for now, we will focus
on the propensity to enact zones since 1970.
3.2 Primary Independent Variables: Financial Opening & Exchange Rates
For SEZs, the demand for foreign exchange is one reason named for countries pursuing export-
oriented policies but this proposition has never been tested empirically. Moreover, demand for foreign
exchange does not exist in isolation but is connected to other macroeconomic policies in the country,
namely the level of capital controls and exchange rate policy. I test the effects of financial openness,
as measured by capital controls, and the effect of the exchange rate regime on a country’s propensity
to enact an SEZ program along with regime type. If a country wants to open its capital account but is
not concerned about its currency or monetary policy, those countries should have no higher (or lower)
propensity to enact zones than a country that remains closed financially. After the collapse of the
Bretton Woods system of fixed exchange rate parities in the early 1970s,32 most industrial economies
shifted to floating or managed exchange rates.33 However, many developing countries needed (or
wanted) to maintain control over their exchange rate in order to prevent currency volatility.34
31 The dataset contains a binary outcome variable, zone, as well as separate variables which capture the start and enddates of the program (zone enact and zone abolish, respectively).
32 See Krugman and Obstfeld (2006, 507-9) for a summary.33 Krugman and Obstfeld (2006, 447).34 Krugman and Obstfeld (2006, 607).
14

For the capital controls measure, I use the Chinn-Ito capital controls index, known as kaopen.35
The Chinn-Ito Index uses the International Monetary Fund’s (IMF) Annual Report on Exchange Ar-
rangements and Exchange Restrictions (AREAR) to measure “a country’s degree of capital account
openness.”36 The Chinn-Ito index has two variants. The first measure varies between -1.89 and 2.39
with negative numbers indicating a less open financial system (more capital controls) and positive
numbers indicating a more open financial markets (less capital controls). The second variant is the
same data but scaled to fall between zero and one.37
Exchange rates are measured using Levy-Yeyati and Sturzenegger (2005), hereafter the LY&S
measure. The LY&S measure was chosen because it measures de facto exchange rates rather than de
jure regimes. This distinction is important because for our test we are less concerned about signaling
or announced policies but instead want to measure actual exchange rate policies. As Levy-Yeyati and
Sturzenegger (2005) argue, “many countries that in theory have a flexible rate intervene in exchange
markets” and other countries implement “periodic devaluations of pegs . . . [with] the result . . .
[that] monetary policies are inconsistent with fixed exchange rates.”38 For our purposes, we want to
evaluate the underlying motivations of the government rather than purported policies. Therefore, the
LY&S measures captures the “de facto classification of exchange rate regimes [and] reflects actual
rather than announced policies.”39 In addition, since we are primarily concerned with fixed exchange
rates, using the LY&S variable, I converted the LY&S three-way ordinal scale (float, intermediate,
fixed) to a binary scale. I collapsed the LY&S coding scheme such that category three equals “fixed”
and categories one and two are simply “not fixed.” For our purposes, it does not matter whether a
35 Chinn and Ito (2005); Chinn and Ito (2008). For clarity, I will refer to the emphkaopen variable as the capitalcontrols or financial openness index.
36 Chinn and Ito (2015).37 In Table 1: Summary Statistics, the zero to one index is labeled as the ”scaled” variant of Financial Openness.38 Levy-Yeyati and Sturzenegger (2005, 1604).39 Levy-Yeyati and Sturzenegger (2005, 1604).
15

country has a free float or a managed float. The key driver of policy is whether or not the country is
attempting to maintain a fixed exchange rate.
For the political factors associated with the propensity to enact zones, I use three different
regime type measures. The first two measures are binary variables coded as one for democracy and
zero for non-democracies. The first binary measure is the Cheibub, Gandhi and Vreeland (2010) and
the second is Boix, Miller and Rosato (2012). Both of these measures are dichotomous and thus
minimalist definitions of democracy. As discussed in propositions four above, there are competing
theories for the relationship between regime type and SEZ enactment. These disputes are adjudicated
below. Proposition 4a is based on the notion that SEZs are about labor repression and proposition 4b
is based on the idea that politicians want to create jobs for their constituencies and a geographically-
based incentive policy, such as an SEZ, is one effective way to do so. The jobs are created in a specific
jurisdiction; thus, those politicians can quite easily claim credit for the jobs if they are associated with
the SEZ policy. Since the link between elected politicians and constituents should be more tightly
linked in democracies, if this logic is at work, then democracies should be more likely to enact than
non-democracies.
3.3 Controls and Descriptive Statistics
I include a measure of GDP per capita (GDPPC) to capture both the wealth of a country and to proxy
for state capacity.40 GDPPC is drawn from the Graham and Tucker (2016) IPE dataset because that
dataset combines data from both the World Bank’s World Development Indicators (WDI) and the
Penn World Tables for a more complete time series.41 Population size is included because the size of
40 Rueschemeyer, Stephens and Stephens (1992, 16) explicitly note the importance of state capacity to understandingthe relationship between democracy and development. Fearon and Laitin (2003, 80) use income per capita as “aproxy for a state’s overall financial, administrative, police, and military capabilities.”
41 Graham and Tucker (2016). The more complete time series data is especially important for developing countries.
16

the country could be associated with the country’s propensity to enact. Specifically, larger countries
are more likely to enact differential investment policies across their jurisdiction.42 A measure of trade
flows in used to control for policies associated with export-led growth. In order to control for the role
of trade on the overall economy, I use a measure of trade flows as a percent of GDP. Population, land
area, trade, and other controls, such as external debt levels, were all obtained from the World Bank
WDI. Table 1 below provides the descriptive statistics for all independent and control variables used
in the primary model specifications reported below and various robustness checks.
f(n) =
Y = 1 if SEZ =1
Y = 0 if SEZ = 0
The structure of the data is time-series cross-sectional (TSCS) data with a binary outcome
variable as shown above. The key for modeling binary outcomes is that the models are equivalent
to event history models, also known as duration models.43 I conceptualize these tests as a duration
model because we are examining the time until enactment, which is when a country switches from
zero to one. A standard logit or probit model could be used but a standard model would not properly
account for the duration dependence in the data. Thus, the estimates from a standard logit model
would be biased. Instead, the duration model examines time until enactment. Survival and event
history models use the term “hazard rate” so, in our case, the hazard rate is the probability that a
country will enact an SEZ in a given year (t = 1, 2, 3 . . . n), given that country has not already
enacted a zone.44 Since the “hazard rate depends on time and the explanatory variables . . . [we use]
42 For some models, I also included land area since countries that are physically larger should be more likely to enactgiven the larger space and territory to create geographically differentiated programs. However, because the totalland area for most countries changes very little over time, at least within the time period under examination here,this variable drops out of the models that use time fixed effects.
43 Beck, Katz and Tucker (1998).44 For a straightforward discussion of hazard rates and discrete time models, see Allison (1982).
17

the logistic regression function.”45 However, as Beck, Katz and Tucker (1998) note, binary time-series
cross-sectional (BTSCS) data is “likely to violate the independence assumption of the ordinary logit
or probit statistical model.” Thus, if we do not properly account for time, the results are likely to be
biased.
To address this serial autocorrelation, I employ two methods. The first method used to control
for temporal dependence is time fixed effects (FE), in this case year FE. Unlike “fixed effects” models
in economics, which should more properly be labeled unit or country FE, time FE models create a
dummy variable for each year. As such, these models provide us with a clear examination of the
cross-sectional variation or “between” effects.46 However, one problem with using fixed effects with
a binary TSCS (BTSCS) is that the fixed effects estimator “ignore[s] . . . differences that are not
captured by the independent variables” resulting in biased estimators.47 Thus, the second method used
to account for duration dependence is the Beck, Katz and Tucker (1998) solution of including temporal
dummy variables, which measure time until enactment, and then use those temporal dummies as
controls in the duration model. These temporal dummies were generated using the BTSCS Stata
package.48 For our initial analysis of SEZ enactment, we are primarily interested in the differences
between countries rather than how these policies have changed over time. As such, controlling for
time dependence allows us to focus exclusively on the cross-sectional differences.
All independent variables are lagged by one year to ensure that economic policies and political
factors are driving the results rather than the reverse. Also, to account for the fact that the policy in
one year is likely to influence policy in the next year, I include a lag of the dependent variable. The
45 Allison (1982, 72).46 This is in contrast to country or unit FE models, which control for the cross-sectional variation (between effects)
and thus provide us an assessment of the over time variation or “within effects.”47 Beck and Katz (2001).48 Tucker (1999).
18

lagged dependent variable accounts for the fact that having a zone in the year prior (t0) is likely to
be a significant predictor of whether or not a country will have a zone in t1. To account for spacial
correlation, I use robust standard errors clustered by country.
Variable Mean Std. Dev. Min. Max. ObservationsZone (DV) 0.446 0.497 0 1 7746Fixed Exchange Rate 0.637 0.481 0 1 4119Financial Openness -0.017 1.528 -1.89 2.39 6453Financial Openness, Scaled 0.418 0.35 0 1 5708CGV Democracy 0.441 0.497 0 1 6675BMR Democracy 0.445 0.497 0 1 6646Polity Score 0.911 7.463 -10 10 6622GDP per capita, Logged 799.29 158.37 393.24 1203.52 6646Population, Logged 176.52 194.60 -321.67 722.45 6499Trade, Percent of GDP 78.509 48.734 0.309 531.74 6782
Table 1: Summary Statistics
Independent Propositions Operationalization ExpectedVariable Coefficient Sign
Macroeconomic Factors
Financial Openness 1, 3 Chinn-Ito Capital Controls Index +Fixed Exchange Rate 2, 3 LYS, Coded as binary -
Exchange Rate &Financial Openness 3 Interaction Term +
Political Factors
Regime Type 4 CGV Binary Measure -Regime Type 4 BMR Binary Measure -Regime Type 4 Polity -
Table 2: Summary of Hypotheses Tests
Table 2 summarizes all of the hypothesis tests based on the propositions developed in the
theory section, along with the variables used to operationalize the concepts, and expected sign on
each coefficient. Substantively, the final set of models, labeled here as the complete models, are the
19

ones that are both the most accurately assess the determinants of SEZ enactment and are the most
robust theoretically since they jointly account for the economic, political, and demographic factors.
Since the complete model is the best representation of the theory, I have used that set of models
to generate marginal effects and illustrate how financial openness, exchange rate, and regime type
combine to influence the propensity to enact zones.
In contrast to the conventional wisdom (Proposition 4a), the sign on the democracy measures
is positive in all three cases. As such, I find support for Proposition 4b, rather than 4a. Basically,
democracies are more likely to enact SEZs than non-democracies. One major concern with this
finding is omitted variable bias. Maybe the connection between regime type and SEZ enactment
is simply because other factors are not appropriately controlled for and thus biasing the results. To
examine this, I ran a model with regime type, controls, and both country and time fixed effects. In this
model, regime type is no longer statistically significant thus indicating that there are omitted factors
that may be driving the regime type and SEZ enactment relationship. Given the relatively robust
results of the macroeconomic tests (Propositions 1-3), I argue that the omitted variables are those
associated with the macroeconomic conditions in the country. As such, I now turn to testing a model
which accounts for both the economic and political factors that are likely to drive enactment, along
with the demographic factors accounted for with the various control variables.
The Macroeconomic and Political Model
Zoneij = β0 + β1 ∗ Zonei,t−1 + β2 ∗ FixedERi,t−1 + β3 ∗ FinancialOpennessi,t−1
+ β4 ∗ FixedERi,t−1 ∗ FinancialOpennessi,t−1 + β5 ∗Democracyi,t−1
+GDPPCi,t−1 + β6 ∗ Populationi,t−1 + β7 ∗ Tradei,t−1 + βx ∗ TimeDummies(1)
The complete model, as shown in equation one, includes the exchange rate regime, financial
opening, the exchange rate and openness interaction, and regime type as the key independent vari-
20

ables, as show in equation four. This model also includes the lagged DV, GDPPC, population size and
trade as controls and implements the temporal dependence correction methods discussed previously.
Like the previous set of models, I report 5 distinct specifications (Table 3). Model 1 includes all the
IVs but no controls nor the interaction term. Model 2 introduces the interaction term. Model 3 in-
cludes the IVs, including the interaction term, and then uses time FE to account for time dependence.
Model 4 once again uses time FE but also includes the other substantive controls associated with eco-
nomic and population size and reliance on trade. Model 5 includes all IVs, the interaction term, and
controls but instead of year FE includes temporal dummies generated from the BTSCS package.
In Model 1, fixed exchange rate and financial openness are both significant, consistent with
Macroeconomic Model 1; however, regime type is not statistically significant. Once the interaction
term is included, as in Model 2, financial openness on its own is no longer significant but the interac-
tion term is, which is again consistent with Macroeconomic Model 2. Democracy is not significant.
However, incorporating year FE, as in Model 3, does not change the substantive results. However,
once additional controls are included to address potential omitted variable bias, the results do change
somewhat. In Model 4, which controls for both time and other economic and demographic factors,
the substantive macroeconomic factors remain and now democracy is also statistically significant. For
Model 5, the coefficients vary slightly but the substantive results remain the same.
I then examine the marginal and predicted effects of various combinations of the independent
variables. First, I examine the probability of zone enactment at various levels of financial openness
(Proposition 1). For Figure 3, I use the Chinn-Ito scaled financial liberalization index where zero
equals a closed financial system and one represents an open financial system. The likelihood that a
country that is closed financially will enact an SEZ is less than 2 percent. Not impossible but unlikely.
As financial liberalization increases, such as countries with a score of 0.5 on the Chinn-Ito scale, the
21

(1) (2) (3) (4) (5)Complete Complete Complete Complete CompleteModel 1 Model 2 Model 3 Model 4 Model 5
Lag of Zone 8.953*** 9.051*** 9.718*** 9.506*** 7.834***(0.433) (0.457) (0.573) (0.592) (0.721)
Fixed ER -0.828*** -1.577*** -1.553*** -1.207*** -1.267***(0.257) (0.413) (0.414) (0.459) (0.461)
Financial Openness 1.037*** 0.127 0.116 -0.0727 0.00213(0.344) (0.465) (0.488) (0.568) (0.592)
ER*Openness Interaction 1.649** 1.607** 1.851** 1.830**(0.676) (0.679) (0.750) (0.785)
Democracy 0.359 0.409 0.387 0.724** 0.750**(0.260) (0.253) (0.256) (0.349) (0.354)
GDPPC, Logged -0.000611 -0.000714(0.00113) (0.00114)
Population, Logged 0.00290*** 0.00281***(0.00106) (0.00105)
Trade 0.00574* 0.00613*(0.00347) (0.00367)
Year Fixed Effects No No Yes Yes NoTemporal Dummies No No No No YesConstant -3.528*** -3.190*** -2.069*** -3.039*** -2.827***
(0.269) (0.265) (0.537) (0.812) (0.943)
Observations 3,638 3,638 3,638 3,223 2,926Robust standard errors in parentheses
*** p<0.01, ** p<0.05, * p<0.1
Table 3: Macroeconomic and Political Determinants of SEZ Enactment
22

propensity increases slightly. Once a country reaches one, or full economic opening, the probability of
enactment increases to approximately 6 percent but the confidence interval on this estimate increases
substantially, although it remains statistically significant. Thus, this provides evidence for Proposition
One, as countries open financially, as measured in a reduction in capital controls, those countries are
more likely to enact SEZs.
0.0
2.0
4.0
6.0
8.1
Pr(Z
one)
Closed Chinn-Ito Scale = 0.5 Open
with 95% CIsPredicted Marginal Effects of Financial Liberalization,
Figure 3: Propensity to Enact Zones as Economic Opening Occurs
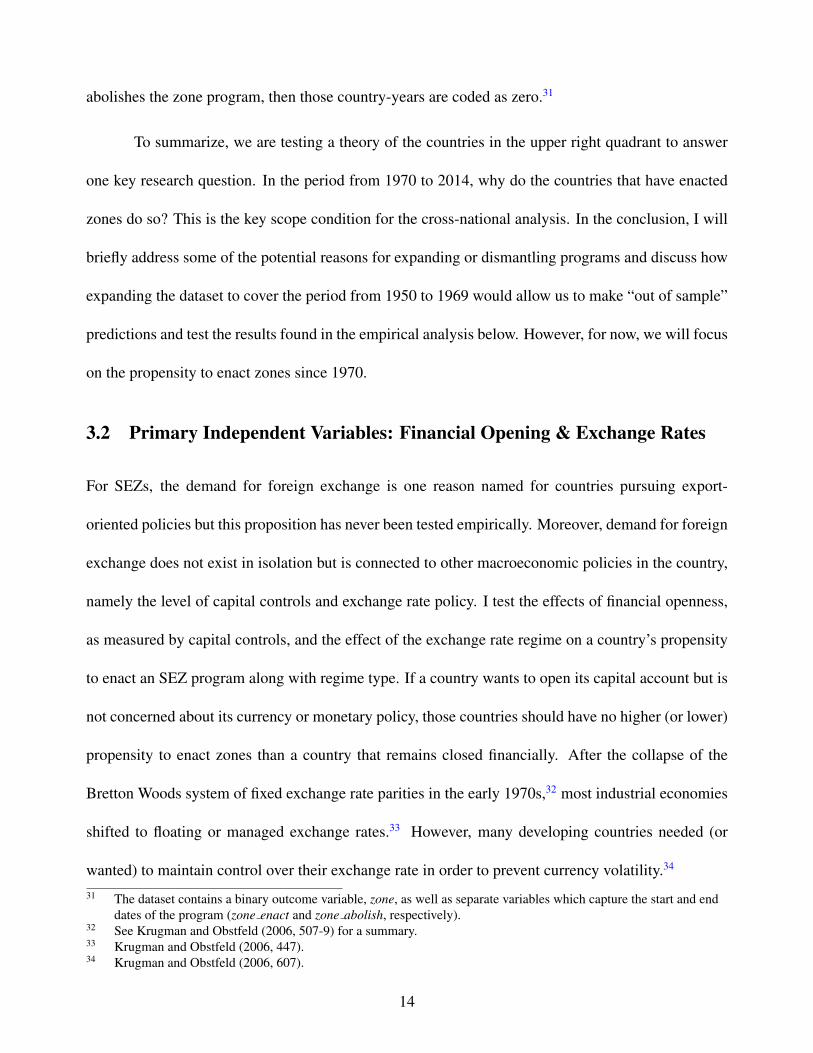
The second set of marginal effects examines the interactive effect of exchange rate choice and
financial openness. Figure 4 shows the relationship between exchange rate regime and the propensity
to enact across different levels of financial openness. The darker shaded area represents countries
with a floating exchange rate. As the graphic shows, the propensity to enact across different levels
of financial openness basically remains the same for countries with a fixed exchange rate. This is to
be expected since less capital controls and free movement of the currency are expected to operate to-
gether. However, the interesting and substantively important relationship is the one between financial
opening and the desire to peg or fix the currency. For countries that fix, shown by the dashed line
23

and lightly shaded area (for the confidence interval), indicates that as countries move towards a move
open financial system (towards one on the Chinn-Ito scale), those countries have a higher propensity
to enact zones. For example, if you are a country that fixes its currency and you have a financial open-
ness score of 0.9, then the predicted probability of zone enactment is 8.4 percent. This is in contrast to
a country that has the same financial openness score (0.9) but a floating exchange rate; a comparably
financially open country but with a fixed exchange rate only has a 4.6 percent probability of enact-
ing a zone. Having a fixed exchange rate, but a similar financial openness score, nearly doubles the
propensity to enact a zone.
0.0
5.1
.15
.2Pr
(Zon
e)
0 .1 .2 .3 .4 .5 .6 .7 .8 .9 1Financial Openness
Floating Fixed
Predictive Margins of Exchange Rates with 95% CIs
Figure 4: Propensity to Enact with a Fixed Exchange Rate and Financial Opening
The interaction between a fixed exchange rate and financial opening is the most important
factor increasing the propensity to enact but regime type also plays a role. Holding all other factors
constant at their means, a non-democracy has a 2 percent probability of enacting a zone. However, a
democracy has a nearly 4 percent probability of enactment. Substantively, this is not a large increase
but given the conventional wisdom that autocracies are more likely to use SEZs, this is an important
24

finding and supports Proposition 4b. Democracy and economic liberalization are tied with the propen-
sity to enact zones, especially for those countries hoping to maintain a fixed exchange rate. While the
mechanisms for this pattern have not thus far been identified with this quantitative analysis, this is an
important finding and avenue for future research to understand how specific economic and political
liberalization decisions influence specific policy choices by national leaders. Future directions for this
research will be discussed in the concluding chapter.
0.0
2.0
4.0
6.0
8Pr
(Zon
e)
0 1Regime Type, Democracy = 1
All other variables held constant at their means.
Adjusted Predictions of Regime Type, with 95% CIs
Figure 5: Propensity to Enact by Democracies, Accounting for Macroeconomic Factors
To summarize the quantitative analysis contained in this chapter, Table 4 outlines the basic
results. Financial openness, by itself (Proposition 1), is not a statistically significant determinant of
SEZ enactment. A fixed exchange rate, however, does decrease the propensity to enact a zone thus
confirming Proposition 2. More importantly, though, is the interactive relationship between exchange
rate choice and financial openness (Proposition 3). The interactive effect of the two is positive and
statistically significant thus confirming Proposition 3. Regime type is correlated with enactment but in
contrast to Proposition 4a, democracies are more likely to enact than non-democracies thus supporting
25

Proposition 4b. All of these confirmed effects are explored further in the complete model and marginal
effects plots as already described above. Propositions 5 and 6, which attempt to explain the regime
type connection more fully, are not confirmed. Thus, given the current measures of unmet labor
demand, we cannot argue that this is the mechanism driving democracies to enact zones.
Independent Proposition Expected Results StatisticallyVariable Number Coefficient Sign Significant?
Financial Openness 1 + Not Confirmed No
Fixed Exchange Rate 2 - Confirmed Yes
Fixed Exchange Rate*Financial Openness 3 + Confirmed Yes
Regime Type 4a, 4b - Positive Yes
Table 4: Summary of Empirical Results
3.4 Robustness Checks
One concern is the coding of particular cases. Given the importance of the US case as a model for
global economics, I ran several robustness checks in order to ensure that the US case was not driving
the results. For example, in the SEZ dataset, the US is coded as a country with an SEZ program
because of the existence of Free Trade Zones49 and the federal Empowerment Zone (EZ) program.50
However, zones in the US are neither as spatially restrictive as zones in some countries nor are they
incentives or infrastructure benefits as high. As such, there may be concerns that such a prominent
democracy could be driving the regime type results. As such, I ran the models with an alternate coding
of the dependent variable where the US was coded as zero rather than one. Substantive results for the
models did not change based on this alternate specification. In addition to the Federal Empowerment49 Full the list of approved FTZs in the US, see Department of Commerce International Trade Administration,
http://ita-web.ita.doc.gov/FTZ/OFISLogin.nsf, last accessed 23 March 2015.50 For analysis of the EZ program, see Busso, Gregory and Kline (2013).
26

Zones, the US also has Free Trade Zones, which have been in place since the 1960s. As such, in the
empirical analysis, I also used different enactment dates are used. Finally, to ensure that the US case
is not driving the results, in one set of robustness checks, I left the US out of the data altogether. The
substantive results of the analysis did not change.
Also, as seen in the all the models, the lagged dependent variable is a strong predictor of
having an SEZ in the following year. Including the lagged DV accounts for this dependency but, in
order to isolate only those countries that shift from zero to one in a given time frame, I also ran a series
of models that isolated the switch. To do so, I included the lagged DV but also ran the model on only
those countries that were shifted from zero to one. As such, instead of testing persistence of SEZs, in
those models only countries which had no zone in t0 but shifted to having a zone in t1 are examined.
Results from these models are not substantively different from the models displayed above.
4 Conclusion and Future Research
The models tested above are the first empirical analysis of the characteristics associated with zone
enactment across countries worldwide. Essentially, there is empirical evidence for the interactive
effect of financial opening and maintaining a fixed exchange rate. Moreover, regime type is correlated
with enactment but unlike the conventional wisdom it is democracies, not non-democracies, that are
more likely to enact SEZs.
To better understand these connections, there are several lines of inquiry that could be pursued.
First, as stated in the theory section, the models detailed in the empirical section above do not test
for zone enactment prior to 1970. The dataset only begins in 1970 so these empirical models cannot
explain zone enactment in Brazil, Ireland, South Korea or Taiwan, all of which are canonical cases of
27

the use of SEZs for either ISI or ELG strategies. As such, the results derived thus far could be used
to make out-of-sample predictions for the patterns of SEZ enactment in the 1950s and 1960s. If this
dataset was expanded to cover the time period from 1950 to 1969, the hypotheses described above
could be tested on only that time period to see whether these trends are unique to the post-1970 period
or whether they existed in the earlier time period. Moreover, a full dataset of zones from the 1950s
onward would include the iconic cases (Ireland, Korea) that are so often referenced in analysis of
other zones. Bringing these countries into the scope of the current quantitative analysis would allow
us to test the durability of these macroeconomic and political explanations and determine whether
these patterns are time contingent.
Moreover, there are several other dimensions of variation of SEZ that could be explored. For
example, the size, number, and location of zones are all key dimensions of variation as well as policy
variables such as the number of programs in the country and the administrative authority responsible
for the program and/or zone. One of the first ways to build upon a binary classification of zone
presence is by calculating the number of zones per country. If a cross-national measure of the number
of zones was created, then we would not be limited to binary logit models but could assess the impetus
for initial enactment and later program expansion. For instance, does the exchange rate regime and
financial controls correlate with the number of zones in the country or does the interactive effect
of financial opening and desire to peg the currency only matter for initial enactment? Similarly, do
democracies enact more zones than non-democracies? Are the total number of zones per country
comparable across regime type or are they different? Count and hurdle models could help us discern
the reasons for initial enactment and separately assess the reasons for further program expansion. In
terms of size, there are several other questions that emerge. At its simplest, how large is the zone
in question and how much land area, in total, is within the confines of an SEZ in any one country?
28

What are the geographic confines of the zone? How have leaders decided on the size or location
for any particular zone? Is zone placement based on patronage, some sort of underlying economic
efficiency logic, or entirely arbitrary? If based on efficiency or patronage, how is the scale and scope
of the SEZ determined? Size is typically measured in hectares, square meters, or acres but size could
also be measured as a percentage of the overall area of the country or as a percentage of the area of
the particular jurisdiction which houses the zone. For example, in China, even though national-level
zones represent less than one percent of China’s land area, in 2005, SEZs accounted for nearly 4
percent of China’s total GDP and over 16 percent of total FDI inflows.51 By the mid-2000s, Fu and
Gao (2007) estimate that China’s zones account for over “one third of China’s FDI stock.”52
This article has taken a first step in understanding why countries enact special economic zones
and is thus a key starting point to begin answering these remaining questions. Using an original
dataset of SEZ programs, I find that countries utilizing a fixed exchange rate are more likely to enact
SEZs as one step in opening their financial system. Countries do so to maintain monetary stability
amidst financial liberalization. I also find that democracies are more likely to use SEZs than non-
democracies, raising questions about the logic of the global “race to the bottom.” Politicians are
not lowering standards but rather using geographically-targeted incentives to create jobs and attract
FDI. If development experts and governments are to continue funding and enacting SEZs, we need to
understand all aspects of their origins and implementation in order to fully evaluate their effectiveness.
51 Fu and Gao (2007, 22).52 Fu and Gao (2007, 22).
29

ReferencesAllison, Paul D. 1982. “Discrete-Time Methods for the Analysis of Event Histories.” Sociological
Methodology 13:61–98.
Beck, Nathaniel and Jonathan N. Katz. 2001. “Throwing Out the Baby with the Bath Water: AComment on Green, Kim, and Yoon.” International Organization 55(2):487–495.
Beck, Nathaniel, Jonathan N. Katz and Richard Tucker. 1998. “Taking Time Seriously: Time-Series-Cross-Section Analysis with a Binary Dependent Variable.” American Journal of Political Science42(4):1260–1288.
Boix, Carles, Michael Miller and Sebastian Rosato. 2012. “A Complete Dataset of Political Regimes,1800-2007.” Working Paper pp. 1–44.
Busso, Matias, Jesse Gregory and Patrick Kline. 2013. “Assessing the Incidence and Efficiency of aProminent Place Based Policy.” American Economic Review 103(2):897–947.
Cheibub, Jose Antonio, Jennifer Gandhi and James Raymond Vreeland. 2010. “Democracy anddictatorship revisited.” Public Choice 143:67–101.
Chinn, Menzie and Hiro Ito. 2005. “What Matters for Financial Development? Capital Controls,Institutions, and Interactions.” NBER Working Paper Series (11370).
Chinn, Menzie and Hiro Ito. 2008. “A New Measure of Financial Openness.” Journal of ComparativePolicy Analysis 10(3):309–322.
Chinn, Menzie and Hiro Ito. 2015. Notes on The Chinn-Ito Financial Openness Index 2013 Update.Technical report.
Christiansen, Hans, Charles Oman and Andrew Charlton. 2003. “Incentives-based Competition forForeign Direct Investment: The Case of Brazil.” OECD Working Papers on International Invest-ment 01.
Cingranelli, David L. and David L. Richards. 2008. The Cingranelli-Richards (CIRI) Human RightsData Project Coding Manual Version 2008.3.13.
Cohen, Benjamin J. 1996. “Phoenix Risen: The Resurrection of Global Finance.” World Politics48(2):268–296.
de Jong, Willemijin. 2013. “Establishing Free Zones for regional development.” Library Briefing:Library of the European Parliament pp. 1–6.URL: http://www.europarl.europa.eu/RegData/bibliotheque/briefing/2013/130481/LDM_BRI(2013)130481_REV1_EN.pdf
Dowla, Asif. 1997. “Export Processing Zones in Bangladesh: The Economic Impact.” Asian Survey37(5):561–574.
Elkins, Zachary. 2000. “Gradations of Democracy? Empirical Tests of Alternative Conceptualiza-tions.” American Journal of Political Science 44(2):287–294.
30

Farole, Thomas and Lotta Moberg. 2014. “It worked in China, so why not in Africa? The politicaleconomy challenge of Special Economic Zones.” WIDER Working Paper 2014/152 pp. 1–21.
Fearon, James D. and David D. Laitin. 2003. “Ethnicity, Insurgency, and Civil War.” American Polit-ical Science Review 97(1):75–90.
Frieden, Jeffry A. 2015. Currency Politics: The Political Economy of Exchange Rate Policy. Kindleedition ed. Princeton University Press.
Frobel, Folker, Jurgen Heinrichs and Otto Kreye. 1980. The new international division of labor:Structural unemployment in industrialized countries and industrialization in developing countries.Cambridge University Press. Translated by Pete Burgess. Original German published in 1977 bythe Max Planck Institute, Starnberg.
Fu, Xiaolan and Yuning Gao. 2007. Export Processing Zones in China: A Survey. Technical Report31/10/2007 International Labor Organization.
Graham, Benjamin A.T. and Jacob R. Tucker. 2016. International Political Economy Data Resource.Version 1.5 ed. Security and Political Economy (SPEC) Lab, University of Southern California.
Haggard, Stephan, Chung H. Lee and Sylvia Maxfield, eds. 1993. The Politics of Finance in Devel-oping Countries. Cornell University Press.
Hirschman, Albert O. 1968. “The Political Economy of Import-Substituting Industrialization in LatinAmerica.” The Quarterly Journal of Economics LXXXII(1):1–32.
Jensen, Nathan M. 2003. “Democratic Governance and Multinational Corporations: PoliticalRegimes and Inflows of Foreign Direct Investment.” International Organization 57(3):587–616.
Jensen, Nathan M. 2006. Nation-States and the Multinational Corporation: A Political Economy ofForeign Direct Investment. Princeton University Press.
Jensen, Nathan M., Edmund Malesky, Mariana Medina and Ugur Ozdemir. 2014. “Pass the Bucks:Credit, Blame, and the Global Competition for Investment.” International Studies Quarterly58:433–447.
Khalifa Bin Zayed Al Nahyan. 2013. Federal Decree No. 15 of 2013, Concerning Establishing aFinancial Free Zone in the Emirates of Abu Dhabi. President of the United Arab Emirates.
Krugman, Paul R. and Maurice Obstfeld. 2006. International Economics: Theory and Policy. Inter-national edition 7th ed. Pearson Addison-Wesley.
Kucera, David. 2002. “Core labour standards and foreign direct investment.” International LabourReview 141(1-2):31–69.
Leblang, David A. 1997. “Domestic and Systemic Determinants of Capital Controls in the Developedand Developing World.” International Studies Quarterly 41:435–454.
Leblang, David A. 2005. Is Democracy Incompatible with International Economic Stability. In TheFuture of the International Monetary System, ed. Marc Uzan. Edward Elgar Publishing.
31
Levy-Yeyati, Eduardo and Federico Sturzenegger. 2005. “Classifying exchange rate regimes: Deedsvs. Words.” European Economic Review 49:1603–1635.
Lewis, W. A. 1954. “Economic Development with Unlimited Supplies of Labour.” The ManchesterSchool 22:139–191.URL: doi: 10.1111/j.1467-9957.1954.tb00021.x
Li, Quan and Adam Resnick. 2003. “Reversal of Fortunes: Democratic Institutions and Foreign DirectInvestment Inflows to Developing Countries.” International Organization 57(1):175–211.
Munck, Gerardo L. and Jay Verkuilin. 2002. “Conceptualizing and Measuring Democracy: EvaluatingAlternative Indices.” Comparative Political Studies 35(1):5–34.
Oman, Charles. 2000. Policy Competition for Foreign Direct Investment: A Study of CompetitionAmong Governments to Attract FDI. Technical report OECD Development Centre.
Omar, Karima and William A. Stoever. 2008. “The role of technology and human capital in the EPZlife-cycle.” Transnational Corporations 17:1.
Pakdeenurit, P., N. Suthikarnnarunai and W. Rattanawong. 2014. “Special Economic Zone: Facts,Role, and Opportunities of Investment.” Proceedings of the International MultiConference of En-gineers and Computer Scientists II.
Pandya, Sonal S. 2014a. “Democratization and Foreign Direct Investment Liberalization, 1970-2000.”International Studies Quarterly pp. 1–14.
Pandya, Sonal S. 2014b. Trading Spaces: Foreign Direct Investment Regulation, 1970-2000. Cam-bridge University Press.
Pinto, Pablo M. 2013. Partisan Investment in the Global Economy: Why the Left Loves Foreign DirectInvestment and FDI Loves the Left. Cambridge University Press.
Rueschemeyer, Dietrich, Evelyne Huber Stephens and John D. Stephens. 1992. Capitalist Develop-ment and Democracy. University of Chicago Press.
Singa-Boyenge, Jean-Pierre. 2007. “ILO Database on Export Processing Zones (Revised).” Interna-tional Labour Organization Working Paper .
The Bangladesh Export Processing Zones Authority Act. 1980.URL: http://boi.gov.bd/index.php/component/businesslaws/?view=lawdetails&law id=79
Treier, Shawn and Simon Jackman. 2008. “Democracy as a Latent Variable.” American Journal ofPolitical Science 52(1):201–217.
Tucker, Richard. 1999. BTSCS: A Binary Time-Series-Cross-Section Data Analysis Utility. Version4.0.4 ed. Cambridge, MA: Harvard University.
United Nations. 2008. “W. Arthur Lewis: Pioneer of Development Economics.” UN ChronicleXLV(1).
32

U.S. Department of State. 2014a. 2014 Investment Climate Statement - Iceland. Technical reportBureau of Economic and Business Affairs.
US Department of State. 2014b. “2014 Investment Climate Statement - Vietnam.”https://www.state.gov/e/eb/rls/othr/ics/2014/229095.htm.
US Department of State. 2015. Latvia Investment Climate Statement.
Venkatesan, R. and Sonalika Varma. 1998. “Policy Competition Among States in India for AttractingDirect Investment.”.
Wallace, Jeremy L. 2014. Cities and Stability: Urbanization, Redistribution, and Regime Survival inChina. Oxford University Press.
Williamson, John. 2004. “The Strange History of the Washington Consensus.” Journal of Post Key-nesian Economics 27(2):195–206.
Williamson, John. 2012. “Is the “Beijing Consensus” Now Dominant?” Asia Policy (13):1–16.
Wilson, Kenneth A. 2016. User’s Manual: Cross-National Time-Series Data Archive. 2016 editioned.
World Bank. 2008. “Special Economic Zones: Performance, Lessons Learned, and Implications forZone Development.”.
33