Embed Size (px)
Citation preview

167
Exchange Rate Arrangements in East Asia:
Lessons from the 1997–98 Currency Crisis
Masahiro Kawai
MONETARY AND ECONOMIC STUDIES (SPECIAL EDITION)/DECEMBER 2002
This paper examines the evolution of exchange rate arrangements in East Asia’semerging market economies over the last 10 years. It considers both “official” and“observed” exchange rate arrangements in these economies from an internationalcomparative perspective. By focusing on the roles of the dollar, the yen, and the euroas anchor currencies for exchange rate stabilization, the paper claims that the dollarplayed a dominant role as a de jure or de facto anchor for emerging East Asia untilthe 1997–98 currency crisis. During the crisis, the dollar’s dominance naturallydeclined in affected East Asia as a result of a general shift to more flexible exchangerate arrangements. In the post-crisis period, the dollar has regained prominence insome countries (notably in Malaysia), while its dominance has been reduced andexchange rate flexibility has risen in others (notably in Indonesia). Interesting is theobservation that Korea and Thailand appear to have shifted to a de facto currencybasket arrangement with significant weights on the dollar and the yen, similar toSingapore’s managed floating arrangement. This paper also considers what may be adesirable currency system for the region. Given the high volatility of yen/dollarexchange rates and partner diversity of trade and foreign direct investment (FDI)relationships, it claims that the emerging East Asian economies would be better offstabilizing their currencies to a balanced currency basket in which the dollar, theyen, and the euro play equally important roles. For intra-regional exchange rate stability, greater coordination on the currency basket policy would be desirable, andthis needs to be supported by regional policy dialogue and financing mechanisms.
Key words: East Asian currency crisis; Exchange rate arrangements; Two-cornersolution approach; Fear of floating; Currency basket system
Deputy Vice Minister for International Affairs, Ministry of Finance, Japan (E-mail: [email protected])
This is a revised version of the paper presented at the 10th International Bank of Japan Conference, “ExchangeRate Regimes in the 21st Century,” organized by the Institute for Monetary and Economic Studies, Bank ofJapan, and held in Tokyo on July 1–2, 2002. The author is thankful to Chow Hwee Kwan, Hiroshi Fujiki, EijiHirano, and many other participants at the conference for helpful comments, to Ronald McKinnon for constructive communication, to Shigeru Akiyama for earlier research collaboration, and to Toshiyuki Matsuura,Kiyotaka Satoyoshi, and Junko Shimizu for their able research assistance. The findings, interpretations, andconclusions expressed in the paper are those of the author and do not necessarily represent the views of theJapanese government. All remaining errors are clearly his own.
I. Introduction
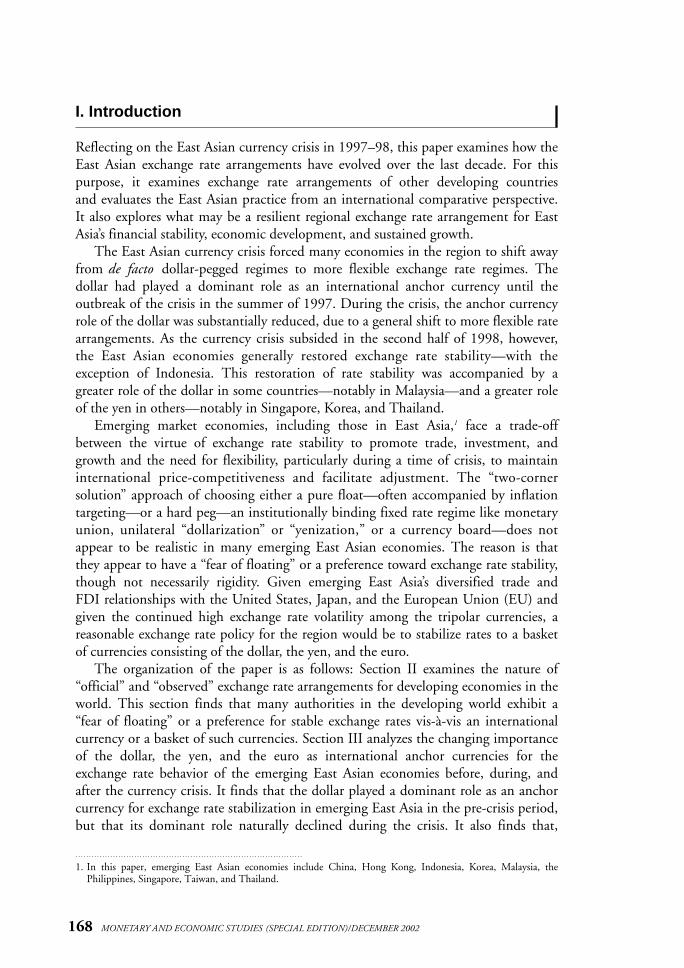
Reflecting on the East Asian currency crisis in 1997–98, this paper examines how theEast Asian exchange rate arrangements have evolved over the last decade. For thispurpose, it examines exchange rate arrangements of other developing countries and evaluates the East Asian practice from an international comparative perspective.It also explores what may be a resilient regional exchange rate arrangement for EastAsia’s financial stability, economic development, and sustained growth.
The East Asian currency crisis forced many economies in the region to shift awayfrom de facto dollar-pegged regimes to more flexible exchange rate regimes. The dollar had played a dominant role as an international anchor currency until the outbreak of the crisis in the summer of 1997. During the crisis, the anchor currencyrole of the dollar was substantially reduced, due to a general shift to more flexible ratearrangements. As the currency crisis subsided in the second half of 1998, however,the East Asian economies generally restored exchange rate stability—with the exception of Indonesia. This restoration of rate stability was accompanied by agreater role of the dollar in some countries—notably in Malaysia—and a greater roleof the yen in others—notably in Singapore, Korea, and Thailand.
Emerging market economies, including those in East Asia,1 face a trade-offbetween the virtue of exchange rate stability to promote trade, investment, andgrowth and the need for flexibility, particularly during a time of crisis, to maintaininternational price-competitiveness and facilitate adjustment. The “two-corner solution” approach of choosing either a pure float—often accompanied by inflationtargeting—or a hard peg—an institutionally binding fixed rate regime like monetaryunion, unilateral “dollarization” or “yenization,” or a currency board—does notappear to be realistic in many emerging East Asian economies. The reason is thatthey appear to have a “fear of floating” or a preference toward exchange rate stability,though not necessarily rigidity. Given emerging East Asia’s diversified trade and FDI relationships with the United States, Japan, and the European Union (EU) andgiven the continued high exchange rate volatility among the tripolar currencies, a reasonable exchange rate policy for the region would be to stabilize rates to a basketof currencies consisting of the dollar, the yen, and the euro.
The organization of the paper is as follows: Section II examines the nature of“official” and “observed” exchange rate arrangements for developing economies in theworld. This section finds that many authorities in the developing world exhibit a“fear of floating” or a preference for stable exchange rates vis-à-vis an internationalcurrency or a basket of such currencies. Section III analyzes the changing importanceof the dollar, the yen, and the euro as international anchor currencies for theexchange rate behavior of the emerging East Asian economies before, during, andafter the currency crisis. It finds that the dollar played a dominant role as an anchorcurrency for exchange rate stabilization in emerging East Asia in the pre-crisis period,but that its dominant role naturally declined during the crisis. It also finds that,
168 MONETARY AND ECONOMIC STUDIES (SPECIAL EDITION)/DECEMBER 2002
1. In this paper, emerging East Asian economies include China, Hong Kong, Indonesia, Korea, Malaysia, thePhilippines, Singapore, Taiwan, and Thailand.

in the post-crisis period, some economies have reverted to a pre-crisis type of dollar-based exchange rate regime, while others have allowed greater exchange rateflexibility. Several countries have shifted to a de facto currency basket arrangementwith larger weights on the yen. Section IV proposes a region-wide currency basketsystem where the dollar, the yen, and the euro would play more balanced roles. Howtightly or loosely the exchange rate should be stabilized is left to each economy’s specific conditions and preferences, at least initially. It also argues that a currency basket system needs to be accompanied by closer regional coordination throughfinancing and policy dialogue mechanisms, in a manner commensurate with real sector integration. Section V summarizes the paper.
II. Trends in Exchange Rate Arrangements in the Developing World
A. “Official” Exchange Rate ArrangementsThe International Monetary Fund (IMF) regularly publishes exchange rate arrange-ments formally reported by its member countries according to its own classificationscheme. In 1999, the IMF started to pay greater attention to the de facto exchangerate arrangement practices of its members rather than using only formally reportedarrangements. Table 1 summarizes such “official” arrangements for developing countries during 1980–2001.2 In this table, exchange rate arrangements are classifiedbroadly into three categories; a fixed exchange rate arrangement, limited exchangerate flexibility, and a more flexible exchange rate arrangement.3
While the number of IMF members in the developing world has increased over time (from 118 in 1980 to 163 in 2001), the number of countries under fixed exchange rate arrangements has decreased (from 90 to 76), and the number of countries under more flexible exchange rate arrangements has increased (from about25 to 83). As far as “official” exchange rate arrangements are concerned, many countries have shifted from fixed to more flexible arrangements over the last 20 years.Nonetheless, quite a few countries still attempt to stabilize their exchange rates.Indeed, 80 countries (49 percent of the total) were on “fixed exchange rate arrange-ments” and “limited exchange rate flexibility” in 2001. In addition, some countriesunder “more flexible arrangements” are known to have stabilized their exchange ratesvis-à-vis a certain currency or a basket of currencies.
169
Exchange Rate Arrangements in East Asia: Lessons from the 1997–98 Currency Crisis
2. See International Monetary Fund (1997), and Mussa et al. (2000) for discussions of exchange rate arrangementsin developing countries. Table 1 is compiled from the IMF’s International Financial Statistics (various issues) byremoving industrialized countries.
3. Beginning in January 1999, the IMF introduced a new classification of categories that includes (1) exchange arrangements with no separate legal tender; (2) currency board arrangements; (3) other conventional fixed-pegarrangements (including de facto peg arrangements under managed floating); (4) pegged exchange rates withinhorizontal bands; (5) crawling pegs; (6) exchange rates within crawling bands; (7) managed floating with no preannounced path for exchange rate; and (8) independently floating. As the new classification is not strictly comparable to earlier classifications, I have decided to compile Table 1 according to the earlier classification,assuming that (1), (2), and (3) belong to a “fixed rate arrangement,” (4) is “limited exchange rate flexibility,” (5),(6), and (7) belong to “managed floating,” and (8) is “independently floating.” The last two combined represent a“more flexible rate arrangement.”

170M
ON
ETAR
Y AN
D EC
ON
OM
IC ST
UD
IES(SPEC
IAL ED
ITIO
N)/D
ECEM
BER
2002
Table 1 Summary of Official Exchange Rate Arrangements of IMF-Member Developing Countries, 1980–2001
Number of countriesDec. Dec. Dec. Dec. Dec. Dec. Dec. Dec. Dec. Dec. Sept. Jan. Dec. Dec. Dec.1980 85 90 91 92 93 94 95 96 97 98 99 99 2000 01
Fixed exchange rate arrangement 90 89 81 75 82 71 70 65 65 65 63 73 79 79 76Pegged to the dollar 39 31 25 24 24 21 23 22 21 20 20 31 38 37 38Pegged to the euro 15 14 15 15 15 16 16 17 17 19 20 21 21 22 21
Pegged to the French franc 14 14 14 14 14 14 14 14 14 15 15 15 15 15 —Pegged to the deutschemark 0 0 1 1 1 1 1 2 2 3 3 4 4 5 —Pegged to other EMU currency 1 0 0 0 0 1 1 1 1 1 2 2 2 2 —
Pegged to the U.K. pound sterling 1 1 0 0 0 0 0 0 0 0 0 0 0 0 0Pegged to the Russian ruble 0 0 0 0 6 1 1 0 0 0 0 0 0 0 0Pegged to other currency 2 4 5 3 5 5 6 5 6 7 7 7 7 7 7Pegged to SDR 15 11 6 6 5 4 4 3 2 3 4 2 2 2 1Pegged to other currency composite 18 28 30 27 27 24 20 18 19 16 12 12 11 11 9
Limited exchange rate flexibility a 5 4 4 4 4 4 4 4 4 4 9 3 4 4More flexible exchange rate arrangement 3+b+c 32 46 54 58 77 81 88 89 89 92 80 80 80 83
Adjusted according to a set of indicators 3 4 5 5 3 4 3 2 2 — — — — — —Other managed floating b 17 21 25 22 28 30 42 43 44 55 41 37 42 52Independently floating c 11 20 24 33 45 48 44 44 45 37 39 43 38 31
Unclassified 0 1 1 1 0 0 0 0 0 0 0 0 0 0 0Total 118 127 132 134 144 152 155 157 158 158 159 162 162 163 163
Notes: 1. Though a new classification of exchange rate arrangements was introduced on January 1, 1999, the table summarizes official exchange rate arrangements on the basis of earlier classifica-tion methods. To try to maintain consistency with the earlier classification, several assumptions are made: a “fixed exchange rate arrangement” includes “exchange arrangements with no separate legal tender,” “currency board arrangements,” and “other conventional fixed-peg arrangements (including de facto peg arrangements under managed floating)”; “limitedexchange rate flexibility” corresponds to “pegged exchange rates within horizontal bands”; “managed floating” includes “crawling pegs,” “exchange rates within crawling bands,” and “managed floating with no preannounced path for exchange rate”; and “independently floating” in the table corresponds to “independently floating” under the new classification.
Notes: 2. The number of countries under “fixed exchange rate arrangement” jumped upward in January 1999 because nine countries began to be reclassified as “other conventional fixed-pegarrangements (including de facto peg arrangements under managed floating)” rather than as managed or independently floating, and three economies (Aruba, Hong Kong, and NetherlandsAntilles) were added to the list.
Notes: 3. Given that the euro was introduced in January 1999, the row for “pegged to the euro” is created to indicate the number of developing countries that had pegged their currencies to EMU-12 currencies—mainly the French franc, the deutschemark, the Spanish peseta, and the Portuguese escudo—until the end of 1998.
Notes: 4. Several IMF-member and non-member developing economies are not always included in this table, e.g., Hong Kong (1980–98), Taiwan, and Cambodia (1980 and 1992).Notes: 5. The sum of a, b, and c in the table in 1980 is 25.
Source: International Monetary Fund, International Financial Statistics (various issues).

Focusing on the fixed rate arrangements in the developing world, as of December2001, the dollar is the most popular target currency (for 42 developing countriesincluding four countries under “flexibility limited in terms of a single currency”), followed by the euro (formerly the French franc for 15 countries, the deutschemarkfor four countries and the Portuguese escudo and the Italian lira for one country eachafter January 1999), non-special drawing right (SDR) currency baskets (for ninecountries), and the SDR (for one country).4 It is noteworthy to observe that nodeveloping country pegs its exchange rate any longer to the U.K. pound sterling, particularly since 1986, or to the yen throughout the period.
B. “Observed” Exchange Rate Arrangements: Quantitative Analyses The “official” exchange rate arrangements provide information about the nature of the arrangements as reported by individual countries and, where appropriate,reclassified by the IMF when formally reported arrangements differ from the actualpractices. However, these official arrangements still do not accurately describe theactual practice of exchange rate policies, nor do they offer sufficient information as towhich currency or basket of currencies is chosen as a target for de facto exchange ratestabilization. To understand which exchange rate arrangements are actually in place,one must statistically examine the observed behavior of relevant variables, particularlyexchange rates.5
One way to do this is through a regression analysis technique used by Frankel andWei (1993, 1994, 1995) and to identify which major currency or currency basket is chosen as an anchor for a particular country’s exchange rate stabilization and how closely such a relationship can be observed. In this subsection, we estimate the following type of regression equation:6
∆e jt = α + β1∆eUSD
t + β2∆e DMt + β3∆e JY
t + β4∆e FFt + β5∆eUKP
t + ut,
where ∆e jt is the monthly change in the log exchange rate of currency j in month t ,
α is a constant term, βk (k = 1, 2, . . .) is the coefficient on the monthly change in thelog exchange rate of currency k, and ut is the residual term. The superscripts USD,DM, JY, FF, and UKP refer to the dollar, the deutschemark, the yen, the Frenchfranc, and the U.K. pound sterling, respectively. The estimated standard error ofregression residuals can be interpreted as a measure of exchange rate volatility. Amonthly change in the exchange rate is defined by the first difference of the naturallogarithm of the nominal exchange rate. For some countries, we use as right-handside variables the exchange rates of the SDR, European Currency Unit (ECU), andother relevant minor, regional currencies, reflecting country-specific characteristics.Following Frankel and Wei (1994), we express all the exchange rates in terms of a
171
Exchange Rate Arrangements in East Asia: Lessons from the 1997–98 Currency Crisis
4. Other target currencies for single-currency pegs include the South African rand (for three countries in December2001), the Indian rupee (for two countries), the Australian dollar, and the Singapore dollar (for one country each).In the past, the U.K. pound sterling, the Spanish peseta, and the Russian ruble were also targets for single-currency pegs.
5. A more detailed study would require analysis of changes in foreign exchange reserves, foreign exchange marketpressure, and interest rates.
6. This exercise is an extension of the studies conducted by the author for an earlier sample period (see Kawai andAkiyama [1998]).
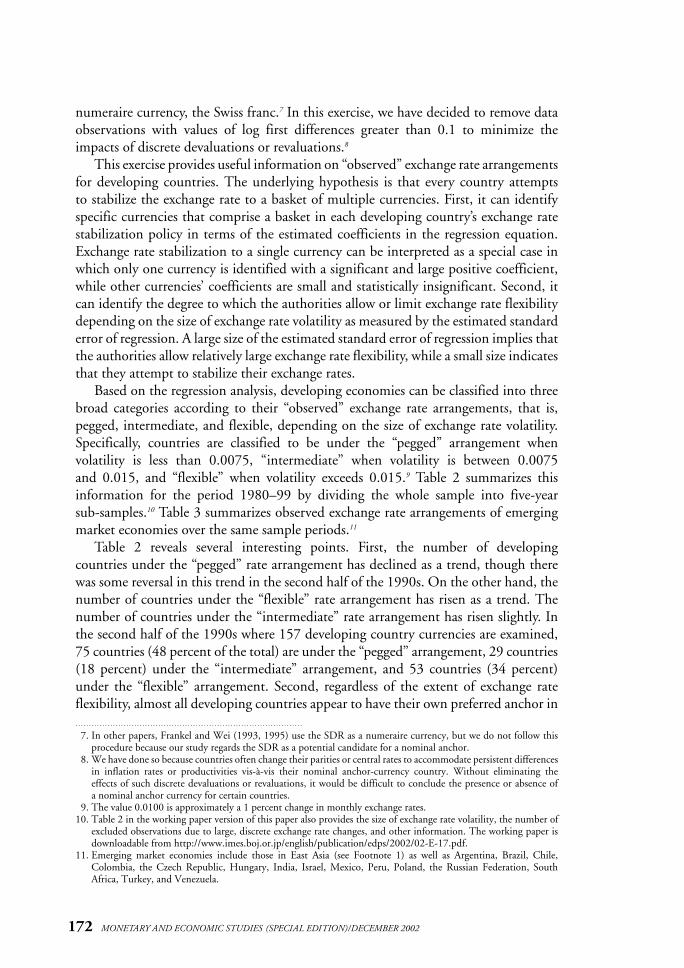
numeraire currency, the Swiss franc.7 In this exercise, we have decided to remove dataobservations with values of log first differences greater than 0.1 to minimize theimpacts of discrete devaluations or revaluations.8
This exercise provides useful information on “observed” exchange rate arrangementsfor developing countries. The underlying hypothesis is that every country attempts to stabilize the exchange rate to a basket of multiple currencies. First, it can identify specific currencies that comprise a basket in each developing country’s exchange ratestabilization policy in terms of the estimated coefficients in the regression equation.Exchange rate stabilization to a single currency can be interpreted as a special case inwhich only one currency is identified with a significant and large positive coefficient,while other currencies’ coefficients are small and statistically insignificant. Second, itcan identify the degree to which the authorities allow or limit exchange rate flexibilitydepending on the size of exchange rate volatility as measured by the estimated standarderror of regression. A large size of the estimated standard error of regression implies thatthe authorities allow relatively large exchange rate flexibility, while a small size indicatesthat they attempt to stabilize their exchange rates.
Based on the regression analysis, developing economies can be classified into threebroad categories according to their “observed” exchange rate arrangements, that is,pegged, intermediate, and flexible, depending on the size of exchange rate volatility.Specifically, countries are classified to be under the “pegged” arrangement whenvolatility is less than 0.0075, “intermediate” when volatility is between 0.0075 and 0.015, and “flexible” when volatility exceeds 0.015.9 Table 2 summarizes thisinformation for the period 1980–99 by dividing the whole sample into five-year sub-samples.10 Table 3 summarizes observed exchange rate arrangements of emergingmarket economies over the same sample periods.11
Table 2 reveals several interesting points. First, the number of developing countries under the “pegged” rate arrangement has declined as a trend, though therewas some reversal in this trend in the second half of the 1990s. On the other hand, thenumber of countries under the “flexible” rate arrangement has risen as a trend. Thenumber of countries under the “intermediate” rate arrangement has risen slightly. Inthe second half of the 1990s where 157 developing country currencies are examined,75 countries (48 percent of the total) are under the “pegged” arrangement, 29 countries(18 percent) under the “intermediate” arrangement, and 53 countries (34 percent)under the “flexible” arrangement. Second, regardless of the extent of exchange rate flexibility, almost all developing countries appear to have their own preferred anchor in
172 MONETARY AND ECONOMIC STUDIES (SPECIAL EDITION)/DECEMBER 2002
7. In other papers, Frankel and Wei (1993, 1995) use the SDR as a numeraire currency, but we do not follow thisprocedure because our study regards the SDR as a potential candidate for a nominal anchor.
8. We have done so because countries often change their parities or central rates to accommodate persistent differencesin inflation rates or productivities vis-à-vis their nominal anchor-currency country. Without eliminating the effects of such discrete devaluations or revaluations, it would be difficult to conclude the presence or absence of a nominal anchor currency for certain countries.
9. The value 0.0100 is approximately a 1 percent change in monthly exchange rates.10. Table 2 in the working paper version of this paper also provides the size of exchange rate volatility, the number of
excluded observations due to large, discrete exchange rate changes, and other information. The working paper isdownloadable from http://www.imes.boj.or.jp/english/publication/edps/2002/02-E-17.pdf.
11. Emerging market economies include those in East Asia (see Footnote 1) as well as Argentina, Brazil, Chile,Colombia, the Czech Republic, Hungary, India, Israel, Mexico, Peru, Poland, the Russian Federation, SouthAfrica, Turkey, and Venezuela.

terms of a single currency or a basket of currencies. The dollar is the most preferredanchor currency (for 84 countries or 54 percent of all developing countries in the second half of the 1990s), followed by a basket of currencies (for 41 countries or 26 percent) and other single currencies (for 31 countries or 20 percent). There were very few countries where anchor currencies could not be identified. Third, as can be seen in Table 3, until the mid-1990s, a majority of non-East Asian emerging
173
Exchange Rate Arrangements in East Asia: Lessons from the 1997–98 Currency Crisis
Table 2 Summary of Observed Exchange Rate Arrangements of DevelopingCountries (Classified by Monthly Data)
Number of countries; number of emerging market economies in parentheses
Sample Dollar
Other single Basket ofTotalperiod currency currencies
[1] Pegged: Jan. 1980–39 (3) 23 (0) 21 (4) 83 (7)0 ≤ volatility < 0.0075 Dec. 1984
Jan. 1985–32 (1) 22 (0) 15 (3) 69 (4)Dec. 1989
Jan. 1990–31 (2) 22 (0) 14 (4) 67 (6)Dec. 1994
Jan. 1995–37 (3) 24 (0) 14 (0) 75 (3)Dec. 1999
[2] Intermediate: Jan. 1980–10 (3) 0 (0) 15 (4) 25 (7)0.0075 ≤ volatility < 0.015 Dec. 1984
Jan. 1985–14 (7) 1 (0) 14 (2) 29 (9)Dec. 1989
Jan. 1990–10 (5) 1 (0) 23 (7) 34 (12)Dec. 1994
Jan. 1995–16 (4) 1 (1) 12 (3) 29 (8)Dec. 1999
[3] Flexible: Jan. 1980–12 (7) 1 (0) 10 (2) 24 (9)volatility ≥ 0.015 Dec. 1984
Jan. 1985–24 (6) 2 (0) 10 (4) 36 (10)Dec. 1989
Jan. 1990–29 (5) 7 (1) 17 (1) 53 (7)
Dec. 1994
Jan. 1995–31 (6) 6 (3) 15 (5) 53 (14)
Dec. 1999
Notes: 1. Countries are classified into three categories of exchange rate arrangements (pegged, intermediate, and flexible), depending on the size of exchange rate volatility as measured by the standard error of regression. Countries are classified as “pegged” when the volatility is less than 0.0075, “intermediate” when the volatility is between 0.0075 and 0.015, and “flexible” when the volatility is equal to or greater than 0.015. In each category, countries arefurther classified into three groups, depending on what currency or basket of currencies isassigned a significant weight in the regression equation. The “dollar” group includes thosefor which the dollar appears as the only significant currency in the regression equation. The“other single currency” group includes those for which another single currency appears asthe only significant currency in the regression equation. The “basket of currencies” groupincludes those for which multiple currencies appear as significant in the regression equation.
Notes: 2. Emerging market economies include Argentina, Brazil, Chile, China, Colombia, the CzechRepublic, Hong Kong, Hungary, India, Indonesia, Israel, Korea (Republic of), Malaysia,Mexico, Pakistan, Peru, the Philippines, Poland, the Russian Federation, Singapore, SouthAfrica, Taiwan, Thailand, Turkey, and Venezuela.
Notes: 3. There is one country each for the periods January 1980–December 1984 (Lebanon) andJanuary 1995–December 1999 (Congo, Democratic Rep.), whose volatility exceeds 0.03without any identified currency weight.
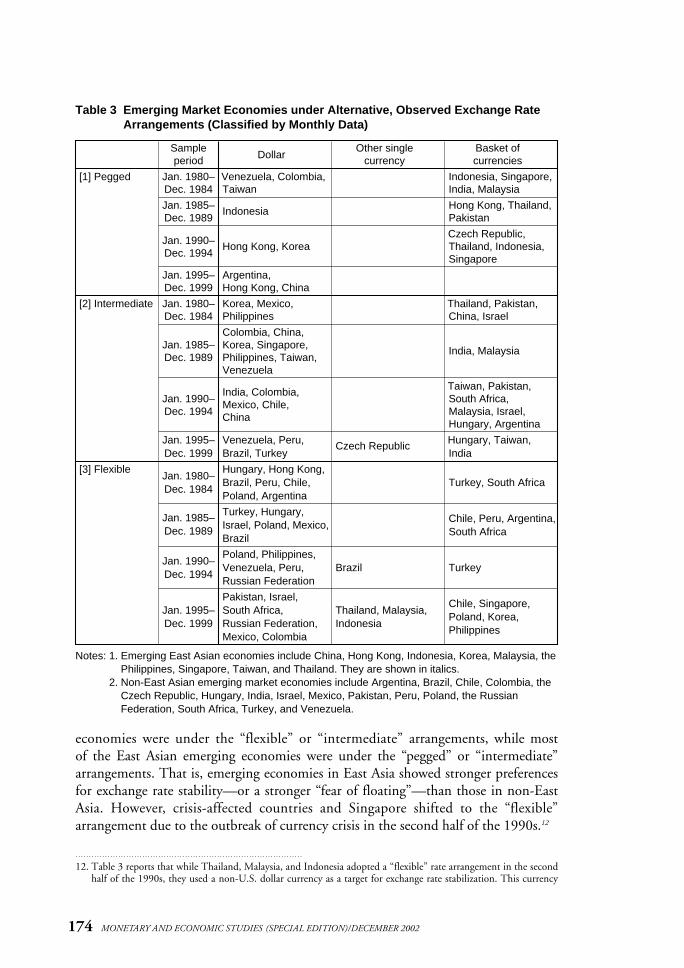
economies were under the “flexible” or “intermediate” arrangements, while most of the East Asian emerging economies were under the “pegged” or “intermediate”arrangements. That is, emerging economies in East Asia showed stronger preferencesfor exchange rate stability—or a stronger “fear of floating”—than those in non-EastAsia. However, crisis-affected countries and Singapore shifted to the “flexible” arrangement due to the outbreak of currency crisis in the second half of the 1990s.12
174 MONETARY AND ECONOMIC STUDIES (SPECIAL EDITION)/DECEMBER 2002
Table 3 Emerging Market Economies under Alternative, Observed Exchange RateArrangements (Classified by Monthly Data)
Sample Dollar
Other single Basket of period currency currencies
[1] Pegged Jan. 1980– Venezuela, Colombia, Indonesia, Singapore,Dec. 1984 Taiwan India, Malaysia
Jan. 1985– Indonesia Hong Kong, Thailand,Dec. 1989 Pakistan
Jan. 1990–Czech Republic,
Dec. 1994Hong Kong, Korea Thailand, Indonesia,
Singapore
Jan. 1995– Argentina, Dec. 1999 Hong Kong, China
[2] Intermediate Jan. 1980– Korea, Mexico, Thailand, Pakistan,Dec. 1984 Philippines China, Israel
Colombia, China,Jan. 1985– Korea, Singapore, India, MalaysiaDec. 1989 Philippines, Taiwan,
Venezuela
India, Colombia, Taiwan, Pakistan, Jan. 1990– Mexico, Chile, South Africa, Dec. 1994 China Malaysia, Israel,
Hungary, Argentina
Jan. 1995– Venezuela, Peru, Czech Republic Hungary, Taiwan, Dec. 1999 Brazil, Turkey India
[3] Flexible Hungary, Hong Kong,Jan. 1980–
Brazil, Peru, Chile, Turkey, South AfricaDec. 1984
Poland, Argentina
Jan. 1985– Turkey, Hungary, Chile, Peru, Argentina,
Dec. 1989 Israel, Poland, Mexico,South Africa
Brazil
Jan. 1990–Poland, Philippines,
Dec. 1994Venezuela, Peru, Brazil TurkeyRussian Federation
Pakistan, Israel, Chile, Singapore,
Jan. 1995– South Africa, Thailand, Malaysia, Poland, Korea,
Dec. 1999 Russian Federation, IndonesiaPhilippines
Mexico, Colombia
Notes: 1. Emerging East Asian economies include China, Hong Kong, Indonesia, Korea, Malaysia, thePhilippines, Singapore, Taiwan, and Thailand. They are shown in italics.
Notes: 2. Non-East Asian emerging market economies include Argentina, Brazil, Chile, Colombia, theCzech Republic, Hungary, India, Israel, Mexico, Pakistan, Peru, Poland, the RussianFederation, South Africa, Turkey, and Venezuela.
12. Table 3 reports that while Thailand, Malaysia, and Indonesia adopted a “flexible” rate arrangement in the secondhalf of the 1990s, they used a non-U.S. dollar currency as a target for exchange rate stabilization. This currency

While an increasing number of developing countries shifted away from fixedtoward more flexible exchange rate arrangements on an “official” basis by the 1990s,almost all countries attempted to stabilize their exchange rates against a single currencyor a currency basket, though the degree of rate stabilization varied considerably acrosscountries. Many countries regard the dollar as their anchor currency despite theabsence of a formal commitment to a dollar peg. Notable is the fact that quite a feweconomies are using currency baskets as their anchor without officially announcing it.
C. Formation of Tripolar Currency AreasUsing the results in the preceding subsection, we can estimate the size of tripolar currency areas, that is, currency areas formed by the dollar, the new European single currency (euro), and the yen. The objective here is to gain insight into the current stateand evolution of the international monetary system by quantitatively gauging the size ofmajor currency areas. Particularly interesting is to evaluate the impact of the creation ofthe European Economic and Monetary Union (EMU) and introduction of the euro onthe international monetary system. The main question is whether the newly introducedeuro is strong enough to seriously challenge the dollar’s dominance and to convert thedollar-dominated international monetary system into a regime centered on both the dollar and the euro. Another important question is what role the yen can play.13
1. Defining currency areasIn this subsection, we calculate the economic size of a currency area in terms of GDPand trade flows (exports plus imports), expressed as current dollar values, using data forthe period 1990–99. By using different economic variables as the basis for measuringthe size of currency areas, we can further our understanding of the importance of themajor currencies as nominal anchors for the rest of the world.
In this calculation, we undertake the following four steps: first, we start by focus-ing on the currencies of the G-5 countries (i.e., the United States, Germany, France,the United Kingdom, and Japan) in addition to the SDR and the ECU. Each of theseG-5 currencies is assumed to form a currency area of its own. If any country rigidly pegsits exchange rate to a particular G-5 currency, its entire economy, measured by GDP or trade flows, is classified as belonging to the currency area formed by this particularcurrency. If a country stabilizes its exchange rate to a basket of multiple currencies, itseconomy is divided into fractions of major currency areas according to the weightsassigned to these major currencies in a basket. The coefficients that were estimated in the previous section as statistically significant, at least at the 5 percent level, are interpreted as the weights assigned to the corresponding currencies. If a country does not stabilize its exchange rate against any single currency or currency basket, its
175
Exchange Rate Arrangements in East Asia: Lessons from the 1997–98 Currency Crisis
turns out to be the Singapore dollar despite the fact that these countries did not pursue conscious policies to usethe Singapore dollar as their official target. Since Singapore was under a currency basket system during thisperiod, these three countries are considered to have been under a similar currency basket arrangement. At anyrate, this result appears to reflect statistical relationships observed on the average during the sample period thatincludes the currency crisis episode.
13. See Alogoskoufis and Portes (1997) and Bergsten (1997), who argue that the introduction of the euro will challenge the dollar’s dominance and convert the international monetary system into a bipolar system centered on both the dollar and the euro. They do not see much potential for the yen to grow into another dominantinternational currency.
economy is considered not to belong to any currency area; it adopts flexible exchangerates vis-à-vis the major currencies. In essence, we divide each individual country intodifferent fractions of currency areas and then calculate the size of a currency area for theworld as a whole by summing the corresponding fractions over all countries.14
Second, the weights assigned to anchor currencies are obtained from the estimated coefficients of a regression equation that are positive and statistically significant at the 5 percent level or above. If the sum of the estimated coefficients isequal to or less than one, their values are used as weights. If the sum exceeds unity, allthe coefficients are proportionally rescaled downward to make the sum equal to oneand the rescaled coefficients are used as weights.
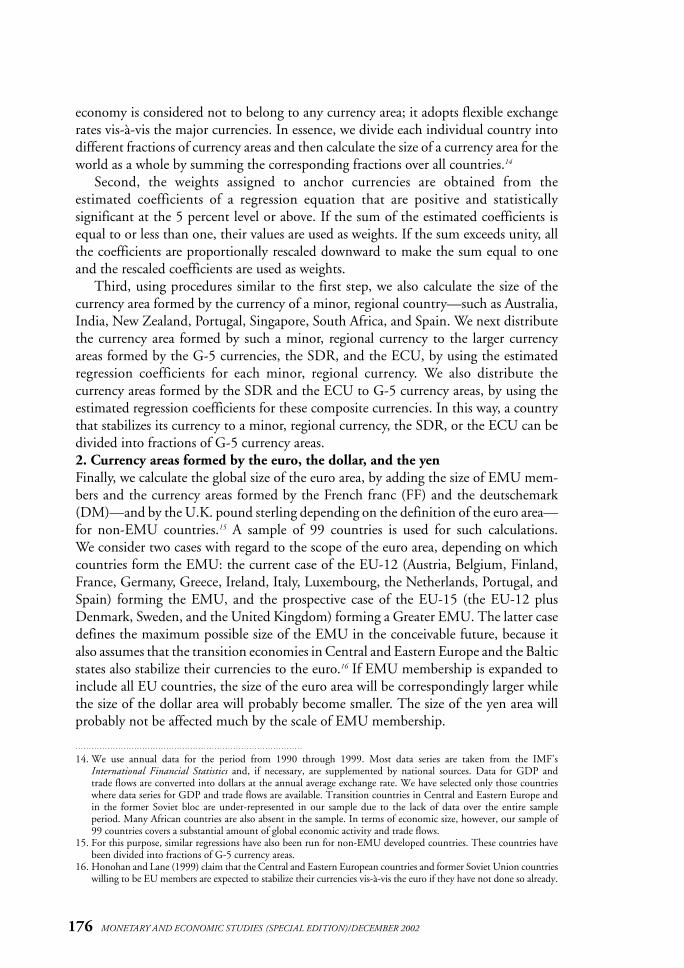
Third, using procedures similar to the first step, we also calculate the size of the currency area formed by the currency of a minor, regional country—such as Australia,India, New Zealand, Portugal, Singapore, South Africa, and Spain. We next distributethe currency area formed by such a minor, regional currency to the larger currencyareas formed by the G-5 currencies, the SDR, and the ECU, by using the estimatedregression coefficients for each minor, regional currency. We also distribute the currency areas formed by the SDR and the ECU to G-5 currency areas, by using theestimated regression coefficients for these composite currencies. In this way, a countrythat stabilizes its currency to a minor, regional currency, the SDR, or the ECU can bedivided into fractions of G-5 currency areas. 2. Currency areas formed by the euro, the dollar, and the yenFinally, we calculate the global size of the euro area, by adding the size of EMU mem-bers and the currency areas formed by the French franc (FF) and the deutschemark(DM)—and by the U.K. pound sterling depending on the definition of the euro area—for non-EMU countries.15 A sample of 99 countries is used for such calculations. We consider two cases with regard to the scope of the euro area, depending on whichcountries form the EMU: the current case of the EU-12 (Austria, Belgium, Finland,France, Germany, Greece, Ireland, Italy, Luxembourg, the Netherlands, Portugal, andSpain) forming the EMU, and the prospective case of the EU-15 (the EU-12 plusDenmark, Sweden, and the United Kingdom) forming a Greater EMU. The latter casedefines the maximum possible size of the EMU in the conceivable future, because italso assumes that the transition economies in Central and Eastern Europe and the Balticstates also stabilize their currencies to the euro.16 If EMU membership is expanded toinclude all EU countries, the size of the euro area will be correspondingly larger whilethe size of the dollar area will probably become smaller. The size of the yen area willprobably not be affected much by the scale of EMU membership.
176 MONETARY AND ECONOMIC STUDIES (SPECIAL EDITION)/DECEMBER 2002
14. We use annual data for the period from 1990 through 1999. Most data series are taken from the IMF’sInternational Financial Statistics and, if necessary, are supplemented by national sources. Data for GDP andtrade flows are converted into dollars at the annual average exchange rate. We have selected only those countrieswhere data series for GDP and trade flows are available. Transition countries in Central and Eastern Europe andin the former Soviet bloc are under-represented in our sample due to the lack of data over the entire sampleperiod. Many African countries are also absent in the sample. In terms of economic size, however, our sample of99 countries covers a substantial amount of global economic activity and trade flows.
15. For this purpose, similar regressions have also been run for non-EMU developed countries. These countries havebeen divided into fractions of G-5 currency areas.
16. Honohan and Lane (1999) claim that the Central and Eastern European countries and former Soviet Union countrieswilling to be EU members are expected to stabilize their currencies vis-à-vis the euro if they have not done so already.

177
Exchange R
ate Arrangem
ents in East A
sia: Lessons from the 1997–98 C
urrency Crisis
[1] Measured by Gross Domestic Product (GDP) in Current Dollars
Percent; US$ billions in parentheses
Case of EMU Case of Greater EMU
Dollar Yen Euro U.K. pound Other Dollar Yen Euro U.K. pound OtherRegional total
area area area area area area area area
Industrial countries 29.8 15.8 26.4 4.9 0.1 29.6 15.8 31.5 0.0 0.0 76.9 (20,182)
European Union-15 0.2 0.0 24.8 4.4 0.1 0.0 0.0 29.5 0.0 0.0 29.5 (7,727)
EU-12 0.0 0.0 23.7 0.0 0.0 0.0 0.0 23.7 0.0 0.0 23.7 (6,214)
Three other EU 0.2 0.0 1.1 4.4 0.1 0.0 0.0 5.8 0.0 0.0 5.8 (1,513)members
United States 26.5 0.0 0.0 0.0 0.0 26.5 0.0 0.0 0.0 0.0 26.5 (6,962)
Japan 0.0 15.7 0.0 0.0 0.0 0.0 15.7 0.0 0.0 0.0 15.7 (4,117)
Other 3.0 0.1 1.6 0.4 0.0 3.0 0.1 2.1 0.0 0.0 5.2 (1,377)
Developing countries 18.2 0.9 2.3 0.5 1.2 15.6 0.8 5.4 0.0 1.2 23.1 (6,050)
Africa 0.9 0.0 0.4 0.1 0.1 0.9 0.0 0.5 0.0 0.1 1.5 (405)
Asia 7.3 0.8 0.9 0.3 0.3 7.3 0.8 1.1 0.0 0.3 9.5 (2,492)
Europe 2.8 0.0 0.7 0.1 0.4 0.3 0.0 3.4 0.0 0.4 4.0 (1,059)
Middle East 1.6 0.0 0.0 0.1 0.1 1.6 0.0 0.1 0.0 0.1 1.9 (491)
Western hemisphere 5.5 0.1 0.3 0.0 0.3 5.5 0.1 0.3 0.0 0.3 6.1 (1,603)
World total47.9 16.7 28.7 5.4 1.3 45.2 16.7 36.9 0.0 1.2 100.0 (26,233)
(12,570) (4,376) (7,523) (1,413) (351) (11,859) (4,374) (9,691) (0) (309) (26,233)
Notes: 1. The EU-12 includes Austria, Belgium, Finland, France, Germany, Greece, Ireland, Italy, Luxembourg, the Netherlands, Portugal, and Spain.Notes: 2. Three other EU members are Denmark, Sweden, and the United Kingdom.Notes: 3. Greater EMU includes all 15 EU member countries and assumes that Central and European countries in transition (e.g., Hungary, Poland, and Romania)
and the Baltic states stabilize exchange rates to the euro.
(Continued on next page)
Table 4 Estimated Size of the Currency Areas for the Dollar, the Yen, and the Euro (Percentage Averages Based on 1990–99 Data)
178M
ON
ETAR
Y AN
D EC
ON
OM
IC ST
UD
IES(SPEC
IAL ED
ITIO
N)/D
ECEM
BER
2002
Table 4 (continued)
[2] Measured by Total Trade Flows (Exports Plus Imports) in Current Dollars
Percent; US$ billions in parentheses
Case of EMU Case of Greater EMU
Dollar Yen Euro U.K. poundOther
Dollar Yen Euro U.K. poundOther
Regional totalarea area area area area area area area
Industrial countries 18.5 7.3 35.9 6.1 0.1 18.3 7.3 42.4 0.0 0.5 68.0 (6,267)
European Union-15 0.3 0.0 33.6 4.5 0.1 0.0 0.0 39.4 0.0 0.0 39.4 (3,634)
EU-12 0.0 0.0 31.9 0.0 0.0 0.0 0.0 31.9 0.0 0.0 31.9 (2,939)
Three other EU 0.3 0.0 1.7 4.5 0.1 0.0 0.0 7.5 0.0 0.0 7.5 (695)members
United States 14.0 0.0 0.0 0.0 0.0 14.0 0.0 0.0 0.0 0.0 14.0 (1,289)
Japan 0.0 7.2 0.0 0.0 0.0 0.0 7.2 0.0 0.0 0.0 7.2 (662)
Other 4.3 0.1 2.3 0.7 0.0 4.3 0.1 3.0 0.0 0.0 7.4 (681)
Developing countries 24.2 1.8 3.9 0.8 1.3 21.6 1.7 7.5 0.0 1.2 32.0 (2,950)
Africa 1.1 0.0 0.5 0.2 0.2 1.1 0.0 0.7 0.0 0.2 2.0 (185)
Asia 12.9 1.6 1.7 0.4 0.4 12.9 1.6 2.1 0.0 0.4 17.0 (1,569)
Europe 2.9 0.0 1.5 0.1 0.4 0.3 0.0 4.3 0.0 0.3 4.9 (454)
Middle East 2.8 0.1 0.1 0.1 0.2 2.8 0.1 0.2 0.0 0.2 3.3 (302)
Western hemisphere 4.5 0.0 0.1 0.0 0.1 4.5 0.0 0.1 0.0 0.1 4.8 (440)
World total42.8 9.1 39.8 6.9 1.5 39.9 9.1 49.9 0.0 1.2 100.0 (9,216)
(3,942) (835) (3,670) (634) (135) (3,674) (835) (4,596) (0) (112) (9,216)
Notes: 1. The EU-12 includes Austria, Belgium, Finland, France, Germany, Greece, Ireland, Italy, Luxembourg, the Netherlands, Portugal, and Spain.Notes: 2. Three other EU members are Denmark, Sweden, and the United Kingdom.Notes: 3. Greater EMU includes all 15 EU member countries and assumes that Central and European countries in transition (e.g., Hungary, Poland, and Romania)
and the Baltic states stabilize exchange rates to the euro.
179
Exchange Rate Arrangements in East Asia: Lessons from the 1997–98 Currency Crisis
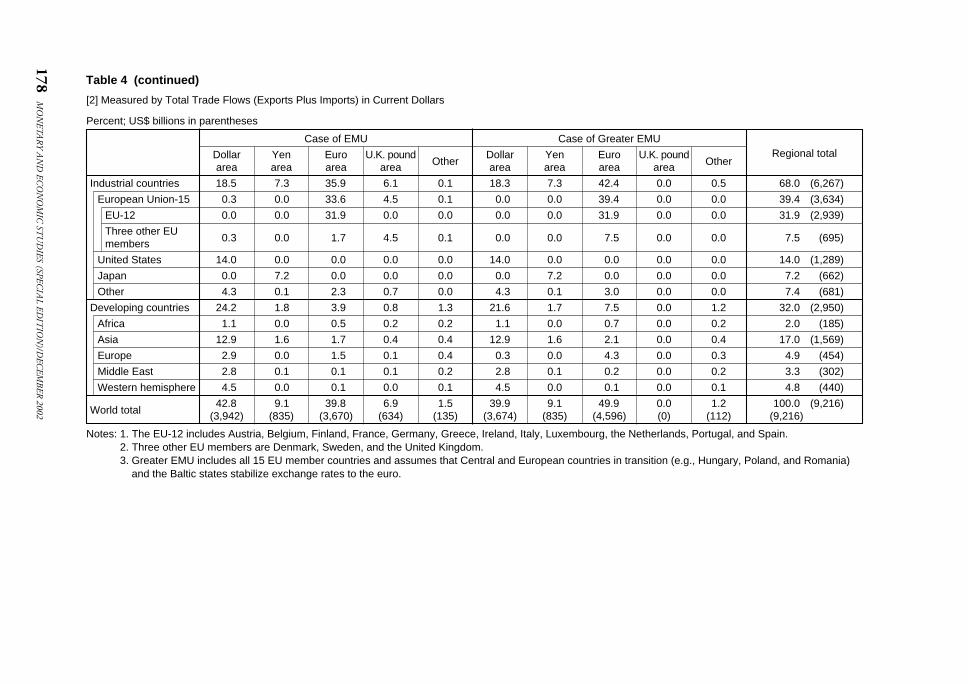
Table 4 summarizes the results of these calculations. The table reports the relativeeconomic shares for each of the three major currency areas, based on GDP and totaltrade flows, for developing as well as developed countries. It shows that choice of measurement—GDP or trade flows—influences the size of the dollar and euro areas.Taking the case of Greater EMU, the GDP measure indicates that the dollar area is stilllarger than the euro area. For example, 45 percent of the world economy is covered by the dollar area, 37 percent by the euro area, and 17 percent by the yen area. The dollar area is large because many developing countries, particularly those in Asia andLatin America, regard the dollar as the most important nominal anchor. The size of the dollar area outside the United States is about 19 percent of the world’s GDP, of whichthe developing world accounts for 16 percent. In contrast, the size of the euro area outside the EU-15 members is 7.5 percent of the world’s GDP, of which the develop-ing world accounts for 5 percent. The yen area’s share (17 percent) is only slightly bigger than the weight of the Japanese economy in the world (16 percent).17 The yenarea outside Japan is small and accounts for only 1 percent of the world’s GDP, which underlines the fact that the yen is not a full-fledged, global nominal anchor currency.
The trade flow measure indicates that the euro area will be larger than the dollararea. The euro area accounts for 50 percent of the world total trade flows, the dollararea 40 percent and the yen area a meager 9 percent. Interpretation of trade-basedeconomic size requires caution because the underlying trade flows do not net outintra-EU trade flows, and the predominance of the euro area measured by trade activ-ity may be exaggerated. Essentially, the relative economic size of the euro areadepends on which economic activity is considered more important to the world as awhole, real economic activity or trade activity.
D. Preference for Exchange Rate Stability in Emerging Market EconomiesThe results described above reveal that the “observed” exchange rate arrangements arelargely consistent with the “official” exchange rate policies, with some exceptions.The results also provide several stylized facts and general conclusions about the individual developing economies’ exchange rate arrangements.
First, many developing countries—including emerging market economies—haveshifted their “official” exchange rate arrangements from “fixed” to “more flexible” rate regimes. However, they often exhibit preferences toward stable exchange ratesvis-à-vis a single currency or a currency basket. Countries facing large exchange ratefluctuations against major international currencies were those in the early stage ofeconomic transition in Eastern Europe or the former Soviet Union or economies subject to chronically high inflation.
Second, non-East Asian emerging market economies tend to have a “flexible” or“intermediate” arrangement, while the East Asian emerging economies tend tochoose a “pegged” or “intermediate” arrangement. The East Asian economies appearto exhibit greater preference for exchange rate stability or a greater fear of floatingthan their non-East Asian counterparts.
17. These relative share numbers correspond to the figures estimated by other authors such as Bergsten (1997) andMasson and Turtleboom (1997).

Third, the dollar is the most favored anchor currency for exchange rate stabilizationin the developing world. However, significant diversity exists across regions globally in exchange rate arrangements. For African countries, their major exchange rate stabilization anchors are the euro (formerly the French franc), the dollar, and the SDR. Asian economies generally attempt to stabilize their exchange rates vis-à-vis the dollar, the SDR, and a few regional currencies. The yen has not played a majoranchor currency role even in East Asia. The transition economies in Central andEastern Europe and the former Soviet Union have not experienced stable exchangerates or stable arrangements in general, but many of them are expected to eventuallystabilize their currencies to the euro. The Middle East includes countries that have successfully stabilized exchange rates vis-à-vis the dollar and/or the SDR. The whole of Latin America is a de facto dollar area, and even countries not officially peggingexchange rates to the dollar do assign significantly positive, and close to unitary,weights to the dollar.
Fourth, a developing country’s choice of anchor currency for exchange rate stabilization depends largely on which currency areas the country tends to trade with, as well as on the country’s geographical location and its past colonial ties.18
For example, a country that trades heavily with the dollar area tends to choose thedollar as an exchange rate stabilization anchor. By implication, a country that tradeswith several currency areas with more or less equal shares is expected to choose a well-balanced currency basket as its anchor for exchange rate stabilization.
III. The East Asian Exchange Rate Arrangements
In this section, we attempt to identify the exchange rate arrangements that have prevailed in East Asia, particularly in former crisis countries and the neighboringemerging economies, before and after the 1997–98 currency crisis. An important taskis to identify factors behind the choice of exchange rate arrangements in the pre-crisisas well as post-crisis periods.
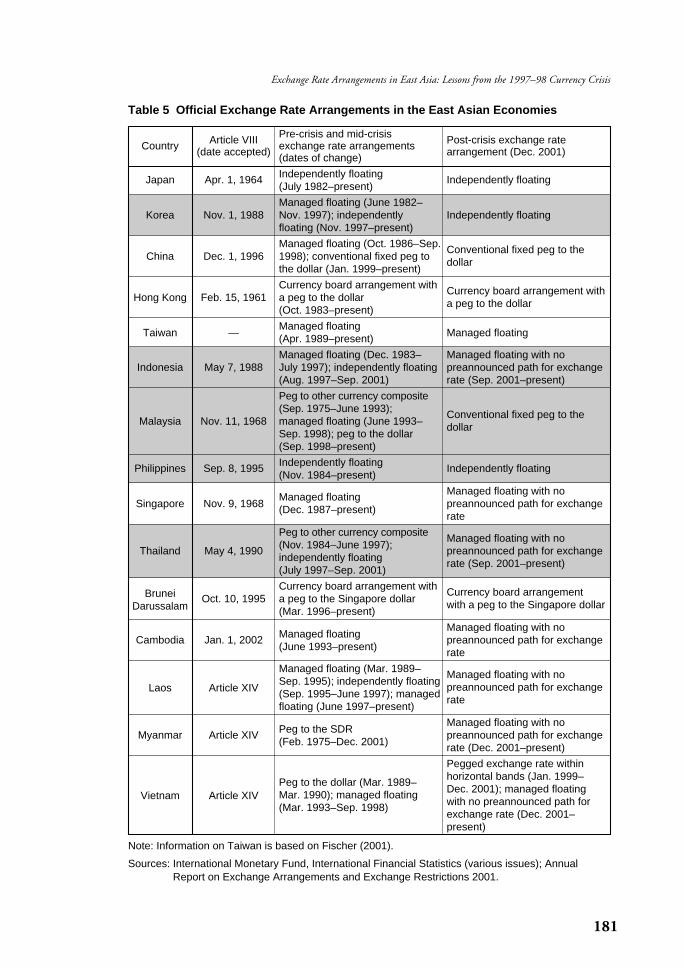
A. Changes in the Official Exchange Rate Arrangements in East AsiaTo identify the exchange rate arrangements in emerging East Asia in the pre-crisisand post-crisis periods, it is useful first to take a look at the official exchange ratearrangements as published by the IMF. Table 5 summarizes changes in exchange ratearrangements in not only the former crisis countries—Indonesia, Korea, Malaysia,the Philippines, and Thailand—but also Japan, China, Hong Kong, Taiwan, andother ASEAN countries.
Table 5 indicates several facts. First, emerging East Asia has exhibited a variety of exchange rate arrangements, ranging from a currency board system (Hong Kong)to independently floating (Philippines). In between these two polar cases, there areconventional fixed pegs to a single currency (China and post-crisis Malaysia) or a currency basket (Singapore and pre-crisis Thailand) as well as managed floating
180 MONETARY AND ECONOMIC STUDIES (SPECIAL EDITION)/DECEMBER 2002
18. See Kawai and Akiyama (2000) for such empirical evidence.
181
Exchange Rate Arrangements in East Asia: Lessons from the 1997–98 Currency Crisis
Table 5 Official Exchange Rate Arrangements in the East Asian Economies
Article VIII Pre-crisis and mid-crisis Post-crisis exchange rate Country (date accepted) exchange rate arrangements arrangement (Dec. 2001)(dates of change)
Japan Apr. 1, 1964 Independently floating Independently floating(July 1982–present)
Managed floating (June 1982–Korea Nov. 1, 1988 Nov. 1997); independently Independently floating
floating (Nov. 1997–present)
Managed floating (Oct. 1986–Sep. Conventional fixed peg to the China Dec. 1, 1996 1998); conventional fixed peg to dollar
the dollar (Jan. 1999–present)
Currency board arrangement with Currency board arrangement with Hong Kong Feb. 15, 1961 a peg to the dollar a peg to the dollar
(Oct. 1983–present)
Taiwan —Managed floating
Managed floating(Apr. 1989–present)
Managed floating (Dec. 1983– Managed floating with no Indonesia May 7, 1988 July 1997); independently floating preannounced path for exchange
(Aug. 1997–Sep. 2001) rate (Sep. 2001–present)
Peg to other currency composite (Sep. 1975–June 1993); Conventional fixed peg to the
Malaysia Nov. 11, 1968 managed floating (June 1993– dollarSep. 1998); peg to the dollar (Sep. 1998–present)
Philippines Sep. 8, 1995 Independently floating Independently floating(Nov. 1984–present)
Managed floating Managed floating with no Singapore Nov. 9, 1968 (Dec. 1987–present) preannounced path for exchange
rate
Peg to other currency composite Managed floating with no Thailand May 4, 1990 (Nov. 1984–June 1997); preannounced path for exchange
independently floating rate (Sep. 2001–present)(July 1997–Sep. 2001)
Currency board arrangement with Currency board arrangement Brunei Oct. 10, 1995 a peg to the Singapore dollar with a peg to the Singapore dollarDarussalam (Mar. 1996–present)
Managed floating Managed floating with no
Cambodia Jan. 1, 2002(June 1993–present)
preannounced path for exchange rate
Managed floating (Mar. 1989– Managed floating with no Laos Article XIV
Sep. 1995); independently floating preannounced path for exchange (Sep. 1995–June 1997); managed ratefloating (June 1997–present)
Peg to the SDR Managed floating with no
Myanmar Article XIV(Feb. 1975–Dec. 2001)
preannounced path for exchange rate (Dec. 2001–present)
Pegged exchange rate within
Peg to the dollar (Mar. 1989– horizontal bands (Jan. 1999–
Vietnam Article XIV Mar. 1990); managed floating Dec. 2001); managed floating
(Mar. 1993–Sep. 1998) with no preannounced path for exchange rate (Dec. 2001–present)
Note: Information on Taiwan is based on Fischer (2001).
Sources: International Monetary Fund, International Financial Statistics (various issues); AnnualReport on Exchange Arrangements and Exchange Restrictions 2001.
(pre-crisis Korea, Indonesia, and Singapore).19 Second, three (Korea, Indonesia, andThailand) out of the five former crisis countries saw a change in their officialexchange rate arrangements in the direction of greater exchange rate flexibility, whileMalaysia moved in the opposite direction. Hong Kong, Singapore, Taiwan, and thePhilippines have maintained identical exchange rate arrangements in the pre- andpost-crisis periods.
However, “official” exchange rate arrangements may not describe the accuratestate and evolution of the exchange rate policies in emerging East Asia, particularlythose in the former crisis countries. First, countries under managed floating (Korea,Indonesia, and Malaysia) or independently floating (the Philippines) in the pre-crisisperiod may have had a regime more akin to pegged arrangements, because otherwisethey would not have been subjected to currency speculation. Second, one may wonder whether economies, particularly former crisis countries that adopted inde-pendent floating in the post-crisis period, have really been floating their exchangerates. The “fear of floating” argument hypothesizes that despite the officially declaredarrangement, the actual practice of exchange rate management is close to managed orpegged arrangements. Indeed McKinnon (2001) and others claim that the formercrisis countries have reverted to pre-crisis, dollar-based exchange rate arrangements.
It is thus important to examine the actual behavior of the exchange rates foremerging economies in East Asia, particularly for former crisis countries, and empirically identify their pre-crisis arrangements and changes in such arrangementsin the post-crisis period by looking at the data in a more detailed way.
B. The Changing Roles of the Dollar, the Yen, and the Euro in East AsiaThe hypothesis here is that the roles of the dollar, the yen, and the euro (or its predecessor) as anchors for exchange rate stabilization have changed since the outbreak of the East Asian currency crisis. A Frankel-Wei type of regression of dailymovements in each economy’s exchange rate on the movements of the three majorinternational currencies facilitates a convenient comparison of the roles of the tripolarcurrencies across major emerging East Asian economies as well as over time.
Similarly to the previous case, the daily—rather than monthly—change in the logexchange rate of each East Asian currency is regressed on the daily changes in the logexchange rates of the dollar, the yen, and the euro—or the ECU before the introduc-tion of the euro on January 1, 1999. All exchange rates are again expressed vis-à-visthe Swiss franc. More specifically, we estimate the following regression equation:
∆e jt = α + β1∆eUSD
t + β2∆e JYt + β3∆e EURO
t + vt,
where ∆e jt is the daily change in the log exchange rate of currency j on day t , α is
a constant term, βk (k = 1, 2, . . . ) is the coefficient on the daily change in the log exchange rate of currency k, and vt is the residual term. The superscripts USD, JY, and EURO, respectively, refer to the dollar, the yen, and the euro. As in the
182 MONETARY AND ECONOMIC STUDIES (SPECIAL EDITION)/DECEMBER 2002
19. Though not indicated in the table, it is well known that Singapore has been under a currency basket-based managed floating arrangement since 1985.

previous case, the estimated coefficients are interpreted as the weights assigned by theauthorities to the corresponding currencies in their exchange rate policies. Similarly,the estimated standard error of regression residuals can be interpreted as a measure of exchange rate volatility.
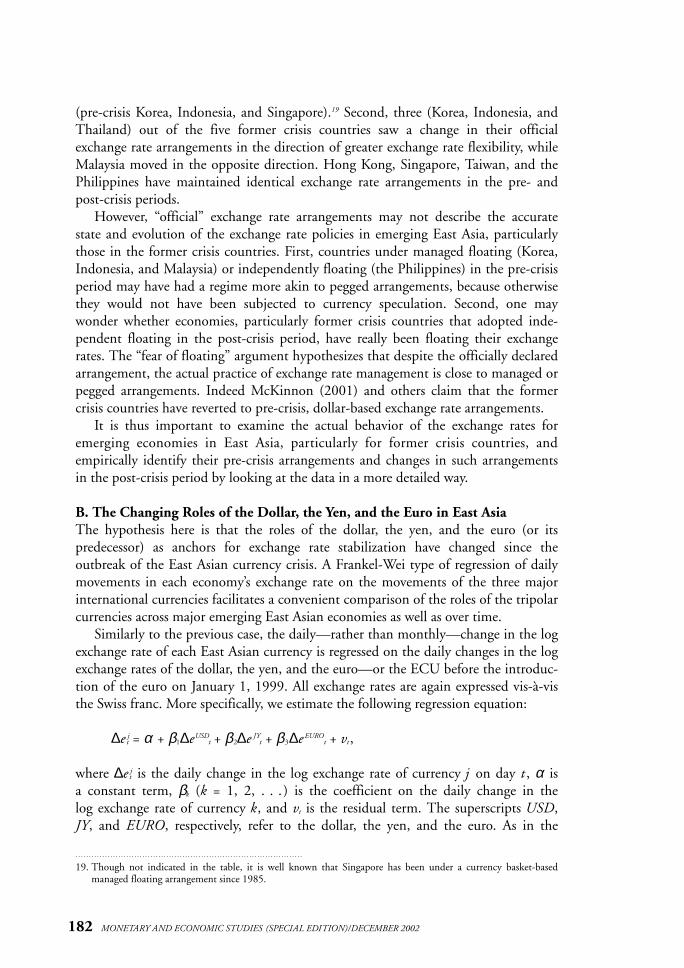
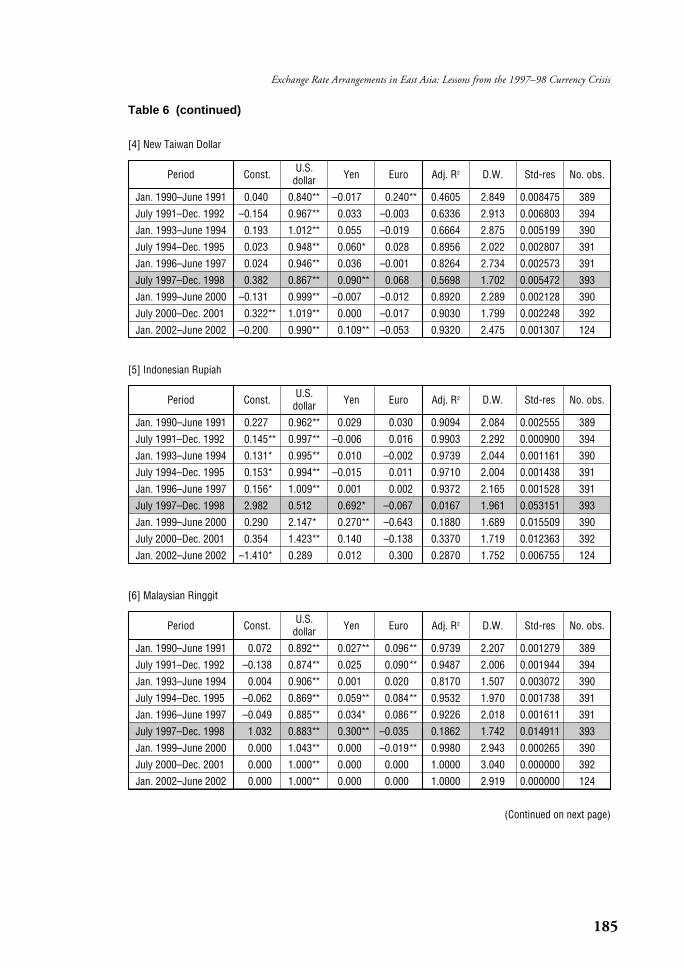
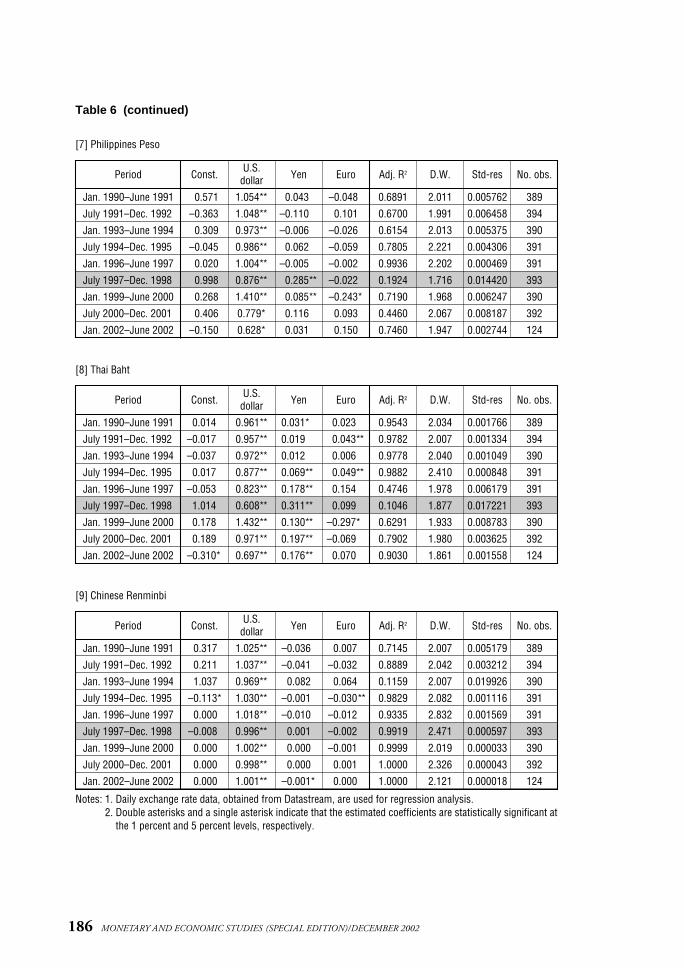
Table 6 summarizes the regression results for each emerging economy in East Asiaover the sample period January 1990 through June 2002. The sample is divided into 18-month sub-samples. The mid-crisis period (July 1997–December 1998) isindicated by the shaded areas.1. Pre-crisis periodTable 6 confirms that in the pre-crisis period (January 1990–June 1997), the estimated coefficients of the dollar were statistically significant and close to unity, theadjusted R2 was close to one, and the estimated standard error of regression was small for almost all economies—particularly Hong Kong, Korea, Indonesia, andThailand (for the first half of the 1990s). In the case of Singapore and Malaysia, thedollar coefficients were somewhat lower, though generally greater than 0.75 andhighly significant, due to their formal or informal currency basket arrangements. In the case of Taiwan, the Philippines, Thailand (for the 18 months prior to the baht crisis) and China (the first half of the 1990s), the adjusted R2 was somewhatlower and the estimated standard error of regression somewhat higher. In Thailand,speculative activity that had begun in 1996 and mounted in February and May 1997had already affected the currency movement prior to the outbreak of the baht crisis.
These results support the proposition that many emerging East Asian economieswere on de jure or de facto dollar-stabilization arrangements until the time of the crisis. Nonetheless, the estimated coefficients of the yen were also significant, forsome sub-sample periods, in Singapore, Thailand, Korea, and Malaysia, though thesize of its coefficients rarely exceeded 0.1. In this sense, the yen played a limited roleas part of a currency basket in the pre-crisis period. The euro—more accurately, itspredecessor, the ECU—also played some role in Singapore, Malaysia, and Thailanddue to the nature of their currency basket arrangements, though it was relativelyinsignificant in other countries.20
2. Mid-crisis periodNot surprisingly, many former crisis countries in East Asia experienced noticeabledeclines in dollar weights and in the adjusted R2 in the mid-crisis period (July1997–December 1998). This was particularly pronounced in Indonesia andThailand. In the case of Korea, Malaysia, and the Philippines, the estimated coefficients on the dollar did not decline noticeably, but the adjusted R2 declinedsharply and the estimated standard error of regression rose sharply.21 Even economies
183
Exchange Rate Arrangements in East Asia: Lessons from the 1997–98 Currency Crisis
20. The observed role of the yen and the euro—or the ECU—in a currency basket for some countries such as Singapore,however, may reflect the fact that the authorities chose the SDR as a target in their exchange rate management. Theyen and the European currencies—making up a major part of the ECU—were important components of the SDR.
21. The less noticeable decline in the dollar coefficient in Malaysia may be explained by the authorities’ move to fix the Malaysian ringgit to the dollar on September 2, 1998. If the mid-crisis sample period were shortened to, say, July 1997–August 1998, the decline in dollar coefficients would be more pronounced. A series of three-monthrolling regressions strongly indicates this tendency (see details in the Appendix Table of the working paper version,downloadable from http://www.imes.boj.or.jp/english/publication/edps/2002/02-E-17.pdf). The rolling regressionprocedure allows us to analyze the mid-crisis period more carefully because of regional contagion, delayed currencyattacks (Indonesia and Korea), and large exchange rate depreciations at times of political uncertainty (Indonesia).

184 MONETARY AND ECONOMIC STUDIES (SPECIAL EDITION)/DECEMBER 2002
Table 6 Regression Results of Exchange Rate Movements for Major Emerging EastAsian Economies: Pre-Crisis, Mid-Crisis, and Post-Crisis Periods (Daily Data)
[1] Hong Kong Dollar
Period Const.U.S.
Yen Euro Adj. R2 D.W. Std-res No. obs.dollar
Jan. 1990–June 1991 –0.014 0.993** –0.001 0.007 0.9973 1.566 0.000425 389
July 1991–Dec. 1992 –0.008 0.998** –0.011 0.006 0.9956 2.579 0.000597 394
Jan. 1993–June 1994 –0.004 0.995** 0.000 0.003 0.9975 2.147 0.000358 390
July 1994–Dec. 1995 0.002 0.997** 0.000 0.002 0.9994 2.018 0.000204 391
Jan. 1996–June 1997 0.004 0.997** 0.009** –0.007 0.9977 2.598 0.000277 391
July 1997–Dec. 1998 0.000 1.001** 0.006* 0.000 0.9938 2.773 0.000528 393
Jan. 1999–June 2000 0.016** 0.993** 0.001 0.003 0.9998 2.116 0.000087 390
July 2000–Dec. 2001 0.000 1.004** 0.000 –0.002 0.9999 2.054 0.000061 392
Jan. 2002–June 2002 0.002 0.998** 0.000 0.001 0.9999 2.124 0.000024 124
[2] Korean Won
Period Const.U.S.
Yen Euro Adj. R2 D.W. Std-res No. obs.dollar
Jan. 1990–June 1991 0.172 1.004** –0.013 –0.011 0.9336 1.968 0.002149 389
July 1991–Dec. 1992 0.210 1.026** –0.016 –0.006 0.8098 2.005 0.004458 394
Jan. 1993–June 1994 0.045 1.014** –0.021* –0.002 0.9720 2.255 0.001208 390
July 1994–Dec. 1995 –0.127 0.983** 0.081** –0.045* 0.9329 2.008 0.002205 391
Jan. 1996–June 1997 0.354** 0.960** 0.065** 0.020 0.8583 1.804 0.002378 391
July 1997–Dec. 1998 0.758 1.149** 0.039 0.084 0.0921 1.607 0.024301 393
Jan. 1999–June 2000 –0.172 1.044** 0.063* –0.036 0.7220 1.645 0.004023 390
July 2000–Dec. 2001 0.256 0.982** 0.284** –0.056 0.7550 2.107 0.004476 392
Jan. 2002–June 2002 –0.510* 0.654* 0.175** 0.101 0.7504 2.092 0.002783 124
[3] Singapore Dollar
Period Const.U.S.
Yen Euro Adj. R2 D.W. Std-res No. obs.dollar
Jan. 1990–June 1991 –0.212 0.739** 0.065** 0.199** 0.9167 2.309 0.002188 389
July 1991–Dec. 1992 –0.140 0.758** 0.077** 0.185** 0.9482 2.309 0.001857 394
Jan. 1993–June 1994 –0.160 0.865** 0.049** 0.098** 0.9199 2.131 0.001960 390
July 1994–Dec. 1995 –0.189 0.789** 0.098** 0.117** 0.9383 2.052 0.001915 391
Jan. 1996–June 1997 –0.019 0.798** 0.096** 0.144** 0.9294 2.167 0.001503 391
July 1997–Dec. 1998 0.381 0.635** 0.342** 0.190* 0.4851 2.181 0.006911 393
Jan. 1999–June 2000 0.103 1.219** 0.123** –0.194** 0.8505 1.925 0.002547 390
July 2000–Dec. 2001 0.035 0.948** 0.197** –0.089* 0.8975 1.942 0.002236 392
Jan. 2002–June 2002 –0.170 0.610** 0.223** 0.064 0.8731 2.019 0.000346 124
Notes: 1. Daily exchange rate data, obtained from Datastream, are used for regression analysis.2. Double asterisks and a single asterisk indicate that the estimated coefficients are statistically significant at
the 1 percent and 5 percent levels, respectively.
185
Exchange Rate Arrangements in East Asia: Lessons from the 1997–98 Currency Crisis
Table 6 (continued)
[4] New Taiwan Dollar
Period Const.U.S.
Yen Euro Adj. R2 D.W. Std-res No. obs.dollar
Jan. 1990–June 1991 0.040 0.840** –0.017 0.240** 0.4605 2.849 0.008475 389
July 1991–Dec. 1992 –0.154 0.967** 0.033 –0.003 0.6336 2.913 0.006803 394
Jan. 1993–June 1994 0.193 1.012** 0.055 –0.019 0.6664 2.875 0.005199 390
July 1994–Dec. 1995 0.023 0.948** 0.060* 0.028 0.8956 2.022 0.002807 391
Jan. 1996–June 1997 0.024 0.946** 0.036 –0.001 0.8264 2.734 0.002573 391
July 1997–Dec. 1998 0.382 0.867** 0.090** 0.068 0.5698 1.702 0.005472 393
Jan. 1999–June 2000 –0.131 0.999** –0.007 –0.012 0.8920 2.289 0.002128 390
July 2000–Dec. 2001 0.322** 1.019** 0.000 –0.017 0.9030 1.799 0.002248 392
Jan. 2002–June 2002 –0.200 0.990** 0.109** –0.053 0.9320 2.475 0.001307 124
[5] Indonesian Rupiah
Period Const.U.S.
Yen Euro Adj. R2 D.W. Std-res No. obs.dollar
Jan. 1990–June 1991 0.227 0.962** 0.029 0.030 0.9094 2.084 0.002555 389
July 1991–Dec. 1992 0.145** 0.997** –0.006 0.016 0.9903 2.292 0.000900 394
Jan. 1993–June 1994 0.131* 0.995** 0.010 –0.002 0.9739 2.044 0.001161 390
July 1994–Dec. 1995 0.153* 0.994** –0.015 0.011 0.9710 2.004 0.001438 391
Jan. 1996–June 1997 0.156* 1.009** 0.001 0.002 0.9372 2.165 0.001528 391
July 1997–Dec. 1998 2.982 0.512 0.692* –0.067 0.0167 1.961 0.053151 393
Jan. 1999–June 2000 0.290 2.147* 0.270** –0.643 0.1880 1.689 0.015509 390
July 2000–Dec. 2001 0.354 1.423** 0.140 –0.138 0.3370 1.719 0.012363 392
Jan. 2002–June 2002 –1.410* 0.289 0.012 0.300 0.2870 1.752 0.006755 124
[6] Malaysian Ringgit
Period Const.U.S.
Yen Euro Adj. R2 D.W. Std-res No. obs.dollar
Jan. 1990–June 1991 0.072 0.892** 0.027** 0.096** 0.9739 2.207 0.001279 389
July 1991–Dec. 1992 –0.138 0.874** 0.025 0.090** 0.9487 2.006 0.001944 394
Jan. 1993–June 1994 0.004 0.906** 0.001 0.020 0.8170 1.507 0.003072 390
July 1994–Dec. 1995 –0.062 0.869** 0.059** 0.084** 0.9532 1.970 0.001738 391
Jan. 1996–June 1997 –0.049 0.885** 0.034* 0.086** 0.9226 2.018 0.001611 391
July 1997–Dec. 1998 1.032 0.883** 0.300** –0.035 0.1862 1.742 0.014911 393
Jan. 1999–June 2000 0.000 1.043** 0.000 –0.019** 0.9980 2.943 0.000265 390
July 2000–Dec. 2001 0.000 1.000** 0.000 0.000 1.0000 3.040 0.000000 392
Jan. 2002–June 2002 0.000 1.000** 0.000 0.000 1.0000 2.919 0.000000 124
(Continued on next page)
186 MONETARY AND ECONOMIC STUDIES (SPECIAL EDITION)/DECEMBER 2002
Table 6 (continued)
[7] Philippines Peso
Period Const.U.S.
Yen Euro Adj. R2 D.W. Std-res No. obs.dollar
Jan. 1990–June 1991 0.571 1.054** 0.043 –0.048 0.6891 2.011 0.005762 389
July 1991–Dec. 1992 –0.363 1.048** –0.110 0.101 0.6700 1.991 0.006458 394
Jan. 1993–June 1994 0.309 0.973** –0.006 –0.026 0.6154 2.013 0.005375 390
July 1994–Dec. 1995 –0.045 0.986** 0.062 –0.059 0.7805 2.221 0.004306 391
Jan. 1996–June 1997 0.020 1.004** –0.005 –0.002 0.9936 2.202 0.000469 391
July 1997–Dec. 1998 0.998 0.876** 0.285** –0.022 0.1924 1.716 0.014420 393
Jan. 1999–June 2000 0.268 1.410** 0.085** –0.243* 0.7190 1.968 0.006247 390
July 2000–Dec. 2001 0.406 0.779* 0.116 0.093 0.4460 2.067 0.008187 392
Jan. 2002–June 2002 –0.150 0.628* 0.031 0.150 0.7460 1.947 0.002744 124
[8] Thai Baht
Period Const.U.S.
Yen Euro Adj. R2 D.W. Std-res No. obs.dollar
Jan. 1990–June 1991 0.014 0.961** 0.031* 0.023 0.9543 2.034 0.001766 389
July 1991–Dec. 1992 –0.017 0.957** 0.019 0.043** 0.9782 2.007 0.001334 394
Jan. 1993–June 1994 –0.037 0.972** 0.012 0.006 0.9778 2.040 0.001049 390
July 1994–Dec. 1995 0.017 0.877** 0.069** 0.049** 0.9882 2.410 0.000848 391
Jan. 1996–June 1997 –0.053 0.823** 0.178** 0.154 0.4746 1.978 0.006179 391
July 1997–Dec. 1998 1.014 0.608** 0.311** 0.099 0.1046 1.877 0.017221 393
Jan. 1999–June 2000 0.178 1.432** 0.130** –0.297* 0.6291 1.933 0.008783 390
July 2000–Dec. 2001 0.189 0.971** 0.197** –0.069 0.7902 1.980 0.003625 392
Jan. 2002–June 2002 –0.310* 0.697** 0.176** 0.070 0.9030 1.861 0.001558 124
[9] Chinese Renminbi
Period Const.U.S.
Yen Euro Adj. R2 D.W. Std-res No. obs.dollar
Jan. 1990–June 1991 0.317 1.025** –0.036 0.007 0.7145 2.007 0.005179 389
July 1991–Dec. 1992 0.211 1.037** –0.041 –0.032 0.8889 2.042 0.003212 394
Jan. 1993–June 1994 1.037 0.969** 0.082 0.064 0.1159 2.007 0.019926 390
July 1994–Dec. 1995 –0.113* 1.030** –0.001 –0.030** 0.9829 2.082 0.001116 391
Jan. 1996–June 1997 0.000 1.018** –0.010 –0.012 0.9335 2.832 0.001569 391
July 1997–Dec. 1998 –0.008 0.996** 0.001 –0.002 0.9919 2.471 0.000597 393
Jan. 1999–June 2000 0.000 1.002** 0.000 –0.001 0.9999 2.019 0.000033 390
July 2000–Dec. 2001 0.000 0.998** 0.000 0.001 1.0000 2.326 0.000043 392
Jan. 2002–June 2002 0.000 1.001** –0.001* 0.000 1.0000 2.121 0.000018 124
Notes: 1. Daily exchange rate data, obtained from Datastream, are used for regression analysis.2. Double asterisks and a single asterisk indicate that the estimated coefficients are statistically significant at
the 1 percent and 5 percent levels, respectively.

not directly affected by the crisis, such as Singapore and Taiwan, also saw declines inthe dollar coefficients and in the adjusted R2. In the case of Singapore, the centralrates were changed a few times to weather the currency crisis occurring in the neighboring countries. But these changes were much less pronounced than those for the former crisis country currencies. Hong Kong and China were relativelyimmune to currency speculation as far as the observed movements of spot exchangerates are concerned.22
As the dollar weights declined in the mid-crisis period, the weights of the yen rosein a significant way in some countries, particularly in Indonesia, Singapore,Thailand, and Malaysia. The size of the yen coefficients jumped upward to 0.7 inIndonesia and to 0.3 in other countries. Only in Korea and China were the yen coefficients statistically insignificant. The euro coefficients were relatively unaffectedby the crisis. Generally speaking, the importance of the yen in the currency baskets ofmany countries rose during the crisis, while the euro’s importance did not.3. Post-crisis periodThe results for the post-crisis period (January 1999–June 2002) indicate a greaterdiversity in exchange rate arrangements than in the pre-crisis period. A few countrieshave returned to the pre-crisis pattern of dollar-based exchange rate arrangement,while others have departed from the pre-crisis arrangement. At one extreme,economies under a stable dollar peg throughout the period, such as China and HongKong, have maintained dollar coefficients at levels close to unity, the adjusted R2
close to one, and an estimated standard error of regression even smaller than in the pre-crisis period. Malaysia returned to a formal dollar-peg arrangement, and theregression result indeed confirms it. Taiwan has been stabilizing the currency to the dollar in a way tighter than in the pre-crisis period, as judged from a larger size of the adjusted R2 and a smaller size of the estimated standard error of regression.
Indonesia is at the other extreme where, despite large coefficients on the dollar in some post-crisis sub-sample periods, the adjusted R2 is much lower and the estimated standard error of regression much higher than in the pre-crisis period. Inthis sense, Indonesia has been maintaining an exchange rate arrangement that is mostakin to freely floating among the emerging East Asian economies, despite the factthat Bank Indonesia has often intervened in the foreign exchange market tosmooth the rupiah/dollar exchange rate. Essentially, Indonesia has not been ableto restore exchange rate stability despite interventions, because of the country’sdifficult economic—and social and political—problems.
In between these two groups, there are countries that exhibit statistically significantdollar coefficients but with a lower value (the Philippines) or with a lower adjusted R2
187
Exchange Rate Arrangements in East Asia: Lessons from the 1997–98 Currency Crisis
22. Though the spot exchange rate data do not reveal it, the Hong Kong dollar was under serious attack in August1998. The authorities resorted to unorthodox measures to contain speculative pressures, by intervening in thestock market and purchasing HK$118 billion of domestic equities in a period of about two weeks. They inter-vened in the stock market because speculators shorted the currency and stock markets simultaneously, hoping to profit from the lower stock prices that could result from high interest rates needed to support theexchange rate under the pressure of short selling the Hong Kong dollar. This intervention was also accompaniedby a variety of regulatory measures, including increases in the cost of speculation in financial markets—tighterenforcement of rules on short selling and settlement of trades, and higher margin requirements in the futuresmarkets. Aided by an improvement in the external environment, the intervention eventually succeeded in calming the markets.
(Korea, Singapore, Thailand, and the Philippines). What is interesting for these countries is that the yen coefficients take values of 0.2–0.3 and are statistically significant, except for the Philippines, and the dollar coefficients in the most recentsub-sample periods are lower than in the pre-crisis period. For these economies, one cannot conclude that they have reverted to pre-crisis dollar-based exchange ratestabilization policies or that they have shifted to freely floating exchange rate arrange-ments. Their exchange rates are more flexible than in the pre-crisis period, but more stable than those of a typical free-floating industrial country. Korea and Thailand, inparticular, appear to have shifted to de facto managed floating with a currency basketarrangement with a relatively large weight on the dollar (on the order of 0.6–0.7) anda smaller, but significant, weight on the yen (on the order of 0.2–0.3). The observedpattern of these countries’ de facto basket arrangements is very similar to that ofSingapore, which is known to have maintained a managed float with a currency basketsystem. It remains to be seen whether this shift reflects a permanent change in thesecountries’ exchange rate policies or a temporary adjustment of their exchange rates to the recent rapid yen/dollar rate movements.23
C. Rationale for and Problems of Dollar-Based Stabilization PolicyDespite post-crisis diversity in exchange rate arrangements, the fact is that the dollarcontinues to play a dominant anchor currency role in emerging economies in EastAsia.24 The East Asian currencies with a large weight on the dollar in their currencybaskets in the pre-crisis period became overvalued on a real, effective basis due toboth higher domestic inflation than in the United States and the dollar’s appreciationsince mid-1995 vis-à-vis the major industrialized currencies, particularly the yen andthe deutschemark. The emergence of real, effective overvaluation of the currencieswas an important factor behind the mounting speculative pressure that developed inthe foreign exchange market in 1997.25 Hence, the de facto dollar-peg system was oneof the underlying triggers of the currency crisis. The issue is whether the continuedimportance of the dollar, including the post-crisis resurrection of the dollar standard(McKinnon [2001]) in some countries, is a desirable and sustainable arrangement forEast Asia. We must discuss the issues of the “peg” and the “dollar” separately.1. De facto currency stabilizationThe first question is why many emerging East Asian economies have chosen de jureor de facto currency stabilization rather than “pure floating.” First, emergingeconomies in East Asia preferred exchange rate stability, reflecting their desire to
188 MONETARY AND ECONOMIC STUDIES (SPECIAL EDITION)/DECEMBER 2002
23. Kawai and Akiyama (2000) and McKinnon (2000, 2001) have observed a reversion of the post-crisis exchangerate arrangement of emerging East Asia to an arrangement akin to the pre-crisis de facto dollar-based stabilizationpolicies. Their analyses were based on data until 1999 or early 2000. But, as shown in the text, with longer time-series data available, one can observe a variety of exchange rate arrangements in post-crisis East Asia, ranging froma dollar hard peg (Hong Kong) and a soft peg (China and Malaysia) to a managed float with currency basketarrangements (Singapore, Korea, and Thailand), and to freely floating (Indonesia).
24. The relatively high dollar weights observed in the post-crisis regressions, with the exception of Indonesia, mayindicate that the monetary authorities continue to regard the dollar as the most relevant anchor currency for their exchange rate policies despite their stated objective of free floating (with the notable exception of Malaysia),or that the market is simply driving each country’s exchange rate in parallel with the dollar. Whatever the interpretation, the dollar continues to play a dominant, reference currency role in the region.
25. This was compounded with weaknesses of the domestic financial institutions, particularly in Thailand, whichtriggered the twin crises in the domestic financial system and the external capital account.

promote trade and FDI for economic growth. Excessive exchange rate movementsunder free floating have been considered inappropriate for outward-orientedeconomies, because of the harmful impacts on trade, investment, and economicgrowth. Small, open, and highly trade-dependent economies, like those in East Asia,benefit from exchange rate stability through creating predictable environments for trade- and FDI-driven economic development and growth, and avoiding regional beggar-thy-neighbor policies of competitive depreciation. McKinnon (2000)claims that exchange rate stability was an important factor behind the remarkableeconomic performance during the “East Asian miracle” period of the mid-1960sthrough the mid-1990s.
Second, the emerging economies in East Asia needed to establish a nominal anchordue to the lack of credible monetary policy, to rely on foreign currency for externalfinancing due to the so-called “original-sin” hypothesis (Eichengreen and Hausmann[1999] and Hausmann [2001]), or simply to overcome their “fear of floating” (Calvoand Reinhart [2002]). “Original sin” is a situation where emerging economy residentscannot borrow abroad in domestic currency nor borrow long term, even domestically.Hence domestic banks and corporations tend to face a currency mismatch or a maturity mismatch or both, thus creating balance-sheet vulnerabilities to sharpexchange rate changes. Given that hedging instruments—currency futures andoptions—are not fully available in these markets due to the lack of well-functioningdomestic bond markets (McKinnon and Schnabl [2002]), the government tends tostabilize exchange rates to mitigate the potential foreign exchange risk.26
2. De facto dollar-based stabilizationRapid economic development and growth in the emerging East Asian economies in the10 years prior to the outbreak of the crisis had been stimulated by their stabilization tothe dollar. In the face of steep yen rate appreciation that began in the mid-1980s, thede facto dollar-pegged system allowed these economies to receive FDI from Japan and to integrate themselves into the regional and global trading system. As Japan had already been gradually losing its international price-competitiveness in low- tomid-tech manufacturing products, yen rate appreciation accelerated this process byforcing Japanese multinational corporations to move their production facilities to emerging East Asia. From the latter’s perspectives, their exchange rate depreciationvis-à-vis the yen helped transform them into attractive production bases and platforms,for Japanese multinationals, to export products to the U.S. and European markets. Thisprocess promoted international division of labor in the manufacturing sector within theregion and helped these economies industrialize and grow, at least until early 1995,when the yen rate started to depreciate rapidly.
Thus, there is no doubt that the emerging East Asian economies enjoyed largebenefits, for a long time until the mid-1990s, by choosing the dollar as an anchor for exchange rate stabilization. But it is hard to argue that these economies adopted ade facto dollar peg, expecting such developmental benefits arising from the yen’s
189
Exchange Rate Arrangements in East Asia: Lessons from the 1997–98 Currency Crisis
26. In economies like the United States, Japan, or Western Europe, free floating is less harmful, because the financialmarkets are deeper and economic systems are more resilient. But emerging market economies with shallow financial and currency markets have limited ability to absorb large exchange rate fluctuations. For these reasons,the authorities in the emerging market economies have preferred some degree of exchange rate stability.

appreciation. So the next question is why the East Asian economies have chosen the dollar as an anchor currency for exchange rate stabilization. Several reasons can be given.
First, the dollar has been chosen because it has been used extensively as an invoicing currency for international trade and as a vehicle currency for foreignexchange transactions in East Asia and in other parts of the world.27 For each EastAsian economy, stabilizing the value of its trade and transactions in terms of the dollarwas a reasonable policy given that its neighbors and many other countries in the worldwillingly used the dollar for trade invoicing and foreign exchange market transactions.
Second, because the bond and forward exchange markets have not been developedadequately in emerging East Asia, governments have been induced to provide aninformal hedge by stabilizing the exchange rate against the dollar. Considering therisk of exchange rate fluctuations, the reliance on the dollar made sense, because forward transactions were more active—though still limited—in the dollar marketsthan in markets for other currencies.
Third, a dollar-based system was an arrangement that implicitly guaranteed intra-regional exchange rate stability for the East Asian economies. Several authors havenoted that thede facto dollar-based system has helped promote intra-regional exchangerate stability, an important policy objective for a highly interdependent region such asEast Asia (Bayoumi et al. [2000] and McKinnon [2000]). The arrangement essentiallyprevented, at least until the 1997–98 crisis, harmful beggar-thy-neighbor exchange ratecompetition, thereby ensuring environments conducive to outward-oriented economicgrowth for the region as a whole.3. Problems of dollar-based stabilizationEven though some degree of exchange rate stability is desirable for the emerging EastAsian economies, there are several problems associated with choosing the dollar as thesole nominal anchor currency in these economies.
First, using the dollar as the sole anchor is problematic given that the emergingEast Asian economies have diverse economic relationships with the United States,Japan, and the EU through trade (exports and imports), FDI inflows, and otherforms of capital flows. For emerging East Asia, the United States is no longer themost dominant economic partner and the relative importance of Japan and the EU isas large as, and in some cases much larger than, that of the United States. The UnitedStates accounts for 18 percent, while Japan and the EU respectively account for 17 percent and 14 percent, of emerging East Asia’s trade (Table 7). Japan and theUnited States are comparable partners as an FDI source country (Table 8).
Second, against the benefit of intra-regional exchange rate stability guaranteed bythe informal dollar-based arrangements, there is a cost in terms of excessive movementsin effective exchange rates induced by yen/dollar rate fluctuations. When the yen beganto depreciate vis-à-vis the dollar in the spring of 1995, emerging East Asian economiessaw their international price-competitiveness deteriorate. Growth driven by JapaneseFDI inflows began to lose its momentum. In addition, yen depreciation dampened real
190 MONETARY AND ECONOMIC STUDIES (SPECIAL EDITION)/DECEMBER 2002
27. Commodities and primary products exported by many developing countries tend to be priced in the dollar in the global markets.
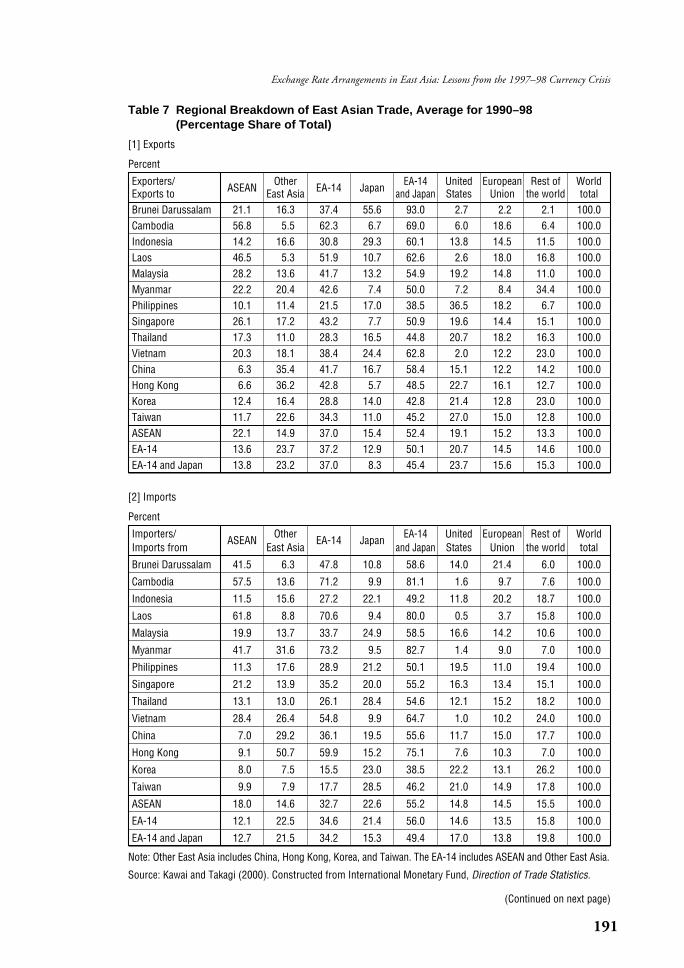
191
Exchange Rate Arrangements in East Asia: Lessons from the 1997–98 Currency Crisis
Table 7 Regional Breakdown of East Asian Trade, Average for 1990–98 (Percentage Share of Total)
[1] Exports
Percent
Exporters/ASEAN
Other EA-14 Japan
EA-14 United European Rest of WorldExports to East Asia and Japan States Union the world totalBrunei Darussalam 21.1 16.3 37.4 55.6 93.0 2.7 2.2 2.1 100.0Cambodia 56.8 5.5 62.3 6.7 69.0 6.0 18.6 6.4 100.0Indonesia 14.2 16.6 30.8 29.3 60.1 13.8 14.5 11.5 100.0Laos 46.5 5.3 51.9 10.7 62.6 2.6 18.0 16.8 100.0Malaysia 28.2 13.6 41.7 13.2 54.9 19.2 14.8 11.0 100.0Myanmar 22.2 20.4 42.6 7.4 50.0 7.2 8.4 34.4 100.0Philippines 10.1 11.4 21.5 17.0 38.5 36.5 18.2 6.7 100.0Singapore 26.1 17.2 43.2 7.7 50.9 19.6 14.4 15.1 100.0Thailand 17.3 11.0 28.3 16.5 44.8 20.7 18.2 16.3 100.0Vietnam 20.3 18.1 38.4 24.4 62.8 2.0 12.2 23.0 100.0China 6.3 35.4 41.7 16.7 58.4 15.1 12.2 14.2 100.0Hong Kong 6.6 36.2 42.8 5.7 48.5 22.7 16.1 12.7 100.0Korea 12.4 16.4 28.8 14.0 42.8 21.4 12.8 23.0 100.0Taiwan 11.7 22.6 34.3 11.0 45.2 27.0 15.0 12.8 100.0ASEAN 22.1 14.9 37.0 15.4 52.4 19.1 15.2 13.3 100.0EA-14 13.6 23.7 37.2 12.9 50.1 20.7 14.5 14.6 100.0EA-14 and Japan 13.8 23.2 37.0 8.3 45.4 23.7 15.6 15.3 100.0
[2] Imports
Percent
Importers/ASEAN
OtherEA-14 Japan
EA-14 United European Rest of WorldImports from East Asia and Japan States Union the world total
Brunei Darussalam 41.5 6.3 47.8 10.8 58.6 14.0 21.4 6.0 100.0
Cambodia 57.5 13.6 71.2 9.9 81.1 1.6 9.7 7.6 100.0
Indonesia 11.5 15.6 27.2 22.1 49.2 11.8 20.2 18.7 100.0
Laos 61.8 8.8 70.6 9.4 80.0 0.5 3.7 15.8 100.0
Malaysia 19.9 13.7 33.7 24.9 58.5 16.6 14.2 10.6 100.0
Myanmar 41.7 31.6 73.2 9.5 82.7 1.4 9.0 7.0 100.0
Philippines 11.3 17.6 28.9 21.2 50.1 19.5 11.0 19.4 100.0
Singapore 21.2 13.9 35.2 20.0 55.2 16.3 13.4 15.1 100.0
Thailand 13.1 13.0 26.1 28.4 54.6 12.1 15.2 18.2 100.0
Vietnam 28.4 26.4 54.8 9.9 64.7 1.0 10.2 24.0 100.0
China 7.0 29.2 36.1 19.5 55.6 11.7 15.0 17.7 100.0
Hong Kong 9.1 50.7 59.9 15.2 75.1 7.6 10.3 7.0 100.0
Korea 8.0 7.5 15.5 23.0 38.5 22.2 13.1 26.2 100.0
Taiwan 9.9 7.9 17.7 28.5 46.2 21.0 14.9 17.8 100.0
ASEAN 18.0 14.6 32.7 22.6 55.2 14.8 14.5 15.5 100.0
EA-14 12.1 22.5 34.6 21.4 56.0 14.6 13.5 15.8 100.0
EA-14 and Japan 12.7 21.5 34.2 15.3 49.4 17.0 13.8 19.8 100.0
Note: Other East Asia includes China, Hong Kong, Korea, and Taiwan. The EA-14 includes ASEAN and Other East Asia.
Source: Kawai and Takagi (2000). Constructed from International Monetary Fund, Direction of Trade Statistics.
(Continued on next page)

192 MONETARY AND ECONOMIC STUDIES (SPECIAL EDITION)/DECEMBER 2002
[3] Total Trade (Exports Plus Imports)
Percent
Trading economies/ASEAN
OtherEA-14 Japan
EA-14 United European Rest of WorldTrade with East Asia and Japan States Union the world total
Brunei Darussalam 30.2 11.8 42.0 36.4 78.4 7.3 10.4 3.9 100.0
Cambodia 58.8 10.6 69.4 9.0 78.4 3.5 11.6 6.5 100.0
Indonesia 12.9 16.2 29.1 26.0 55.1 13.0 17.1 14.8 100.0
Laos 55.3 7.6 62.9 11.1 74.0 1.2 8.5 16.3 100.0
Malaysia 24.0 13.6 37.7 19.0 56.6 17.9 14.6 10.8 100.0
Myanmar 34.8 27.8 62.6 8.7 71.3 3.3 8.7 16.6 100.0
Philippines 10.8 15.1 25.9 19.5 45.4 26.3 13.9 14.3 100.0
Singapore 23.5 15.5 39.1 14.1 53.1 17.9 13.9 15.1 100.0
Thailand 15.1 12.1 27.2 23.0 50.2 16.0 16.6 17.3 100.0
Vietnam 24.8 23.0 47.8 16.3 64.1 1.4 11.0 23.5 100.0
China 6.6 32.4 39.0 18.1 57.1 13.5 13.5 15.9 100.0
Hong Kong 7.9 43.7 51.6 10.6 62.1 15.0 13.1 9.8 100.0
Korea 10.1 11.9 22.0 18.6 40.6 21.7 13.0 24.6 100.0
Taiwan 10.8 15.6 26.5 19.2 45.7 24.2 15.0 15.1 100.0
ASEAN 19.9 14.7 34.7 19.1 53.8 16.9 14.8 14.5 100.0
EA-14 12.8 23.1 35.9 17.2 53.0 17.7 14.1 15.2 100.0
EA-14 and Japan 13.3 22.4 35.6 11.7 47.3 20.5 14.8 17.5 100.0
Note: Other East Asia includes China, Hong Kong, Korea, and Taiwan. The EA-14 includes ASEAN and Other East Asia.
Source: Kawai and Takagi (2000). Constructed from International Monetary Fund, Direction of Trade Statistics.
Table 8 FDI Inflows to East Asia, 1990–98
US$ millions, percentage of total
RecipientsASEAN1 China Korea Taiwan TotalInvestors
Japan57,693 29,715 2,769 4,935 95,112(19.2) (5.5) (10.5) (22.7) (10.7)
United States35,082 42,658 9,331 3,885 90,956(11.7) (7.9) (35.3) (17.8) (10.3)
Europe240,375 27,311 8,935 2,484 79,105(13.4) (5.1) (33.8) (11.4) (8.9)
ASEAN27,493 33,421 3,271 1,108 65,293
(9.1) (6.2) (12.4) (5.1) (7.4)
Other East Asia346,731 336,132 551 1,571 384,985(15.5) (62.4) (2.1) (7.2) (43.4)
Total, including 301,074 538,477 26,422 21,778 887,751others (100.0) (100.0) (100.0) (100.0) (100.0)
Notes: 1. 1991–98 for Brunei and Vietnam, 1992–98 for the Philippines, and 1994–98 for Cambodia.Notes: 2. These figures underestimate the actual volumes, because some countries with small
volumes are not included.Notes: 3. Hong Kong, Korea, and Taiwan only.
Source: Kawai and Takagi (2000). Constructed from ASEAN Secretariat, ASEAN Investment Report1999: Trends and Developments in Foreign Direct Investment, Jakarta, 1999; Japan ExternalTrade Organization.
Table 7 (continued)
economic activity in relatively advanced emerging East Asian economies (such as Korea,Taiwan, and Malaysia) that competed against Japan in third markets in the UnitedStates and Europe. If the yen had continued to experience the “ever higher yen syn-drome” (McKinnon and Ohno [1997]), then exchange rate stabilization vis-à-vis thedollar would have been attractive to emerging East Asia. Once the yen/dollar exchangerate became volatile, however, dollar-based exchange rate regimes began to producewide fluctuations of economic activity, severely limiting its benefits. The reason for theclose association between yen/dollar exchange rate movements and the real economicactivity of some emerging East Asian economies (Kwan [2001]) is that they not onlytrade with Japan, but also compete with Japan in third markets in certain products.
The diverse economic linkages of emerging East Asia with the rest of the world suggest that exchange rate stabilization vis-à-vis the dollar alone is not the bestpolicy. Rate stabilization vis-à-vis a well-balanced currency basket comprising the dollar, the yen, and the euro is a more reasonable option. The reason is that exchangerate stabilization against a currency of one major trading partner means the lack of exchange rate stability against currencies of other major trading partners as long as the exchange rates of these major countries fluctuate in a volatile way. A currency basket arrangement ensures relative stability of a country’s effective exchangerates vis-à-vis major trading partners.28 This approach offers a better buffer to aneconomy’s exposure to yen/dollar and dollar/euro exchange rate volatility.29
IV. Future of East Asian Exchange Rate Arrangements
A. Options for Possible ArrangementsWhile the popular “two-corner solution” view gives exclusive attention to the objec-tive of crisis prevention, emerging market economies can pursue other legitimateobjectives such as growth, trade, and investment promotion through their use ofexchange rate policy.30 A desirable option for many emerging market economies,including those in East Asia, would be neither a pure float because of the potentialfor excessive volatility and misalignment and the pervasive “fear of floating,” nor ahard peg except in a very small open economy like Hong Kong.
In view of the impossibility of any country achieving a trinity of simultaneousexchange rate stability, monetary policy autonomy, and free mobility of capital, theauthorities must make a desirable trade-off. Given the open capital account in mostof emerging East Asia (except in China), a desirable trade-off would be to ensure acertain degree of monetary policy autonomy and a certain degree of exchange rate
193
Exchange Rate Arrangements in East Asia: Lessons from the 1997–98 Currency Crisis
28. As discussed in Kawai and Akiyama (2000), an economy that has diversified trade and FDI relationships with themajor currency areas has strong potential for choosing a well-balanced currency basket.
29. A basket system would have preserved more stable effective exchange rates at the time when the dollar began toappreciate in the spring of 1995, without resulting in a loss of international price-competitiveness or an overvaluation of currencies in emerging East Asia.
30. Adoption of the “two-corner solution” approach (Eichengreen [1994], Obstfeld and Rogoff [1995], and Fischer[2001]) would be unrealistic, with a few exceptions for truly small, open economies—e.g., Hong Kong andBrunei in the case of East Asia. As has been claimed by Frankel (1999), no single-currency regime is suitable forall countries at all times.

stability. In China, where capital account transactions are still limited, the authoritiescan pursue both stable exchange rates and relatively autonomous monetary policy.
Numerous proposals have been made on the choice of exchange rate arrangementsfor East Asia, including the dollar standard (McKinnon [2001], McKinnon andSchnabl [2002], and Mundell [2001]), a G-3 currency basket system (Williamson[1999a, b, 2000, 2001], Kawai and Akiyama [2000], Kawai and Takagi [2000],Ogawa and Ito [2000], French and Japanese Staff, Ministries of Finance [2001], andIto [2001]), and regional monetary union (Wyplosz [2001]).
A proposal for the dollar standard emphasizes the advantage for the emerging EastAsian economies to use the existing, most dominant international currency in theregion, i.e., the dollar, while minimizing the yen/dollar exchange rate fluctuations.The dollar standard is a formalization of the long-standing de facto arrangement, is simple and transparent, and involves no additional cost in ensuring both inter-regional and intra-regional exchange rate stability. However, the dollar standardwould result in undesirable fluctuations in effective exchange rates as long as yen/dollar exchange rate fluctuations continue.
The G-3 currency basket system proposal claims that linking the central rate of acountry’s national currency to a basket of major G-3 currencies, i.e., the dollar, theyen, and the euro, rather than the dollar alone, is more desirable. The tightness of the link and the currency weights may initially be left to each country’s choice, withthe possibility for closer coordination as the authorities increasingly realize theimportance of intra-regional exchange rate stability. The virtue of this system is thatit would prevent excessive fluctuations in effective exchange rates in the face ofvolatile yen/dollar or euro/dollar rate movements, while allowing their currency someflexibility to move within a certain range.
Opponents of a G-3 currency basket system claim that it treats the yen asym-metrically relative to other East Asian currencies, thus providing the Bank of Japanwith the ability to pursue an independent monetary policy, without paying formalattention to the need for a stable value of the yen. To the extent that this special position of Japan may jeopardize the goal of intra-regional exchange rate stability,Japan may also be encouraged to stabilize the external value of the yen.
In the spirit of regional cooperation, a more symmetric approach may be taken,e.g., an Asian Monetary System (patterned after the European Monetary System[EMS]) or even East Asia’s own Economic and Monetary Union in the more distantfuture. Advocates of regional monetary union would claim that in the long run, oneof the corner solutions of the “two-corner solution” approach—that is, introducing acommon currency through coordinated regional integration—may be feasible andeven desirable from optimal currency area criteria.31
Such an approach makes sense, but only in the long run. The region may eventually develop a common currency arrangement, like the euro in Europe.
194 MONETARY AND ECONOMIC STUDIES (SPECIAL EDITION)/DECEMBER 2002
31. For example, Bayoumi and Eichengreen (1994) found that Northeast Asia (Japan, Korea, and Taiwan) andSoutheast Asia (Hong Kong, Indonesia, Malaysia, Singapore, and perhaps Thailand), in addition to NorthernEurope (but not the entirety of Western Europe), were respectively plausible candidates for monetary union.Bayoumi et al. (2000) concluded that in terms of preparedness for monetary union, Asia in 1995 was not muchdifferent from Continental Europe in 1987. But the lack of political commitment and institutional capacitywould make such a move difficult in the short to medium term.
A common currency arrangement, however, cannot be expected to emerge in the near future, because of the absence of political commitment within the region, of formal region-wide trade arrangements, and of convergence in macroeconomicand structural underpinnings. A common currency would require a substantiallycloser coordination of economic policies and a much greater and sufficiently sustained buildup of institutional infrastructure.
B. A Currency Basket System for Emerging East AsiaThough formation of regional monetary union may be desirable in the long run, amore realistic approach for emerging East Asia would be to shift to a currency basketsystem now, thereby absorbing the impact of yen/dollar volatility on their economies,and then to start institution building, strive for deeper economic interdependence,and achieve the convergence needed for future monetary integration.
Under a currency basket arrangement, a reasonable choice of anchor for exchangerate stabilization is a currency basket that includes the dollar, the yen, and the euro in a more balanced way than in the pre-crisis period. Actual currency weights in the basket will depend on the relative importance of the United States, Japan, and the EUas trade partners and FDI sources for each East Asian economy, future expectations of trend movements of the yen/dollar exchange rate, and the success of the newly introduced euro. The extent of exchange rate stability also depends on each economy’sspecific conditions and preferences.1. Intra-regional exchange rate stabilityThe East Asian region has long enjoyed a market-driven integration process throughinternational trade and FDI within the frameworks of the General Agreement onTariffs and Trade (GATT)/World Trade Organization (WTO) and the Asia-PacificEconomic Cooperation (APEC). The rising intra-regional interdependence throughtrade and investment suggests that economies in the region can benefit from avoidinglarge fluctuations in intra-regional exchange rates. This is particularly the case for themembers of the Association of Southeast Asian Nations (ASEAN), which began toimplement the ASEAN Free Trade Agreement (AFTA) in January 2002 by loweringtariffs on manufactured products below 5 percent.
Essentially, large swings in exchange rates among closely interdependenteconomies would be counterproductive, because they would alter internationalprice-competitiveness suddenly and make the prospective free trade agreementunsustainable. One way to maintain stable currencies within East Asia is to adoptsimilar currency baskets consisting of the dollar, the yen, and the euro and to looselystabilize their exchange rates to such baskets. This does not require formal agree-ments on common baskets or frequent, concerted joint actions in the foreignexchange markets. Instead, the members have only to choose similar baskets. As thedegree of intra-regional integration becomes deeper, however, more concerted actionsin the area of exchange rate, monetary, and fiscal policies may be called for. And the choice of a “common” currency basket on a formal basis, or even adoption of acommon currency unit, may become desirable.32
195
Exchange Rate Arrangements in East Asia: Lessons from the 1997–98 Currency Crisis
32. See Williamson (1999a, b, 2000).

2. Consistency with inflation targetingMonetary authorities in general cannot pursue simultaneously both nominalexchange rate and inflation targets, when the capital account is open. However, ifinflation targeting is defined as a policy of achieving a weighted average of inflationrates of the United States, Japan, and the EU and if nominal exchange rate targetingis defined as a policy of stabilizing the nominal exchange rate vis-à-vis a basket of thedollar, the yen, and the euro, then these two policies are in fact one and the same aslong as the same weights are chosen for inflation and exchange rate targeting, at leastin the long run when purchasing power parity (PPP) tends to hold.33
Nominal exchange rate targeting has one added advantage over inflation targetingcum free floating: by removing the problems associated with a floating rate regime—short-run volatility and medium-run misalignment of exchange rates—a policy ofnominal exchange rate targeting (with some bands) can better ensure exchange rate stability in a manner consistent with inflation targeting (with some bands). Thisis particularly the case for East Asia, where the economies are small and relativelyopen, so that domestic price inflation tends to reflect international price movements. In essence, a loose peg to a basket of the tripolar currencies can ensure stabilization of intra-regional exchange rates, while maintaining a targeted range of inflation rates.3. A coordinated move to a currency basket systemEven when a currency basket system is desirable, it is not easy for any single emergingEast Asian economy to move away unilaterally from the existing dollar-basedarrangement to a new arrangement in which the relative weight of the dollar issmaller and those of the yen and euro larger.34 The reason is that when neighboringcountries stabilize their exchange rates primarily against the dollar, each economymay not have sufficient incentive to unilaterally alter its own exchange rate policy.Essentially, the situation is one of a less desirable equilibrium due to a coordinationfailure.35 This demonstrates the potential importance of collective action on the partof emerging East Asia. A coordinated simultaneous move to a currency basket systemwill result in a more desirable equilibrium situation (Ogawa and Ito [2000]).
At least initially, exchange rate policy coordination would simply require emergingeconomies in the region to adopt a similar currency basket as an anchor. The operation of the regional currency basket arrangement requires less formality andgreater flexibility than the EMS of 1979–98 did in Europe, because the proposedcurrency basket arrangement including currencies that are external to the region—incontrast to internal currencies in the case of Europe’s ECU—does not immediatelydemand a formal structure of monetary policy and exchange rate coordination. Thisconsideration is important, given the current lack of a commitment to full-fledgedregional financial cooperation in East Asia, the diversity in the level of economic and financial developments across countries, the dynamic nature of East Asian
196 MONETARY AND ECONOMIC STUDIES (SPECIAL EDITION)/DECEMBER 2002
33. See Kawai and Takagi (2000).34. Honohan and Lane (1999) emphasized the existence of strategic interdependence in the choice of exchange rate
regimes for neighboring countries that compete for exports in third markets and for FDI inflows.35. Williamson (1999a) has characterized this informal dollar-based arrangement as a classic collective action
problem, whereby each country is compelled to stay close to the dollar because of fears that appreciation vis-à-visthe dollar would weaken its competitiveness against its regional competitors.

economies with rapid structural changes, and possibly differing inflationary tendencies. Economies with different rates of inflation and productivity growth can(and are expected to) adjust the central rates with respect to the basket differentlyover the medium term. In the absence of sufficient convergence, adjustment for inflation and productivity growth differentials may be just as important as the choiceof the basket itself.
On a deeper level, as the region becomes more integrated and hence more prepared, in terms of both economic criteria and political climate, for a more permanent commitment to economic and monetary union, greater efforts should be made to build institutions capable of supporting such a commitment. Giventhe possible endogeneity of the optimum currency area criteria (Frankel and Rose[1998]), the process can be self-promoting.
C. Regional Financial CooperationGiven deepening interdependence of the East Asian economies through trade andinvestment, intra-regional exchange rate stability, possibly supported by a regional currency basket arrangement, calls for a stronger form of financial cooperationamong the authorities in the region. One country’s exchange rate adjustment canhave serious, competitive implications for its neighboring countries—hence a needfor cooperative behavior. Another good reason for regional cooperation is the factthat crisis contagion tends to be concentrated within a region, as evidenced duringthe 1997–98 crisis.
Initiatives to strengthen regional financial cooperation in East Asia can be brokendown into two broad categories: financing arrangements and policy dialogue.36
1. Financing arrangementsThe experience of the 1997–98 crisis has convinced many economies in East Asia that the role of the IMF as an international lender of last resort is limited and that aregional financing facility can play a useful, complementary role for crisis preventionand management, through timely and adequate provision of international liquidity in the face of currency attack, contagion, and crisis.
Inspired by the successful financial support package for Thailand in August 1997,Japan, with support from Korea and the ASEAN countries that participated in theThai package, proposed to establish an Asian Monetary Fund (AMF) to supplementIMF resources for crisis prevention, management, and resolution. However, theUnited States and the IMF opposed this proposition on the grounds of moral hazardand duplication. They argued that an East Asian country hit by a currency crisismight bypass the tough conditionality of the IMF and receive easy money from the AMF, thereby creating potential for moral hazard, and that an AMF would beredundant in the presence of an effective global crisis manager, the IMF.
Although an AMF was not created, the East Asian economies agreed on the ChiangMai Initiative (CMI) in May 2001. The CMI has two components: strengthening thelong-standing ASEAN Swap Arrangement by extending its membership to all ASEANmembers and increasing the size of swap arrangements; and creating a new network of
197
Exchange Rate Arrangements in East Asia: Lessons from the 1997–98 Currency Crisis
36. See Kuroda and Kawai (2002).

bilateral swap and repurchase arrangements for the ASEAN+3 members, includingChina, Japan, and Korea. The initiative is currently in progress; several bilateral swapagreements have been concluded and several negotiations are underway (Table 9).
The basic framework and main principles of bilateral swap arrangements (BSAs)under the CMI include linkages to the IMF, maturity, and interest. For example,countries can borrow liquidity collateralized by domestic currencies with governmentguarantees, rather than offering U.S. Treasury bonds as collateral. Members request-ing liquidity support can immediately obtain short-term financial assistance for thefirst 10 percent of the BSA facility without IMF programs, while the remaining 90 percent is provided to the requesting member under an IMF program or an activated contingent credit line. The linkage to IMF conditionality is designed toaddress the concern that the problems leading to balance of payments difficulties maybe fundamental in nature and that the potential moral hazard problem could be non-negligible.37 These main principles, including the issue of IMF linkages, will be reviewed in May 2004.
198 MONETARY AND ECONOMIC STUDIES (SPECIAL EDITION)/DECEMBER 2002
Table 9 Progress on the Chiang Mai Initiative (As of June 2002)
Bilateral swap arrangement Currencies Conclusion date Size
Japan–Korea Dollar/won July 4, 2001 US$7 billion†
Japan–Thailand Dollar/baht July 30, 2001 US$3 billion
Japan–Philippines Dollar/peso Aug. 27, 2001 US$3 billion
Japan–Malaysia Dollar/ringgit Oct. 5, 2001 US$3.5 billion†
China–Thailand Dollar/baht Dec. 6, 2001 US$2 billion
Japan–China Yen/renminbi Mar. 28, 2002 US$3 billion equivalent
China–Korea Renminbi/won June 24, 2002 US$2 billion equivalent
Korea–ThailandDollar/won or
June 25, 2002 US$1 billionDollar/baht
Korea–Malaysia Under negotiation
Korea–Philippines Under negotiation
Japan–Singapore Under negotiation
Japan–Indonesia Under negotiation
China–Philippines Under negotiation
China–Malaysia To be negotiated in the near future
Note: The daggers indicate that the dollar amounts include the amounts committed under the NewMiyazawa Initiative, US$5 billion for Korea, and US$2.5 billion for Malaysia.
Source: Kuroda and Kawai (2002).
37. The swap is for a period of 90 days, renewable up to seven times, at an interest rate equivalent to the Londoninterbank offered rate (LIBOR) plus 150 basis points for the first drawing and first renewal. Thereafter, the premium rises by 50 basis points every two renewals, subject to a maximum of 300 basis points.
2. Policy dialogue processesRegional policy dialogue processes are instrumental to the effective functioning ofregional financing arrangements. Several forums have been developed for regional policydialogue and economic surveillance. Three major initiatives include the ASEAN+3Framework, the Manila Framework, and the Executive’s Meeting of East Asia-PacificCentral Banks (EMEAP). In addition to these, there are other forums, including thosefor trans-regional policy dialogue under APEC and the Asia-Europe Meeting (ASEM).

The common objective of these processes is to strengthen policymaking capacitythrough information exchanges, peer reviews, and recommendations for action at theregional and national levels. For this purpose, each group monitors global economicconditions, regional economic developments, capital flows, exchange rates, financial-sector conditions, and macroeconomic structural and social policies. Monitoring andanalysis of the regional macroeconomic and structural conditions are indispensableboth for crisis prevention, because of the need to implement corrective policies, andfor crisis financing, because of the need to identify causes of a crisis and formulateappropriate policy responses.
The ASEAN+3 Economic Review and Policy Dialogue (ERPD) process is the mostimportant among these, particularly given the introduction of the CMI. Its purpose isto strengthen policy dialogue, coordination, and collaboration on the financial andmacroeconomic issues of common interest, focusing initially on issues related tomacroeconomic risk management, monitoring of regional capital flows, strengtheningof the banking and financial systems, better corporate governance, reform of theinternational financial architecture, and enhancing self-help and support mechanismsin East Asia. Steps have been taken for cooperation in monitoring short-term capitalflows and developing a regional early warning system to assess regional financial vulnerabilities, with a view to preventing financial crises in the future.
D. Internationalization of the YenFor the successful functioning of a currency basket system, and more broadly forregional financial stability, the role of the yen must be increased. For greater inter-national use of the yen, sufficient incentives must be provided to the private sector inusing the yen for international trade, investment, finance, and foreign exchangetransactions. A greater role of the yen can in turn induce regional central banks toadopt a currency basket system.
Ideally, the yen would improve its international status and play a regional key currency role in a tripolar international monetary system. In reality, as has been discussed in Section II, the international role of the yen has been quite limited. The dollar continues to play a dominant role as the key global currency, reflectingnot only the robust economic performance of the U.S. economy in the 1990s but also the dollar’s historical role and inertia. The euro is emerging as the No. 2international currency.
The dollar accounts for close to 50 percent of international bonds issued, morethan 40 percent of commercial banks’ external assets, almost 90 percent of foreignexchange transactions in the global market, and 66 percent of foreign exchangereserves held. The euro accounts for about 30 percent of international bonds issued,27 percent of commercial banks’ external assets, almost 40 percent of foreignexchange transactions, and only 12 percent of foreign exchange reserves. In contrast,the yen accounts for less than 10 percent of international bonds issued and commer-cial banks’ external assets, 23 percent of foreign exchange transactions, and 5 percentof foreign exchange reserves. While the yen’s invoicing share of Japanese trade withAsia has risen in the second half of the 1990s, the international status of the yen isstill too low to allow a tripolar monetary system to emerge.
199
Exchange Rate Arrangements in East Asia: Lessons from the 1997–98 Currency Crisis

Several steps can be taken to increase the attractiveness of the yen for internationaluse. The first is to resume strong economic growth in Japan and regain market confidence in its economy, which has been undermined during the past 10 years ofeconomic stagnation and price deflation. Priorities should be given to restoring thesoundness of the financial system through acceleration of the disposal of non-performing loans, enhancing total factor productivity growth through structuralreform—in particular, deregulation—and ensuring sustainability of the nation’spublic finance through fiscal consolidation.
Second, further opening and liberalization of the Japanese economy that contributes to larger volumes of its trade with the rest of the world would naturallyincrease the trade-invoicing role of the yen. Japan’s trade as a share of GDP, which is currently one of the lowest among the OECD countries, needs to be increased substantially. In addition, further integration of the Japanese economy with emergingEast Asia would further encourage intra-industry trade and the associated use of the yen. In manufacturing products, currently 50 percent of Japan’s exports to, and28 percent of its imports from, Asia are invoiced in the yen, and the yen invoicingratios are also high for trade with Europe. These shares, though still low comparedwith those of the United States and Germany, are much higher than those for Japan’soverall trade denominated in the yen. Greater manufacturing trade with Asia andEurope will lead to greater use of the yen as a trade-invoicing currency.
Third, deeper foreign exchange and capital markets can induce the yen to serve asan attractive investment currency. In the Tokyo foreign exchange market, for instance,direct yen/euro trade comprises only one-fifth of euro/dollar trades in terms of volume. Development of direct transactions between the yen and non-dollar currencies, particularly the euro and East Asian currencies, can increase the role of theyen in the foreign exchange market. The recent approval of the Korean authority toallow Japanese banks to trade yen/won in Japan is a step in this direction. In addition,liquid and deep capital markets can encourage yen-denominated investment andfinancing, where risks are easily diversified. A number of measures have been taken in Japan to improve the efficiency of the capital market in recent years, following the “financial Big Bang.” These attempts include rationalization of stock exchanges,corporatization and listing of the Tokyo Stock Exchange, introduction of withholdingtax exemption for Japanese government bond (JGB) interest payments on non-residents, a review of the syndicate underwriting system for JGBs, and an attempt toshorten the JGB settlement period to T+1.
In the foreseeable future, the role of the dollar will continue to be significant,because of the effects of inertia and history. Nonetheless, there still is room for the yento play a more important role as an international nominal anchor currency in EastAsia. The yen may come to share the nominal anchor role with the dollar in East Asia,in the sense of receiving greater weights assigned by the East Asian authorities in their currency basket policies.38
200 MONETARY AND ECONOMIC STUDIES (SPECIAL EDITION)/DECEMBER 2002
38. Hence, the yen’s role in East Asia will not be as distinct as the one that was played by the deutschemark in theEMS. Even in Western Europe, however, the nominal role of the deutschemark appears to have been shared bythe French franc and the ECU during the EMS period (Kawai and Akiyama [1998]).

V. Concluding Remarks
The recent currency crisis in East Asia created a common trend toward more flexibleexchange rates, at least as an “official” regime in the affected countries (except forMalaysia). During the crisis, the role of the dollar as an anchor currency clearlydeclined in the affected countries. As the crisis subsided, emerging East Asia’sexchange rate arrangements began to diverge in comparison to the pre-crisis patternof assigning a considerable weight to the dollar. Malaysia has restored a dollar-pegarrangement after a short period of crisis-driven floating, while Indonesia has allowedlarge fluctuations of the currency. In between these two polar cases, most countrieshave adopted managed floating. Korea and Thailand particularly appear to haveshifted to a de facto managed-float, currency-basket arrangement with larger weightson the yen, an arrangement akin to that of Singapore.
The rest of the paper has proposed that emerging economies in East Asia, in the short to medium term, achieve real effective exchange rate stabilization by loosely tying their central rates to a currency basket, supported by consistent and sustainable macroeconomic policy. It has argued that (1) a system which ensuresintra-regional exchange rate stability will be beneficial for emerging East Asia to promote trade, FDI, and economic growth; (2) given the high degree of intra-regionaltrade and the rising similarity of trade composition in East Asia, each economy’sexchange rate policy should be directed toward maintaining intra-regional exchangerate stability; and (3) in view of the sub-optimality of the de facto dollar peg policy asan informal and uncoordinated mechanism of ensuring intra-regional stability, acoordinated action can be profitably employed to shift the target of nominalexchange rate stability to a similar currency basket, consisting of the dollar, the yen,and the euro, which is broadly representative of the partner composition of theregion’s trade and FDI.
At least initially, regional currency stabilization to the basket does not have to berigid. Each economy may choose its own formal exchange rate arrangement, provided that a currency basket serves as the reference numeraire in the conduct ofexchange rate policy, be it a currency board, a soft peg, or a managed float with widemargins. After the initial phase, the East Asian economies may agree on a commonbasket and adopt policies that ensure tighter exchange rate stability against the basket. Such an arrangement is likely to contribute to the simultaneous stabilizationof intra-regional exchange rates as well as individual economies’ effective exchangerates. It is a pragmatic policy option until greater political and institutional develop-ments create an environment conducive to a more robust framework of monetaryand exchange rate policy coordination that is commensurate with trade and invest-ment integration in the region. To that end, the regional economies are advised tostrengthen financial cooperation through various regional forums, such as ASEAN+3,the Manila Framework Group and EMEAP, and trans-regional forums, such as APEC and ASEM, with a view to enhanced financing and policy dialogue mechanisms, which will help foster such a framework.
201
Exchange Rate Arrangements in East Asia: Lessons from the 1997–98 Currency Crisis

Alogoskoufis, George, and Richard Portes, “The Euro, the Dollar and the International MonetarySystem,” in Paul R. Masson, Thomas H. Krueger, and Bart G. Turtleboom, eds. EMU and theInternational Monetary System, Washington, D.C.: International Monetary Fund, 1997, pp. 58–78.
Bayoumi, Tamim, Barry Eichengreen, and Paolo Mauro, “On Regional Monetary Arrangements forASEAN,” Journal of the Japanese and International Economies, 14, 2000, pp. 121–148.
Bergsten, C. Fred, “The Impact of the Euro on Exchange Rates and International Policy Cooperation,”in Paul R. Masson, Thomas H. Krueger, and Bart G. Turtleboom, eds. EMU and theInternational Monetary System, Washington, D.C.: International Monetary Fund, 1997, pp. 17–48.
Braga de Macedo, Jorge, Daniel Cohen, and Helmut Reisen, Don’t Fix, Don’t Float: The Exchange Ratein Emerging Markets, Transition Economies and Developing Countries, Development CentreStudies, Paris: Organisation for Economic Co-operation and Development, 2001.
Calvo, Guillermo A., and Carmen M. Reinhart, “Fear of Floating,” Quarterly Journal of Economics,117, 2002, pp. 379–408.
Dornbusch, Rudiger, and Yung Chul Park, “Flexibility or Nominal Anchors?” in Stefan Collignon, JeanPisani-Ferry, and Yung Chul Park, eds. Exchange Rate Policies in Emerging Asian Countries,London and New York: Routledge, 1999, pp. 3–34.
Eichengreen, Barry, International Monetary Arrangements for the 21st Century, Washington, D.C.:Brookings Institution, 1994.
———, “The Euro as a Reserve Currency,” Journal of the Japanese and International Economies, 12,1998, pp. 483–506.
———, and Tamim Bayoumi, “Is Asia an Optimum Currency Area? Can It Become One? Regional,Global and Historical Perspectives on Asian Monetary Relations,” in Stefan Collignon, JeanPisani-Ferry, and Yung Chul Park, eds. Exchange Rate Policies in Emerging Asian Countries,London and New York: Routledge, 1999, pp. 347–366.
———, and Ricardo Hausmann, “Exchange Rates and Financial Fragility,” in New Challenges forMonetary Policy, a symposium sponsored by the Federal Reserve Bank of Kansas City, 1999.
Fischer, Stanley, “Exchange Rate Regimes: Is the Bipolar View Correct?” Journal of EconomicPerspectives, 15, 2001, pp. 3–24.
Frankel, Jeffrey A., “No Single Currency Regime Is Right for All Countries or at All Times,” Essays in International Finance No. 215, International Finance Section, Princeton University,Princeton, 1999.
———, Eduardo Fajnzylber, Sergio Schmukler, and Luis Serven, “Verifying Exchange Rate Regimes,”Policy Research Working Paper No. 2397, Washington, D.C.: World Bank, 2000.
———, and Andrew K. Rose, “The Endogeneity of the Optimum Currency Area Criteria,” EconomicJournal, 108, 1998, pp. 1009–1025.
———, and Shang-Jin Wei, “Is There a Currency Bloc in the Pacific?” in Adrian Blundell-Wingnalland Stephen Grenville, eds. Exchange Rates, International Trade and Monetary Policy, Sydney:Reserve Bank of Australia, 1993, pp. 275–307.
———, and ———, “Yen Bloc or Dollar Bloc? Exchange Rate Policies of the East Asian Economies,”in Takatoshi Ito and Anne O. Krueger, eds. Macroeconomic Linkage: Savings, Exchange Rates,and Capital Flows, Chicago: University of Chicago Press, 1994, pp. 295–329.
———, and ———, “Emerging Currency Blocks,” in Hans Genberg, ed. The International MonetarySystem, 1995, pp. 111–170.
French and Japanese Staff, Ministries of Finance, “Exchange Rate Regimes for Emerging MarketEconomies,” Discussion Paper, Paris and Tokyo, 2001.
Fukuda, Shin’ichi, “Post-Crisis Exchange Rate Regimes in East Asia,” mimeo, Faculty of Economics,University of Tokyo, 2002.
Goldstein, Morris, “Managed Floating Plus,” Policy Analyses in International Economics, 66,Washington, D.C.: Institute for International Economics, 2002.
202 MONETARY AND ECONOMIC STUDIES (SPECIAL EDITION)/DECEMBER 2002
References

Goto, Junichi, and Koichi Hamada, “Economic Preconditions for Asian Regional Integration,” inTakatoshi Ito and Anne O. Krueger, eds. Macroeconomic Linkage: Savings, Exchange Rates, andCapital Flows, Chicago: University of Chicago Press, 1994, pp. 359–385.
Hamada, Koichi, and Akiyoshi Horiuchi, “Monetary, Financial and Real Effects of YenInternationalization,” in S. W. Arndt and J. D. Richardson, eds. Real-Financial Linkages amongOpen Economies, Cambridge, Massachusetts: The MIT Press, 1987, pp. 167–191.
Hausmann, Ricardo, “The Dollarization Debate: Is It Over?” paper presented at the International Conference on “Monetary Outlook on East Asia in an Integrating World Economy” atChulalongkorn University, Bangkok, on September 5–6, 2001.
———, Ugo Panizza, and Ernesto Stein, “Why Do Countries Float the Way They Float?” mimeo,Washington, D.C.: Inter-American Development Bank, 1999.
Hernandez, Leonard, and Peter Montiel, “Post-Crisis Exchange Rate Policy in Five Asian Countries:Filling in the ‘Hollow Middle’?” IMF Working Paper WP/01/170, Washington, D.C.:International Monetary Fund, 2001.
Honohan, Patrick, and Philip R. Lane, “Pegging to the Dollar and the Euro,” International Finance, 2 (3), 1999, pp. 379–410.
International Monetary Fund, World Economic Outlook, Washington, D.C.: International MonetaryFund, 1997.
Ito, Takatoshi, “The Role of the Yen in East Asia,” paper presented at the International Conference on“Monetary Outlook on East Asia in an Integrating World Economy” at ChulalongkornUniversity, Bangkok, on September 5–6, 2001.
———, Eiji Ogawa, and Yuri Nagataki-Sasaki, “How Did the Dollar Peg Fail in Asia?” Journal of theJapanese and International Economies, 12, 1998, pp. 256–304.
Kawai, Masahiro, “The Japanese Yen as an International Currency: Performance and Prospects,” inRyuzo Sato, Rama V. Ramachandran, and Hajime Hori, eds. Organization, Performance and Equity: Perspectives on the Japanese Economy, Kluwer Academic Publishers, 1996, pp. 305–355.
———, “Japan’s Trade and Investment in East Asia,” in David Robertson, ed. East Asian Trade afterthe Uruguay Round, Cambridge: Cambridge University Press, 1997, pp. 209–226.
———, and Shigeru Akiyama, “Roles of the World’s Major Currencies in Exchange RateArrangements,” Journal of the Japanese and International Economies, 12, 1998, pp. 334–387.
———, and ———, “Implications of Currency Crisis for Exchange Rate Arrangements in EmergingEast Asia,” Policy Research Working Paper No. 2502, Washington, D.C.: World Bank, 2000.
———, and Shinji Takagi, “Proposed Strategy for a Regional Exchange Rate Arrangement in Post-Crisis East Asia: Analysis, Review and Proposal,” Policy Research Working Paper No. 2503,Washington, D.C.: World Bank, 2000.
Kuroda, Haruhiko, and Masahiro Kawai, “Strengthening Regional Financial Cooperation in East Asia,”paper presented at the seminar on “Regional Economic, Financial and Monetary Co-operation:The European and Asian Experiences” at the European Central Bank, Frankfurt am Main, onApril 15–16, 2002.
Kwan, C. H., Yen Bloc: Toward Economic Integration in Asia, Washington, D.C.: BrookingsInstitution, 2001.
Masson, Paul R., and Bart G. Turtleboom, “Characteristics of the Euro, the Demand for Reserves, andPolicy Coordination under EMU,” in Paul R. Masson, Thomas H. Krueger, and Bart G.Turtleboom, eds. EMU and the International Monetary System, Washington, D.C.:International Monetary Fund, 1997.
McCauley, Robert N., “Setting Monetary Policy in East Asia: Goals, Developments and Institutions,”in David Gruen and John Simon, eds. Future Directions for Monetary Policies in East Asia,Sydney: Reserve Bank of Australia, 2001, pp. 6–55.
McKinnon, Ronald I., “The East Asian Dollar Standard: Life after Death?” Economic Notes, 29, 2000,pp. 31–82.
203
Exchange Rate Arrangements in East Asia: Lessons from the 1997–98 Currency Crisis

———, “After the Crisis, the East Asian Dollar Standard Resurrected,” paper presented at the International Conference on “Monetary Outlook on East Asia in an Integrating WorldEconomy” at Chulalongkorn University, Bangkok, on September 5–6, 2001.
———, and Kenichi Ohno, Dollar and Yen: Resolving Economic Conflict between the United States andJapan, Cambridge, Massachusetts: The MIT Press, 1997.
———, and Gunther Schnabl, “Synchronized Business Cycles in East Asia: Fluctuations in theYen/Dollar Exchange Rate and China’s Stabilizing Role,” mimeo, Stanford University, 2002.
Mundell, Robert, “Currency Area Formation and the Asian Region,” paper presented at the International Conference on “Monetary Outlook on East Asia in an Integrating WorldEconomy” at Chulalongkorn University, Bangkok, on September 5–6, 2001.
Mussa, Michael, Paul Masson, Alexander Swoboda, Esteban Jadresic, Paolo Mauro, and Andy Berg,“Exchange Rate Regimes in an Increasingly Integrated World Economy,” Occasional Paper,193, Washington, D.C.: International Monetary Fund, 2000.
Obstfeld, Maurice, and Kenneth Rogoff, “The Mirage of Fixed Exchange Rates,” Journal of EconomicPerspectives, 9, 1995, pp. 73–96.
Ogawa, Eiji, and Takatoshi Ito, “On the Desirability of a Regional Basket Currency Arrangement,”NBER Working Paper No. 8002, National Bureau of Economic Research, 2000.
Ohno, Kenichi, “Exchange Rate Management in Developing Asia: Reassessment of the Pre-Crisis SoftDollar Zone,” ADBI Working Paper, 1, Tokyo: Asian Development Bank Institute, 1999.
Rogoff, Kenneth, “Why Not a Global Currency?” American Economic Review Proceedings, 91, 2001,pp. 243–247.
Sakakibara, Eisuke, and Sharon Smith Yamakawa, “Regional Integration in East Asia: Challenges andOpportunities,” mimeo, Global Security Research Center, Tokyo: Keio University, 2001.
Takagi, Shinji, “A Basket Peg Policy: Operational Issues for Developing Countries,” WorldDevelopment, 16, 1988, pp. 271–279.
———, “The Yen and Its East Asian Neighbors, 1980–1995,” in Takatoshi Ito and Anne O. Krueger,eds. Changes in Exchange Rates in Rapidly Developing Countries: Theory, Practice, and PolicyIssues, Chicago: University of Chicago Press, 1999, pp. 185–207.
Tavlas, George S., and Yuzuru Ozeki, “The Internationalization of Currencies: An Appraisal of theJapanese Yen,” Occasional Paper, 90, Washington, D.C.: International Monetary Fund, 1992.
Williamson, John, “The Case for a Common Basket Peg for East Asian Currencies,” in StefanCollignon, Jean Pisani-Ferry, and Yung Chul Park, eds. Exchange Rate Policies in EmergingAsian Countries, London and New York: Routledge, 1999a, pp. 327–343.
———, “Future Exchange Rate Regimes for Developing East Asia: Exploring the Policy Options,”paper presented at the conference on “Asia in Economic Recovery: Policy Options for Growthand Stability,” Institute of Policy Studies, Singapore, June 21–22, 1999b.
———, “Exchange Rate Regimes for Emerging Markets: Reviving the Intermediate Option,” PolicyAnalyses in International Economics, 60, Washington, D.C.: Institute for InternationalEconomics, 2000.
———, “The Case for a Basket, Band and Crawl (BBC) Regime for East Asia,” in David Gruen andJohn Simon, eds. Future Directions for Monetary Policies in East Asia, Sydney: Reserve Bank ofAustralia, 2001, pp. 96–111.
Wyplosz, Charles, “A Monetary Union in Asia? Some European Lessons,” in David Gruen and JohnSimon, eds. Future Directions for Monetary Policies in East Asia, Sydney: Reserve Bank ofAustralia, 2001, pp. 124–155.
204 MONETARY AND ECONOMIC STUDIES (SPECIAL EDITION)/DECEMBER 2002

Comment
CHOW HWEE KWAN39
Monetary Authority of Singapore
I. Introduction
Masahiro Kawai’s paper takes a stylized and practical approach in characterizing theobserved exchange rate arrangements in East Asia. In particular, the paper focuses on the role played by the U.S. dollar as an international anchor currency for theexchange rate behavior of the East Asian economies before, during, and after the currency crisis. It concludes that the dollar continues to play a dominant anchor currency role for many economies in the region. A key proposal in this paper is forthese economies—given their diversified trade patterns—to loosely tie their centralrates to a balanced currency basket, comprising the G-3 currencies, i.e., the euro, dollar, and yen, to achieve stable real effective exchange rates.
In this discussion, we will first highlight the approaches concerning the choice of exchange rate regimes facing East Asian economies, and provide some empiricalevidence from a paper by my colleagues at the Monetary Authority of Singapore(MAS) on the move toward somewhat more flexible arrangements after the crisis, asobserved in Kawai’s paper. Singapore’s exchange rate framework might also serve as auseful case-study of how a small, open economy has tried to implement the currencybasket framework proposed in Kawai’s paper. Finally, as alluded to in the paper, the choice of the exchange rate per se is not the only consideration in the conduct of exchange rate policy. Policymakers need to take a multi-dimensional approach,thinking hard about the macro- and microeconomic polices as well as supportinginstitutions of the chosen exchange rate framework.
II. Approaches in Choosing Exchange Rate Regimes
Corden (2001) identifies in essence three approaches in choosing an exchange rate regime:
(1) Exchange rate stability—an implication of this approach is that the floatingrate creates undue instability or misalignment that is adverse for internationaltrade and capital movements.
(2) Real targets—this approach uses the nominal exchange rate as a policy instrument to adjust the real exchange rate to attain, together with fiscal policy, the targets of internal and external balance.
(3) A nominal anchor—in this approach, an anchor to a country’s inflation rate isprovided by fixing the exchange rate or the rate of crawl.
205
Comment
39. I am grateful to Edward Robinson for useful input and discussion.

A history of relatively low inflation for most East Asian countries leads us to ruleout the pressing need for a nominal anchor in this region. We also note that in thecontinuum of exchange rate regimes, the corner solution of a fixed system accords the advantages of exchange rate stability but not that of achieving real targets.Meanwhile, the reverse is true for the other corner solution of a flexible system. The open economy trilemma is also a particularly relevant consideration for the East Asian economies, since most are integrated in the world capital market. Giventhe trade-offs involved, it seems unnecessary to go to the extremes of rigid fixity or free float; instead, adherence to some interior solution appears plausible (seeFrankel [1999]).
III. Flexible Exchange Rates Enhanced Monetary Autonomy in East Asia
To confirm Kawai’s observation of East Asia’s move toward more flexible exchangerate arrangements, we draw on the results of a past study on monetary policy in fourEast Asian economies—namely, Indonesia, Korea, Thailand, and Malaysia after thecurrency crisis (see MAS [2000]). The empirical evidence suggests that the first threecountries have transited from the pre-crisis quasi-dollar-peg regime to a more flexiblepost-crisis exchange rate regime. In particular, the standard deviations of the dailypercentage change in the rupiah, baht, and won (the Indonesian, Thai, and Koreancurrencies, respectively) against the dollar for the post-crisis period from January 2,1999 to September 22, 2000, are compared against the daily volatility during thepre-crisis period from January 2, 1995 to January 2, 1997 (Table 1). There has beenan increase in the standard deviation of the daily movements of the three currenciesfrom the pre- to post-crisis sample period, with the largest increase in volatility beingrecorded for the rupiah. Indeed, the de jure regime classification after the crisis for allthree economies is a free float, within the inflation targeting framework that employsinterest rates as the key operating instrument. Meanwhile, Malaysia has pegged itscurrency, the ringgit, to the dollar.
206 MONETARY AND ECONOMIC STUDIES (SPECIAL EDITION)/DECEMBER 2002
Table 1 Daily Exchange Rate Volatility
Period Indonesia Korea Thailand
Standard deviation of daily Jan. 2, 1995–Jan. 2, 1997 0.2061 0.2528 0.2223percentage change Jan. 2, 1999–Sep. 22, 2000 1.8791 0.4016 0.5474
Source: MAS (2000).
The new frameworks adopted are presumably aimed at securing greater autonomyin monetary policy management, while retaining the anchor on price stability. Toevaluate the degree of monetary independence the authorities of these countriescould exercise, the MAS study also examined the relationship between exchange rate flexibility and interest rate differentials. A short-term interest rate dynamicmodel for the differential between the domestic and dollar interbank interest rateswas estimated using pre- and post-crisis observations from the four countries. The
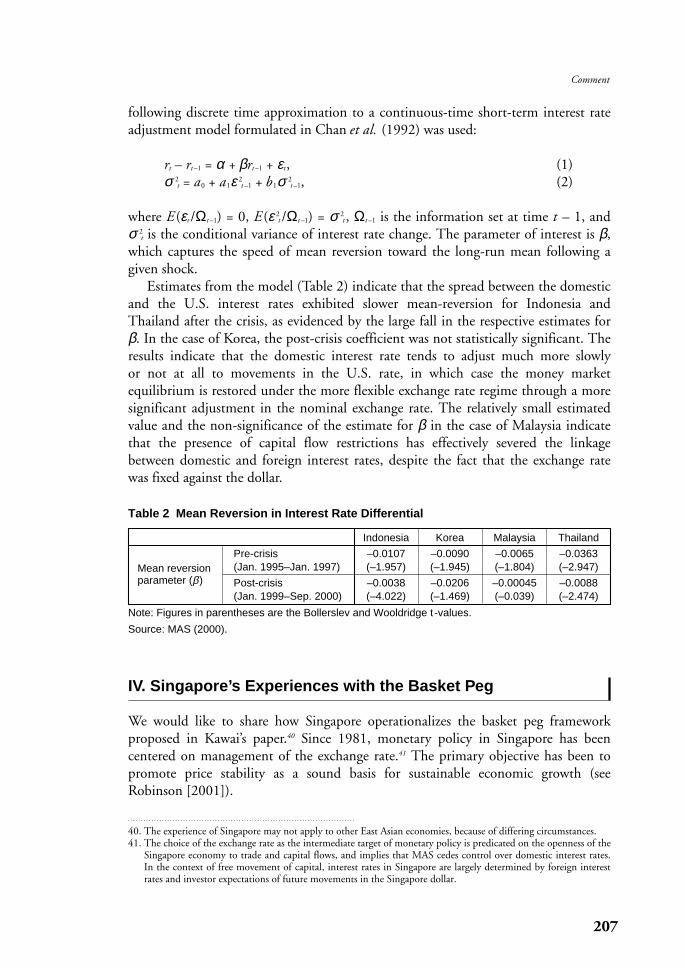
following discrete time approximation to a continuous-time short-term interest rateadjustment model formulated in Chan et al. (1992) was used:
rt – rt –1 = α + βrt –1 + εt, (1)σ 2
t = a0 + a1ε 2t –1 + b1σ 2
t –1, (2)
where E (εt /Ωt –1) = 0, E (ε 2t /Ωt –1) = σ 2
t , Ωt –1 is the information set at time t – 1, andσ 2
t is the conditional variance of interest rate change. The parameter of interest is β,which captures the speed of mean reversion toward the long-run mean following agiven shock.
Estimates from the model (Table 2) indicate that the spread between the domesticand the U.S. interest rates exhibited slower mean-reversion for Indonesia andThailand after the crisis, as evidenced by the large fall in the respective estimates forβ. In the case of Korea, the post-crisis coefficient was not statistically significant. Theresults indicate that the domestic interest rate tends to adjust much more slowly or not at all to movements in the U.S. rate, in which case the money market equilibrium is restored under the more flexible exchange rate regime through a moresignificant adjustment in the nominal exchange rate. The relatively small estimatedvalue and the non-significance of the estimate for β in the case of Malaysia indicatethat the presence of capital flow restrictions has effectively severed the linkagebetween domestic and foreign interest rates, despite the fact that the exchange ratewas fixed against the dollar.
207
Comment
Table 2 Mean Reversion in Interest Rate Differential
Indonesia Korea Malaysia Thailand
Pre-crisis –0.0107 –0.0090 –0.0065 –0.0363Mean reversion (Jan. 1995–Jan. 1997) (–1.957) (–1.945) (–1.804) (–2.947)parameter (β) Post-crisis –0.0038 –0.0206 –0.00045 –0.0088
(Jan. 1999–Sep. 2000) (–4.022) (–1.469) (–0.039) (–2.474)
Note: Figures in parentheses are the Bollerslev and Wooldridge t -values.
Source: MAS (2000).
IV. Singapore’s Experiences with the Basket Peg
We would like to share how Singapore operationalizes the basket peg framework proposed in Kawai’s paper.40 Since 1981, monetary policy in Singapore has been centered on management of the exchange rate.41 The primary objective has been topromote price stability as a sound basis for sustainable economic growth (seeRobinson [2001]).
40. The experience of Singapore may not apply to other East Asian economies, because of differing circumstances.41. The choice of the exchange rate as the intermediate target of monetary policy is predicated on the openness of the
Singapore economy to trade and capital flows, and implies that MAS cedes control over domestic interest rates.In the context of free movement of capital, interest rates in Singapore are largely determined by foreign interestrates and investor expectations of future movements in the Singapore dollar.

A key feature of our exchange rate system is the basket peg. The Singapore dollar ismanaged against a basket of currencies of 10–15 major trading partners. The variouscurrencies are weighted geometrically, with the weights varying with the extent ofSingapore’s trade dependence with that particular country. Reflecting MAS’ targetingof the nominal effective exchange rate (NEER), Singapore’s trade-weighted exchangerate has remained fairly stable.42 Volatility as measured by the standard deviation of the NEER was significantly lower for the Singapore dollar compared to that of theU.S. dollar and of the yen.43 The standard deviation of the Singapore dollar NEER was 1.46 percent between 1981/I and 2001/I, compared to 3.45 percent for the U.S.dollar and 4.82 percent for the yen.
The movements of the Singapore dollar against major currencies, especially theU.S. dollar, have been less volatile than the movements among the major currencies.Indeed, the Singapore dollar has been less volatile with respect to the other currenciesthan if it had been pegged to any of the main currencies. For example, if theSingapore dollar were pegged against the U.S. dollar, the monthly standard deviationagainst the yen and deutschemark would have been 3.42 percent and 3.27 percent,respectively, instead of 2.99 percent and 2.92 percent. The “basket” characteristic of the managed float system has therefore also helped to mitigate some volatility ascompared to if the Singapore dollar were on a bilateral peg.
V. Coping with Short-Term Volatility as Well as CurrencyMisalignments
While Kawai has recommended a loose peg to the currency basket for East Asianeconomies, the Singapore exchange rate framework contains elements of the BBC system, i.e., basket, band, and crawl regime (see Williamson [2000]). The MAS operates a managed float for the Singapore dollar, allowing the trade-weighted exchangerate to fluctuate within an undisclosed policy band. In the short term, managing theSingapore dollar within a band provides the flexibility to prevent volatility in the financial markets from adversely affecting the real economy, as evidenced for exampleby the Asian crisis. During that period, MAS was able to widen policy bands as volatility increased in foreign exchange markets and subsequently narrow them whensome degree of calm had returned to the regional markets. The flexibility accorded by the band is pertinent in view of Singapore’s vulnerability to disturbances in theinternational financial system (strong fundamentals notwithstanding), given our small,open economy as well as our role as a financial center in Asia.
Another key feature of Singapore’s exchange rate system is the crawl. The exchangerate policy band is periodically reviewed to ensure that it remains consistent with theunderlying fundamentals of the economy. Over the longer term, the managed float has provided the flexibility for MAS to prevent currency misalignments by allowing
208 MONETARY AND ECONOMIC STUDIES (SPECIAL EDITION)/DECEMBER 2002
42. In relation to the endogeneity of a currency regime, the stability in the Singapore dollar could very well reflect thestrong fundamentals underlying the Singapore economy.
43. The NEER series for the U.S. dollar and yen are based on the quarterly series published by the InternationalMonetary Fund.
the equilibrium (real) value of the exchange rate to reflect changes in underlying fundamentals, such as the trend increase in the savings rate and higher productivity in the export sector. Notably, the trade-weighted Singapore dollar has been on a secularly appreciating trend since 1981 in both nominal and real terms. This uptrendhas helped to keep inflationary pressures in check. Between 1981 and 1987, domesticinflation averaged 2.3 percent, markedly less than external inflation (as proxied by a trade-weighted average of foreign composite consumer price index [CPI]), whichaveraged 4.6 percent over the same period.
In addition, we have a semiannual exchange rate policy cycle. In January and Julyeach year, we release our Monetary Policy Statement and publish the MacroeconomicReview. The latter is aimed at providing information on the background economicanalysis and assessment of GDP growth and inflation developments in the Singaporeeconomy, thereby sharing the basis for policy decisions articulated in the MonetaryPolicy Statement.
VI. A Multi-Dimensional Approach to Exchange RateManagement
It is generally recognized and can be inferred from Kawai’s paper that the challengesposed by the global financial markets cannot be met by the choice of exchange rateregime alone. Exchange rate policy management has moved beyond the confines ofthe traditional parameters of instruments, targets, transmission mechanisms, andinflation-output trade-off issues, and needs to be supported by a framework of consistent macroeconomic and microeconomic policies, and by strong institutions.The exchange rate system may therefore be viewed as a “monetary overlay” on thereal economy foundations.
We have identified the following five aspects of an exchange rate support structure(see Robinson [2001]):
(1) Sound and credible macroeconomic policies are essential to avoid the buildupof major macro imbalances in the economy. This will reduce the vulnerabilityto speculative attacks by preventing misalignments in the value of the currency.
(2) The flexibility of the product and factor markets is essential to cope with andadjust to shocks arising from the volatility of currency markets and swings in the terms of trade in world product markets. This is particularly true forsmall, open economies, which are dependent on exports of goods and services.
(3) It is crucial to develop and strengthen financial systems to enhance robustnessto shocks. A sound and efficient banking system, together with deep and liquidcapital markets, contributes to the efficient intermediation of financial flows.This will help prevent the emergence of vulnerabilities in the financial systemby minimizing unsound lending practices that could lead to the buildup ofexcessive leveraging in the corporate sector and exposure to foreign borrowings.
(4) Countries need to build up their regulatory and supervisory capabilities tokeep pace with financial innovations and the growing complexity of financialinstitutions’ activities, as well as new products and services.
209
Comment
(5) Policymakers should promote greater disclosure and transparency. This willhelp to foster market discipline, as well as reduce the likelihood of marketsover-reacting due to lack of information or information asymmetries.
VII. Monetary Integration in East Asia
We conclude with a brief comment on Kawai’s suggestion for a move toward a common basket peg for East Asia. First, we agree with him that East Asia is not yetready for a monetary union. This is especially so given the relatively wide divergencesin economic characteristics such as GDP per capita, business cycle synchronization,and price and wage flexibility in this region. Empirical evidence revealing asymmetricshocks also suggests that this region currently does not meet the necessary prerequisitesfor monetary integration (see, e.g., Chow and Kim [2003]).
Asian countries should focus their efforts instead on deepening the integration oftheir markets. This would include developing greater intra-regional trade linkages,integrating financial markets, and establishing regional production networks.Underpinning this should be an evolution of common codes of conduct and standards of corporate governance, as well as greater regulatory cooperation and harmonization. Perhaps in the longer term, when Asia has achieved a certain degreeof integration in its factor and capital markets, some form of closer monetary cooperation and integration can be an effective means of securing the benefits of theeconomic linkages.
210 MONETARY AND ECONOMIC STUDIES (SPECIAL EDITION)/DECEMBER 2002
Chan, K. C., G. A. Karolyi, F. A. Longstaff, and A. B. Sanders, “An Empirical Comparison of AlternativeModels of the Short-Term Interest Rate,” Journal of Finance, 47, 1992, pp. 1209–1227.
Chow, H. K., and Y. Kim, “A Common Currency Peg in East Asia? Perspectives from Western Europe,”Journal of Macroeconomics, 5 (3), 2003.
Corden, M., Too Sensational: On the Choice of Exchange Rate Regimes, Cambridge, Massachusetts: The MIT Press, 2001.
Frankel, J., “No Single Currency Is Right for All Countries or at All Times,” Essays in InternationalFinance, 215, International Finance Section, Princeton, New Jersey: Princeton University,1999.
Monetary Authority of Singapore, “Kicking the Habit and Turning Over a New Leaf: Monetary Policyin East Asia after the Currency Crisis,” Occasional Paper No. 21, 2000.
Robinson, E., “Discussion,” in Future Directions for Monetary Policies in East Asia, Reserve Bank ofAustralia Conference Volume, 2001.
Williamson, J., “Exchange Rate Regimes for Emerging Markets: Reviving the Intermediate Option,”Policy Analyses in International Economics, 60, Washington, D.C.: Institute for InternationalEconomics, 2000.
References

Comment
EIJI HIRANOBank of Japan
Masahiro Kawai’s paper tackles challenging topics, and I really appreciate his devotedefforts to map this uncharted territory. Before commenting on his paper, I would liketo summarize its principal line of thought.
First, the paper claims that the dollar remains the de facto anchor currency even in the post-crisis period, in spite of the shortcomings of the dollar-peg regime thatprevailed before the crisis.
Second, such de facto predominance of the dollar does not reflect the underlyingtrade patterns and foreign direct investment flows in the region, and is therefore sub-optimal.
Third, the emerging East Asian economies should adopt the “soft-peg” regime to thecurrency basket, where the dollar, the yen, and the euro play equally important roles.
Fourth, given the above, greater coordination on the currency basket policy, anenhanced surveillance mechanism, and the internationalization of the yen are desirable.
In my comments on the paper, first I would like to pose a question as to the interpretation of the existing trade patterns, focusing especially on the expansion ofintra-regional trade in East Asia. The interpretation is of essential importance in thepaper. For example, if the intra-regional trade expansion is driven by region-specific orautonomous factors, excessive dependence on the dollar may be irrelevant. Conversely,if such expansion is mainly driven by the U.S. economy, then predominance of the dollar may be inevitable.
Recently, economists at the Bank of Japan conducted joint research with econo-mists from the European Central Bank on the intra- and inter-regional trade patternsin East Asia (Isogai et al. [2002]). Their key finding was that intra-regional tradeexpansion in East Asia is mainly induced by the U.S. economy. This result is in line with the intuition that East Asia has become an important production center for IT-related goods. If so, intra-regional trade expansion in East Asia may not be independent in nature.
This leads to the second question, of sub-optimality of the present regime. The paper claims that the present system is sub-optimal, because it does not reflect theunderlying trade patterns in the region. However, one may argue that the present system does in fact broadly reflect the reality of the real trade patterns. Given this reservation, I wonder how confidently one could argue for an intentional andcollective shift to a currency basket regime.
Third, I would like to call attention to financial factors in the choice of anexchange rate regime. The role of the dollar is much larger in the context of financialtransactions than in the area of trade. The emerging East Asian economies borrowmoney mainly in dollars for a number of reasons. We may assume this is one of thereasons why they are particularly sensitive to the stability of their currencies vis-à-visthe dollar. We should not underestimate such financial factors, particularly in thewake of the currency crisis.
211
Comment

Fourth, and last, I would like to argue that a peg is a peg. A currency basketregime cannot be completely immune from the well-known deficiencies of the peg system. Problems include how to define an optimal basket, how to design theadjustment mechanism of the weights assigned to basket currencies, how to make it consistent with monetary policy and capital controls, and so on. Starting with amechanism that is not too rigid may be one idea. However, I wonder from a practicalviewpoint if such a soft and somewhat elusive regime is a meaningful departure fromthe present mechanism.
Let us suppose that Japan can create an autonomous and independent businesscycle, and suppose further that Japan’s economic influence on the rest of the regionbecomes dominant. In this case, a greater role played by the yen is conceivable.Should we initiate such a shift of paradigm as public policy, or should we leave thework to market forces in a broad sense? This may be the fundamental question.
In any event, designing an optimal currency regime requires a long process of trial and error, and continued effort. Here in East Asia, momentum is clearly build-ing in pursuit of a better currency regime and improved monetary cooperation, andpolicymakers should take advantage of such momentum. In this respect, the paperprovides us with a good reference point, as a catalyst for further discussion.
212 MONETARY AND ECONOMIC STUDIES (SPECIAL EDITION)/DECEMBER 2002
Isogai, Takashi, Hirofumi Morishita, and Rasmus Rüffer, “Analysis of Intra- and Inter-Regional Tradein East Asia: Comparative Advantage Structures and Dynamic Interdependency in TradeFlows,” International Department Working Paper Series 02-E-1, Bank of Japan, 2002(http://www.boj.or.jp/en/down/siryo/data/iwp02e01.pdf).
Reference
General Discussion
Responding to the comments of the discussants, Masahiro Kawai, while acknowledg-ing the importance of the removal of trade barriers, emphasized the need to developan exchange rate regime that would be conducive to intra-regional exchange rate stability. Responding to the comment that the region is heavily affected by the U.S.economy as the source of final demand, he asserted that, given the rapid growth ofintra-regional trade, a dollar peg would give rise to problems in the event of largefluctuations in the yen-dollar rate. While acknowledging the importance of financialtransactions, Kawai argued that, given the very high dependence of Asian countrieson trade and foreign direct investment (FDI), it was important to discuss desirableexchange rate regimes from the perspective of international trade and investment.
In the general discussion that followed, Asian participants generally expressedviews in support of currency basket arrangements and agreed with Kawai’s analysis.Jeong-Ho Hahm (The Bank of Korea) and Amara Sriphayak (Bank of Thailand)acknowledged the usefulness of currency basket arrangements in simultaneouslyachieving exchange rate stability and price stability. Han Ming Zhi noted his supportfor currency basket arrangements, subject to the appropriate choice of currency
composition in such baskets. Robert W. Rankin commented that Kawai’s empiricalresults for the first half of 2002 suggest that Korea and Thailand, like Singapore, werealready operating under a currency basket during this period.
Various criticisms of currency basket arrangements were also voiced. GabrieleGalati, Chow Hwee Kwan, and Ismail Alowi agreed with the statement of Eiji Hirano that the importance of the dollar in current account and capital transactionsshould be taken into consideration. Alowi and Reuven Glick noted that currency basket arrangements lacked transparency because information regarding the relativeweights of the currencies in a basket and determination of the fluctuation bands oftenwere not disclosed. Vittorio Corbo noted that during the past two years, there were no cases of successful intermediate exchange rate regimes outside of Asia. He then argued that to pursue real exchange rate stability from the perspective of internationalcompetitiveness alone would not be consistent with the goal of price stability.
The following comments were made concerning the empirical analysis of the presentation. Robert H. Rasche (Federal Reserve Bank of St. Louis) noted that thereduced-form equations used in the estimation were subject to simultaneous bias, so that due caution needed to be exercised in applying the results based on suchequations to policy recommendations concerning the choice of exchange rateregimes. Corbo argued that countries with capital-flow controls should be excludedfrom the analysis and emerging market economies should be the study’s focus.Hiroshi Fujiki commented that, given the fact that certain aspects of the “original-sinhypothesis” are applicable to the Asian countries, it is necessary to include bothexchange rates and foreign reserves in the analysis.
Commenting on Kawai’s assertion that Singapore represented an almost idealform of currency basket arrangement, Corbo, Glick, and Alowi stated thatSingapore’s success was based on its favorable fundamentals, and that it was doubtfulwhether the arrangement would work in other countries. Chow responded that,notwithstanding favorable fundamentals, a small and open economy was prone to be affected by currency crises in other countries. Kawai responded that, although pre-crisis fundamentals were believed to be strong, there were currency crises, which suggested the need to adopt an exchange rate regime that is less prone to a crisis. Also, such a regime should be supported by consistent monetary policy, soundfiscal policy, and a resilient financial sector, as in the case of Singapore. The Asianregion experienced a currency crisis and contagion effects. Rankin commented that, although the impact of the East Asian crisis on Singapore was reduced by the depreciation of its currency, if all countries of the region were to depreciate their currencies in the event of another crisis, foreign exchange adjustment would be impossible in Asia as a whole.
Comments were also made from a more long-term perspective. Allan H. Meltzeremphasized the importance of the Chinese economy in considering the future of EastAsian exchange rate regimes. Jerry L. Jordan (Federal Reserve Bank of Cleveland)stated that the elimination of the causes of currency crises requires governments toimprove governance. Jordan also commented that Kawai’s paper failed to present atheoretical model to explain how a specific currency comes to be widely accepted as aregional currency. Jorge A. Braga de Macedo pointed out that Kawai’s paper did not
213
General Discussion

clearly identify the process by which currency basket systems can be established inEast Asia. He also emphasized that an institutional framework must be developed toavoid future financial crises and to promote regional cooperation. Kawai respondedthat while a recent attempt to create the Chiang Mai Initiative was a significant step forward, East Asian regional frameworks for exchanges of information, policy dialogue, and economic surveillance were relatively underdeveloped given the degreeof regional economic integration, and it was important to start a dialogue process onexchange rate movements and policies.
Given the important bearing of foreign exchange fluctuations on the discussionsof this session, Meltzer asked Hirano to explain why the Bank of Japan undertakessterilization when intervening in the foreign exchange market. Hirano responded thatthere was no effective difference between sterilization and non-sterilization becausethe Bank of Japan, under the so-called quantitative easing framework, was targetingoutstanding current account balances of banks with the Bank of Japan, which effectively created the zero interest rate environment.
214 MONETARY AND ECONOMIC STUDIES (SPECIAL EDITION)/DECEMBER 2002