Embed Size (px)
Citation preview

Exchange interactions in trinuclear basic chromium(III) clusters: Directobservation of the magnetic spectrum by inelastic neutron scatteringUpali A. Jayasooriya, Roderick D. Cannon, Ross P. White, John A. Stride, Roger Grinter et al. Citation: J. Chem. Phys. 98, 9303 (1993); doi: 10.1063/1.465055 View online: http://dx.doi.org/10.1063/1.465055 View Table of Contents: http://jcp.aip.org/resource/1/JCPSA6/v98/i12 Published by the American Institute of Physics. Additional information on J. Chem. Phys.Journal Homepage: http://jcp.aip.org/ Journal Information: http://jcp.aip.org/about/about_the_journal Top downloads: http://jcp.aip.org/features/most_downloaded Information for Authors: http://jcp.aip.org/authors
Downloaded 02 Jul 2012 to 128.248.155.225. Redistribution subject to AIP license or copyright; see http://jcp.aip.org/about/rights_and_permissions

Exchange interactions in trinuclear basic chromium(1I1) clusters: Direct observation of the magnetic spectrum by inelastic neutron scattering
Upali A. Jayasooriya,a) Roderick D. Cannon,a) Ross P. White,b) John A. Stride,a) Roger Grinter,a) and Gordon J. Kearleyb) School of Chemical Sciences, University of East Anglia, Nonvich NR4 7TJ, England, and Institut Laue-Langevin, BP 156X 38042 Grenoble Cedex, France
(Received 30 December 1992; accepted 2 March 1993)
Incoherent inelastic neutron scattering spectra are reported for salts of the complex [Cr30(OOCCH3)6(OH2h]+. The data are consistent with predominantly antiferromagnetic coupling between pairs of chromium ions. The complete spectrum of transitions between successive states with total spin S= 1/2,3/2,5/2,7/2, and 9/2 has been observed for the first time. Splittings of the ground state S = 1/2 have been observed directly and attributed to lowering of symmetry of the triangular cluster. For the chloride salt the data confirm that two sets of complex cations with different degrees of symmetry lowering are present in the crystal, at least at the lowest temperatures used (T = 1.4 to 50 K). In principle, the relationship of J values for the symmetry-lowered case could be described as "isosceles," with Jab>Jbc=Jac or Jab <Jbc =Jac ; or as "scalene," with all three Jvalues different. We find that, for at least one of the two sets of metal ion clusters, the scalene case applies, with J values of -11.5 ± 0.2, -10.5 ± 0.2, and -9.7±0.2 cm- 1. Using appropriate linear combinations of J values, analogous to symmetry coordinates for a triatomic molecule, these values can be regarded as being midway between the two limiting isosceles cases. With these parameters, the Heisenberg spin-only coupling model accounts well for the energies and intensities of the magnetic transitions.
I. INTRODUCTION
The saIt [Cr30(OOCCH3)6(OH2h]C1.5H20 is the prototype of the important class of oxo-centered trinuclear transition metal cluster complexes. It was first characterized by Werner,1 and by Weinland,2 in 1908. The triangular metal ion cluster was first inferred from magnetic measurements by Wel03 in 1928. The complete structure, shown in Fig. 1, was correctly guessed by Orgel4 in 1960, and confirmed by x-ray diffraction by Figgis and Robertson5 in 1965. Analogous complexes occur with other trivalent metals, with mixed metals, and with mixed valencies, MIII2MII. The chemistry and physics of these compounds have been reviewed.6
Temperature-dependent magnetic susceptibility measurements have generally shown medium to strong antiferromagnetic coupling, and in the case of the chromium(III) triangle, coupling constants J in the range - 9 to -12 cm -1 have been reported.6 During the 1960s, however, it was already realized that the picture is not simple. The most accurate low-temperature susceptibility, and also specific heat, measurements favored a lowering of symmetry of the triangular cluster so that at least two J values were required.6 Whether this implies an appreciable geometrical distortion of the metal ion triangle, i.e., inequality of relevant metal-ligand distances and angles, is still not clear. Space groups of crystals of homonuclear (MIIIh complexes determined by x-ray diffraction (at room temperature) usually do not show C3 axes, but the deviations from trigonal symmetry are generally within ex-
a)UEA. b)ILL.
perimental error.6 It has, however, been suggested that an equilateral cluster of paramagnetic ions is inherently unstable, owing to the frustration of spin-a "magnetic J ahnTeller effect.,,7 The magnetic properties have also been interpreted in terms of a dynamic distortion, with isosceles configurations rapidly interconverting,8 though this interpretation has also been challenged.9
•1o
Several later experimental studies disclosed an additional complication. The chloride salt of the chromium(III) acetate complex undergoes phase transitions at T=211.4 and 215.5 K. These are established by specific heat anomalies ll and by (unpublished) NMR data. 12
X-ray diffraction also shows that between room temperature13 and 190 K-presumably at one of the transition points-the space group changes, and the unit cell doubles in length in one direction. 14 Although the low-temperature structure has still not been determined completely, it is known to contain equal numbers of two crystallographically nonequivalent sets of trimer complex ions. Sorai et al. found that low-temperature specific heat data could best be interpreted by assuming that one of the two sets is significantly more distorted than the other. II Ferguson and Giidel reached the same conclusion from electronic spectroscopy.15 They found two intense luminescence emissions at ca. 12900 and 12820 cm- 1 (at T=7 K), split by 8.8 cm- 1 and ca. 3 cm- I , respectively, which they attributed to the two sets. With the assignment of the intense bands to transitions S* = 7/2 to S = 7/2, and of various weaker lines in both emission and absorption spectra to transitions involving 5/2 and 3/2 spin states, the coupling constants were obtained in good agreement with Sorai et al. Energy transfer between the two sets of complexes has also been detected. 14
J. Chern. Phys. 98 (12). 15 June 1993 0021-9606/93/129303-08$06.00 © 1993 American Institute of Physics 9303 Downloaded 02 Jul 2012 to 128.248.155.225. Redistribution subject to AIP license or copyright; see http://jcp.aip.org/about/rights_and_permissions

9304 Jayasooriya et al.: Exchange interactions in chromium (III) clusters
® Cr
@ CH3
• H2O
FIG. 1. Structural unit of the complex [Cr,o(OOCCH3)6(OH2)]3+.
Most attempts to interpret experimental magnetic data have assumed isotropic exchange coupling between the paramagnetic centers. Other effects have been discussed theoretically, notably anisotropic coupling and antisymmetric exchange-equivalent to spin-orbit coupling, 16-18
but, in general, the effects predicted from these causes are very small, and there is no good evidence for them. Intermolecular exchange has also been suggested,19 but has been effectively ruled20 out on the basis of the low-temperature specific heat measurements of Sorai et al. II and on the basis of low-temperature energy-transfer data. 14 In this work we use incoherent inelastic neutron scattering spectroscopy (lINS) to observe transitions between low-lying magnetic states. We show that intramolecular isotropic exchange is adequate to explain the magnetic levels in the energy range 2-200 em-I, provided that full account is taken of the possible geometrical distortions. We report spectra of the salts [Cr30(OOCMe)6(aq)3]X(aq), Me=CH3, CD3 ; aq =H20, D20; and X- =CI-, NO.3. All four transitions S -> S + 1 have been observed and also the predicted lowenergy transitions between ground state sublevels.
II. THEORY
Here we give the basic formulas for energies and transition probabilities for the important limiting case where two of the three ions in the cluster are equivalent. Subsequently, we show that this model is too simple, but it remains an important basis for understanding the real situation. The Heisenberg model of exchange coupling9 uses the Hamiltonian
H= -2JabSa' Sb-2JbcSb' SC-2JacSa' Sc' (1)
where Sa' Sb' Sc are the spins on the three ions a, b, c, and Jab' etc. are the respective coupling constants. For the case of three equivalent ions Sa=8b=Sc' and Jab=Jbc=Jac=J, this leads to the energy values
E(8) = -J[S(S+ 1) -38a(8a+ 1)], (2)
where Sis the value of the total spin, defined by S=Sa+Sb +Sc' With a distortion of the molecule to twofold symmetry, the Hamiltonian becomes
(3)
where subscript c labels the unique ion, Jab is the unique exchange parameter, and J is the parameter for the ac and bc ion pairs. This gives the following set of energies
E(S,Sab) = -J[S(S + 1) -Sab(Sab+ 1) -Sa(Sa+ 1)]
-Jab [Sab (Sab + 1)-2Sa(Sa+ 1)], (4)
where S ab is the quantum number for the intermediate spin, defined by Sab=Sa+Sb' Writing 6.J=J-Jab , this becomes
E(S,8ab ) = ~J[8(S+ 1) -38a(8a+ 1)]
+6.J[Sab(Sab+1)-2Sa(Sa+1)]. (5)
The general expression for the partial differential scattering cross section for transitions between states 18,S ab) and I 8' ,S~b) iS21
d2a/dU dU).
= (ye2ImeC2) (kllko) [F(Q) ]2Z-1
xexp( -ElkBT)exp( -2W) [cS(hU)+E-E') ]1,
(6)
where y is the magnetic moment ofthe neutron (in nuclear magnetons), e and me are the charge and mass of the electron, ko and kl are the wave vectors of incoming and scattered neutrons, Q is the momentum transfer vector, F(Q) is the magnetic form factor, Z is the partition function, E and E' are the energies of ground and excited states, exp( -2W) is the Debye-Waller factor, and 1 is the transition probability. As discussed below, unequal coupling constants imply unequal metal-metal distances within a triangular complex, but for the purpose of calculating the interference terms we neglect this difference. Spherical averaging over momentum-transfer space then leads to
1 =100- [sin(QR) ]lQR) , (7)
where R is the average chromium-chromium distance. The method of calculating 10 is outlined elsewhere.22 Applied to the present case, with 8 a=Sb=Sc' it gives
10= 15(2S+ 1) (2S' + 1) (2Sab+ 1) (2S~b+ 1)
X {S~b ::b 3~2 r { :;~ :;; 3~2 r (8)
Seven of the allowed transitions for the trichromium(IIl) cluster are summarized in Scheme 1 below. For the horizontal and vertical transitions (6.8=0 or 6.Sab=O) the energy differences are shown in terms of J or aJ, respectively, with signs defined in the senses of the arrows. Energies of diagonal transitions (as ab= ± 1 and as = ± 1 ) can be read as appropriate sums or differences. Values of
J. Chern. Phys., Vol. 98, No. 12, 15 June 1993 Downloaded 02 Jul 2012 to 128.248.155.225. Redistribution subject to AIP license or copyright; see http://jcp.aip.org/about/rights_and_permissions
Jayasooriya et al.: Exchange interactions in chromium (III) clusters 9305
the intensity factor 10 calculated from Eq. (8) are shown in parentheses.
4M 11/2,1> > 11/2,2>
/l~) (20)
(20) (4 I ." ·3J (45)
4M 6M 13/2,0> ) 13/2, I > ;, 13/2,2> ... 1312.3>
With the values of J and AJ typical of these complexes, there are two possible ground states, 1112,1) and 1112,2), and from each of these there are three transitions allowed to the S=3/2 manifold, in agreement with the well known selection rules AS=O, ± 1 and ASab=O, ± 1. Furrer and Glidel showed that for a given S manifold, the sums of intensity of bands with IlSab=O, and with ASab= ±J, are the same.23 Moreover, the average energy of all transitions within the S manifold, weighted with the relative intensities, is given simply by (1lE) = -2(S + 1) (J) where (J) is the mean of the three coupling constants, (2J+Jab )/3.
III. EXPERIMENTS
A. Preparation of complexes
The following method was adopted, in preference to that of Brauer,24 in order to economize in deuterioacetic acid. For the chloride salt, green hydrated chromium(III) chloride, CrCI3.6H20, (8.8 g, 0.033 mol) was dissolved in 100 mI water. A solution of sodium hydroxide (4.0 g, 0.10 mol) was added rapidly with stirring. The precipitate was filtered off, sucked dry without washing, transferred to a large glass evaporating dish, stirred with anhydrous CD3COOD (6.4 g, 0.10 mol) and heated until all had dissolved to a green solution. The time from adding sodium hydroxide to adding acetic acid should not exceed 112 hr. The solution was slowly evaporated to dryness (ca. 12 hr. in an open dish on a steam bath). The sticky green solid was dissolved in dilute HCl (0.5 M), evaporated again to give a granular solid, then recrystallized twice from water containing a little HCI. The preparation worked well with quantities up to four times this scale. The D20 adduct was prepared by heating the H20 adduct (ca. 23 g) in a solution of DCI in D20 (0.55 M, 10 ml) with stirring under a dry atmosphere, and distilling off and replacing the D20, six times. Finally, the solid was dissolved in 7 ml dilute DCI and allowed to cool slowly for 24 hr. Yield: 8.6 g. The nitrate saIt was prepared in the same way starting from Cr(N03h9H20 and HN03. Analyses (C,H,N,Cl) of salts prepared from CH3COOH agreed well with the formulas [Cr30(OOCCH3)6(OH2h]X.nH20, with n=5 to 6 (X =CI), n=5 (X=N03).
B. Spectra
These were obtained on the instruments IN4 and INS at the Institut Laue-Langevin, and on the time focused crystal analyzer TFXA at the Rutherford Appleton Laboratory, Chilton, England. Samples, finely powdered, were sealed in aluminium cans, with thickness calculated to pro-
~ c: :::>
>. a c...
00-
:c c... CI
........ >.
00-
'iii c: Q/
00-c:
em- 1
A ! A'
200 100 em -1
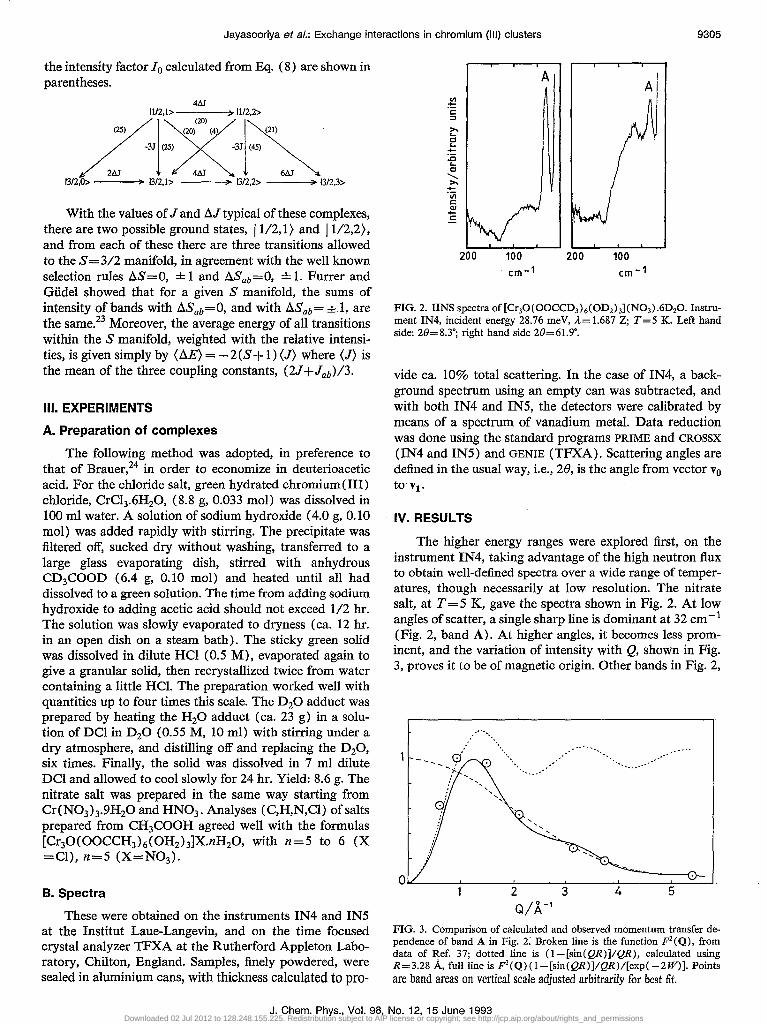
FIG. 2. IINS spectra of [Crp(OOCCD3)6(OD2 )3](N03).6D20. Instrument IN4, incident energy 28.76 meV, ,1,= 1.687 Z; T=5 K. Left hand side: 28=8.3°; right hand side 28=61.9°.
vide ca. 10% total scattering. In the case of IN4, a background spectrum using an empty can was subtracted, and with both IN4 and INS, the detectors were calibrated by means of a spectrum of vanadium metal. Data reduction was done using the standard programs PRIME and CROSSX
(IN4 and INS) and GENIE (TFXA). Scattering angles are defined in the usual way, i.e., 2e, is the angle from vector Vo to v •.
IV. RESULTS
The higher energy ranges were explored first, on the instrument IN4, taking advantage of the high neutron flux to obtain well-defined spectra over a wide range of temperatures, though necessarily at low resolution. The nitrate salt, at T = 5 K, gave the spectra shown in Fig. 2. At low angles of scatter, a single sharp line is dominant at 32 cm-1
(Fig. 2, band A). At higher angles, it becomes less prominent, and the variation of intensity with Q, shown in Fig. 3, proves it to be of magnetic origin. Other bands in Fig. 2,
................... .-
O~----7-----~----~----~----~~~ 2 3 4 5 Q/A-1
FIG. 3. Comparison of calculated and observed momentum transfer de· pendence of band A in Fig. 2: Broken line is the function F2(Q), from data of Ref. 37; dotted line is (I-[sin(QR»)/QR), calculated using R=3.28 A, full line is F2(Q)( l-[sin(QR»)/QR)/[exp( -2W»). Points are band areas on vertical scale adjusted arbitrarily for best lit.
J. Chem. Phys., Vol. 98, No. 12, 15 June 1993 Downloaded 02 Jul 2012 to 128.248.155.225. Redistribution subject to AIP license or copyright; see http://jcp.aip.org/about/rights_and_permissions

9306 Jayasooriya et al.: Exchange interactions in chromium (III) clusters
200K t~i:~·;~:;:." -: -°0 •• "0' ....
':. 4.3K ~~~r::~::"~";':""~ .
200 100
E I em-1
o
FIG. 4. lINS spectra of [Crp(OOCCD3)6(OD2)3]C1.6Hp. Instrument IN4. Incident neutron beam energy 28.76 meV (.Il= 1.687 A), scattering angle 2e= 15.8'. Temperatures T=4.3, 50, and 200 K. The spectra are on the same vertical scale (neutron counts/arbitrary units) but displaced vertically for clarity.
not well resolved, in the range 50-200 cm -I, show over~ll increase in intensity with increasing Q, and are assigned to phonons. These are mainly associated with the nitrate ion, as appears by comparison with the chloride salt, and will not be considered further.
With the chloride salt, the resolved bands are fewer, and all were confirmed to be of magnetic origin by the Q dependence. At T=4.3 K, only one magnetic transition could be detected up to the limit of good statistics, ca. 150 cm -I. It is slightly broader and lower in energy than in the nitrate. On raising the temperature to 50 K, and then to 200 K, this magnetic transition becomes weaker and other bands come in progressively, up to a total of four (Fig. 4, bands A-D; Table I).
In an effort to resolve these bands, the instrument INS was used. With neutrons of wavelength 3.5 A (energy 6.68 meV, ::::53 cm- I
) and resolution ca. 2 cm- I, band A sep
arated clearly into two bands at 26 and 32 cm- I. One other
... i:'r----------------~ E :e d ......
-i:' 'in c: J:! E
Me = CD,
o 50 100 150
>-e -+-
~ d ........ >-+-
'in c:
~ 0L---~--5LO--~-~10LO-~--1~5~0~
FIG. 5. lINS spectra of [Cr30(OOCMe)6(OD2 )3]C1.5DP, Me=CD3, CH3. Instrument TFXA, T=20 K. The spectra are summed over all scattering angles.
magnetic peak was found at ca. 6 cm- I (see also below, band la), and a weak feature at ca. 38 em-I. Further experiments on the TFXA spectrometer strongly indicate that this feature is also real. Spectra of the two salts [Cr30(00CMe)6(OD2)3]Cl.xD20, with Me=CH3 and CD3 , were obtained at T=20 K (Fig. 5). Above 50 cm-I, the spectra are very different, that of the protonated compound being dominated by vibrations of the CH3 groups. In the low energy range, however, three peaks are common to both spectra, at 26, 32, and 38 cm- I
. These are more prominent in the CD3 than in the CH3 compound (Fig. 6, bands 2-4 ), and we consider them to be of magnetic origin. The geometry of the instrument is such that all the neutrons scattered by the sample have the same time of flight to each detector, and the average momentum transfer Q is related to the energy transfer t!:..E by (Q/ A -1)2::::0.5 (t!:..E/ meV).26 At the energy of interest here, the momentum transfer is low (e.g., when t!:..E::::32 cm- I , Q:::: 1.4 A -I; cf. the maximum in the curve in Fig. 3) . No detailed Q-dependence data were obtained, but it was possible to divide the data into groups of higher and lower average Q, and the intensity differences supported our assignment.
The lowest-energy spectra were recorded on the instru-
TABLE 1. Calculated and observed intensities for magnetic transitions S -> S + 1 in [Cr30(OOCCD3)6(OD2)3]C1.5DP (T=200 K).
Initial state Energy popUlation
Band' E/em- I S factorb
A 28 1/2 4.0 B 47 3/2 13.1 C 69 5/2 10.49 D 98 7/2 5.67
'Figure 4. bZ-I(exp[ -E/kbT). CRelative values, calculated from Eq. (8). dSee Fig. 3.
Relative
Transition [F2(Q)] intensity
probabilityC X (l-[sin(QR)]IQR)d Calc. Obs.
0.1556 0.93 0.13 0.23 0.36 0.94 1.0 1.0 0.3286 0.96 0.75 0.53 0.1667 0.99 0.21 0.23
J. Chern. Phys., Vol. 98, No. 12, 15 June 1993
Downloaded 02 Jul 2012 to 128.248.155.225. Redistribution subject to AIP license or copyright; see http://jcp.aip.org/about/rights_and_permissions

Jayasooriya et al.: Exchange interactions in chromium (III) clusters 9307
lb
-9 -4 o Energy Transfer (cm-1 )
FIG. 6. lINS spectrum of [Crp(OOCCD3MOD2)3]CI.5D20, T=1.4 K, wavelength of incident neutron beam 5.5 A. Measured on INS. With a linear baseline, Lorentzian fits to the two bands give the following parameters (position, width, in meV; intensity in arbitrary units): Band la, -0.7800, 0.D11 24,0.002472; band Ib, -0.2228, 0.D18 57, 0.002 732.
ment IN5 at temperature ca. 2 K. Down-scattering spectra in the range ° to 1.5 me V show two well-defined peaks (Fig. 6, bands la and Ib) and the similarity in intensity is 'consistent with their origin from two sets of complexes, present in equal numbers, and having equal transition probabilities.25 In terms ofEq. (5), the transition energy is ilE= IE( 112,2) -E( 112,1) I =41 ilJI·
V. DISCUSSION
A. Assignment and fitting
The energy levels and intensities given in Scheme predict a main progression of magnetic bands corresponding to successive transitions IS) -. 1 S + I), with S = 112, 3/2, 5/2, 7/2, and in the case of an isosceles distortion, side bands due to transitions 1 S ab) -. 1 S ab ± 1) within each S manifold.
It is clear that the sequence of bands in Fig. 4 represents the successive S transitions, the S ab transitions not being resolved in the IN4 spectra. Relative intensities also are in good agreement with the model, when allowance is made for the different thermal populations of the levels, as shown in Table L
Assuming an isosceles distortion, there are two alternative fine structures for the S( 112-.3/2) transition, depending on the choice of ground state, i.e., on the sign of ilJ. If ilJ is positive, the ground state is 1 S,S ab) = 1112, I), and there are three bands, at energies - 3J - 2ilJ, - 3J and -3J+4ilJ, similar in intensity to each other and to the single low-energy line at energy 4ilJ. If ilJ is negative, the ground state is 1112,2), and there are three bands, at energies -3J+6ilJ, -3J and -3J-4ilJ, of which the first is similar in intensity to the low-energy band, the second is about twice the intensity, and the third is comparatively weak. (See Scheme 1.)
The fit to the experimental data is complicated by the fact that there are two sets of complexes with markedly
'different values of ilJ. In set (b), the value of ilJ is small enough to allow both states 1112, I) and 1112,2), to be appreciably populated, so that even at the lowest temperature used in this work, some contribution from hot bands must be allowed for. However, the Sab splittings for this set are small enough not to be resolved in any of our spectra. We began by fitting the observed bands 2-4 to a superposition of one band due to set (b) and two or three bands due to set (a).
On this basis it is clear that band 3 is dominated by the S(1I2-.3/2) manifold of set (b), giving (J)(b):::::-32/3 = - to.7 cm -I. The side bands 2 and 4, however, are not so easy to fit. It is very noticeable that both of these bands are separated from the main band by 6 em -I, which coincides with 41 ilfa) I But this does not match either of the predictions of the isosceles model, as summarized in Scheme 1 above. For ilJ> 0, we expect a band on the high-energy side at -3J+4ilJ=38 cm- I
, as observed, and another on the low energy side at -3J-2ilJ=29 em-I, not 26 cm -I. Moreover the intensities of the satellite lines are calculated to be similar to each other and to that of the main band, which does not agree with the observations, even allowing for the rather large overlap and low signalto-noise ratios in some of the spectra. For the alternative case of ilJ < 0, we again expect a high-energy side-band at -3J-4ilJ=38 cm-I, oflow intensity, but the low-energy side band is at - 3J + 6ilJ = 23 cm - 1, with approximately half the intensity of the main band. Neither of these alternatives fits the data.
We have found that a much more satisfactory fit can be obtained if we assume a general distortion, with all three J values different. In this case the eigenvalues of energy can no longer be calculated by the elementary methods referred to above but the results can be derived intuitively from those of the limiting isosceles cases and they have been confirmed by detailed calculations. It is convenient to replace the individual pairwise coupling constants by symmetrized parameters (J), D, and e, as follows:
Jab= (J) + D cos e, Jbc= (J) +D cOS(e+21T/3),
Jac= (J) + D cos( e+41T/3).
(9a)
(9b)
(9c)
In this scheme (J) is the mean of the three coupling constants, D measures their spread, and e measures the shape of the triangle, with limiting isosceles forms at e=1T/3, 21T/3, 1T, etc., and scalene forms at intermediate values.27 The correlation diagram is shown in Fig. 7. The energies behave in one of two ways, either independent of e, or periodic with maxima and minima at the isosceles limits, as shown. These results were first obtained by Jones, Sams, and Thompson, using general quantum-mechanical arguments, including a proof that the sublevels within a given S manifold do not cross.8 The energy values plotted in Fig. 7 were obtained by diagonalizing a matrix which includes the mixing of all combinations of microstates of the system of three spins s=3/2, i.e., each chromium atom is assigned four microstates with mz =3/2, 112, -112, -3/2. For the case of three equivalent chromium atoms,
J. Chern. Phys., Vol. 98, No. 12, 15 June 1993 Downloaded 02 Jul 2012 to 128.248.155.225. Redistribution subject to AIP license or copyright; see http://jcp.aip.org/about/rights_and_permissions

9308 Jayasooriya et al.: Exchange interactions in chromium (III) clusters
J+D
J-D
E
40
10 20
o
---------------r=r= 1234 1234
o 120 240 360
e (degrees)
FIG. 7. (top) Variation of the three Jvalues for magnetic coupling in the triangular cluster Cr3' as functions of the shape parameter e,.at constant (J) and D [see text, Eqs. (9)]. (center) Variation of energies E of the eigenstates of the S = 1/2 and S = 3/2 manifolds, as functions of e. Transitions from the ground state, at the two isosceles limits, are shown by the vertical arrows. (bottom) Variation of relative transition intensities Io(N), N=1-5 [Eqs. (11)] as functions of e. The values at the isosceles limits of e=o', 60', 120', etc. are the numbers shown in Scheme 1. The finite values shown for 10 (5) at intermediate values of e are exaggerated.
the wave functions for the various permutations of mz have been calculated by Bates and Jasper28 and by Tsukerblat et al. 29
The formulas for transition probabilities given above is valid only at the isosceles limits. When the selection rules are applied at these limits, it is found that in both the acute and obtuse isosceles cases, transitions from the lower sublevel of the S = 1/2 manifold are allowed only to the lower three sublevels of the S = 3/2 manifold. Detailed calculations show that at intermediate values of 0, the intensity parameters 10 for the transitions that correlate to these three pass through maxima or minima at the isosceles limits as shown in Fig. 7. The fourth transition, forbidden at the isosceles limits, becomes allowed at intermediate values of 0, but its intensity remains neglible. In summary, the energies and intensities can be represented as periodic functions of 0, as follows:
aE(1)=6D,
aE(2) = -3(]) -6D-LSD cos 30,
aE(3) = -3(J) + LSD cos 30,
aE(4) = -3(]) +6D+ 1.5D cos 30,
aE(5)::::; -3(]) + l2D-1.5D cos 30,
10 (1) ::::;20,
(lOa)
(lOb)
(lOc)
(lOd)
(We)
(lIa)
80
>..... 'iii c (]) ..... c
40
3
.: 1a . 2
'.'
Energy transfer / cm-1
FIG. 8. IINS spectrum of [Crp(OOCCD3)6(ODzh]C1.5DzO, T=5 K. Measured on IN5. Incident neutron beam energy 13.87 meV, A=3.5 A. The curve shows 10 as a function of E for the scalene model, with the parameters e, (J), and D given in the text, using a linear baseline and Lorentzian band shapes, of width calculated from the resolution function of the instrument. The vertical scale of the data is adjusted for best to the curves.
10 (2) ::::;23-2 cos 30, (lIb)
10 (3) ::::;35+ 10 cos 30, (llc)
10 (4)::::; 12-8 cos 30, (lId)
10 (5) ::::;0, ( lIe)
where the numbers in parentheses denote the transitions as labeled in Fig. 7. Taking the values of D from the energies of the lowest transition, for each of the two sets of complexes, a least-squares curve fit gave the spectrum shown in Fig. 8, in satisfactory agreement with experiment, with the parameters shown in Table II.
The results confirm the findings of previous authors, that there are two sets of trinuc1ear complexes in the crystal, with different degrees of distortion from threefold symmetry. The difference is that previous authors have used the isosceles model and have reported parameters equivalent to J and AJ of our eq. (5). They have also specified the alternatives of obtuse or acute isosceles triangles, i.e., they have reported the sign as well as the magnitude of aJ. We obtain the best fits with scalene triangles. Our parameter D is defined to be always positive. The asymmetry parameter aJ for the isosceles model is related to ours by aJ = - (31 2)D when 0=0, aJ=+(3/2)D when 0=180°. Our parameters D agree with, and improve upon, previous data.
. The new structural information obtained from the present data is that, at least in the case of the more distorted set of complexes, the symmetry cannot be described as twofold. We find 0=33°=j=4°, and the best estimates of the three J values for this set of complexes are -11.5 ±O.2, -10.5 ±0.2, and -9.7±0.2 cm- I .
J. Chern. Phys., Vol. 98, No. 12, 15 June 1993
Downloaded 02 Jul 2012 to 128.248.155.225. Redistribution subject to AIP license or copyright; see http://jcp.aip.org/about/rights_and_permissions

Jayasooriya et al.: Exchange interactions in chromium (III) clusters 9309
TABLE II. Coupling parameters' for the two sets of (Cr3+)3 clusters (a) and (b) in [CrJO(OOCMe)6(aq)3]CI.5aq.
T (J)a Method K cm- 1
Cp(T)b 1.5-280 -10.9 Opticalb 7 -11.45 INS" 1.4 IINS 1.4, 5 -1O.6±O.2
a(J) D and e are defined in Eqs. (9). bMe=CH3, aq=H20. cMe=CDJ , aq=D20.
1Y' cm- 1
1.0 1.55 1.57
1.07±0.2
ea deg
34±3
dparameters were reported in terms of the isosceles model, Eq. (5).
B. Comments on the dynamic model
(J)b cm- 1
-10.3 -10.3
-10.6
It is noticeable that our value of 8 is close to 30·, which means that in 8 space the molecular shape is almost midway between the two limits of an acute-angled or an obtuse-angled isosceles triangle. A value 8=30· would be consistent with a dynamic model in which the triangular molecules fluctuate over the whole range of e, while maintaining constant values of (J) and D. This model was previously suggested by Jones et aL 8 on the basis of the energy correlation diagram shown in Fig. 7. The two sublevels of the S= 1/2 manifold are independent of 8, hence in the limit of low temperature, and in the absence of external forces, the metal clusters are predicted to be fluxional with zero activation energy. At higher temperatures, an isosceles limit might be favored, with three equivalent potential energy minima, and activation barriers between them. This is the familiar "puckered Mexican hat" energy surface which has been discussed in connection with Jahn-Teller30
and mixed-valency31 problems. But the energy barriers would be low, since the splitting of the sublevels in each manifold is small, so that no one sublevel could be populated exclusively.
The dynamic model was criticized by Giidel on the grounds that it is inconsistent with the polarization characteristics of the luminescence spectrum.9 The two components of the 4A ..... 2 E transition which arise because of the symmetry loweringl5 have different polarization ratios for light polarized parallel and perpendicular to the c axis of the crystal. While we also favor a static model rather than a dynamic one, we disagree with Giidel's argument for the following reasons. It was claimed that the polarization could only be the result of a distortion which is fixed in space. This is true, but one fixed distortion which is undeniably present is the low symmetry of the crystal structure itself. As noted above, the space group is P21212 at room temperature (changing to P212121 at low temperature). Owing to an accident of the values of a and b, the crystal approximates fairly closely to a hexagonal symmetry about the c axis. The common crystal habit is large pseudohexagonal prisms, and the c axis is the easy axis of magnetization.32 It is therefore not surprising that there should be a marked anisotropy of any physical property of the crystal. Within the unit cell the complex ions are oriented so that all the planes of the Cr3 triangles are roughly parallel to the c axis, but they fall into two groups: the planes
Db cm- 1 Reference
0.35 lld ;:::0.35 15d
0.45 25d
This work
within a group are all parallel, but the planes of one group are roughly perpendicular to those of the other group.
Differences between properties measured in the c direction, and properties measured in the ab plane, do not necessarily reflect distortion of the individual triangular clusters. In a recent FT -Raman study we have found such differences in the polarization ratios of the breathing vibrations ViCr30): these give information about the polarizability ellipsoids of these modes, but again because of the particular packing arrangement of the molecules, they do not enable us to distinguish between equilateral and distorted forms of the triangles.33
Our evidence for a static model is the linewidths of the IINS transitions. If the ground state of the molecule were truly fluxional, all values of 8 would be equally probable. Thus all the S= 1/2 ..... S=3/2 transitions would be broadened to the extent of the amplitUde of the fluctuations in the S=3/2 levels, which is 3 D=4.5 cm- 1 in the case of set (a) of complex ions, while no such broadening would apply to the internal transition of the S = 1/2 manifold. In our interpretation, band 2 is one of the lines which would be broadened to this extent and band 1 is one of those which would not, since it is assigned to S= 1/2 ..... S= 1/2. The measured widths are, band 2 0.6 cm-l, band 1 1.4 cm -I (full widths at half-height, from the curves fitted to band 2 in Fig. 6 and band la in Fig. 8). The difference is fully accounted for by the different resolution functions of the instruments at the neutron wavelengths used.
In principle, a more accurate crystal structure determination could confirm this conclusion. It is important to note that for a given value of our asymmetry parameter D, variation of the shape parameter 8 takes the triangle through a series of scalene and isosceles geometries, but never visits the equilateral geometry even though the structure averages to equilateral. Given the measured value 8:;:::30·, the static model requires scalene triangles, in each of which the three Cr-Cr distances, the three Cr-O distances, and the three Cr-O-Cr angles, are roughly in arithmetical progression. The dynamic model requires equilateral triangles, with each metal atom disordered over a continuous range of coordinates close to the mean position.
This work was partly motivated by an aim to characterize symmetry lowerings in paramagnetic cluster complexes, which are driven by the spin coupling (or rather by the metal-metal bonding interactions which show up as
J. Chern. Phys., Vol. 98, No. 12, 15 June 1993 Downloaded 02 Jul 2012 to 128.248.155.225. Redistribution subject to AIP license or copyright; see http://jcp.aip.org/about/rights_and_permissions

9310 Jayasooriya et al.: Exchange interactions in chromium (III) clusters
spin coupling effects). The possibility of such interactions was envisaged by Jahn and Teller,34 and has been discussed several times from the theoretical point of view as a "multicenter Jahn-Teller effect,,35 or "magnetic Jahn-Teller effect.,,7 The argument is that the symmetrical CrjII cluster is unstable when the coupling is antiferromagnetic since the ground state, S = 1/2, is fourfold degenerate. This degeneracy is lifted when the symmetry is lowered, and in the low-temperature limit, there is an electronic energy gain equal to half the splitting of the ground state. It has been pointed out6 that nearly all of the reported crystal structures of homonucIear complexes of the present type are of less than trigonal symmetry, and all the exceptions except one possess considerable disorder, so that the predicted symmetry lowering could be present, but concealed. (The remammg exception is the compound [Fe30(OOCCMe3) 6(MeOH) 3]CI which is currently under study.36) Although each one of these examples could be written off as a crystal packing effect, taken together they amount to circumstantial evidence of an intrinsic tendency towards structural distortion.
What are needed now are more accurate crystal structures of the present complex, over a range of temperatures. The search for the magnetic Jahn-Teller effect continues.
ACKNOWLEDGMENTS
This work was supported by the Science and Engineering Research Council. We thank Professor H. U. Glidel for discussion and copies of prepublication MSS, and Dr. J. Tomkinson and Dr. U. Steigenberger for help with the TFXA measurements.
1 A. Werner, Ber. Dtsch. Chern. Ges. 41, 3447 (1908). 2R. F. Weinland, Chern. Ztg. 32, 812 (1908); Ber. Dtsch. Chern. Ges. 41,3236 (1908).
3L. A. Welo, Phys. Rev. 32, 320 (1928); Philos. Mag. 6, 481 (1928). 4L. E. Orgel, Nature 187, 504 (1960). 5B. N. Figgis and G. B. Robertson, Nature 205, 694 (1965). 6R. D. Cannon and R. P. White, Prog. Inorg. Chern. 36, 195 (1988). 7T. Murao, Phys. Lett. A 49,33 (1974). 8D. H. Jones, J. R. Sams, and R. C. Thompson, J. Chern. Phys. 81, 44
(1984). 9R. L. Martin, in New Pathways in Inorganic Chemistry, edited by E. A.
Y. Ebsworth, A. G. Maddock, and A. G. Sharpe, (Cambridge University, Cambridge, 1968), pp. 175-231.
IOH. U. Giidel, J. Chern. Phys. 82, 2510 (1985). We regret having overlooked this paper when compiling Ref. 6.
11 M. Sorai, M. Tachiki, H. Suga, and S. Seki, J. Phys. Soc. Jpn. 30, 750 (1971 ).
12G. Soda, (unpublished experiments), cited in Ref. 11. 13S. C. Chang, and G. A. Jeffrey, Acta Crystallogr. B 26, 673 (1970). 14K. J. Schenk, and H. U. Giidel, Inorg. Chern. 21, 2253 (1982). ISJ. Ferguson, and H. U. Giidel, Chern. Phys. Lett. 17, 547 (1972). 16A. P. Ginsberg, Inorg. Chim. Acta Rev. 45 (1971). 17J. S. Griffith, Structure and Bonding, edited by P. Heinrich, et al.
(Springer Verlag, Berlin, 1972), Vol. 10, p. 87. ISy. A. Gaponenko, M. Y. Eremin, and Yu. Y. Yablokov, Fiz. Tverd.
Tela 15, 1336 (1973); SOy. Phys., Solid State 15, 909 (1973). 19J. T. Wrobleski, C. T. Dziobkowski, and D. B. Brown, Inorg. Chern. 20,
684 (1981); C. T. Dziobkowski, J. T. Wrobleski, and D. B. Brown, ibid. 20, 671 (1981).
2oB. S. Tsukerblat, M. I. Belinskii, and B. Ya. Kuyavskaya, Inorg. Chern. 22,995 (1983).
21 W. Marshall and S. W. Lovesey, The Theory of Thermal Neutron Scattering (Clarendon, Oxford, 1971).
22R. P. White, J. A. Stride, S. K. Bollen, N. Chai Sa-ard, G. J. Kearley, U. A. Jayasooriya, and R. D. Cannon, J. Am. Chern. Soc. (in press).
23 A. Furrer, and H. U. Giidel, Helv. Phys. Acta 50,439 (1977). 24G. Brauer, Handbook of Preparative Inorganic Chemistry (Academic,
London, 1965), Vol. 2, p. 1371. 25U. A. Jayasooriya, R. D. Cannon, R. P. White, and G. J. Kearley,
Angew. Chern. 101, 923 (1989); Angew. Chern Int. Ed. Engl. 28, 930 (1989).
26See, e.g., Experimental Facilities at ISIS, edited by B. C. Boland, Rutherford Appleton Laboratory, SERC, Chilton, Didcot, UK, February, 1990; Robertson, S. T., Computer Analysis of TFXA Data, Issue 1, Rutherford Appleton Laboratory SERC, Chilton, Didcot, UK, August, 1988. .
27The expressions are <J)=(1/3)~Jij; U=(2/3)~(Jij-<J»2, i.e., D=Y2aJ where aJ is the standard deviation; and cos 38= (4/ 3)D-3~(Jir<J»3.
2SC. A. Bates, and R. F. Jasper, J. Phys. C 4,2330 (1971). 29B. S. Tsukerblat, M. 1. Belinskii, and A. Y. Ablov, Phys. Status Solidi
b 51, K71 (1971); Fiz. Tverd. Tela 15, 29 (1973); SOY. Phys. Solid State 15, 19 (1973).
301. B. Bersuker, The Jahn-Teller Effect and Vibronic Interactions in Modern Chemistry (Plenum, London, 1983), pp. 48-49.
31 R. Clad, and J. Wucher, C. R. Acad. Sci. Paris 260, 4318 (1965). 32J. P. Launay and F. Babonneau, Chern. Phys. 67, 295 (1982); S. A.
Borshch, 1. N. Kotov, and 1. B. Bersuker, Chern. Phys. Lett. 89, 381 (1982); R. D. Cannon, L. Montri, D. B. Brown, K. M. Marshall, and C. M. Elliott, J. Am. Chern. Soc. 106, 2591 (1984).
33 J. P. Bourke, R. D. Cannon, R. Grinter, and U. A. Jayasooriya, Spectrochim. Acta (in press).
34H. A. Jahn, and E. Teller, Proc. R. Soc. London, Ser. A 161, 220 (1937); H. A. Jahn, ibid. 164, 117 (1938).
35y. Z. Polinger, L. F. Chibotaru, and 1. B. Bersuker, Phys. Status Solidi b 129, 615 (1985).
36R. D. Cannon, S. A. arapKoske, O. Y. Nielsen, J. A. Stride, U. A. Jayasooriya, D. Summerfield, G. J. Kearley, and R. P. White (to be submitted).
37R. E. Watson, and A.I. Freeman, Acta Crystallogr. 14, 27 (1961).
J. Chern. Phys., Vol. 98, No. 12, 15 June 1993 Downloaded 02 Jul 2012 to 128.248.155.225. Redistribution subject to AIP license or copyright; see http://jcp.aip.org/about/rights_and_permissions


![From trinuclear cluster [Mn3(PhCO2)6(THF)4] - Royal Society of](https://img.dokumen.tips/doc/110x75/622fede7a4be99274d021bf4/from-trinuclear-cluster-mn3phco26thf4-royal-society-of.jpg)


