Embed Size (px)
Citation preview

Journal of Substance Abuse Treatment 46 (2014) 472–481
Contents lists available at ScienceDirect
Journal of Substance Abuse Treatment
Examining the performance of the brief addiction monitor
Karl G. Nelson, Ph.D. a,⁎, Kevin Young, Ph.D. b, Heather Chapman, Ph.D. b
a Department of Psychology, Indiana University Northwest, Gary, IN 46408, USAb VARC, Louis Stokes Cleveland VA Medical Center, 10701 East Boulevard, Cleveland, OH 44106, USA
a b s t r a c ta r t i c l e i n f o
⁎ Corresponding author.E-mail address: [email protected] (K.G. Nelson).
0740-5472/$ – see front matter © 2014 Published by Ehttp://dx.doi.org/10.1016/j.jsat.2013.07.002
Article history:Received 1 October 2012Received in revised form 1 July 2013Accepted 2 July 2013
Keywords:Substance abuseAddictionMeasurementReliabilityValidity
The Center for Excellence in Drug Abuse Treatment and Education (Center for Excellence in SubstanceAbuse Treatment and Education (CESATE; 2010). Brief Addiction Monitor: Manual of Operations.Philadelphia, PA) recently suggested that Veterans Affairs' (VA) addictions treatment programs, in orderto encourage measurement based care, begin using a new measure of substance abuse, the Brief AddictionsMonitor (BAM). To date, only one study Caccolia et al, 2013. Development and initial evaluation of the BriefAddiction Monitor (BAM). Journal of Substance Abuse Treatment, 44, 256–63. doi: http://dx.doi.org/10.1016/j.jsat.2012.07.013) has examined the psychometric properties of a version of this instrument. However, thisstudy did not use the version of the BAM currently available to most VA providers via the mental healthassistant software; rather, the authors reported the properties of a BAM where most of the items hadcontinuous (or near continuous) response options. The current study seeks to provide data on the versionof the BAM which uses 5 point Likert scale response options for its questions, the version available on themental health assistant software. Based on data from more than 700 veterans enrolled in out-patient (OP)and in-patient (IP) addictions treatment programs, this study examined the factor structure, reliability, andvalidity of this version of the BAM. Across both groups, results suggested that the BAM lacked a reliablefactor structure, in contrast to the findings from the earlier study. However, a single scale, composed of aminority of items on the BAM, showed promise. A minority of the items (five) provided valid informationacross both OP and IP samples when applied individually, as indicated by convergent and divergent validitycomparisons with other measures of functioning; tracking changes in functioning over the course oftreatment; and correlating with changes in convergent and divergent validity measures. This partiallysupported the CESATE (CESATE; 2010). Brief Addiction Monitor: Manual of Operations. Philadelphia, PA)call to use the individual BAM items. Overall, results suggested that changing the structure of the responseoptions may have had a negative impact on the psychometric properties of the BAM.
lsevier Inc.
© 2014 Published by Elsevier Inc.
Assessment of addictive behaviors, and the consequences of suchbehaviors, has the potential to guide treatment programs inidentifying areas for improvement, guiding appropriate selection oftreatment setting, and help track individual patient progress overtime (Harris, Humphreys, Bowe, Kivlahan, & Finney 2009; Tiet,Byrnes, Barnett, & Finney 2006; Tiet, Ilgen, Byrnes, Harris, & Finney2007). In order to live up to this potential, the instruments used mustprovide reliable, valid, and clinically useful information. Within theVeterans Affairs (VA) system, the Addiction Severity Index (ASI;McLellan, Kushner, Metzger, & Peters 1992) has served these purposesthrough administration as a structured clinical interview (McLellanet al. 1992), on computer (Butler et al. 2001), or as a self-reportinstrument (Rosen, Henson, Finney, & Moos 2000). Unfortunately, theconsiderable efforts involved in administering the ASI, particularlythe interview version, represented a barrier to continued use of thisinstrument. As the VA moves towards greater implementation ofempirically supported treatments and methods, the need for reliable,
valid, and clinically useful assessment instruments has increased.Recently, members of the Philadelphia Center of Excellence in Sub-stance Abuse Treatment and Education (CESATE) suggested that anew measure, the Brief Addiction Monitor (BAM; CESATE, 2010),might better serve at least some of these purposes and do so with abriefer assessment instrument.
According to CESATE (2010), the BAM contains 17 items (one itemcontains multiple sub-parts to determine days of use for varioussubstances over the pastmonth; see Table 1 for item descriptions) andshould provide information that treatment providers and servicescan use to evaluate interventions, evaluate systems of care, and guidepatient treatment and treatment modifications as therapy progresses.Similar to the ASI, the CESATE (2010) suggested that patients couldcomplete the BAM in either a self-report format or a clinician-administered format. The materials included in the Brief AddictionMonitor: Manual of Operations (CESATE, 2010) also suggest using theBAM-derived information from individual items, and changes inthese individual items across repeated administrations, to guide andtrack treatment (Harris et al., 2007). The manual of operationsincluded several suggested aggregate scores, but indicated that these
473K.G. Nelson et al. / Journal of Substance Abuse Treatment 46 (2014) 472–481
scores (Risk Factors for substance use, Protective Factors againstsubstance use, and Self-Reported Substance Use) had a basis inclinical judgment, rather than psychometric analyses. Based on theevidence presented in the manual of operations (CESATE, 2010), theBAM appeared to lack evidence for validity at either the item level oraggregate level of analysis. Nonetheless, the CESATE (2010)information called for tracking patient changes over time, throughBAM administration at the time of treatment intake and periodicallythereafter, and using the individual item responses as a guide totreatment planning. In addition, the CESATE also suggested thatclinicians could interpret changes in item scores as indicatingimprovements and decrements in addictions-related functioning.The repeated administration might allow clinicians to provide anevidence based approach for evaluating treatment progress, a focusof recent attention within the VA system. Furthermore, the testinformation called for administering all BAM items in discrete form(hereafter referred to as the BAM-D), although the manual includeda small normative sample based not on discrete item responses, butrather on analysis of a different, continuous item response BAM form(hereafter referred to as the BAM-C). These eccentricities in themanual of operations naturally lead to questions regarding thevalidity and reliability of this assessment instrument.
To date, only one study (Cacciola et al. 2013) has presentedpsychometric information regarding the BAM, and this focused on theBAM-C. Although this study seems to indicated the presence of adefined factor structure, adequate test–retest reliability (one week,across raters) and showed evidence of both sensitivity to change andconcurrent validity, this evidence came from the BAM-C in which amajority of items had near continuous response options. While theBAM-C may maintain its factor integrity across future studies,changing the response options from near continuous (number ofdays in the last month, up to 30) to predominantly Likert-typeresponse option could have a significant effect on the psychometricproperties of said instrument. For example, Cox et al. (2012) recentlydemonstrated that a relatively minor change in response options(from 2 to 4) had major effects on the psychometric properties ofthe MMPI-2, particularly improvements in scale reliability and cor-relationwith criterionmeasures. It stands to reason that reversing thisprocess might have similar, and in this case negative, effects.Therefore, it remains uncertain the extent to which BAM-C psycho-metric evidence may apply to the BAM-D. This may give clinicianspause since clinicians working for the VA have access to the BAM-Dthrough a computerized assessment program,mental health assistant.Despite this, clinicians and programs will be asked to use the BAM-D,including calls to use the BAM-D in assessing the implementationand effectiveness of new programs, like contingency management(McKay, 2009), and, therefore, clinicians could benefit from additionalinformation about this version of the BAM. Although the CESATE(2010) called for use of the BAM-D and described it as a short, reliable,and valid instrument, the evidence supporting the reliability andvalidity of the BAM-D currently does not appear to exist. This seemsparticularly odd given the number of circumstances, populations andcontexts in which BAM-D use is being encouraged. Typically,assessment instruments (such as the MAST, the Timeline Followbackseries, or the MMPI-2) have demonstrated reliability and validityprior to wide-spread, large-scale implementation (e.g., Murphy &Davidshofer 2005). This leads to the purpose of the current study.
This study sought to provide initial performance and psychometricinformation on the BAM-D for both in-patients (IPs) and out-patients(OPs) in addictions treatment. The examination focused on severalareas. First, the research provided information on BAM item-levelresponses in aggregate. Second, the researchers expected the BAM-Dscores, based on calls to use this measure to guide changes in treat-ment, to change over the course of treatment. Third, the researchexamined whether the suggested factor structure, identified in theCacciola et al. (2013) article on the BAM-C, existed within the BAM-D.
Fourth, the researchers expected the BAM to demonstrate conver-gent validity, at the item and Aggregate levels, with appropriateASI and Quality of Life scores, and divergent validity with unrelatedscores from such measures, when administered at the time oftreatment program intake. Fifth, the researchers expected movementin BAM-D change scores, over the course of treatment, to correlatesignificantly with similar movement on ASI and Quality of Life basedchange scores. Sixth, the researchers explored whether the BAM-Ditems or Aggregate scores could predict treatment completion. Itseemed reasonable to hypothesize that Risk Factor items and Sub-stance Use items would predict lower likelihood of treatment com-pletion, while the Protective Factor items would predict higherlikelihood of completion.
1. Method
1.1. Participants
Veterans (N = 810) admitted to any addictions treatment pro-gram in a Midwestern Veterans Affairs System provided data forthis study. Among veterans seeking addictions treatment, men pre-dominated (N = 738, 91.1%). Participants ages ranged from 21 to78 years (M = 49.93, SD = 10.42; OP M = 51.03, SD = 10.30; IPM = 49.65, SD = 10.43). The majority of participants fell into one oftwo ethnic groups: African-American (N = 433, 53.5%, OP N = 103,63%, IP N = 330, 50.9% ) and Caucasian (N = 347, 42.8%, OP N = 45,27.8%, IP N = 302, 46.6%); the remainder reported Native American(N = 4, 0.5%, all IP), Hispanic (N = 9, 1.1%, all IP), and Pacific Islander(N = 4, 0.5%, 1 OP, 3 IP) heritages, or choose not to report (N = 13,1.6%, all OP). The majority of participants entered into the 28 dayresidential inpatient program (IP; N = 648, 80%), rather than the 28day intensive outpatient (OP; N = 162, 20%), treatment programs.Both the inpatient and outpatient treatment teams based their workon an empirically supported Cognitive-Behavioral Therapy manual(Daley & Mercer 2002), but individual treatment teams adjusted thetreatment protocols to meet their individual needs. Participantsentered either the IP or OP program based on an assessment of theirneeds via American Society of Addiction Medicine criteria. Both IPand OP participants completed post-treatment assessments partic-ipated in 28 days of addiction treatment.
1.2. Measures
1.2.1. Brief addiction monitorThe Brief Addiction Monitor-Discrete response version (BAM-D;
CESATE, 2010) contains 16 items requiring a single response and oneitem, with seven sub-items, designed to assess frequency of drug useover the past month (for a total of 17 items). The instrument uses fourdifferent response sets. Response options include indicating Poor toExcellent on a five-point Likert-type scale (one item), day ranges forthe number of days patients engaged in targeted behaviors (0, 1–3, 4–8, 9–15, and 16–30; 10 items), a Likert-type response set ranging fromNot at All to Extremely (five items), and a single item using a yes/noresponse format. As mentioned above, no published research cur-rently addresses the factor structure or psychometric properties ofthe BAM-D.
Cacciola et al. (2013) addressed the psychometric properties ofthe BAM-C. As noted earlier in this report, a major difference lies in theuse by Cacciola et al. of continuous, open ended response options (e.g.,reporting the number of days), rather than the discrete optionsmentioned in the previous paragraph. Dan Kivlahan, Ph.D. (personalcommunication, April, 2011) indicated that the change in responseoptions had its basis in VistA limitations that only allowed for adiscreet number of responses. Please note that the VA currently usesthe BAM-D version, which the current paper studied, not the BAM-C
474 K.G. Nelson et al. / Journal of Substance Abuse Treatment 46 (2014) 472–481
tested in the Cacciola et al. study. Exploratory Factor Analysis of theBAM-C yielded three factors, which did not completely overlap withthe suggested CESATE Aggregates: Protective, Medical and Psycho-logical Status, and Risk Factors. Eleven of the items loaded onto oneof the three suggested factors. Cacciola et al. reported BAM-C alphasof 0.78, 0.67, and 0.71, respectively. All three factors yielded test-retest reliability scores of 0.75 or higher. However, significantlychanging response options makes it difficult or impossible to useBAM-C psychometrics to predict BAM-D performance.
1.2.2. Addiction Severity IndexThe Addiction Severity Index (ASI), administered in a self-report
format (Rosen et al., 2000), provides information on a variety ofaddictive behaviors, and the effects thereof, through seven compositescores. The composite scores provided information on severity ofAlcohol Use, Drug Use, Psychiatric Problems, Medical Problems,Family/Social Problems, Legal Problems, and Employment Problems.The scores on the scales ranged from 0.00 to 1.00, with higher scoresindicating more severe, negative impacts on participants' lives duringthe 30 days prior to completing the ASI. Past research has suggestedsimilar scores when comparing self-report and clinician-administeredASI versions (Rosen et al., 2000).
1.2.3. World Health Organization Quality of Life-BREFThe World Health Organization Quality of Life-BREF (WHOQOL-
BREF; World Health Organization Quality of Life Group 1998)contains 26 items designed to assess four sub-areas of quality oflife: Physical Health, Psychological Health, Social Relationships, andEnvironment. It also generates a single, global score designed toassess overall quality of life and general health. The WHOQOL-BREFscores have generally proven to have high test-retest reliability,acceptable internal consistency, and strong agreement with similarsubscale scores derived from the 100-item WHOQOL-100 instrumentfrom which the WHOQOL group derived the WHOQOL-BREF (Huang,Wu, & Frangakis 2006; O'Carroll, Smith, Couston, Cossar, & Hayes
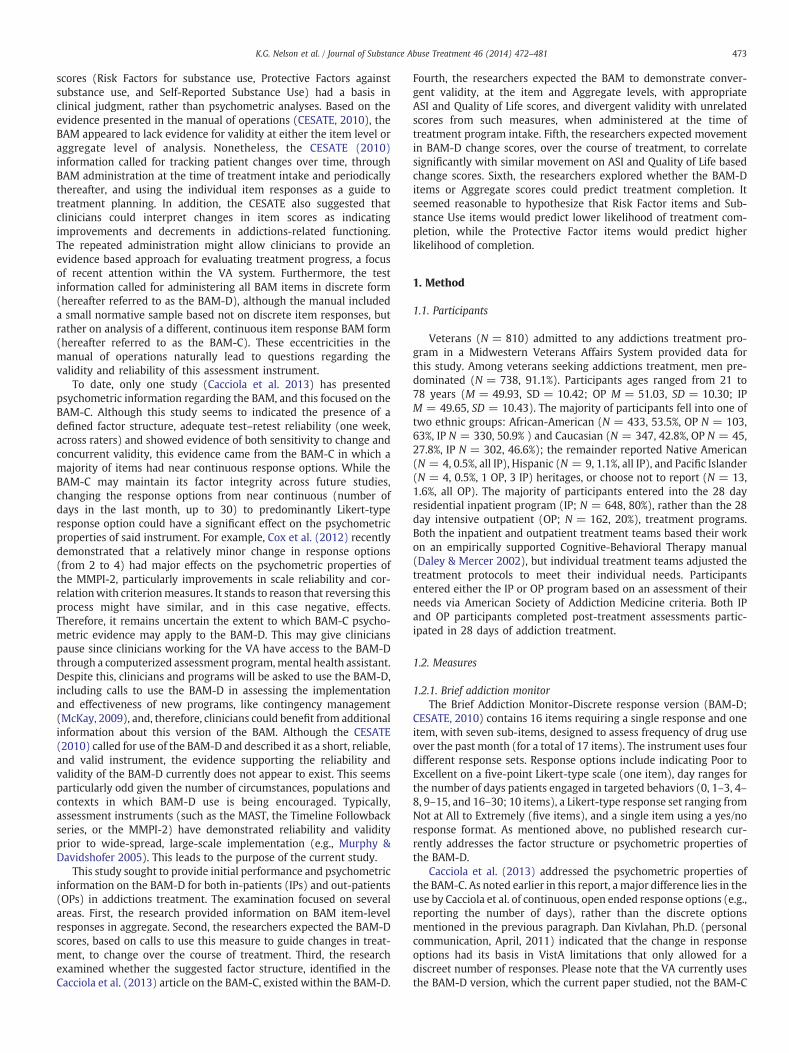
Table 1BAM in-patient responses at intake, discharge, and item effect size of changes over the cou
BAM item description Responseanchors
Bam responses administration 1Percentages (N = 617)
0 1 2 3
1. Physical Health E–P 2.8 8.5 23.8 40.22. Sleeping Problems Days 5.7 7.9 13.5 20.43. Emotional Disturbance Days 6.8 9.1 14.4 24.64. Drinking Alcohol Days 24.8 15.9 10.2 13.35. Heavy Alcohol Use Days 34.5 10.9 11.5 14.66. Drug Use Days 34.5 13.9 11.0 10.97a. Marijuana Use Days 62.6 15.9 5.5 5.57b. Sedative Use Days 89.6 4.4 3.4 0.57c. Cocaine Use Days 55.8 11.5 8.9 8.67d. Stimulant Use Days 98.4 1.0 0.2 0.27e. Opiate Use Days 77.1 5.7 4.1 3.27f. Inhalant Use Days 99.2 0.6 0.0 0.27g. Other Drug Use Days 92.9 2.3 1.8 1.98. Cravings/Urges NAA–E 9.1 13.0 19.0 30.69. Abstinence Confidence NAA–E 2.6 3.2 13.5 27.910. Self-Help Meetings Days 49.6 18.8 17.0 8.611. Risky Situations Days 18.0 12.8 14.6 18.312. Religion/Spirituality NAA–E 18.0 12.6 20.4 19.813. Healthy Activities Days 74.3 6.2 5.8 5.814. Income Sufficient N–Y 63.4815. Arguments NAA–E 35.2 22.4 17.3 17.016. Social Support Contact Days 20.9 14.7 18.2 18.517. Progress Satisfaction NAA–E 13.9 13.9 24.5 24.8
Notes: BAM = Brief Addiction Monitor (CESATE, 2010); Response Anchors: E–P (Excellent,NAA–E (Not at All, Slightly, Moderately, Considerably, Extremely), N–Y (No, Yes); d = Cohsizes for changes in item scores over the course of treatment.
2000; Skevington et al., 2004; World Health Organization Quality ofLife Group 1998).
1.3. Procedures
Patients completed the BAM-D, ASI, and WHOQOL-BREF uponentry (as part of the intake process on the first day) into addictionstreatment. Treatment program staff also asked patients to completethese measures at the end of treatment; both IP and OP treatmentincluded multiple hours of treatment each day and lastedapproximately four weeks. (Although individuals in OP treatmentslept off-campus, they completed the same treatment program asIP participants in this study.) Demographic information came fromdata gathered for the creation of patient charts. Treatment programstaff entered all data into a program evaluation database designedto guide program improvement. For research purposes, thetreatment staff provided a de-identified database for analysis.Since all patients completed these instruments as part of treatmentintake for the addictions treatment program, essentially all patientsprovided data for this study. The local Veterans Affairs InstitutionalReview Board approved this research. With the exception of item-level responses in Table 1, all BAM-D items associated with theproposed Principal Factors Aggregate underwent reverse scoring sothat higher scores on all items would indicate increased severity ofsubstance-related problems.
2. Results
2.1. Examination of OP and IP Data to check for demographic differences
An examination of OP and IP demographic characteristics testedfor differences between the veterans in the different treatmentsettings. Age (F(1, 804) = 2.27, p N .05) and gender, (χ2 = 1.10,p N .05) yielded no differences. Ethnicity for the two primary ethno-cultural groups did yield a statistically significant difference (χ2 =14.67, p b .001), with African-Americans more likely to receive IP
rse of treatment.
BAM responses administration 2Percentages (N = 465)
d
4 0 1 2 3 4
24.6 5.3 21.6 34.2 30.5 8.4 0.5552.5 10.7 14.9 16.8 21.4 36.1 0.3945.1 17.0 20.4 19.1 23.3 20.2 0.6535.8 87.4 8.4 2.1 1.3 0.8 1.2128.5 90.5 5.5 2.3 1.1 0.6 1.0529.7 90.1 6.9 2.1 0.2 0.6 0.9610.5 95.2 4.0 0.8 0.0 0.0 0.572.1 98.1 0.4 0.8 0.6 0.0 0.21
15.2 93.1 5.7 0.8 0.0 0.4 0.680.3 99.6 0.2 0.2 0.0 0.0 0.089.9 96.0 1.9 1.3 0.2 0.6 0.380.0 100 0.0 0.0 0.0 0.0 0.061.1 97.5 0.6 0.8 0.4 0.6 0.16
28.4 22.8 41.2 23.5 9.2 3.6 0.9452.8 3.2 5.5 15.3 38.9 37.0 −0.276.0 4.0 3.6 9.7 28.4 54.4 1.71
36.3 52.7 31.1 11.6 1.5 3.2 1.0929.2 10.1 6.7 16.4 25.9 40.8 0.365.8 80.5 6.5 6.7 2.5 3.8 −0.18
36.6 62.9 36.8 0.038.1 59.7 22.9 10.3 5.7 1.5 0.54
27.7 14.7 19.5 29.0 14.1 22.7 −0.0922.9 0.8 3.2 17.9 44.0 34.1 0.56
Very Good, Good, Fair, Poor), Days (O days, 1–3 days, 4–8 days, 9–15 days, 16–30 days),en's d effect size indicator; bolded d values indicate moderate (d N .50) or larger effect
475K.G. Nelson et al. / Journal of Substance Abuse Treatment 46 (2014) 472–481
treatment and Caucasians more likely to receive OP treatment. Giventhe demographic difference, subsequent statistical analyses treated IPand OP data separately.
2.2. Description of missing data for first administration
An exploration of the BAM-D data suggested that eight (1.0%)patients refused to answer one or more of the BAM-D questions onthe first administration. The missing data appeared fairly evenlydistributed across items, with the greatest number of non-responsescoming from item 14 (Sufficient Income; N = 3; see Table 1 foritem descriptions).
Rates of missing data proved similar on first administrations of theWHOQOL-BREF and slightly higher on the ASI. For theWHOQOL-BREF,three participants refused to answer one ormore items. For the ASI, 31participants refused to answer one or more items. The largest impactcame on the ASI Medical Status subscale where 12 patients (1.5%) didnot provide enough data to allow for calculation of this score.
Overall, a total of 41 participants (5.1%) refrained from answeringone or more items in the initial evaluation packet. Given the rela-tively low levels of missing data overall, as well as the extremely lowlevels seen in the BAM-D, all subsequent analyses used listwisedeletion of cases. This reduced the maximum N for all subsequentanalyses to 769 (IP N = 617; OP N = 152).
2.3. Descriptive data for BAM-D administrations
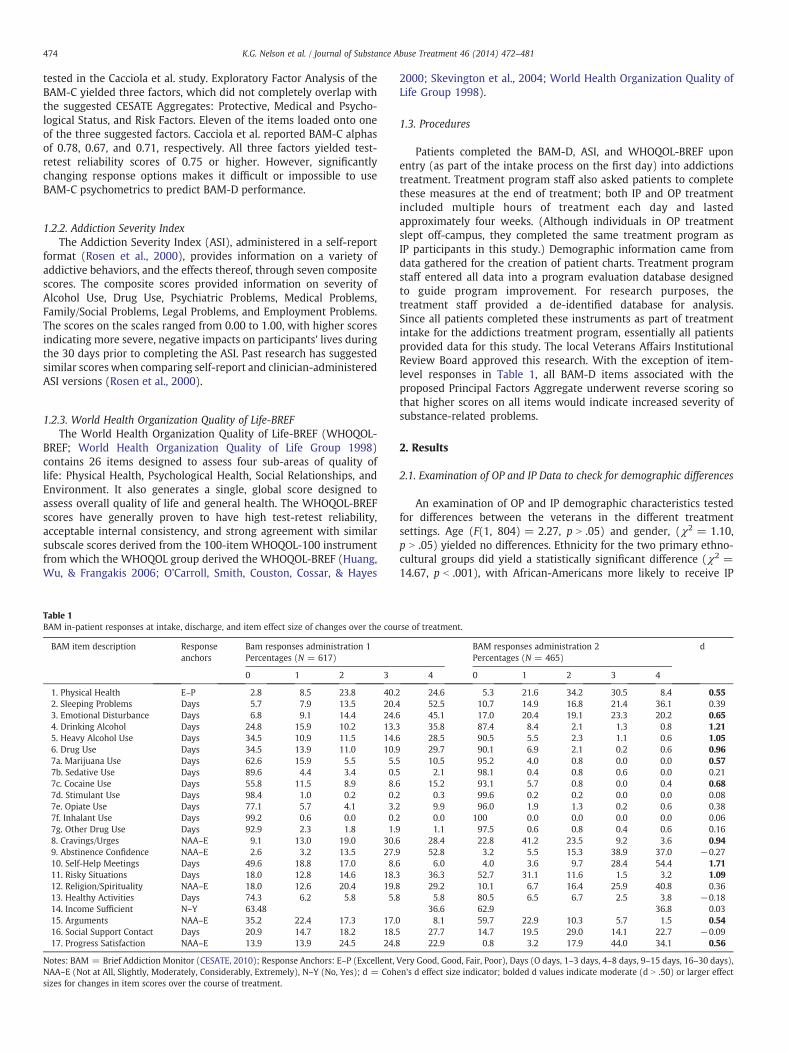
Tables 1 (IP data) and 2 (OP data) contain descriptive information,by item response, for the BAM-D administrations described above.The total N for the second BAM-D administration dropped to 465 IPsand 55 OPs. The drop in N had multiple causes including patients stillinvolved in treatment at the time of database creation (N = 10),patients who did not complete treatment (N = 90), and patients whocompleted treatment but did not complete the second packet admin-istration when exiting the treatment program (N = 149).
Table 2BAM out-patient responses at intake, discharge, and item effect size of changes over the co
BAM item description Responseanchors
Bam responses administration 1Percentages (N = 152)
0 1 2 3
1. Physical Health E–P 2.6 15.1 30.9 32.92. Sleeping Problems Days 10.5 13.2 17.1 18.43. Emotional Disturbance Days 11.8 21.1 16.4 23.74. Drinking Alcohol Days 34.2 17.1 17.8 14.55. Heavy Alcohol Use Days 47.4 13.2 15.1 15.86. Drug Use Days 46.7 13.8 13.2 13.27a. Marijuana Use Days 75.0 13.8 5.3 2.7b. Sedative Use Days 94.1 1.3 2.0 1.7c. Cocaine Use Days 58.6 12.5 13.8 7.7d. Stimulant Use Days 98.0 2.0 0.0 0.7e. Opiate Use Days 84.9 2.0 2.6 2.7f. Inhalant Use Days 99.3 0.7 0.0 0.7g. Other Drug Use Days 94.1 2.6 2.6 0.8. Cravings/Urges NAA–E 18.4 22.4 25.7 15.89. Abstinence Confidence NAA–E 3.3 7.2 22.4 30.910. Self-Help Meetings Days 42.8 22.4 14.5 11.211. Risky Situations Days 28.9 21.1 17.8 15.812. Religion/Spirituality NAA–E 15.8 10.5 18.4 19.113. Healthy Activities Days 59.9 8.6 9.2 6.14. Income Sufficient N–Y 52.615. Arguments NAA–E 41.4 21.7 17.1 10.516. Social Support Contact Days 21.1 13.8 15.1 14.517. Progress Satisfaction NAA–E 9.2 14.5 27.0 23.0
Notes: BAM = Brief Addiction Monitor (CESATE, 2010); Response Anchors: E–P (Excellent,NAA–E (Not at All, Slightly, Moderately, Considerably, Extremely), N–Y (No, Yes); d = Cohsizes for changes in item scores over the course of treatment.
2.4. Exploratory principle components analysis and internal consistency
Since no peer-reviewed, published research addressed the factorstructure of the BAM-D, a Principal Components Analysis withVarimax rotation examined the underlying structure for both IP andOP. Given the suggestion of three factors in the BAM-D manual, theinitial extraction forced the extraction of three factors. Only itemsidentified as combining into the three facets of the BAM-D (CESATE,2010) entered these analyses. See Table 3 for information regardingthe three factors that were extracted from IP data. For the purpose ofdetermining component loadings, analyses retained items with aloading of at least .4 on any component, and below .3 on the othercomponents. Two items assessing alcohol use loaded on the firstcomponent. Three items assessing physical and psychological healthloaded on the second component. Four protective factor itemsloaded on the third component. The internal consistency estimates(coefficient alpha) for components one and three (.65 and .30)argued against retaining these item groupings for further analyses.Given the lack of a clear, reliable structure in the first analysis, asecond Principal Components Analysis examined whether a two-component solution would provide more reliable options for BAM-Dbased subscales. The two-component results suggested that onlythree items loaded cleanly on the two scales and, thus, the search fora clean IP factor solution ended at this point.
Examination of results from OP data yielded a slightly differentoutcome (Table 4). It suggested the presence of a first factorcombining many of the Risk and Use scale items and accounting for27.27% of the variance. A second scale, containing three of thesuggested Protective items, accounted for an additional 12.52% of thevariance. The third factor accounted for 9.75% of the variance and didnot receive further attention since only two items, too few to create ascale, loaded on it. Analyses of internal consistency reliability (alpha)values for the first two factors yielded .75 and .47. Since the first scaleappeared to include almost all of the Use and Risk items, a sub-sequent internal consistency analysis examined the reliability of ascale including all such items; this suggested scale yielded an alpha
urse of treatment.
BAM responses administration 2Percentages (N = 55)
d
4 0 1 2 3 4
18.4 7.3 20.0 41.8 30.9 0.0 0.4540.8 12.7 18.2 14.5 20.0 34.5 0.2527.0 23.6 18.2 25.5 18.2 14.5 0.4116.4 89.1 10.9 0.0 0.0 0.0 0.888.6 98.2 1.8 0.0 0.0 0.0 0.73
13.2 92.7 5.5 0.0 1.8 0.0 0.670 3.9 96.4 1.8 0.0 1.8 0.0 0.323 1.3 100.0 0.0 0.0 0.0 0.0 0.259 7.2 94.5 5.5 0.0 0.0 0.0 0.510 0.0 100.0 0.0 0.0 0.0 0.0 —
6 7.9 94.5 1.8 0.0 0.0 3.6 0.350 0.0 100.0 0.0 0.0 0.0 0.0 —
0 0.7 96.4 1.8 0.0 1.8 0.0 0.0517.8 23.6 47.3 23.6 5.5 0.0 0.5436.2 0.0 1.8 14.5 38.2 45.5 0.239.2 12.7 7.3 16.4 30.9 32.7 0.69
16.4 52.7 30.9 7.3 5.5 3.6 0.4636.2 9.1 3.6 9.1 29.1 49.1 0.26
6 15.8 52.7 9.1 12.7 14.5 10.9 0.1447.4 35.0 65.0 0.149.2 61.8 16.4 14.5 1.8 5.5 0.33
35.5 7.3 7.3 20.0 25.5 40.0 0.3126.3 0.0 0.0 9.1 52.7 38.2 0.54
Very Good, Good, Fair, Poor), Days (O days, 1–3 days, 4–8 days, 9–15 days, 16–30 days),en's d effect size indicator; bolded d values indicate moderate (d N .50) or larger effect

Table 3In-patient BAM factor loading.
Bam Item Components
1 2 3
1. Physical Health .541 .2862. Sleeping Problems .724 .1103. Emotional Disturbance .116 .7684. Drinking Alcohol .9185. Heavy Alcohol Use .9016. Drug Use .266 .338 .1868. Cravings/Urges .442 .555 .1309. Abstinence Confidence .48410. Self-Help Meetings .324 .42511. Risky Situations .527 .37912. Religion/Spirituality .178 .46413. Healthy Activities − .145 .136 .49114. Income Sufficient .179 − .12815. Arguments .224 .505 − .35516. Social Support Contact .565
Note: Loadings less than .10 suppressed.
476 K.G. Nelson et al. / Journal of Substance Abuse Treatment 46 (2014) 472–481
of .80 in the OP sample. Examination of this scale for IP yielded analpha of .75. All subsequent analyses included this grouped set ofitems, labeled the RiskUse scale.
2.5. Internal consistency of previously defined item clusters
The BAM-Dmanual (CESATE, 2010) suggests the presence of threeprimary factors: Risk, Protective, and Use. As an additional check,internal consistency analyses examined the reliability of the suggesteditem clusters. They produced generally poor internal consistencyscores, with the resulting alpha values for IP (.69, .24, .64) and OP (.75,.30, .69) predominantly falling below .75 for Risk (items 1, 2, 3, 8, 11,and 15), Protective (items 9, 10, 12, 13, 14, and 16), andUse (items 4, 5,and 6), respectively. Given the generally low alpha values for thesuggested Aggregates, they played no role in subsequent analyses.
2.6. Relationship between BAM-D Items, BAM-D RiskUse score, andsubscale scores from ASI and WHOQOL-BREF
The BAM-D manual (CESATE, 2010) suggests using the BAM-Ditems individually to track patient progress over treatment. Thisraised the question of whether individual items could prove reliableand valid, as well as whether the RiskUse scale would prove valid.Since the data currently available blocked consideration of item-level
Table 4Out-patient BAM factor loadings.
Bam item Components
1 2 3
1. Physical Health .470 − .164 .1462. Sleeping Problems .684 − .118 .1133. Emotional Disturbance .728 − .1014. Drinking Alcohol .618 .539 − .2775. Heavy Alcohol Use .553 .481 − .2986. Drug Use .5838. Cravings/Urges .674 .1099. Abstinence Confidence .561 .21210. Self-Help Meetings .68611. Risky Situations .601 .117 .14012. Religion/Spirituality − .149 .50413. Healthy Activities .158 − .382 .38814. Income Sufficient .71515. Arguments .604 − .211 − .10616. Social Support Contact .223 .712
Note: Loadings less than .10 suppressed.
reliability based on inter-rater, alternate forms, and test-retestreliability, the analyses directly considered the convergent and diver-gent validity of BAM-D items with the ASI and WHO-QOL subscalescores. The following analyses examined the RiskUse scale and allBAM-D items using Spearman r coefficients to determine whatrelationships existed, if any, between the three instruments. Due tothe number of correlations and the sample size, only those significantat the p b .001 level and with at least a moderate effect sizecorrelation (rs ≥ .30) were interpreted. Since all of the BAM-D itemsreportedly targeted addictions-related behaviors, the default expec-tation was that they could correlate with the ASI Drug and Alcoholsubscale scores. Several items that did not clearly have substanceuse wording yielded other expectations for moderate or larger corre-lations with other face valid WHOQOL-BREF and ASI subscales: 1(WHOQOL-BREF Physical Health, ASI Medical) , 2 (WHOQOL-BREFTotal), 3 (WHOQOL-BREF Psychological Health), ASI Psychiatric), 13(WHOQOL-BREF Total), 14 (ASI Employment), 15 (WHOQOL-BREFSocial Health and ASI Family and Social), and 16 (WHOQOL-BREFSocial Health and ASI Family and Social).
An examination of the correlations between the BAM-D,WHOQOL-BREF, and ASI (Table 5) yielded the following resultsfor IP participants. First, eight of the BAM-D items failed tocorrelate with any of the scores derived from the other in-struments. These included three of the seven items designed toassess for use of specific types of substances: 7d (stimulants), 7f(inhalants), and 7g (other drugs). Behaviors assessed by theseitems occurred at a very low rate in this sample, which alsoreduced variability on these items. In addition, none of the itemssuggested for the Protective Behaviors composite scale showedmoderate or higher relationships to the measures of quality of life,or to the impact of addictive behaviors from the ASI. Theseadditional BAM-D items included items 9 (confidence in stayingabstinent), 10 (AA/NA attendance), 12 (religion/spirituality), 13(prosocial activities), and 16 (family/friends).
The remaining BAM-D items, and RiskUse score, largely per-formed as expected based on the content assessed for IPs. RiskUsecorrelated moderately to strongly with every quality of life score andmore than half of the ASI subscales. BAM-D 1 (physical health)showed large correlations (.50 and above; based on Cohen 1988) withthe WHOQOL-BREF Physical and ASI Medical Status scores. BAM-D 2(trouble sleeping) showed moderate correlations with multipleWHOQOL BREF subscales. BAM-D 3 (depressed, anxious, angry,upset) showed large correlations with the WHOQOL-BREF Psychiatricand ASI Psychiatric Status Subscales. The BAM-D 4 (days of alcoholuse in past month) and BAM-D 5 (heavy use of alcohol) both corre-lated strongly with the ASI Alcohol Use subscale. BAM-D 6 (days usingdrugs) correlated strongly with the ASI Drug Use scale. Four of thedrug-specific items, BAM-D 7a (marijuana), BAM-D 7b (sedatives/tranquilizers), BAM-D 7c (Cocaine), and BAM-D 7e (opiates), hadmoderate or larger correlations with the ASI drug use subscale. Theother specific drug use items failed to correlate, perhaps due to thelack of variability in these items within the current IP sample. Noneof the BAM-D items related to specific substances demonstratedmoderate or larger correlations with the Quality of Life subscales.BAM-D 8 (urges/cravings) evidenced moderate correlations withQuality of Life subscales, as well as the ASI Alcohol and Drug usesubscales. BAM-D 11 (risk for using) showed a similar pattern withthe ASI Alcohol and Drug Use scales. BAM-D 14 (sufficient income)correlated with theWHOQOL-BREF Environmental subscale, but noneof the ASI subscales, including the Employment subscale. The BAM-D15 (social relationship problems) was expected to relate to theWHOQOL-BREF social scale, but showed less than moderate relation-ships to all quality of life measurements, but did show moderaterelationships to the ASI Psychiatric Status and Family/Social function-ing. Finally, the BAM-D 17 (satisfaction with progress) showed amoderate relationship with the WHOQOL-BREF Psychiatry subscale,

Table 5Baseline correlations (Spearman r) between BAM scores, WHOQOL-BREF subscales, and ASI subscales for in-patients (N = 617).
BAM WHOQOL-BREF subscales ASI subscales
Scale andItems
Physicalhealth
PsychologicalHealth
Environmental SocialHealth
Total Employment Medical Psychiatric Family andsocial
Alcoholuse
Druguse
Legal
RiskUse − .38⁎ − .45⁎ − .35⁎ − .38⁎ − .50⁎ − .04 .24⁎ .34⁎ .32⁎ .66⁎ .51⁎ − .07bam1 − .63⁎ − .36⁎ − .36⁎ − .28⁎ − .54⁎ .05 .52⁎ .25⁎ .13 .21⁎ .19⁎ − .08bam2 − .41⁎ − .35⁎ − .22⁎ − .27⁎ − .39⁎ − .07 .26⁎ .29⁎ .15⁎ .19⁎ .10⁎ .00bam3 − .38⁎ − .57⁎ − .34⁎ − .45⁎ − .53⁎ .01 .20⁎ .55⁎ .27⁎ .23⁎ .18⁎ − .01bam4 − .07 − .11 − .07 − .05 − .10 − .01 .06 .05 .09 .87⁎ .15⁎ − .08bam5 − .11 − .16⁎ − .10 − .10 − .16⁎ .02 .08 .09 0.11 .87⁎ .13 − .07bam6 − .14⁎ − .18⁎ − .16⁎ − .17⁎ − .20⁎ − .02 0.09 .11⁎ .16⁎ .01 .81⁎ − .08bam7a − .05 − .09 − .09 − .08 − .09 .04 .01 .12 .17⁎ .19⁎ .52⁎ − .02bam7b -.13 − .17⁎ − .07 − .06 − .14⁎ − .05 .09 .16⁎ .12 − .01 .31⁎ .00bam7c − .04 −0.11 − .19⁎ − .19⁎ − .16⁎ .11 .06 .08 .14⁎ .03 .60⁎ − .05bam7d − .06 − .07 − .01 − .01 − .06 − .07 − .01 .04 − .02 .08 0.12 − .03bam7e − .15⁎ − .09 .01 − .03 − .09 − .13 .07 .04 .06 − .17⁎ .44⁎ − .04bam7f − .04 − .04 − .02 .01 − .03 .00 .04 .07 − .01 − .04 − .01 .05bam7g − .08 − .02 − .01 − .03 − .04 − .04 .08 .04 .06 .03 .18⁎ .05bam8 − .26⁎ − .40⁎ − .22⁎ − .29⁎ − .36⁎ − .07 .11 .21⁎ .16⁎ .36⁎ .38⁎ − .08bam9r − .08 − .08 − .01 − .03 − .06 .01 − .05 .02 .01 − .05 .07 .01bam10r − .10 − .10 − .09 − .03 − .01 .02 .05 .11 − .01 .15⁎ .08 − .09bam11 − .18⁎ − .23⁎ − .28⁎ − .20⁎ − .29⁎ − .06 .13 .11 .14 .30⁎ .40⁎ − .02bam12r − .04 − .14⁎ − .04 − .09 − .09 − .05 − .06 .04 − .05 .09 .01 − .09bam13r − .18⁎ − .11 − .01 − .11 − .12 .13 .06 .13 − .06 − .01 .06 − .06bam14r − .07 − .06 − .39⁎ − .10 − .22⁎ .12 .12 .04 .16⁎ .03 .03 .08bam15 − .13 − .22⁎ − .22⁎ − .26⁎ − .26⁎ − .07 .03 .30⁎ .49⁎ .21⁎ .24⁎ .08bam16r − .09 −0.12 − .21⁎ − .23⁎ − .20⁎ .15⁎ .05 .09 .04 .03 .08 − .06bam17 .12 .33⁎ .22⁎ .24⁎ .27⁎ .06 .02 − .13 − .06 − .04 − .14 .04
Note: BAM = Brief Addiction Monitor (CESATE, 2010), ASI = Self-Report Addictions Severity Index (Rosen et al. 2000), WHOQOL-BREF = World Health Organization Quality ofLife-BREF (World Health Organization Quality of Life Group 1998), r = reverse coded item, bold = correlation of at least moderate effect size based on Cohen (2008).⁎ p b .001.
477K.G. Nelson et al. / Journal of Substance Abuse Treatment 46 (2014) 472–481
but no such relationship emerged when examining the ASI-basedsubscale scores.
An examination of the correlations between the BAM-D, WHO-QOL-BREF, and ASI (Table 6) yielded the following results for OPparticipants. First, seven of the BAM-D items failed to correlate with
Table 6Baseline correlations (Spearman r) between BAM scores, WHOQOL-BREF subscales, and AS
BAM WHOQOL-BREF Subscales
Scale andItems
PhysicalHealth
PsychologicalHealth
Environmental SocialHealth
Total
RiskUse − .46⁎ − .50⁎ − .29⁎ − .38⁎ − .52⁎
bam1 − .61⁎ − .38⁎ − .33⁎ − .23 − .55⁎
bam2 − .51⁎ − .46⁎ − .23 − .25 − .47⁎
bam3 − .43⁎ − .60⁎ − .30⁎ − .42⁎ − .54⁎
bam4 − .13 − .16 − .04 − .10 − .14bam5 − .09 − .14 − .08 − .11 − .13bam6 − .20 − .12 − .13 − .15 − .19bam7a − .14 − .06 − .02 − .10 − .10bam7b − .13 − .04 .08 − .05 − .04bam7c − .26 −16 − .22 − .21 − .26bam7d .02 − .07 − .01 − .02 − .04bam7e − .14 − .04 .05 .04 − .04bam7f .01 − .06 − .13 − .12 − .10bam7g .03 − .02 .03 .05 .02bam8 − .25 − .32⁎ − .12 − .29⁎ − .31⁎
bam9r .04 − .04 − .12 − .12 − .08bam10r .06 − .02 .04 .01 .03bam11 − .23 − .27 − .26 − .23 − .33⁎
bam12r .15 .00 − .01 .13 .07bam13r − .29⁎ − .19 − .04 − .12 − .20bam14r − .17 − .17 − .50⁎ − .26 − .34⁎
bam15 − .31⁎ − .40⁎ − .22 − .31⁎ − .38⁎
bam16r − .18 − .15 − .26 − .34⁎ − .27bam17 .22 .33⁎ .27 .30⁎ .35⁎
Note: BAM = Brief Addiction Monitor (CESATE, 2010), ASI = Self-Report Addictions Seveof Life-BREF (World Health Organization Quality of Life Group 1998), r = reverse coded ite⁎ p b .001.
any of the scores derived from the other instruments. These includedfour of the seven items designed to assess for use of specific typesof substances: 7b (sedatives), 7d (stimulants), 7f (inhalants), and 7g(other drugs). In addition, three of the items suggested for theProtective behaviors showed no relationships to the measures of
I subscales for out-patients (N = 152).
ASI Subscales
Employment Medical Psychiatric Family andSocial
Alcoholuse
Druguse
Legal
− .03 .37⁎ .53⁎ .36⁎ .62⁎ .51⁎ .04.21 .60⁎ .34⁎ .30⁎ .14 .21 − .05.09 .44⁎ .48⁎ .16 .28⁎ .19 − .05.03 .30⁎ .72⁎ .33⁎ .38⁎ .27⁎ .05
− .18 .12 .22 .09 .86⁎ .20 .04− .22 .07 .16 .07 .80⁎ .10 .07
.05 .16 .24 .25 .15 .85⁎ .07− .08 .07 .24 .17 .09 .52⁎ .00− .05 .12 .05 .16 .00 .23 − .10
.15 .24 .23 .18 .25 .64⁎ .08− .02 − .07 .10 − .02 − .19 .14 − .03
.07 .10 .06 − .01 − .19 .37⁎ − .10
.10 .04 .10 .04 − .12 .00 .08− .04 − .08 − .02 − .03 − .07 .13 −03− .04 .12 .21 .23 .36⁎ .39⁎ .08
.11 .04 − .01 .07 .13 .18 .20− .26 − .10 − .03 − .04 .23 − .11 .04− .01 .18 .21 .18 .26 .35⁎ − .06− .19 − .15 − .05 − .14 .00 − .04 .04
.37⁎ .22 .06 .11 − .03 .12 − .09
.35⁎ .07 .06 .07 − .02 .05 .02
.01 .25 .45⁎ .52⁎ .20 .29⁎ .09
.30⁎ .13 .12 .03 .07 .10 .09− .06 − .11 − .14 − .21 − .10 − .08 − .14
rity Index (Rosen et al. 2000), WHOQOL-BREF = World Health Organization Qualitym, bold = correlation of at least moderate effect size based on Cohen (2008).
478 K.G. Nelson et al. / Journal of Substance Abuse Treatment 46 (2014) 472–481
quality of life and the impact of addictive behaviors from the ASI.These included BAM-D 9 (confidence in staying abstinent), 10 (AA/NAattendance), and 12 (religion/spirituality).
The remaining BAM-D items, and RiskUse score, largely per-formed as expected based on the content assessed for OPs. RiskUsecorrelated moderately to strongly with every quality of life score andfive ASI subscales. BAM-D 1 (physical health) showed large corre-lations (.50 and above; based on Cohen 1988) with the WHOQOL-BREF Physical Total Scores, and ASI Medical Status scores. BAM-D 2(trouble sleeping) showed moderate correlations with multipleWHOQOL-BREF subscales and ASI Medical. BAM-D 3 (depressed,anxious, angry, upset) showed large correlations with the WHOQOL-BREF Psychiatric and Total, and ASI Psychiatric Status Subscales.BAM-D 4 (days of alcohol in past month) and BAM-D 5 (heavy use ofalcohol) both correlated strongly with the ASI Alcohol Use subscale.BAM-D 6 (days using drugs) correlated strongly with the ASI DrugUse scale. Four of the drug-specific items, BAM-D 7a (marijuana),BAM-D 7c (Cocaine), and BAM-D 7e (opiates), had moderate orlarger correlations with the ASI drug use subscale. The other specificdrug use items failed to correlate, perhaps due to the lack ofvariability in these items within the current OP sample. None of theBAM-D items related to specific substances demonstrated moderateor larger correlations with the Quality of Life subscales. BAM-D8 (urges/cravings) evidenced moderate correlations with Quality ofLife subscales, as well as the ASI Alcohol and Drug use subscales.BAM-D 11 (risk for using) showed moderate correlations with theTotal quality of life score and ASI Drug Use. The BAM-D 14 (sufficientincome) correlated with the WHOQOL-BREF Environmental subscaleand Total Scores, as well as the ASI Employment score. BAM-D 15(social relationship problems) showed moderate strength relation-ships to the Quality of Life subscales, as well as moderate and largerelationships with the ASI Psychiatric Status and Family/Social func-tioning (respectively). BAM-D 16 (Social Support) correlated withthe social health score and the ASI Employment scores. Finally, BAM-D 17 (satisfaction with progress) showed a moderate relationshipwith multiple WHOQOL-BREF scores, including Psychiatry subscale,but no such relationships emerged when examining the ASI-basedsubscale scores.
2.7. Changes over the course of treatment
Examining Tables 1 and 5 together pointed out severalinteresting aspects of the BAM-D's performance. For the IP sample,Table 1 indicated that 12 of the BAM-D items (1, 3, 4, 5, 6, 7a, 7c, 8,10, 11, 15, and 17) showed moderate or larger changes, all of whichreflected apparent improvements in functioning over the course oftreatment. As indicated in Table 5, 15 items (1, 2, 3, 4, 5, 6, 7a, 7b, 7c,7e, 8, 11, 14, 15, 17), as well as the RiskUse score, demonstratedacceptable validity (so far as validity was defined in the precedingsection). The merging of these two sets yielded a set of 11 items (1,3, 4, 5, 6, 7a, 7c, 8, 11, 15, and 17) and the RiskUse score thatpossessed initial evidence supporting both validity of the item andsensitivity to change over the course of treatment. Also, the ASI Drugand Alcohol Use scales showed meaningful (i.e. d N .5) significant(p b .001) improvement from pre- to post-treatment testing for theIP population (ASI Drug Use, t(474) = 22.11, p b .001, d = 1.01; ASIAlcohol Use, t (474) = 22.04, p b .001, d = 1.01). Finally, significantand meaningful changes were observed on the WHOQOL-BREFPsychological, Physical, Environmental and Total Health scales(Psychological Health, t(474) = 19.14, p b .001, d = 0.88; PhysicalHealth, t(474) = 13.14, p b .001, d = 0.60; Environmental Quality,t(474) = 16.49, p b .001, d = 0.76; Total, t(474) = 20.66, p b .001,d = 0.95).
Examining Tables 1 and 5 together suggests the presence of asimilar set of items for the OP sample. For OPs, Table 2b indicated that7 of the BAM-D items (4, 5, 6, 7c, 8, 10, and 17) showed moderate or
larger changes, all of which reflected apparent improvements infunctioning, over the course of treatment. Table 5 indicated that 16items (1, 2, 3, 4, 5, 6, 7a, 7b, 7c, 7e, 8, 11, 14, 15, 17), as well as theRiskUse score, demonstrated acceptable validity. The merging ofthese two sets yielded a set of items (4, 5, 6, 7c, 8, and 17), and theRiskUse score, with initial evidence supporting both validity of theitem and sensitivity to change over the course of treatment. Further-more, there was evidence of change on outcomes measures in theOP population as well, with significant and meaningful changeson the ASI Drug and Alcohol Use scales (ASI Drug Use, t(54) = 5.33,p b .001, d = 0.72; ASI Alcohol Use, t(54) = 5.33, p b .001, d =0.72) as well as the WHOQOL-BREF Psychological and Total HealthScales (Psychological Health, t(54) = 5.07, p b .001, d = 0.68; Total,t(54) = 4.46, p b .001, d = 0.60).
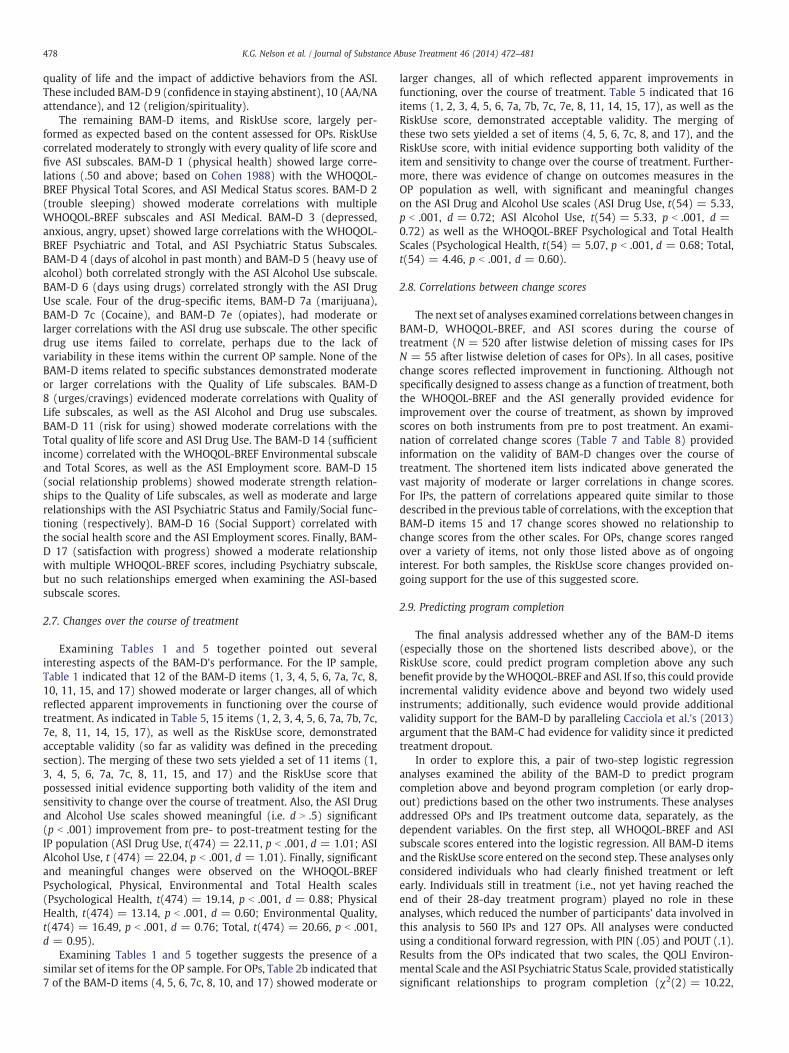
2.8. Correlations between change scores
The next set of analyses examined correlations between changes inBAM-D, WHOQOL-BREF, and ASI scores during the course oftreatment (N = 520 after listwise deletion of missing cases for IPsN = 55 after listwise deletion of cases for OPs). In all cases, positivechange scores reflected improvement in functioning. Although notspecifically designed to assess change as a function of treatment, boththe WHOQOL-BREF and the ASI generally provided evidence forimprovement over the course of treatment, as shown by improvedscores on both instruments from pre to post treatment. An exami-nation of correlated change scores (Table 7 and Table 8) providedinformation on the validity of BAM-D changes over the course oftreatment. The shortened item lists indicated above generated thevast majority of moderate or larger correlations in change scores.For IPs, the pattern of correlations appeared quite similar to thosedescribed in the previous table of correlations, with the exception thatBAM-D items 15 and 17 change scores showed no relationship tochange scores from the other scales. For OPs, change scores rangedover a variety of items, not only those listed above as of ongoinginterest. For both samples, the RiskUse score changes provided on-going support for the use of this suggested score.
2.9. Predicting program completion
The final analysis addressed whether any of the BAM-D items(especially those on the shortened lists described above), or theRiskUse score, could predict program completion above any suchbenefit provide by theWHOQOL-BREF and ASI. If so, this could provideincremental validity evidence above and beyond two widely usedinstruments; additionally, such evidence would provide additionalvalidity support for the BAM-D by paralleling Cacciola et al.'s (2013)argument that the BAM-C had evidence for validity since it predictedtreatment dropout.
In order to explore this, a pair of two-step logistic regressionanalyses examined the ability of the BAM-D to predict programcompletion above and beyond program completion (or early drop-out) predictions based on the other two instruments. These analysesaddressed OPs and IPs treatment outcome data, separately, as thedependent variables. On the first step, all WHOQOL-BREF and ASIsubscale scores entered into the logistic regression. All BAM-D itemsand the RiskUse score entered on the second step. These analyses onlyconsidered individuals who had clearly finished treatment or leftearly. Individuals still in treatment (i.e., not yet having reached theend of their 28-day treatment program) played no role in theseanalyses, which reduced the number of participants' data involved inthis analysis to 560 IPs and 127 OPs. All analyses were conductedusing a conditional forward regression, with PIN (.05) and POUT (.1).Results from the OPs indicated that two scales, the QOLI Environ-mental Scale and the ASI Psychiatric Status Scale, provided statisticallysignificant relationships to program completion (χ2(2) = 10.22,
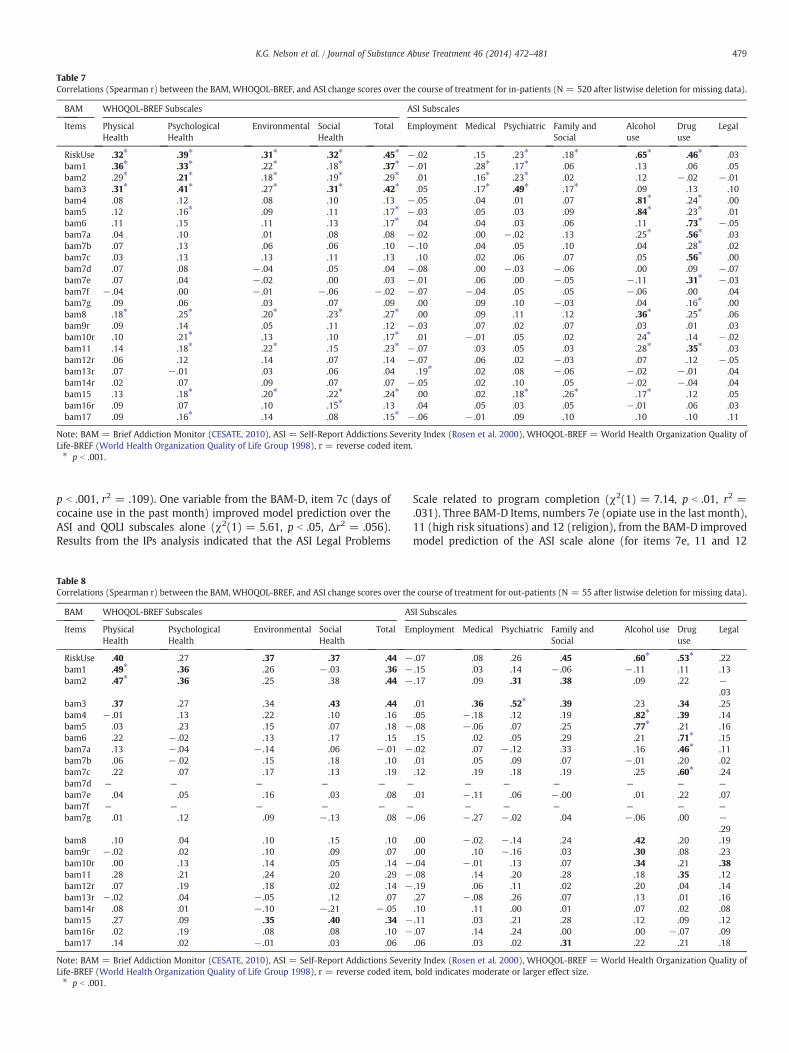
Table 7Correlations (Spearman r) between the BAM, WHOQOL-BREF, and ASI change scores over the course of treatment for in-patients (N = 520 after listwise deletion for missing data).
BAM WHOQOL-BREF Subscales ASI Subscales
Items PhysicalHealth
PsychologicalHealth
Environmental SocialHealth
Total Employment Medical Psychiatric Family andSocial
Alcoholuse
Druguse
Legal
RiskUse .32⁎ .39⁎ .31⁎ .32⁎ .45⁎ − .02 .15 .23⁎ .18⁎ .65⁎ .46⁎ .03bam1 .36⁎ .33⁎ .22⁎ .18⁎ .37⁎ − .01 .28⁎ .17⁎ .06 .13 .06 .05bam2 .29⁎ .21⁎ .18⁎ .19⁎ .29⁎ .01 .16⁎ .23⁎ .02 .12 − .02 − .01bam3 .31⁎ .41⁎ .27⁎ .31⁎ .42⁎ .05 .17⁎ .49⁎ .17⁎ .09 .13 .10bam4 .08 .12 .08 .10 .13 − .05 .04 .01 .07 .81⁎ .24⁎ .00bam5 .12 .16⁎ .09 .11 .17⁎ − .03 .05 .03 .09 .84⁎ .23⁎ .01bam6 .11 .15 .11 .13 .17⁎ .04 .04 .03 .06 .11 .73⁎ − .05bam7a .04 .10 .01 .08 .08 − .02 .00 − .02 .13 .25⁎ .56⁎ .03bam7b .07 .13 .06 .06 .10 − .10 .04 .05 .10 .04 .28⁎ .02bam7c .03 .13 .13 .11 .13 .10 .02 .06 .07 .05 .56⁎ .00bam7d .07 .08 − .04 .05 .04 − .08 .00 − .03 − .06 .00 .09 − .07bam7e .07 .04 − .02 .00 .03 − .01 .06 .00 − .05 − .11 .31⁎ − .03bam7f − .04 .00 − .01 − .06 − .02 − .07 − .04 .05 .05 − .06 .00 .04bam7g .09 .06 .03 .07 .09 .00 .09 .10 − .03 .04 .16⁎ .00bam8 .18⁎ .25⁎ .20⁎ .23⁎ .27⁎ .00 .09 .11 .12 .36⁎ .25⁎ .06bam9r .09 .14 .05 .11 .12 − .03 .07 .02 .07 .03 .01 .03bam10r .10 .21⁎ .13 .10 .17⁎ .01 − .01 .05 .02 24⁎ .14 − .02bam11 .14 .18⁎ .22⁎ .15 .23⁎ − .07 .03 .05 .03 .28⁎ .35⁎ .03bam12r .06 .12 .14 .07 .14 − .07 .06 .02 − .03 .07 .12 − .05bam13r .07 − .01 .03 .06 .04 .19⁎ .02 .08 − .06 − .02 − .01 .04bam14r .02 .07 .09 .07 .07 − .05 .02 .10 .05 − .02 − .04 .04bam15 .13 .18⁎ .20⁎ .22⁎ .24⁎ .00 .02 .18⁎ .26⁎ .17⁎ .12 .05bam16r .09 .07 .10 .15⁎ .13 .04 .05 .03 .05 − .01 .06 .03bam17 .09 .16⁎ .14 .08 .15⁎ − .06 − .01 .09 .10 .10 .10 .11
Note: BAM = Brief Addiction Monitor (CESATE, 2010), ASI = Self-Report Addictions Severity Index (Rosen et al. 2000), WHOQOL-BREF = World Health Organization Quality ofLife-BREF (World Health Organization Quality of Life Group 1998), r = reverse coded item.⁎ p b .001.
479K.G. Nelson et al. / Journal of Substance Abuse Treatment 46 (2014) 472–481
p b .001, r2 = .109). One variable from the BAM-D, item 7c (days ofcocaine use in the past month) improved model prediction over theASI and QOLI subscales alone (χ2(1) = 5.61, p b .05, Δr2 = .056).Results from the IPs analysis indicated that the ASI Legal Problems
Table 8Correlations (Spearman r) between the BAM, WHOQOL-BREF, and ASI change scores over th
BAM WHOQOL-BREF Subscales A
Items PhysicalHealth
PsychologicalHealth
Environmental SocialHealth
Total Em
RiskUse .40 .27 .37 .37 .44 −bam1 .49⁎ .36 .26 − .03 .36 −bam2 .47⁎ .36 .25 .38 .44 −
bam3 .37 .27 .34 .43 .44bam4 − .01 .13 .22 .10 .16bam5 .03 .23 .15 .07 .18 −bam6 .22 − .02 .13 .17 .15bam7a .13 − .04 − .14 .06 − .01 −bam7b .06 − .02 .15 .18 .10bam7c .22 .07 .17 .13 .19bam7d — — — — — —
bam7e .04 .05 .16 .03 .08bam7f — — — — — —
bam7g .01 .12 .09 − .13 .08 −
bam8 .10 .04 .10 .15 .10bam9r − .02 .02 .10 .09 .07bam10r .00 .13 .14 .05 .14 −bam11 .28 .21 .24 .20 .29 −bam12r .07 .19 .18 .02 .14 −bam13r − .02 .04 − .05 .12 .07bam14r .08 .01 − .10 − .21 − .05bam15 .27 .09 .35 .40 .34 −bam16r .02 .19 .08 .08 .10 −bam17 .14 .02 − .01 .03 .06
Note: BAM = Brief Addiction Monitor (CESATE, 2010), ASI = Self-Report Addictions SeverLife-BREF (World Health Organization Quality of Life Group 1998), r = reverse coded item⁎ p b .001.
Scale related to program completion (χ2(1) = 7.14, p b .01, r2 =.031). Three BAM-D Items, numbers 7e (opiate use in the last month),11 (high risk situations) and 12 (religion), from the BAM-D improvedmodel prediction of the ASI scale alone (for items 7e, 11 and 12
e course of treatment for out-patients (N = 55 after listwise deletion for missing data).
SI Subscales
ployment Medical Psychiatric Family andSocial
Alcohol use Druguse
Legal
.07 .08 .26 .45 .60⁎ .53⁎ .22
.15 .03 .14 − .06 − .11 .11 .13
.17 .09 .31 .38 .09 .22 −.03
.01 .36 .52⁎ .39 .23 .34 .25
.05 − .18 .12 .19 .82⁎ .39 .14
.08 − .06 .07 .25 .77⁎ .21 .16
.15 .02 .05 .29 .21 .71⁎ .15
.02 .07 − .12 .33 .16 .46⁎ .11
.01 .05 .09 .07 − .01 .20 .02
.12 .19 .18 .19 .25 .60⁎ .24— — — — — —
.01 − .11 .06 − .00 .01 .22 .07— — — — — —
.06 − .27 − .02 .04 − .06 .00 −.29
.00 − .02 − .14 .24 .42 .20 .19
.00 .10 − .16 .03 .30 .08 .23
.04 − .01 .13 .07 .34 .21 .38
.08 .14 .20 .28 .18 .35 .12
.19 .06 .11 .02 .20 .04 .14
.27 − .08 .26 .07 .13 .01 .16
.10 .11 .00 .01 .07 .02 .08
.11 .03 .21 .28 .12 .09 .12
.07 .14 .24 .00 .00 − .07 .09
.06 .03 .02 .31 .22 .21 .18
ity Index (Rosen et al. 2000), WHOQOL-BREF = World Health Organization Quality of, bold indicates moderate or larger effect size.

480 K.G. Nelson et al. / Journal of Substance Abuse Treatment 46 (2014) 472–481
respectively: χ2(1) = 7.55, p b .01, Δr2 = .033; χ2(1) = 5.97,p b .05, Δr2 = .025; χ2(1) = 4.56, p b .05, Δr2 = .019) As evidencedby the r2 values, none of the variables, from any of the measures,entered in either the inpatient or outpatient analyses providedclinically meaningfully predictions for program completion.
3. Discussion
This study began with the stated intent of examining the psy-chometric performance of a new measure designed for use in addic-tions treatment, the BAM-D. This review examined several areas. First,the research met the need for a standardization sample by providinginformation on BAM-D item-level responses for both OPs and IPs.The assessment of the data suggested moderate to large changes overthe course of therapy, a high degree of variability across many of theitems, and low levels of skipped items. Taken together, this provideda solid basis on which to proceed in analyzing the instrument andsuggested a high degree of instrument acceptability for patients withaddictive disorders.
Second, the research examined whether the suggested itemAggregates existed within the BAM-D. The BAM-D manual (CESATE,2010) indicated that the suggested groupings of items came from theopinions of the test creators, rather than psychometric analyses.Exploration of a pair of principal components analyses, combinedwith examining the internal consistency of the suggested aggregates,indicated the existence of a single RiskUse factor with acceptablereliability for both OPs and IPS. Since the BAM-D manual argued forinterpretation at both the item and aggregate level, subsequent sta-tistical analyses focused on BAM-D item-level performance as well asperformance of the RiskUse factor.
Third, the research explored performance of the BAM-D items andthe RiskUse scale to examine evidence for convergent validity withthe ASI and WHOQOL-BREF scores, and divergent validity with un-related scores from the same measures. All of this data came fromcompletion of these instruments at the time that participants enteredtreatment. For IPs, these analyses suggested that 15 items demon-strated acceptable evidence of convergent and divergent validity.Combining these results with the earlier descriptive data suggestedan interesting avenue for further exploration. Eleven of the BAM-Ditems (1, 3, 4, 5, 6, 7a, 7c, 8, 10, 11, and 17) showed moderate orlarger changes, all of which proved to reflect apparent improvementsin functioning, over the course of treatment. Combining this with the15 items (1, 2, 3, 4, 5, 6, 7a, 7b, 7c, 7e, 8, 11, 14, 15, 17) that dem-onstrated acceptable validity yielded a set of 10 items with initialevidence supporting both validity of the item and sensitivity tochange over the course of treatment (1, 3, 4, 5, 6, 7a, 7c, 8, 11, and 17).The RiskUse score also provided similar evidence for convergent anddivergent validity.
For OPs, seven of the BAM-D items (4, 5, 6, 7c, 8, 10, and 17)showed moderate or larger changes, all of which proved to reflectapparent improvements in functioning, over the course of treatment.Combining this with the 16 items (1, 2, 3, 4, 5, 6, 7a, 7c, 7e, 8, 11, 13,14, 15, 16, 17) that demonstrated acceptable validity yielded a setof six items with initial evidence supporting both validity of the itemand sensitivity to change over the course of treatment (4, 5, 6, 7c, 8,and 17). The RiskUse score also provided similar evidence for con-vergent and divergent validity. If combined across both IPs and OPs,this argued for the use of the RiskUse score, as well as BAM-D items 4,5, 6, 7c, 8, 11, and 17 across both groups of patients.
Fourth, the researchers expected the BAM-D change scores overtime to correlate significantly with similar ASI and WHRQOL basedchange scores, which would provide additional evidence for thevalidity of using the reduced BAM-D item list in treatment settings.This analysis resulted in a suggestion to drop one item, item 17(satisfaction with progress), from continued IP use since it failed tocorrelate with any other change scores. Further examination of
BAM-D item 17 would seem to suggest that patients generally over-valued the progress they made in treatment, as the response distri-bution is generally normal on intake and strongly skewed (negative,ceiling effect) at post-treatment. This indicates that, at least in thecurrent sample, patient perception of their own progress may not be areliable indicator of actual progress, further underscoring the need formeasurement based care in general. Thus, these analyses providedongoing support for the use of 9 BAM-D items: 1, 3, 4, 5, 6, 7a, 7c, 8,and 11 with IPs. For OPs, the previous list of items (4, 5, 6, 7c, 8, and17) saw no changes. However, if combining results across both lists atthis point, it calls for the use of the RiskUse score, as well as BAM-Ditems 4, 5, 6, 7c, and 8.
Fifth, the analyses examined whether the BAM-D items couldpredict program completion. The data analyses indicated that none ofthe scores examined in this study (BAM-D items, ASI subscales, orWHOQOL-BREF) meaningfully predicted program completion, betterthan chance, for either OPs or IPs. This matches with past researchindicating that a variety of variables (e.g., stages of change scores;Hernandez-Avila, Burleson, & Kranzler 1998) fail to predict programcompletion. It also contradicted findings from Cacciola et al. (2013)that the BAM-C could predict program completion. It is important tonote that this does not undercut the reliability or validity of the BAM-D items for other uses, but also does not suggest that the BAM-Dwould be uniquely capable of predicting program completion whereother instruments are not. It may, on the other hand, create problemsfor using the BAM-D as a measurement to guide care. Since treat-ment dropout in addictions settings has usually reflected substanceuse relapse, treatment completion (or lack thereof) represents animportant benchmarkwhenworkingwith patients. Assessment basedcare represents a laudable goal. However, research needs to dem-onstrate clear, empirically based rules to guide use of instruments andto show what they can predict that will prove clinically relevant. Inorder for the BAM-D to fulfill the role of guiding care, future researchmust identify which items, or derived scores, predict clinically rele-vant outcomes, such as treatment completion, how frequently togather such data, and what types of score changes would provideclinically significant data.
Given the increasing demand for use of the BAM-D within VAaddictions treatment settings, how should clinicians use this instru-ment? The analyses here support using only the selected items listedabove, argues against combining these items into any type of aggre-gate score other than the RiskUse scale, and argues against relyingsolely on the BAM-D as a tool to inform measurement based care,given its questionable factor structure and reliability. In order tocomply with VA mandates, and still gather data to guide provision ofthe best possible care to veterans, it may prove useful to give onlythe BAM-D items ultimately retained after analysis, as well as theRiskUse score, and simply add them to locally existing assessmentprotocols. Furthermore, clinician's should recognize the inherentweaknesses in using single-item assessment instruments, given theincrease in reliability that comes from combining items designed toassess the same construct. Although individual clinical providersmight consider using individual item results as starting points fortreatment planning or clinical discussion, advocating the use of thesescores as a way to measure progress in treatment appears withoutmerit at this time. These results further underscore the questionablenature of altering the response options on the BAM from the originalquasi-continuous options to the 5 point Likert scale.
This study had a couple weaknesses that may give pause. First, itonly examined data from a single medical center within one Vete-rans Integrated Service Networks (VISN). To the extent that otherVISNs have differing populations and differing treatment programs,the BAM-D may prove more or less psychometrically valid. Addi-tional research in other VISNs could prove particularly helpful sincesome BAM-D items appeared designed to assess addictions (e.g.,sedatives and inhalants) that rarely occurred in the current
481K.G. Nelson et al. / Journal of Substance Abuse Treatment 46 (2014) 472–481
sample of veterans seeking treatment. Higher rates of using thesesubstances may occur in other VISNs. Thus, future research shouldexamine BAM-D results in relation to assessment protocols in othertreatment settings in order to replicate and expand the currentfindings. Second, the current study did not examine the clinicalutility of the BAM-D items for treatment staff, but only focused onthe apparent acceptability to patients. Given the multi-dimensionalnature of most items on the BAM-D (e.g., item 2, described asemotional disturbance above, assesses depression, anxiety, anger,and feeling upset), the utility of the individual items in providingguidance for appropriate referrals to other treatment providers(e.g., for antidepressant medications) remains unclear at this time.Third, the number of individuals who failed to complete a post-treatment assessment packet from the outpatient sample provedconsiderable, and may have reasonably altered the sample. It isworth noting, however, that subject attrition had no effect on theBAM-D's ability to display a consistent factor structure, which itfailed to do, or correlate meaningfully at intake with concurrentmeasures of substance abuse. Lastly, due to the non-inclusion ofindividuals withdrawing early from the post-treatment assess-ment point, the specific analysis of item 17 (satisfaction withprogress) should be viewed with caution; as it is reasonableto postulate that range restriction due to early withdrawalmay have a deleterious effect on this specific items correlationpatterns, as the response pattern for this item was heavilyskewed at the post-treatment data point.
In summary, this study examined the psychometric performanceof the BAM-D. The results indicated that a selection of BAM-D itemsdid appear sensitive to change over time, demonstrated substantialvariability in responses, provided evidence for convergent anddivergent validity, and generated change scores over the course oftreatment that also appeared to demonstrate convergent anddivergent validity. Future research should examine the clinicalutility of this instrument to determine its benefit to addictionstreatment providers. However, given the clearly superior psycho-metric characteristics reported for an alternate version of thisinstrument in Cacciola et al. (2013), it remains unclear why adecision creating an apparently less psychometrically sound versionshould stand without any clear benefits to such a decision. If the VAintends to move forward with the BAM-D, it seems unreasonable tomove away from other instruments with better demonstratedreliability and validity (e.g., the self-report ASI) for an instrumentwhere the clinical utility remains questionable. Furthermore,additional research needs to address what scores, if any, can beused to guide treatment changes and decision making in situ forfront-line addictions professionals.
References
Butler, S. F., Budman, S. H., Goldman, R. J., Newman, F. L., Beckley, K. E., Trottier, D., et al.(2001). Initial validation of a computer-administered Addiction Severity Index: TheASI-MV. Psychology of Addictive Behaviors, 15, 4–12, http://dx.doi.org/10.1037//0893-164X.15.1.4.
Cacciola, J. S., Alterman, A. I., DePhilippis, D., Drapkin, M., Valades, C., Fala, N., et al. (2013).Development and initial evaluation of the Brief Addiction Monitor (BAM). Journal ofSubstance Abuse Treatment, 44, 256–263, http://dx.doi.org/10.1016/j.jsat.2012.07.013.
Center for Excellence in Substance Abuse Treatment and Education (CESATE). (2010).Brief Addiction Monitor: Manual of operations. Philadelphia, PA.
Cohen, J. (1988). Statistical power analysis for the behavioral sciences. Hillsdale, NJ:Lawrence Erlbaum Associates.
Cox, A., Pant, H., Gilson, A. N., Rodriguez, J. L., Young, K. R., Kwon, S., et al. (2012). Effectsof augmenting response options onMMPI–2 RC scale psychometrics. Journal of Person-ality Assessment, 94, 613–619, http://dx.doi.org/10.1080/00223891.2012.700464.
Daley, D. C., & Mercer, D. (2002). Drug manual for cocaine addiction: The CollaborativeCocaine Treatment Study model. Therapy manuals for drug addiction. Rockville, MD:National Institute on Drug Abuse.
Harris, A. H. S., Humphreys, K., Bowe, T., Kivlahan, D. R., & Finney, J. W. (2009). Measuringthe quality of substance use disorder treatment: Evaluating the validity of theDepartment of Veterans Affairs continuity of care performance measure. Journal ofSubstance Abuse Treatment, 36, 294–305, http://dx.doi.org/10.1016/j.jsat.2008.05.011.
Harris, A. H. S., Humphreys, K., & Finney, J.W. (2007). VeteransAffairs facility performanceon Washington Circle indicators and casemix-adjusted effectiveness. Journal ofSubstance Abuse Treatment, 33, 333–339, http://dx.doi.org/10.1016/j.jsat.2006.12.015.
Hernandez-Avila, C. A., Burleson, J. A., & Kranzler, H. R. (1998). Stage of change as apredictor of abstinence among alcohol-dependent subjects in pharmacotherapytrials. Substance Abuse, 19, 81–91, http://dx.doi.org/10.1023/A:1021323800809.
Huang, I., Wu, A. W., & Frangakis, C. (2006). Do the SF-36 and WHOQOL-BREF measurethe same constructs? Evidence from the Taiwan population. Quality of Life Research,15, 15–24, http://dx.doi.org/10.1007/s11136-005-8486-9.
McKay, James R. (2009). Measurement based care. Paper presented at VA EvidenceBased Practices Conference, New Orleans, August.
McLellan, A., Kushner, H., Metzger, D., & Peters, R. (1992). The fifth edition of theAddiction Severity Index. Journal of Substance Abuse Treatment, 9, 199–213,http://dx.doi.org/10.1016/0740-5472(92)90062-S.
Murphy, K. R., & Davidshofer, C. O. (2005). Psychological testing: Principles andapplications. Upper Saddle River, NJ: Pearson Prentice Hall.
O'Carroll, R. E., Smith, K. K., Couston, M. M., Cossar, J. A., & Hayes, P. C. (2000). Acomparison of the WHOQOL-100 and the WHOQOL-BREF in detecting change inquality of life following liver transplantation. Quality of Life Research, 9, 121–124,http://dx.doi.org/10.1023/A:1008901320492.
Rosen, C. S., Henson, B. R., Finney, J. W., & Moos, R. H. (2000). Consistency of self-administered and interview-based Addiction Severity Index composite scores.Addiction, 95, 419–425, http://dx.doi.org/10.1046/j.1360-0443.2000.95341912.x.
Skevington, S. M., Lotfy, M. M., & O'Connell, K. A. (2004). The World HealthOrganization's WHOQOL-BREF quality of life assessment: Psychometric pro-perties and results of the international field trial. A Report from the WHOQOLGroup. Quality of Life Research, 13, 299–310, http://dx.doi.org/10.1023/B:QURE.0000018486.91360.00.
Tiet, Q. Q., Byrnes, H. F., Barnett, P., & Finney, J. W. (2006). A practical system formonitoring the outcomes of substance use disorder patients. Journal of SubstanceAbuse Treatment, 30, 337–347, http://dx.doi.org/10.1016/j.jsat.2003.03.002.
Tiet, Q. Q., Ilgen, M. A., Byrnes, H. F., Harris, A. H. S., & Finney, J. W. (2007). Treatmentsetting and baseline substance use severity interact to predict patients' outcomes.Addiction, 102, 432–440, http://dx.doi.org/10.1111/j.1360-0443.2006.01717.x.
World Health Organization Quality of Life Group. (1998). Group development of theWorld Health Organization WHOQOL-BREF quality of life assessment. PsychologicalMedicine, 28, 551–558, http://dx.doi.org/10.1017/S0033291798006667.