Embed Size (px)
Citation preview

1
Examining the Fed and Rising Interest Rates
INV 330

2
Presenters
• Jason Headings
• Meeder Investment Management
• (614) 760-2111
CP
IM A
cad
emy
20
17
//
INV
33
0

3
CP
IM A
cad
emy
20
17
//
INV
33
0
Agenda
• History of the Fed
• Fed Mandates
• Current Complexion of the Fed
• What’s Next?

4
History of the Fed
CP
IM A
cad
emy
20
17
//
INV
33
0

5
HISTORY OF THE FED
• No central bank (Federal Reserve) in America
• Knickerbocker Trust loaning out 99% of its reserves
• Run on Banks
• Banks did not have enough cash on reserves
• JP Morgan bailed out the banking system
1907
6
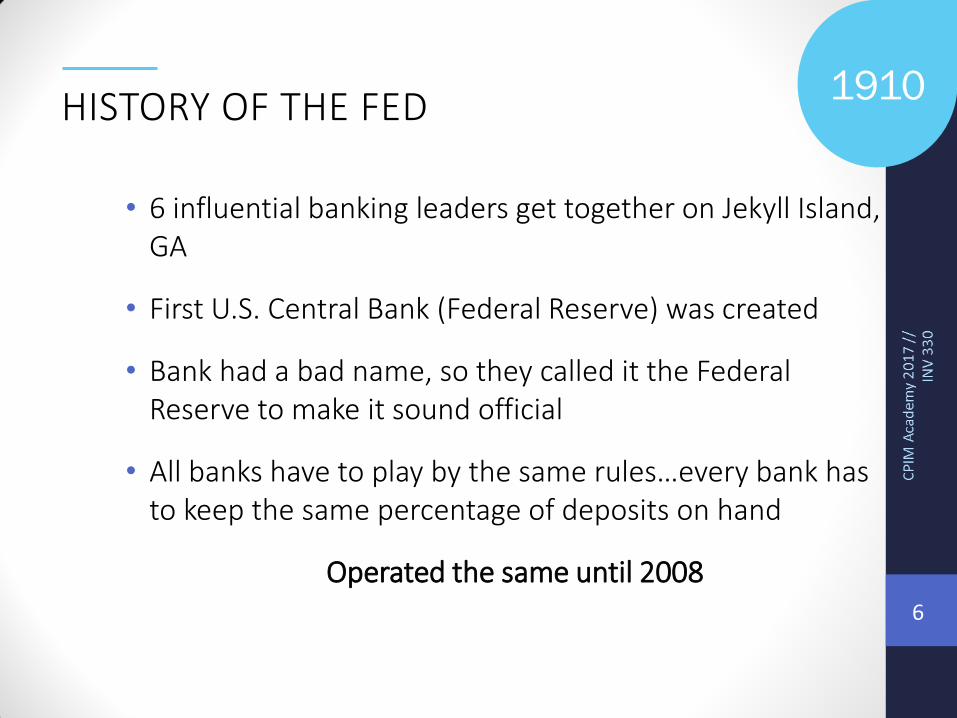
HISTORY OF THE FED
• 6 influential banking leaders get together on Jekyll Island, GA
• First U.S. Central Bank (Federal Reserve) was created
• Bank had a bad name, so they called it the Federal Reserve to make it sound official
• All banks have to play by the same rules…every bank has to keep the same percentage of deposits on hand
Operated the same until 2008
1910

7
Two workers carry the Lehman Brothers corporate logo away Sept. 24, 2010, in London, England. (Oli Scarff/Getty Images)
8
HISTORY OF THE FED
• Financial Services Regulatory Relief Act goes into effect
Congress allows the Fed to pay interest on required reserves AND excess reserves
• Roughly $1.6 billion in excess reserves.
• Roughly $68 billion in required reserves.
2008

9
QUANTITATIVE EASING BEGINS

10
FED BALANCE SHEET
Source: Board of Governors of the Federal Reserve System (US)
$0.00
$0.50
$1.00
$1.50
$2.00
$2.50
$3.00
$3.50
$4.00
$4.50
$5.00
Jan-03 Jan-04 Jan-05 Jan-06 Jan-07 Jan-08 Jan-09 Jan-10 Jan-11 Jan-12 Jan-13 Jan-14 Jan-15 Jan-16 Jan-17
Trill
ion
s
$3.5 Trillion
11
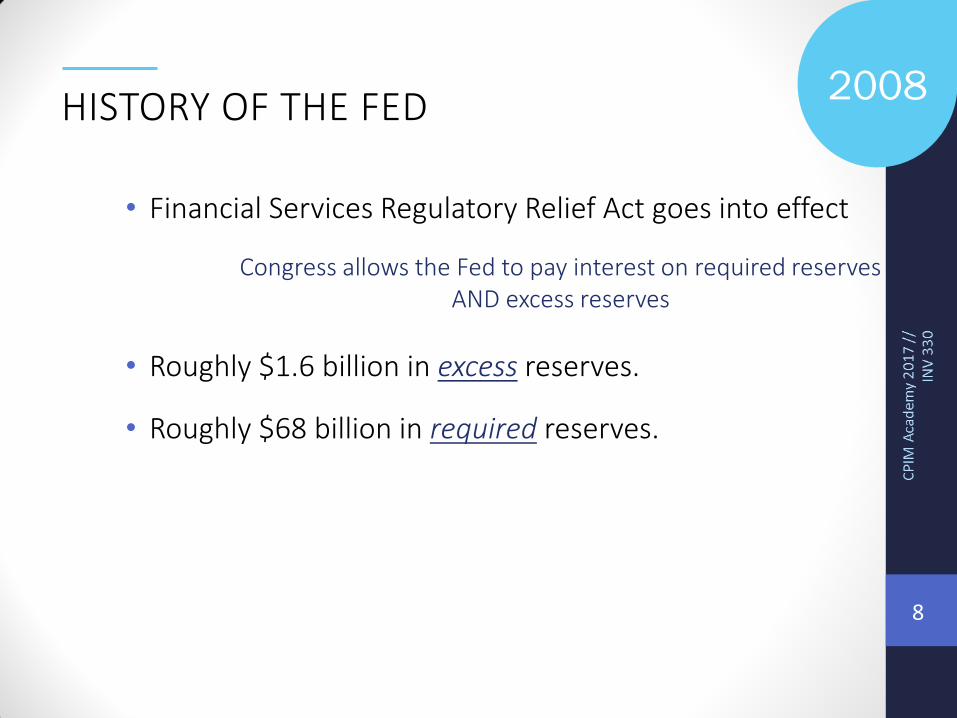
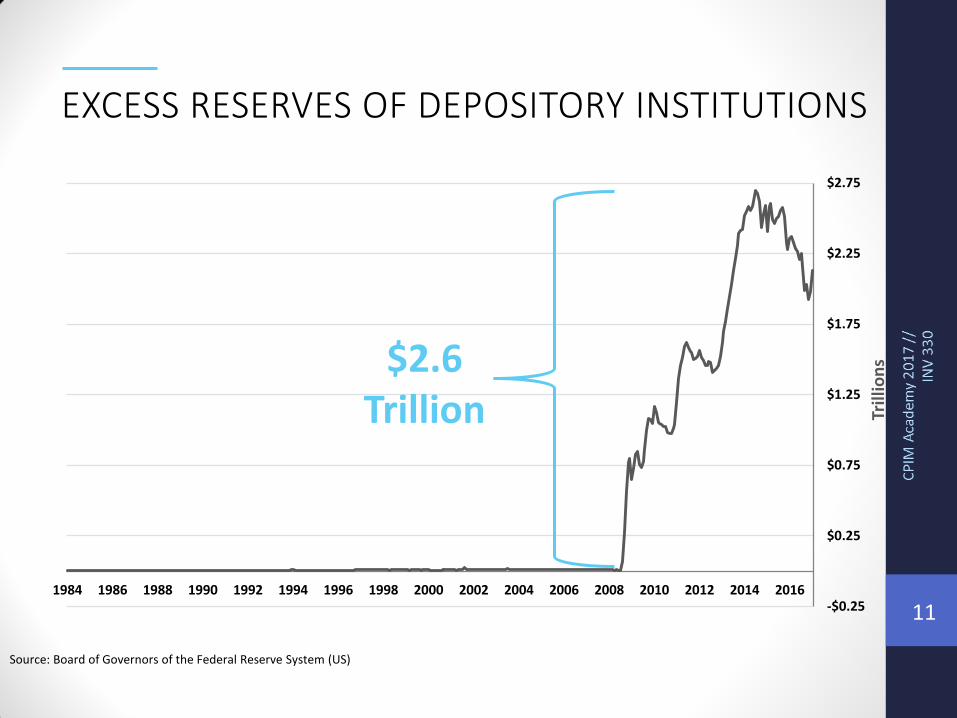
EXCESS RESERVES OF DEPOSITORY INSTITUTIONS
Source: Board of Governors of the Federal Reserve System (US)
-$0.25
$0.25
$0.75
$1.25
$1.75
$2.25
$2.75
1984 1986 1988 1990 1992 1994 1996 1998 2000 2002 2004 2006 2008 2010 2012 2014 2016
Trill
ion
s $2.6 Trillion

12
Fed Mandates

13
MANDATE OF THE FED
• Price Stability/Inflation
• Employment
• Rate Stabilization/Manage Bubbles

14
Inflation

15
INFLATION Personal Consumption Expenditures (PCE)
Source: Bloomberg
-2.00%
0.00%
2.00%
4.00%
6.00%
8.00%
10.00%
12.00%
14.00%
1965 1970 1975 1980 1985 1990 1995 2000 2005 2010 2015
Headline PCE: 1.90% Core PCE: 1.74% Fed Target: 2.00%

16
INFLATION 10 Year Treasury Yield
Source: Bloomberg
0.00%
1.00%
2.00%
3.00%
4.00%
5.00%
6.00%
7.00%
8.00%
9.00%
10.00%
Jan
-90
Jan
-91
Jan
-92
Jan
-93
Jan
-94
Jan
-95
Jan
-96
Jan
-97
Jan
-98
Jan
-99
Jan
-00
Jan
-01
Jan
-02
Jan
-03
Jan
-04
Jan
-05
Jan
-06
Jan
-07
Jan
-08
Jan
-09
Jan
-10
Jan
-11
Jan
-12
Jan
-13
Jan
-14
Jan
-15
Jan
-16
Jan
-17
AHH! We have inflation!
AHH! We have inflation!
AHH! We have inflation!
AHH! We have deflation!
AHH! We have inflation!
17
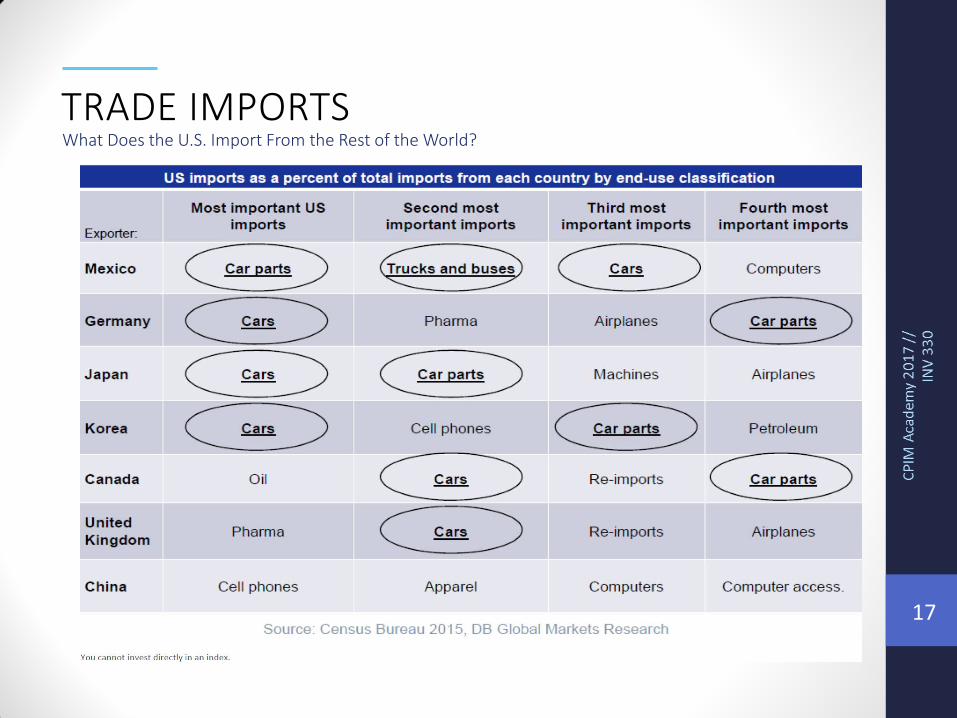
TRADE IMPORTS What Does the U.S. Import From the Rest of the World?

18
INFLATION OUTLOOK U.S. 5-Year Breakeven Index
Source: Bloomberg
0.00%
0.50%
1.00%
1.50%
2.00%
2.50%
3.00%
No
v-1
2
Jan
-13
Mar
-13
May
-13
Jul-
13
Sep
-13
No
v-1
3
Jan
-14
Mar
-14
May
-14
Jul-
14
Sep
-14
No
v-1
4
Jan
-15
Mar
-15
May
-15
Jul-
15
Sep
-15
No
v-1
5
Jan
-16
Mar
-16
May
-16
Jul-
16
Sep
-16
No
v-1
6
Jan
-17
19
Unemployment

20
UNEMPLOYMENT Federal Funds Rate and Unemployment Rate, 1971-2016
Source: Bloomberg
0.00%
2.00%
4.00%
6.00%
8.00%
10.00%
12.00%
14.00%
16.00%
18.00%
20.00%
197
0
197
1
197
2
197
4
197
5
197
7
197
8
197
9
198
1
198
2
198
4
198
5
198
7
198
8
198
9
199
1
199
2
199
4
199
5
199
6
199
8
199
9
200
1
200
2
200
4
200
5
200
6
200
8
200
9
201
1
201
2
201
3
201
5
201
6
Unemployment Rate (US) Federal Funds Rate
Since the Great Recession the quarterly unemployment rate has fallen by half – from a peak 9.9% to a low of 4.70% - while the federal funds has
remained low by historical standards.

21
FED MANDATE: UNEMPLOYMENT
Source: Bureau of Labor Statistics

22
UNEMPLOYMENT BY EDUCATION LEVEL Ages 25 and Greater
Source: Bureau of Labor Statistics
0.00%
2.00%
4.00%
6.00%
8.00%
10.00%
12.00%
14.00%
16.00%
18.00%
20.00%
19
92
19
93
19
94
19
95
19
96
19
97
19
98
19
99
20
00
20
01
20
02
20
03
20
04
20
05
20
06
20
07
20
08
20
09
20
10
201
1
20
12
20
13
20
14
20
15
20
16
20
17
Less than a High School diploma High School graduates, no college
Some college or associate degree Bachelor's degree and higher
Education Level Jan. 2017 Less than high school degree 7.9% High school no college 5.0% Some college 4.0% Bachelor’s degree and higher 2.4%

23
Student Loans

24
STUDENT LOAN DEBT Outstanding student loan debt
Source: Federal Reserve Center for Microeconomic data as of March 2017
$1.31T
$0.0
$0.2
$0.4
$0.6
$0.8
$1.0
$1.2
$1.4
Mar
-03
Aug
-03
Jan-
04
Jun
-04
No
v-04
Apr
-05
Sep
-05
Feb
-06
Jul-
06
Dec
-06
May
-07
Oct
-07
Mar
-08
Aug
-08
Jan-
09
Jun
-09
No
v-09
Apr
-10
Sep
-10
Feb
-11
Jul-
11
Dec
-11
May
-12
Oct
-12
Mar
-13
Aug
-13
Jan-
14
Jun
-14
No
v-14
Apr
-15
Sep
-15
Feb
-16
Jul-
16
Dec
-16
In T
rilli
on
s
The current student debt amount is rising at a rate of $2,667 per second. This number is estimated by calculating the per second change in student debt from Q1 2006 to Q4 2016 using debt data from the Federal Reserve.
25
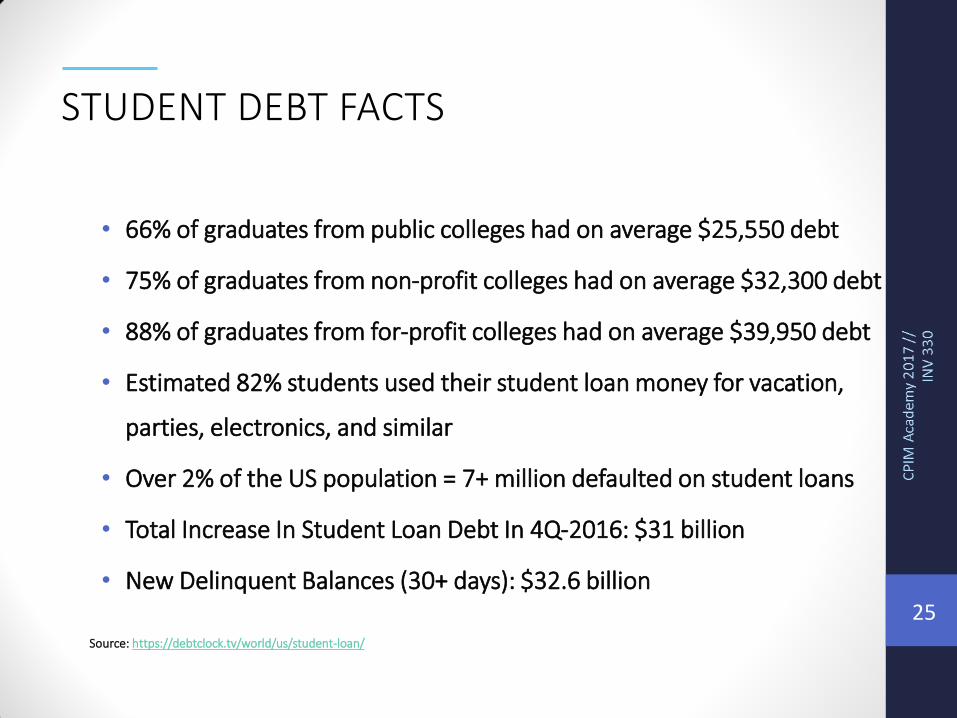
STUDENT DEBT FACTS
• 66% of graduates from public colleges had on average $25,550 debt
• 75% of graduates from non-profit colleges had on average $32,300 debt
• 88% of graduates from for-profit colleges had on average $39,950 debt
• Estimated 82% students used their student loan money for vacation,
parties, electronics, and similar
• Over 2% of the US population = 7+ million defaulted on student loans
• Total Increase In Student Loan Debt In 4Q-2016: $31 billion
• New Delinquent Balances (30+ days): $32.6 billion
Source: https://debtclock.tv/world/us/student-loan/

26
STUDENT DEBT FACTS Failing to Repay

27
STUDENT LOAN DELINQUENCY Student Loans 90+ Days Delinquent as Percent Loans Outstanding
Source: Federal Reserve Center for Microeconomic data as of March 2017
$1.31T
0%
2%
4%
6%
8%
10%
12%
14%
$0.0
$0.2
$0.4
$0.6
$0.8
$1.0
$1.2
$1.4
Mar
-03
Sep
-03
Mar
-04
Sep
-04
Mar
-05
Sep
-05
Mar
-06
Sep
-06
Mar
-07
Sep
-07
Mar
-08
Sep
-08
Mar
-09
Sep
-09
Mar
-10
Sep
-10
Mar
-11
Sep
-11
Mar
-12
Sep
-12
Mar
-13
Sep
-13
Mar
-14
Sep
-14
Mar
-15
Sep
-15
Mar
-16
Sep
-16
Outstanding Student Loan Debt Percent 90+ Days Delinquent
In T
rilli
on
s

28
CONSUMER CREDIT DELINQUENCIES Percent Of Balance 90+ Days Delinquent By Loan Type
Source: Federal Reserve Center for Microeconomic data as of March 2017
MORTGAGE
AUTO
STUDENT LOAN
0.00
2.00
4.00
6.00
8.00
10.00
12.00
14.00
16.00
Mar
-03
Sep
-03
Mar
-04
Sep
-04
Mar
-05
Sep
-05
Mar
-06
Sep
-06
Mar
-07
Sep
-07
Mar
-08
Sep
-08
Mar
-09
Sep
-09
Mar
-10
Sep
-10
Mar
-11
Sep
-11
Mar
-12
Sep
-12
Mar
-13
Sep
-13
Mar
-14
Sep
-14
Mar
-15
Sep
-15
Mar
-16
Sep
-16
CREDIT CARD

29
STUDENT DEBT STATISTICS Average student loan debt by state
Source: Forbes
30
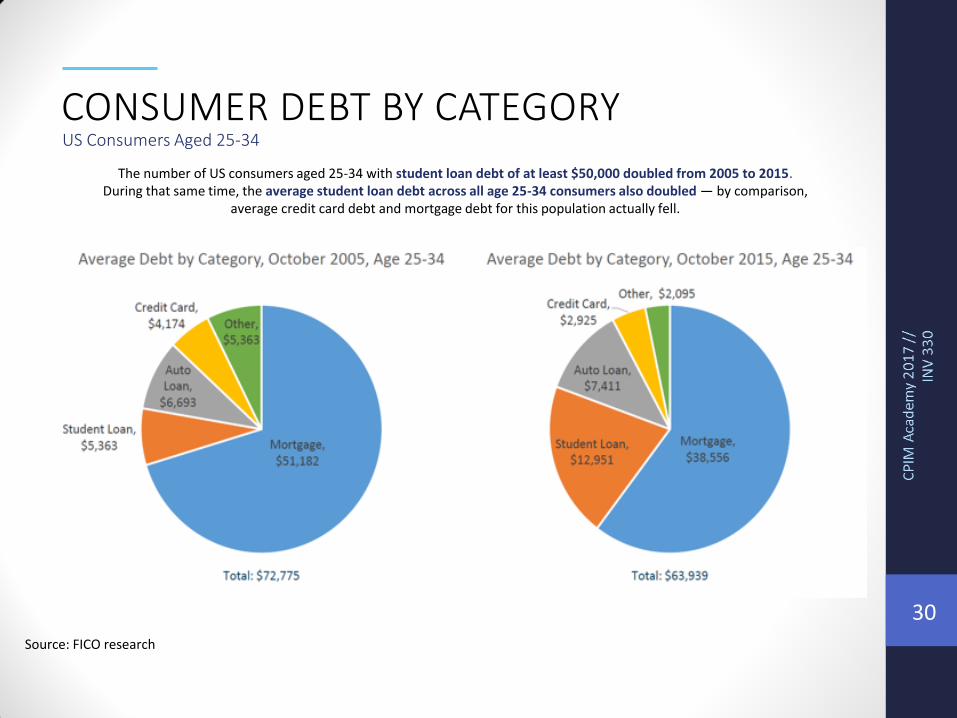
CONSUMER DEBT BY CATEGORY US Consumers Aged 25-34
The number of US consumers aged 25-34 with student loan debt of at least $50,000 doubled from 2005 to 2015. During that same time, the average student loan debt across all age 25-34 consumers also doubled — by comparison,
average credit card debt and mortgage debt for this population actually fell.
Source: FICO research
31
Current Complexion of the Fed
32
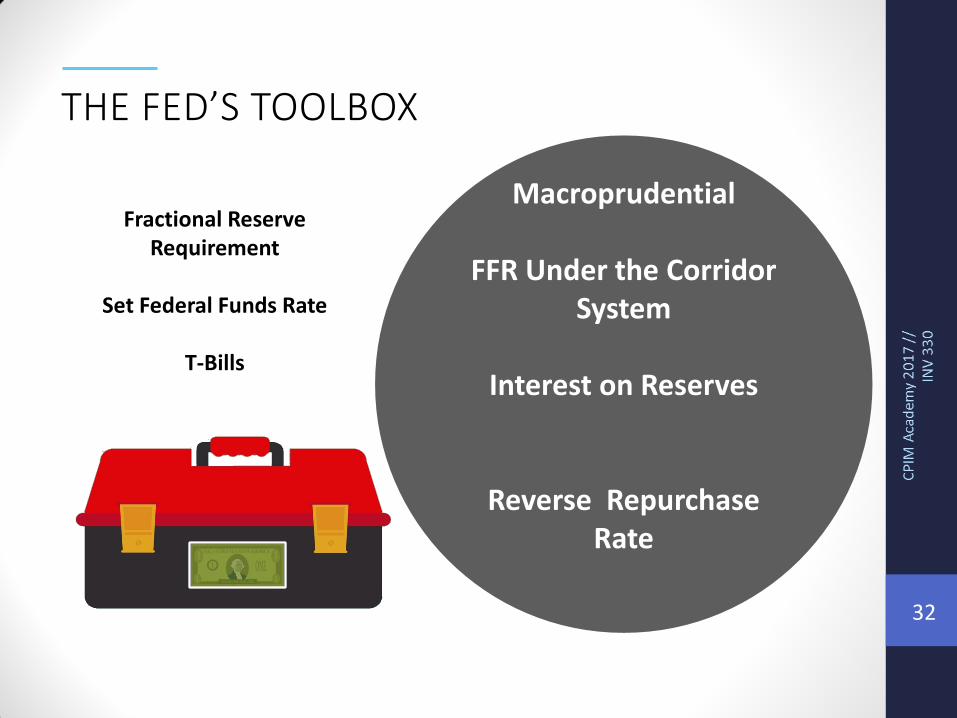
THE FED’S TOOLBOX
Fractional Reserve Requirement
Set Federal Funds Rate
T-Bills
Macroprudential
FFR Under the Corridor
System
Interest on Reserves
Reverse Repurchase Rate
33
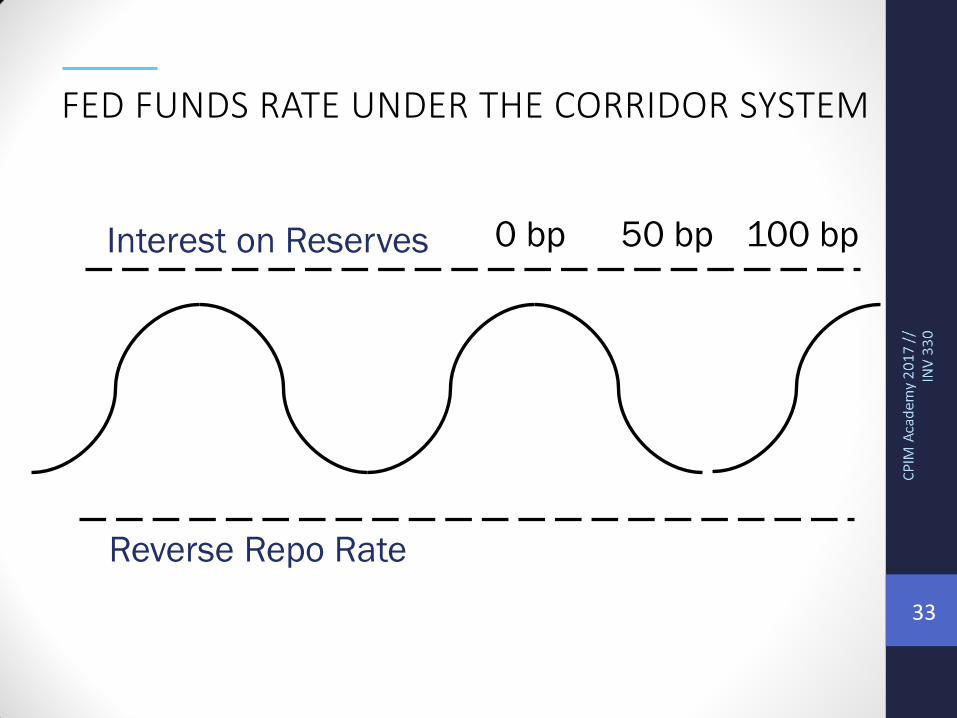
FED FUNDS RATE UNDER THE CORRIDOR SYSTEM
Interest on Reserves 0 bp 100 bp 50 bp
Reverse Repo Rate

34
FUN FED FACTS
Yellen has been know to take an entire suitcase of
books on vacation
35
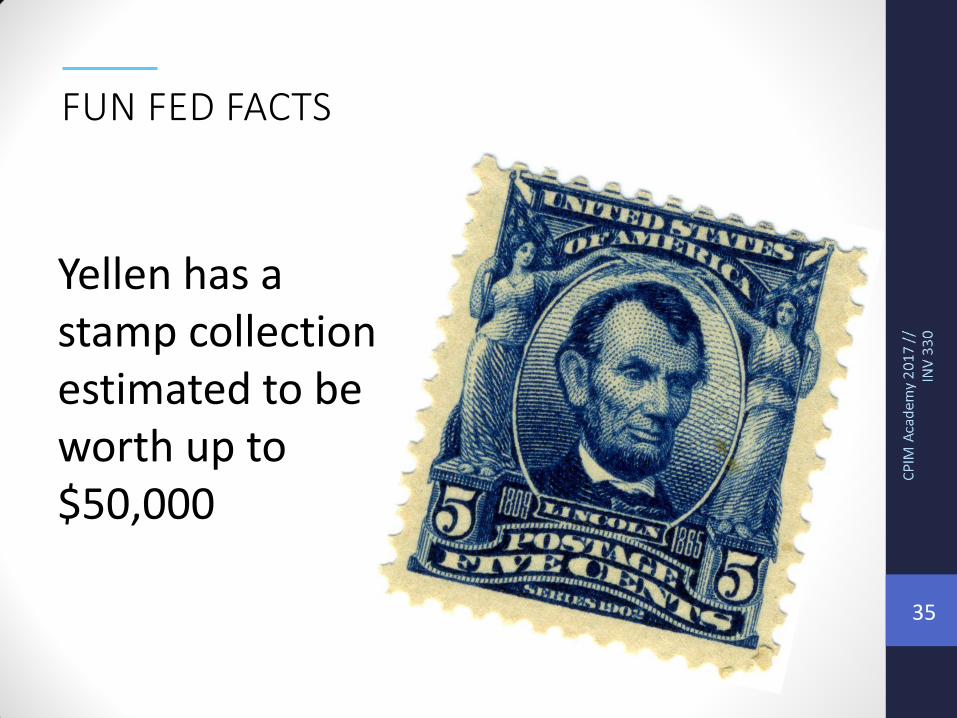
FUN FED FACTS
Yellen has a stamp collection estimated to be worth up to $50,000
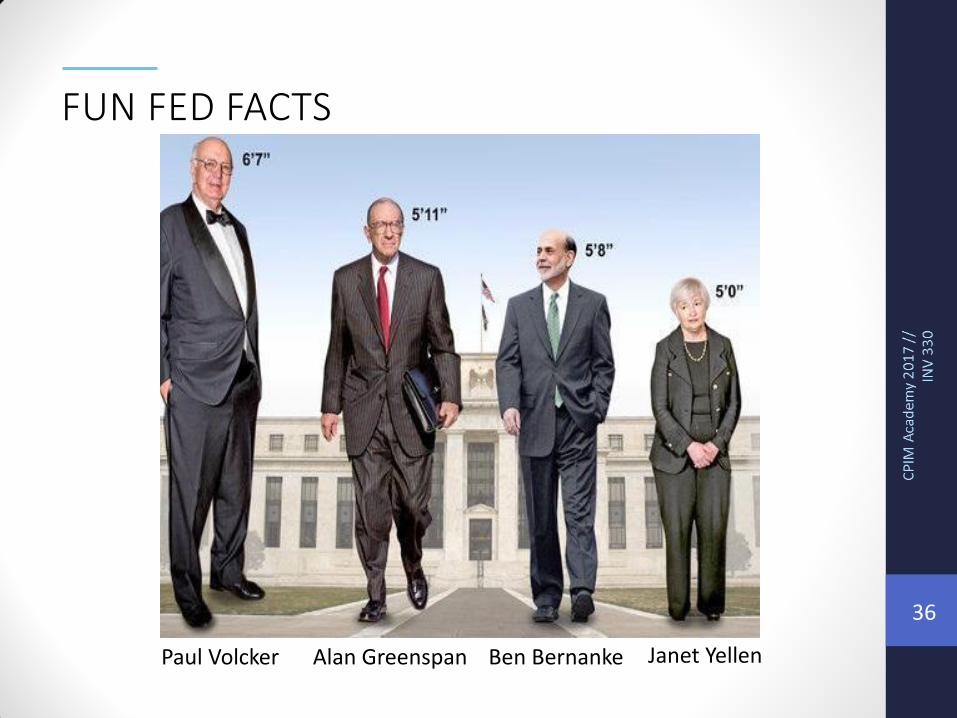
36
FUN FED FACTS
Paul Volcker Alan Greenspan Ben Bernanke Janet Yellen

37
FUN FED FACTS Who Makes up the “Fed”?
Federal Reserve Board of Governors Term End (Chair and Vice Chair) End of Term as Governor
Janet Yellen (Chair) February 2018 2024
Stanley Fischer (Vice Chair) June 2018 2020
Daniel Tarullo Retiring April 2017 2022
Lael Brainard 2026
Jerome Powell 2028
Vacant 2018
Vacant 2030
FOMC District Bank Voters in 2017 District
William Dudley New York
Patrick Harker Philadelphia
Charles Evans Chicago
Neel Kashkari Minneapolis
Robert Kaplan Dallas

38
VOTER RELIABILITY
Source: Bloomberg

39
FED BALANCE SHEET
Source: Board of Governors of the Federal Reserve System (US)
$0.00
$0.50
$1.00
$1.50
$2.00
$2.50
$3.00
$3.50
$4.00
$4.50
$5.00
Jan-03 Jan-04 Jan-05 Jan-06 Jan-07 Jan-08 Jan-09 Jan-10 Jan-11 Jan-12 Jan-13 Jan-14 Jan-15 Jan-16 Jan-17
Trill
ion
s $3.5 Trillion
40
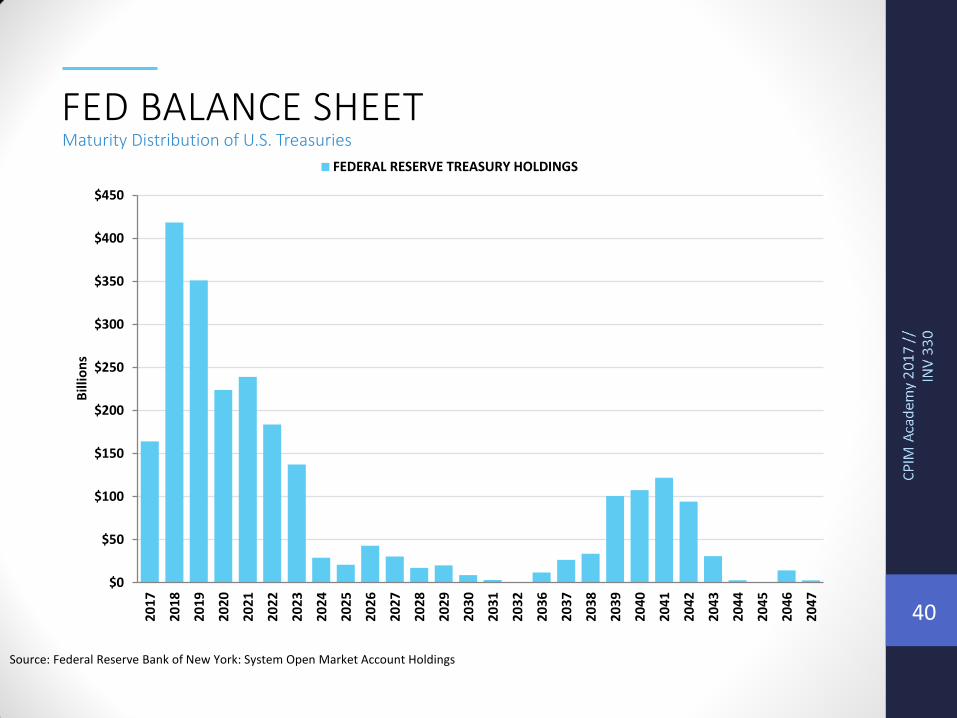
FED BALANCE SHEET Maturity Distribution of U.S. Treasuries
Source: Federal Reserve Bank of New York: System Open Market Account Holdings
$0
$50
$100
$150
$200
$250
$300
$350
$400
$450
2017
2018
2019
202
0
2021
2022
202
3
2024
2025
202
6
2027
2028
202
9
2030
2031
2032
2036
2037
2038
2039
2040
2041
2042
2043
204
4
2045
2046
204
7
Bill
ion
s
FEDERAL RESERVE TREASURY HOLDINGS
41
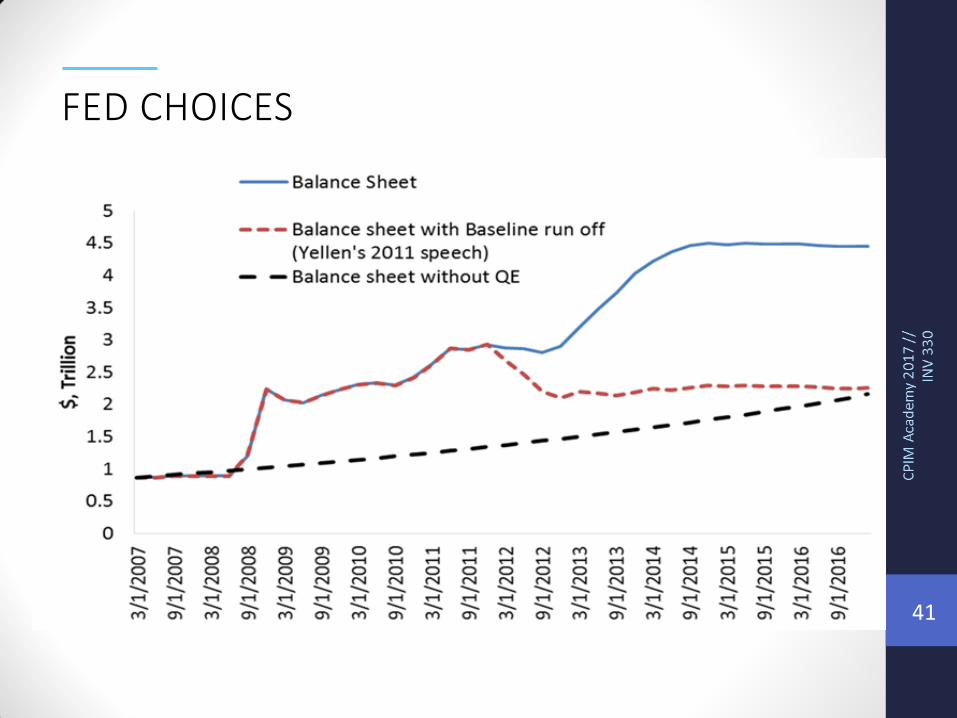
FED CHOICES

42
BUT WHAT ABOUT DEBT AND DEFICITS?
Source: Congressional Budget Office, 2015.
0%
10%
20%
30%
40%
1945 1953 1963 1969 1974 1977 1981 1989 1993 2001 2009
U.S. Treasury, federal budgettotal receipts as a percent of GDP
U.S. Treasury, federal budgettotal outlays as a percent of GDP
1961
Top 5 Holders of U.S. Debt
1. U.S. Government: Fed, Social Security Trust Fund & Other ($7.5 Trillion)
3. Savings Bonds and Other Investors ($1.2 Trillion)
5. Pension Funds ($0.6 Trillion)
2. China ($1.3 Trillion)
4. Japan ($1.1 Trillion)
43
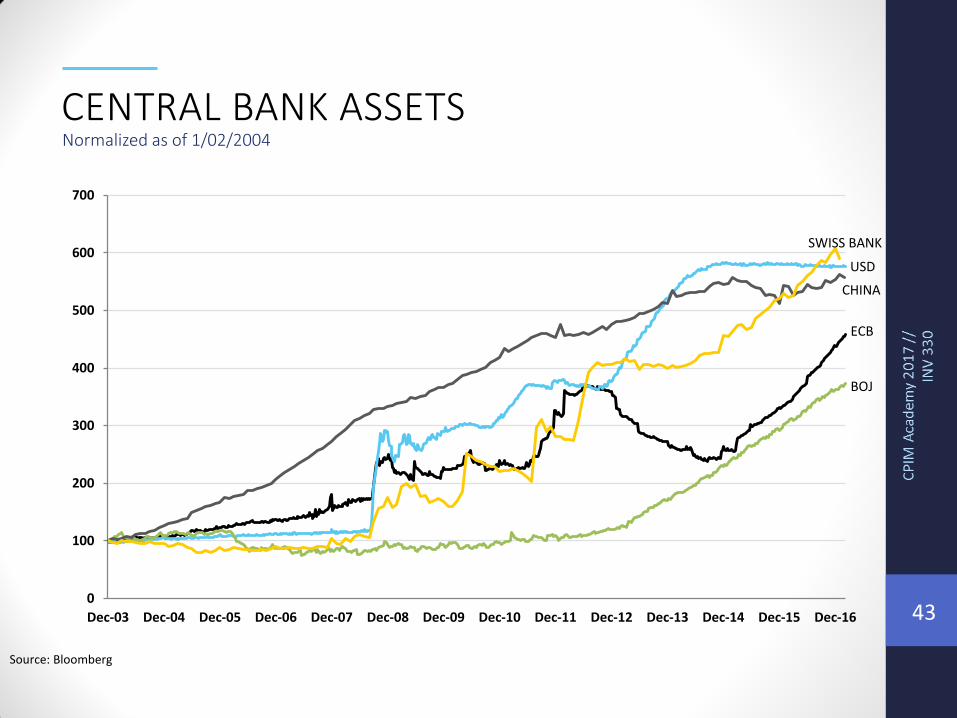
CENTRAL BANK ASSETS Normalized as of 1/02/2004
Source: Bloomberg
ECB
USD
BOJ
CHINA
SWISS BANK
0
100
200
300
400
500
600
700
Dec-03 Dec-04 Dec-05 Dec-06 Dec-07 Dec-08 Dec-09 Dec-10 Dec-11 Dec-12 Dec-13 Dec-14 Dec-15 Dec-16

44
GLOBAL BOND MARKET
Source: JPMorgan Guide to the Markets
45
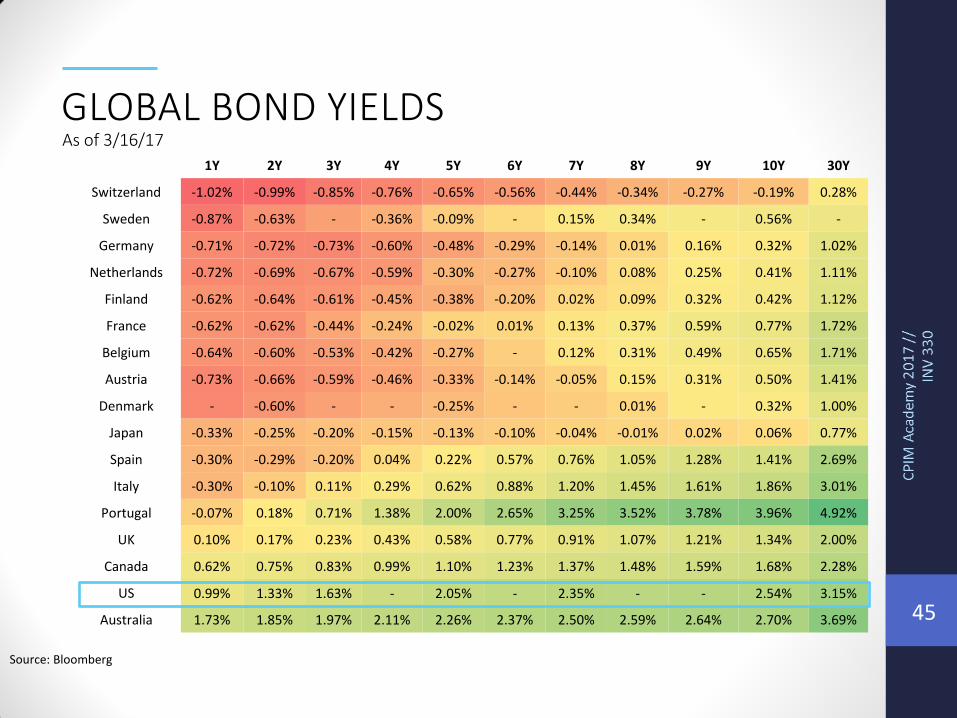
GLOBAL BOND YIELDS As of 3/16/17
1Y 2Y 3Y 4Y 5Y 6Y 7Y 8Y 9Y 10Y 30Y
Switzerland -1.02% -0.99% -0.85% -0.76% -0.65% -0.56% -0.44% -0.34% -0.27% -0.19% 0.28%
Sweden -0.87% -0.63% - -0.36% -0.09% - 0.15% 0.34% - 0.56% -
Germany -0.71% -0.72% -0.73% -0.60% -0.48% -0.29% -0.14% 0.01% 0.16% 0.32% 1.02%
Netherlands -0.72% -0.69% -0.67% -0.59% -0.30% -0.27% -0.10% 0.08% 0.25% 0.41% 1.11%
Finland -0.62% -0.64% -0.61% -0.45% -0.38% -0.20% 0.02% 0.09% 0.32% 0.42% 1.12%
France -0.62% -0.62% -0.44% -0.24% -0.02% 0.01% 0.13% 0.37% 0.59% 0.77% 1.72%
Belgium -0.64% -0.60% -0.53% -0.42% -0.27% - 0.12% 0.31% 0.49% 0.65% 1.71%
Austria -0.73% -0.66% -0.59% -0.46% -0.33% -0.14% -0.05% 0.15% 0.31% 0.50% 1.41%
Denmark - -0.60% - - -0.25% - - 0.01% - 0.32% 1.00%
Japan -0.33% -0.25% -0.20% -0.15% -0.13% -0.10% -0.04% -0.01% 0.02% 0.06% 0.77%
Spain -0.30% -0.29% -0.20% 0.04% 0.22% 0.57% 0.76% 1.05% 1.28% 1.41% 2.69%
Italy -0.30% -0.10% 0.11% 0.29% 0.62% 0.88% 1.20% 1.45% 1.61% 1.86% 3.01%
Portugal -0.07% 0.18% 0.71% 1.38% 2.00% 2.65% 3.25% 3.52% 3.78% 3.96% 4.92%
UK 0.10% 0.17% 0.23% 0.43% 0.58% 0.77% 0.91% 1.07% 1.21% 1.34% 2.00%
Canada 0.62% 0.75% 0.83% 0.99% 1.10% 1.23% 1.37% 1.48% 1.59% 1.68% 2.28%
US 0.99% 1.33% 1.63% - 2.05% - 2.35% - - 2.54% 3.15%
Australia 1.73% 1.85% 1.97% 2.11% 2.26% 2.37% 2.50% 2.59% 2.64% 2.70% 3.69%
Source: Bloomberg
46
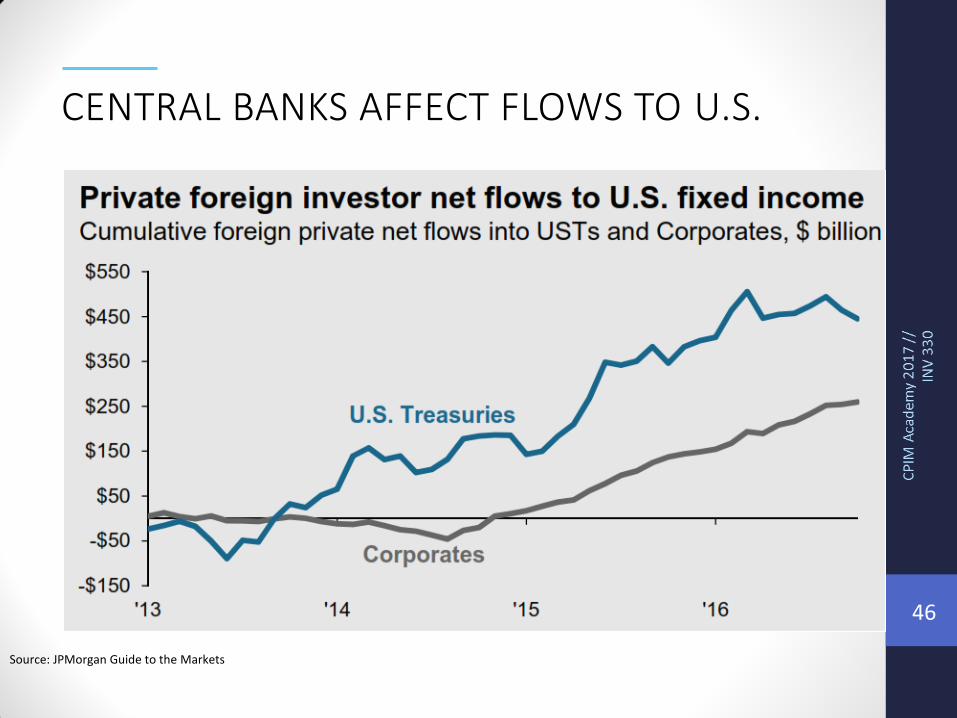
CENTRAL BANKS AFFECT FLOWS TO U.S.
Source: JPMorgan Guide to the Markets

47
What’s Next?

48
OUR CAMPAIGNS HAVE NEVER BEEN FILLED WITH SUCH VITRIOL, RIGHT?
John Adams
Thomas Jefferson

49
TRUMP & YELLEN
You’re Fired!

50
POSSIBLE ADDITIONS
• Ron Paul – former Texas Representative
• John Taylor – the “Oz” behind the Taylor Rule
• John Allison IV – Cato Institute and former CEO of BB&T
• Paul Atkins – former SEC member
• Tom Hoenig – VC of FDIC, and former head of Kansas City Fed
51
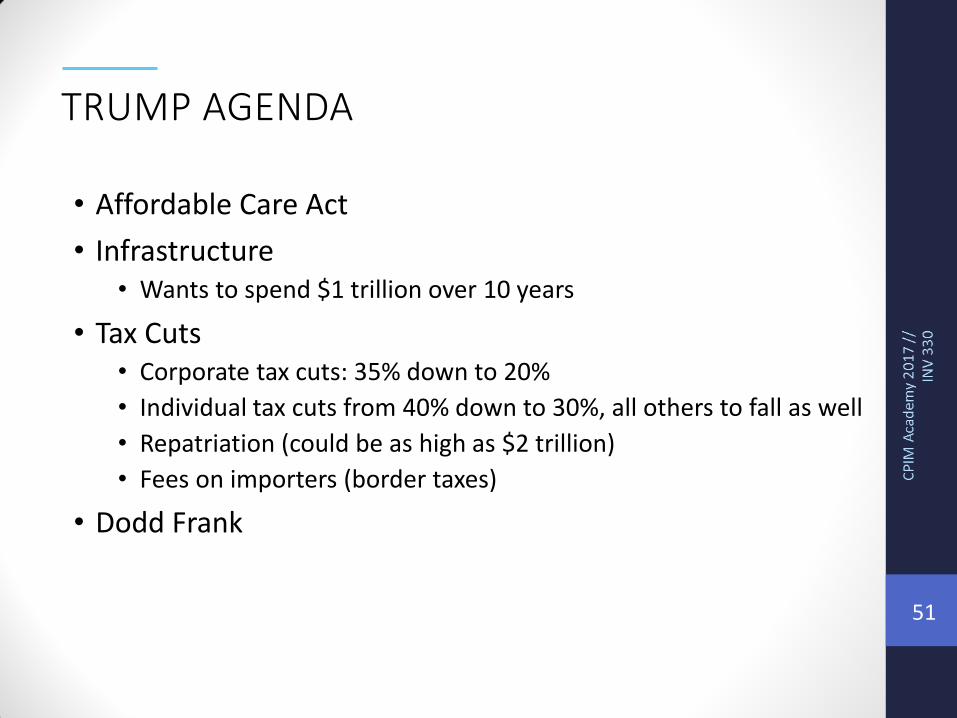
TRUMP AGENDA
• Affordable Care Act
• Infrastructure • Wants to spend $1 trillion over 10 years
• Tax Cuts • Corporate tax cuts: 35% down to 20%
• Individual tax cuts from 40% down to 30%, all others to fall as well
• Repatriation (could be as high as $2 trillion)
• Fees on importers (border taxes)
• Dodd Frank

52
0.00%
0.50%
1.00%
1.50%
2.00%
2.50%
3.00%
3.50%
4.00%
09/17/14 12/17/14 03/18/15 06/17/15 09/17/15 12/16/15 03/16/16 06/15/16 09/21/16 12/14/16
The Median of the Federal Open Market Committee's Dots Data
The Overnight Index Swap Implied Interest Rate as of the FOMC Meeting Date
FED “DOT PLOT” VS MARKET EXPECTATIONS Historical projections for December 31, 2017
Meeting Date
Source: Bloomberg
53
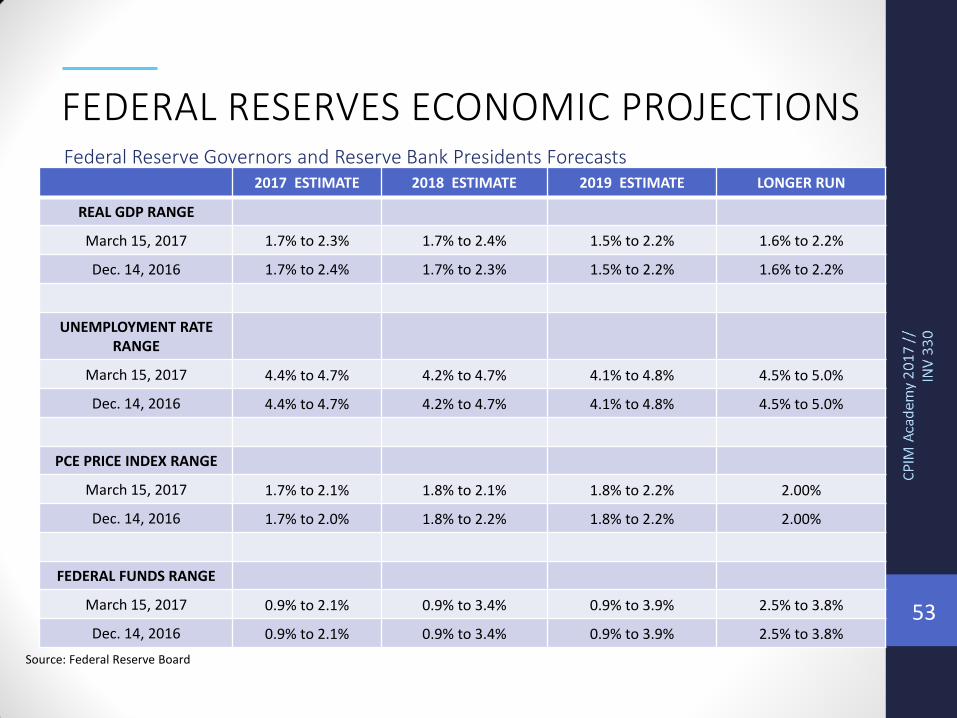
FEDERAL RESERVES ECONOMIC PROJECTIONS Federal Reserve Governors and Reserve Bank Presidents Forecasts
2017 ESTIMATE 2018 ESTIMATE 2019 ESTIMATE LONGER RUN
REAL GDP RANGE
March 15, 2017 1.7% to 2.3% 1.7% to 2.4% 1.5% to 2.2% 1.6% to 2.2%
Dec. 14, 2016 1.7% to 2.4% 1.7% to 2.3% 1.5% to 2.2% 1.6% to 2.2%
UNEMPLOYMENT RATE RANGE
March 15, 2017 4.4% to 4.7% 4.2% to 4.7% 4.1% to 4.8% 4.5% to 5.0%
Dec. 14, 2016 4.4% to 4.7% 4.2% to 4.7% 4.1% to 4.8% 4.5% to 5.0%
PCE PRICE INDEX RANGE
March 15, 2017 1.7% to 2.1% 1.8% to 2.1% 1.8% to 2.2% 2.00%
Dec. 14, 2016 1.7% to 2.0% 1.8% to 2.2% 1.8% to 2.2% 2.00%
FEDERAL FUNDS RANGE
March 15, 2017 0.9% to 2.1% 0.9% to 3.4% 0.9% to 3.9% 2.5% to 3.8%
Dec. 14, 2016 0.9% to 2.1% 0.9% to 3.4% 0.9% to 3.9% 2.5% to 3.8%
Source: Federal Reserve Board
54
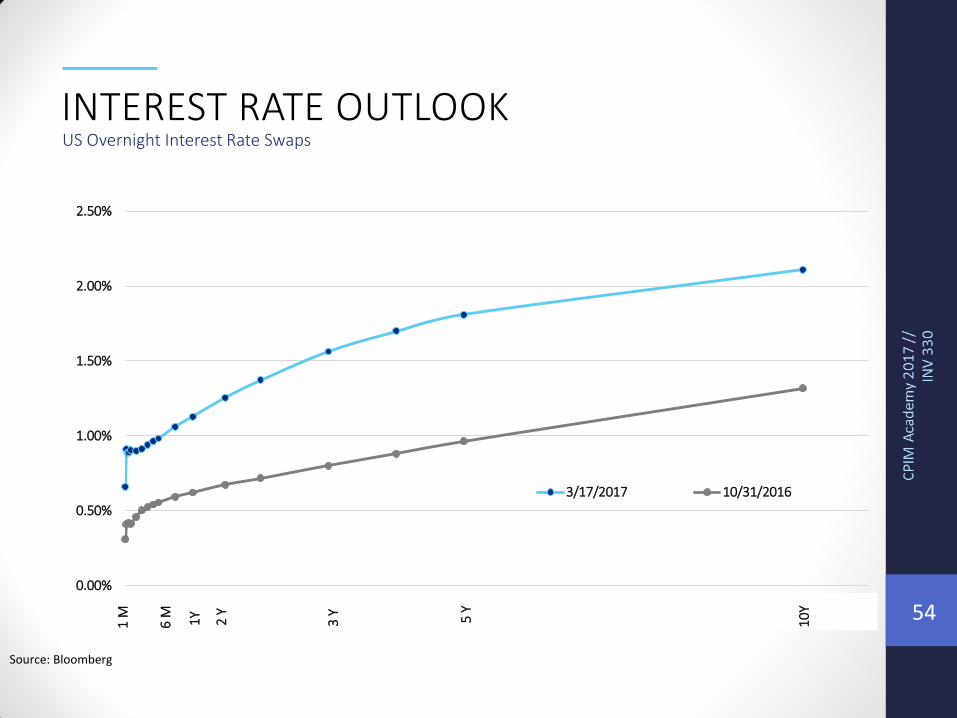
INTEREST RATE OUTLOOK US Overnight Interest Rate Swaps
Source: Bloomberg
0.00%
0.50%
1.00%
1.50%
2.00%
2.50%
J M S F J N M J D
3/17/2017 10/31/2016
1 M
6 M
2 Y
1Y
3 Y
10
Y
5 Y