Embed Size (px)
Citation preview
Examensarbete Institutionen för ekologi
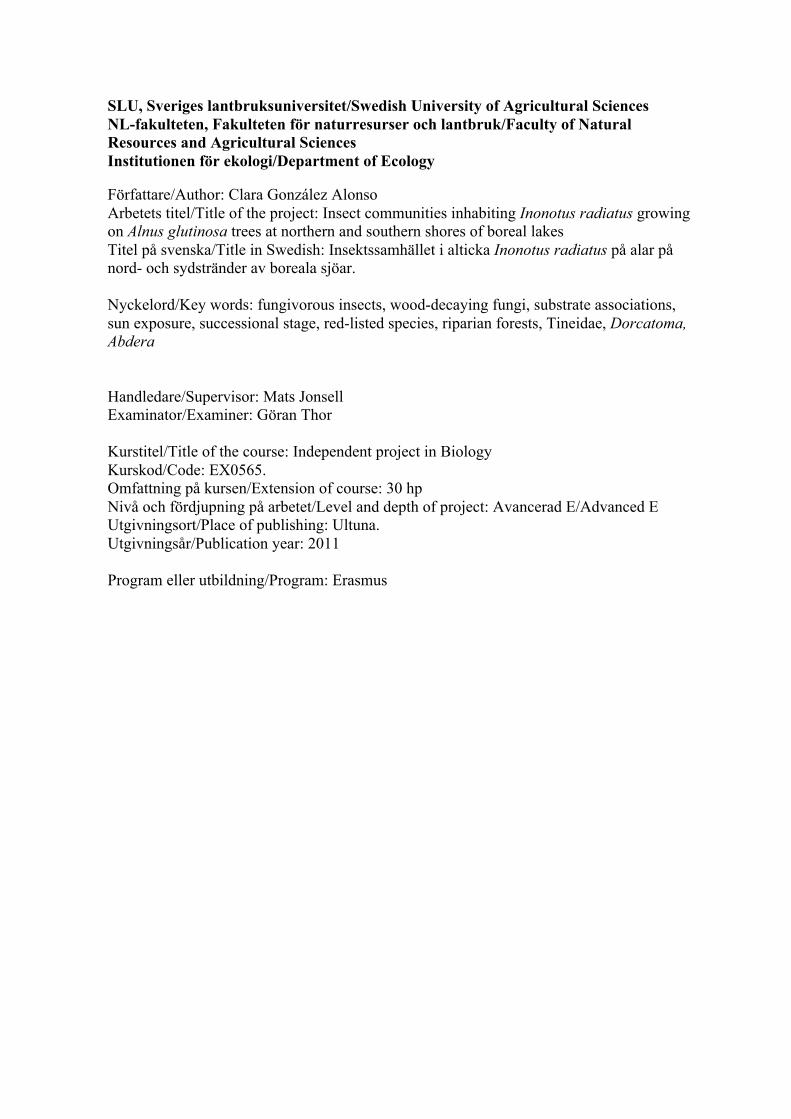
Insect communities inhabiting Inonotus radiatus growing on Alnus glutinosa trees at northern and southern shores of boreal lakes
Clara González Alonso SJÄLVSTÄNDIGT ARBETE,/INDEPENDENT PROJECT, BIOLOGY, OR MASTER’S THESIS BIOLOGY, E-NIVÅ/LEVEL, 30 HP HANDLEDARE (SUPERVISOR) : MATS JONSELL, INST F EKOLOGI/ DEPT OF ECOLOGY BITR HANDLEDARE (COSUPERVISOR): ATTE KOMONEN, INST F EKOLOGI/ DEPT OF ECOLOGY
EXAMINATOR (EXAMINER): GÖRAN THOR, INST. F. EKOLOGI/DEPT OF ECOLOGY
Examensarbete 2010:13 Uppsala 2010
SLU, Institutionen för ekologi
Box 7044, 750 07 Uppsala
SLU, Sveriges lantbruksuniversitet/Swedish University of Agricultural Sciences NL-fakulteten, Fakulteten för naturresurser och lantbruk/Faculty of Natural Resources and Agricultural Sciences Institutionen för ekologi/Department of Ecology Författare/Author: Clara González Alonso Arbetets titel/Title of the project: Insect communities inhabiting Inonotus radiatus growing on Alnus glutinosa trees at northern and southern shores of boreal lakes Titel på svenska/Title in Swedish: Insektssamhället i alticka Inonotus radiatus på alar på nord- och sydstränder av boreala sjöar. Nyckelord/Key words: fungivorous insects, wood-decaying fungi, substrate associations, sun exposure, successional stage, red-listed species, riparian forests, Tineidae, Dorcatoma, Abdera Handledare/Supervisor: Mats Jonsell Examinator/Examiner: Göran Thor Kurstitel/Title of the course: Independent project in Biology Kurskod/Code: EX0565. Omfattning på kursen/Extension of course: 30 hp Nivå och fördjupning på arbetet/Level and depth of project: Avancerad E/Advanced E Utgivningsort/Place of publishing: Ultuna. Utgivningsår/Publication year: 2011 Program eller utbildning/Program: Erasmus
ABSTRACT This is a study of the insect community associated to the wood-decaying fungus Inonotus radiatus found on Alnus glutinosa trees growing in riparian forests at the northern and southern shores of boreal lakes in the province Uppland. Little is known about this particular bracket fungus and its inhabitants. Insects were reared out at the laboratory from samples of fruiting bodies of the fungus taken at five lakes. During the fieldwork in 2009, data about several environmental variables was also taken. After the rearing period, these variables and their effects over the insects were analyzed. Special attention is paid to the comparison between the insect communities living at northern and southern shores of the lakes. We consider the microclimates at the northern and southern shores are different due to the dissimilar sun exposure they receive. The collected insect communities associated to opposite shores are not identical, but the variable shore exposition turned out to be influencing just four of the studied taxa. The variables which turned out to have a greater impact over the insect communities were lake, weight of the fungus and sun exposure. The preferences regarding successional stage of the fruiting bodies by some of the collected taxa are also presented. Most of them seem to be more attracted by older fruiting bodies than by the new and fresher ones. One red-listed beetle species has been recorded during the project, as well as three other species which were included in previous Red Lists although they are no longer on the Swedish Red List. Distributions of insect species are also revised to analyze the accuracy of the Red List. SAMMANFATTNING Detta är en studie av insektsamhället som lever i altickor Inonotus radiatus på alar i strandskogar på nordliga och sydliga stränder av sjöar i Uppland. Insektssamhället i denna ticka är ganska dåligt utforskat. Prover av tickor samlades in samlades in vid fem sjöar under vintern 2009. Insekter kläcktes fram ur dem på lab. Ett flertal miljövariabler noterades för varje prov och analyser gjordes av vilka av dem som påverkar artanatal och antal individer av specifika arter. Speciellt intresserad var jag av skillanden mellan nordliga och sydliga stränder, med hypotesen att det varmare mikroklimat som finns på de solexponerade nordliga sträderna påverkar var insekterna finns. De insektssamhällen jag hittade var inte identiska mellan nord- och sydstränder, men variabeln visade sig ha effekt bara på fyra av de studerade insektstaxa. Variabler som hade stor effekt var vilken sjö proverna kom från, vikten på provet och solexponering på liten skala, dvs för det enskilda provet. Det fanns också effekter av vilket successionsstadium svampen var i. De flesta arter tycks finnas i äldre, döda fruktkroppar och saknas i de levande färska. En rödlistad skalbaggsart hittades, liksom tre arter som tidigare varit rödlistade. Alla dessa arter är utbredda vid alla de fem sjöar som undersöktes.
2
Table of Contents
Abstract…………………………………………………………………………………3
Key words……………………………………………………………………………….3
Introduction and aim of the study …………………………………………………….4
Brief description of the study........................................................................................4 The study system...........................................................................................................4 Motivations of the study................................................................................................5 Aim of the project..........................................................................................................6
Materials and methods…………………………………………………………………8
Sampling sites...............................................................................................................8 Sampling.......................................................................................................................8 Measured variables.......................................................................................................9 Rearing........................................................................................................................10 Species determination and classifications..................................................................11 Statistical analyses......................................................................................................12
Results…………………………………………………………………………….……14
General data for the whole community.......................................................................14 General data for northern and southern communities...............................................18 Variable associations of individual taxa.....................................................................21 A closer look to the variable `Successional stage´.....................................................23 Red-listed species and their distributions...................................................................26
Discussion……………………………………………………………………….......…27
General remarks about the collected data..................................................................27 Variable associations of individual taxa.....................................................................28 The variable `successional stage´...............................................................................30 Red-listed species........................................................................................................31 Methodological Remarks............................................................................................32
Acknowledgments…………………………………………………………………..…34
Appendix 1…………………………………………………………………………..…35
Appendix 2………………………………………………………………………..……39
Bibliography and references………………………………………………….………41
3
Abstract This is a study of the insect community associated to the wood-decaying fungus Inonotus radiatus found on Alnus glutinosa trees growing in riparian forests at the northern and southern shores of boreal lakes in the province Uppland. Little is known about this particular bracket fungus and its inhabitants. Insects were reared out at the laboratory from samples of fruiting bodies of the fungus taken at five lakes. During the fieldwork in 2009, data about several environmental variables was also taken. After the rearing period, these variables and their effects over the insects were analyzed. Special attention is paid to the comparison between the insect communities living at northern and southern shores of the lakes. We consider the microclimates at the northern and southern shores are different due to the dissimilar sun exposure they receive. The collected insect communities associated to opposite shores are not identical, but the variable shore exposition turned out to be influencing just four of the studied taxa. The variables which turned out to have a greater impact over the insect communities were lake, weight of the fungus and sun exposure. The preferences regarding successional stage of the fruiting bodies by some of the collected taxa are also presented. Most of them seem to be more attracted by older fruiting bodies than by the new and fresher ones. One red-listed beetle species has been recorded during the project, as well as three other species which were included in previous Red Lists although they are no longer on the Swedish Red List. Distributions of insect species are also revised to analyze the accuracy of the Red List. Key words: fungivorous insects, wood-decaying fungi, substrate associations, sun exposure, successional stage, red-listed species, riparian forests, Tineidae, Dorcatoma, Abdera

4
Introduction and aim of the study Brief description of the study
This project is a study of the insect community associated to the fungus Inonotus radiatus growing in decaying wood from alder trees (Alnus glutinosa) located at riparian forests on the northern and southern shores of lakes in the hemiboreal vegetation zone. The research work is based on the insects reared out at the laboratory from fruiting bodies collected in the field. The influence of several environmental variables over species richness and distribution of the reared insects is analysed.
Thus, data about occurrence and distribution patterns of the collected insects is
presented. We also point out at the reared species currently included in the Swedish Red List, presenting one red-listed species and two more species which were red-listed in the Red List of previous years.
We analyse how sun exposure levels affect the insect community, as well as
other variables regarding characteristics of the host tree and of the studied fungi. Concerning the host tree, we consider variables such as distance from the shore, stem diameter, stem type and sun exposure. Concerning the fungus, successional stage, orientation of the fruiting bodies on the trunk, height above the ground and surface on the trunk occupied by the fruiting bodies are the observed variables (Table 1).
The study system
Black alder, Alnus glutinosa (L.) Gaertn is a deciduous tree species, belonging to
the Betulaceae family. The species is distributed all over Europe and introduced into the Azores and the USA. To date, this fast-growing species has not been very much used in managed forest, although during the last decades there has been an increasing interest concerning its possible use, especially for being a nitrogen-fixing species together with the actinomycete Frankia. Regarding its role as possible host tree for insects, it is considered an alternative host for many saproxylic beetle species that predominantly utilize e.g. Quercus and Populus (Jonsell, 1991).
Inonotus Karst. is a large genus within the Hymenochaetales exhibiting a
worldwide distribution (Wagner & Fischer, 2002) whose systematics face many taxonomical problems (Gottlieb et al., 2002). All species live as parasites or saprophytes on a broad variety of angiosperms and gymnosperms and cause white rot decay (Germain et al., 2002; Wagner & Fischer, 2002). This genus is also considered economically important, affecting negatively several productive species as well as ornamental trees (Intini & Tello, 2003).
Inonotus radiatus is a truly saprophytic fungus of deciduous trees, attacking
them only when the tissue is dead and often colonizing wood when degradation is already well underway (Gilbertson and Ryvarden, 1986). The fruiting bodies used for this project come exclusively from black alder trees, the main host for this fungus although it has also been reported growing in other deciduous species (Germain et al., 2002; Buczacki & Harris, 1998; Neuman, 1914; Legon & Henrici, 2005; Grand & Vernia, 2005).
5
Its associated insect community covers different levels inside a complex and species-rich food web, including fungi and wood-boring insects, fungivorous species as well as their predators (parasitoids and hyperparasitoids) and it contributes to maintain the biodiversity of the forest ecosystem.
The study system as a whole is focus on the natural ecotones represented by the
riparian forests developed along the lakes shores. Thus, the compared sites differ from each other only in that their edges face either North or South.
Motivations of the study
It is globally accepted that a sustainable management of our forests must be
carried out around the world, and the maintenance of biodiversity has been generally considered as a good criterion of sustainability. At the same time, dead wood and its associated saproxylic insect fauna have been recognised as key factors for maintaining biodiversity in forest ecosystems (Bütler Sauvain, Ehnström, 2003; Komonen, 2003; Larsson, 2001; Harmon et al., 1986; Jonsell et al., 2001; Grove, 2002; WWF report, Oct 2004). Human activities threat fungi that depend on dead wood (Bader et al., 1995; Kouki et al., 2001; Olsson, 2008; Stenbacka, 2009; Berg et al., 1995). Thus, a study of a particular system based on decaying wood of black alder trees may help foresters and managers to select the best practices to be applied in forests where this species is present and, at the same time, it increases the general knowledge about the insect fauna related to the microhabitat provided by the snags, logs and standing alder trees colonized by the bracket fungus Inonotus radiatus.
Forest edges, and particularly riparian ecotones, gather some specific
characteristics which make them very interesting for performing ecological studies. (Naiman & Décamps,1990; Schiemer & Zalewski, 1992; Risser, 1995). According to Komonen (2009), particularly in the Uppland region, these riparian forests represent ecosystems which notably differ from most interior conifer-dominated forests, offering high habitat heterogeneity to the region. Besides, unmanaged riparian zones can represent important habitats for many species, and what is more, to many rare and red-listed species depending on woody debris (Komonen et al., 2008).
In Sweden, buffer zones in riparian forests have been defined and protected
appealing the risk of negatively affect water quality of lakes and rivers if these forests were removed. The present study might be useful for future buffer zone design and management of riparian forests having in mind not only the maintenance of water quality, but also protection of biodiversity.
Specifically, fruiting bodies of wood-decaying fungi represent a species-rich and
well defined type of substrate that can be manipulated easily (Jonsell et al., 2001; Komonen, 2003; Jonsson & Nordlander, 2006) and particularly, polypores in general are known to offer a great variety of niches which may contain a highly mixed arthropod fauna (Thunes, 1994). To date, most studies on insects in bracket fungi have focused on only a few fungal species. Poorly-known insects and fungi species may vanish from their habitats due to the lack of species-specific information even if advanced nature conservation practices are applied (Schigel, 2009). As many insect species are dependent on various fungi associated with dead wood, it would be desirable to study insect communities associated with species of fungi not yet investigated
6
(Ehnström, 2003). Thus, material collected from I. radiatus will be especially interesting and will contribute in first place, to enlarge the ecological knowledge of fungivorous insects in general.
Furthermore, if the use of Alnus glutinosa in forestry systems will increase, the
information provided in this project may be very useful for its future management, especially when considering the management of dead wood. Knowledge about its associated insect community is fundamental for the planning of a sustainable management of the black alder forests in Sweden.
Another important motivation was the search for red-listed species. In
intensively managed forests in Sweden, over 900 species that depend on dead and decaying wood are red-listed (Berg et al., 1994). When red-listed species are recorded during a project, all information regarding their distribution patterns, occurrences and requirements, makes the research particularly interesting for its use in nature conservation studies or practices.
The decision of collecting samples from the northern and southern shores of the
lakes was taken attending to a particular question we wanted to investigate. We suggest that the microclimates created in the decaying wood located at opposite shores differ from each other due to their different orientation with regard to the sun. We consider that consequently, the sun exposures at each of the shores are significantly different. Little is known about the differences between sun exposures levels according to orientation of the edge of a non-managed forest, but assuming they are actually different, it is interesting to test if these differences have a real impact over the insect community or not. The importance of sun exposure as a factor shaping a certain insect community has been demonstrated in several studies focused on insect requirements regarding light exposure levels (Komonen & Kouki, 2005; Lindhe et al., 2005).
Even taking into consideration the characteristics of this study, if important
responses by the insect community against any of the considered environmental variables are found, the results might be useful for a better understanding of similar systems, although the considered species taking a part of the system could be different. For instance, this is the case for the variable successional stage of the fungi, since many studies have already demonstrated that this is a quite important factor affecting fungivorous insect communities (Thunes, 1994; Jonsell & Nordlander, 2004; Jonsell et al, 1998; Jonsell et al., 2001; Graves, 1960).
Aim of the project
The presented motivations led me to define the following objectives for the present project:
1) Present original data of the insect community associated to Inonotus radiatus in riparian Alnus glutinosa stands in Uppland, obtained by rearing out the insects at the laboratory from fruiting bodies collected in the field.
2) Compare the communities living at the northern and southern shores of the selected lakes, to analyze if the different sun exposure levels characterizing the shores significantly affect these communities.
7
3) Analyze the influences over the distribution and frequency of the collected
insects of other environmental variables, such as sun exposure, lake, weight of the fruit body samples and successional stage of the fruiting bodies.
4) Take a closer look to the distribution patterns and responses by the reared
species taking into account the accuracy of the red-listing criteria.
8
Materials and methods Sampling sites
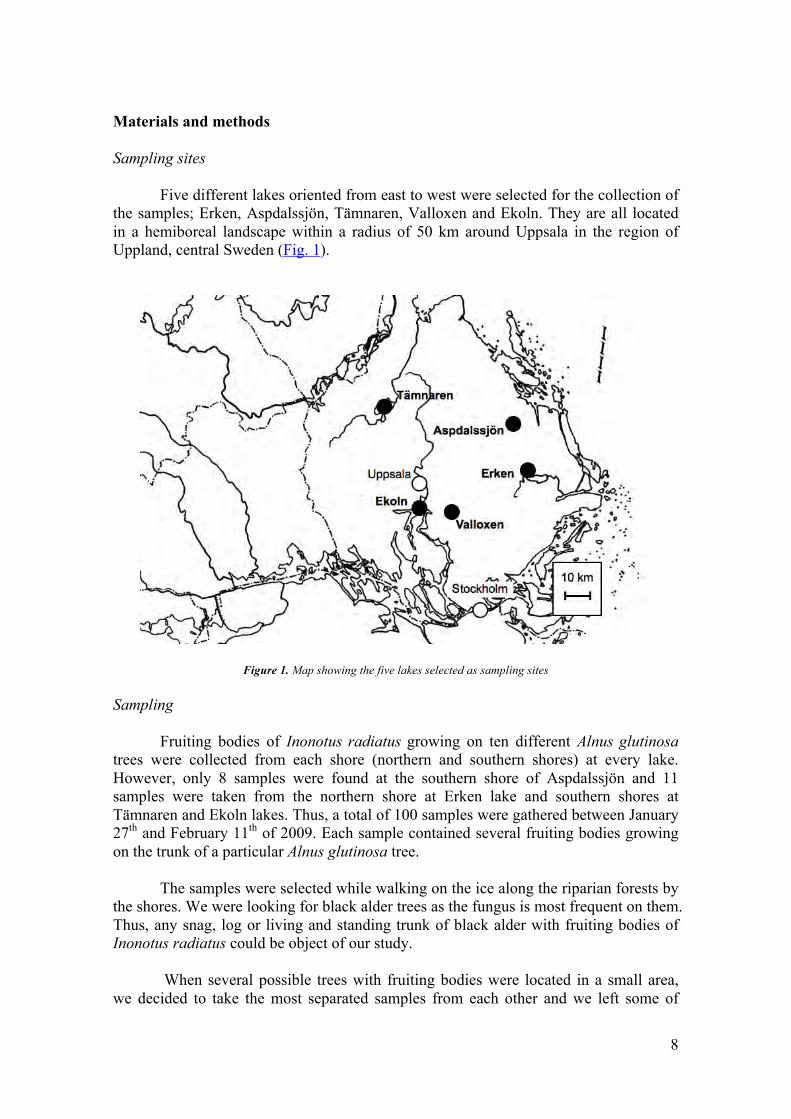
Five different lakes oriented from east to west were selected for the collection of the samples; Erken, Aspdalssjön, Tämnaren, Valloxen and Ekoln. They are all located in a hemiboreal landscape within a radius of 50 km around Uppsala in the region of Uppland, central Sweden (Fig. 1).
Figure 1. Map showing the five lakes selected as sampling sites Sampling
Fruiting bodies of Inonotus radiatus growing on ten different Alnus glutinosa trees were collected from each shore (northern and southern shores) at every lake. However, only 8 samples were found at the southern shore of Aspdalssjön and 11 samples were taken from the northern shore at Erken lake and southern shores at Tämnaren and Ekoln lakes. Thus, a total of 100 samples were gathered between January 27th and February 11th of 2009. Each sample contained several fruiting bodies growing on the trunk of a particular Alnus glutinosa tree.
The samples were selected while walking on the ice along the riparian forests by
the shores. We were looking for black alder trees as the fungus is most frequent on them. Thus, any snag, log or living and standing trunk of black alder with fruiting bodies of Inonotus radiatus could be object of our study.
When several possible trees with fruiting bodies were located in a small area,
we decided to take the most separated samples from each other and we left some of
9
them untouched, looking for new samples a bit farther along the shore. We collected the fruit bodies in 5 litres plastic bags. In this way, when the sample was that small that the bag could not be completely full after taking it, we took most of the fruiting bodies growing on that tree, but always at least three of them remained untouched for protection of the fungi and the related fauna. If the collection of the fruit bodies coming from one tree required more than one 5 litres bag, only one bag with fruit bodies was collected for that particular tree, trying to get fruit bodies of all present sizes and decaying stages.
Measured variables
For each sample we collected the following data: RT90 coordinates from a GPS of the location of each sample were recorded, as
well as the following environmental variables: `distance from the shore´, `stem type´, `stem diameter´, `size of the fungi´, `height above the ground´, `successional stage´, `exposition side´ and `sun exposure´ (Table 1). A summary table with all the environmental data collected for each sample is presented in Appendix 1.
A tree caliper was used to measure the stem diameter at breast height (150 cm)
for every sample. A metric tape was used to measure the height above the ground of the first and the last fruiting body growing on the trunk and the distance from the shore. Stem type, successional stage, orientation of the fruiting bodies on the trunk and sun exposure level were defined by the field team in situ. An axe or knife was used to detach the samples from the host tree, trying to get as little woody material and bark as possible. Ice-probing sticks and ice-prods (ispik and isdubbar in Swedish) complete our field equipment as safety tools. Table 1. Environmental variables measured Variable Categories Comments Distance from the shore Numeric Stem type Laying Erect Stem diameter Numeric Breast height Size of the fungi Numeric Surface over the trunk
occupied by the fruiting bodies
Height of the first fruiting body
Numeric Height above the ground where the first fruiting body grows on the trunk
Height of the last fruiting body
Numeric Height above the ground where the last fruiting body grows on the trunk
Successional stage A = living B = newly dead, some holes C = dead with many holes or cracks D = dead and falling apart M = more than one stage Orientation N, S, E, W, SE, SW, NE, NW Orientation of the fruiting
bodies on the trunk Sun exposure 1 = total exposition 2 = intermediate 3 = shaded

10
Rearing The samples were taken to the laboratory where they were placed in separate
rearing boxes (Fig. 2). Samples that were wet or still frozen were dried for a few days before they were enclosed in the boxes. The lids of the boxes were taped for preventing the escape of insects. Two glass vials were inserted in every box where insects attracted to the light were collected. The emerging insects were preserved in jars with 70% ethanol, except for the moths, which were kept dry in a refrigerator to facilitate their conservation and further determination.
Figure 2.- Samples at the laboratory in rearing boxes with glass vials
The first insects were collected on the 20th of February and since that date the
collecting period lasted for about 8 weeks. During the first week of this period, the vials were examined daily. In the next three weeks, insects were collected three times a week while during the fifth and sixth week, the vials were emptied twice a week. Finally, a last collection was made on the 16th of April, after one and a half weeks with only a few new individuals coming out each day.
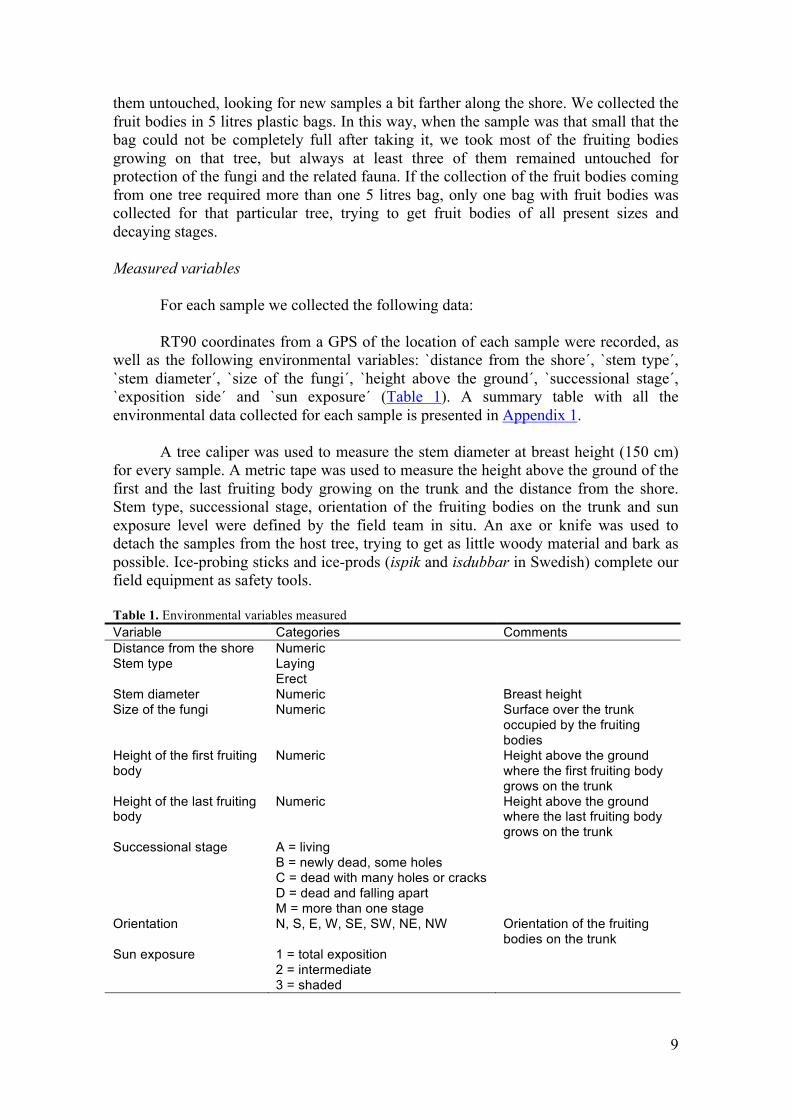
After the rearing period every box was opened and examined to collect insects
remaining inside the boxes. Not all the insects from the samples are attracted to light and some others simply could not reach the vials during the rearing period. The samples were sieved using five grids of different sizes to find and collect those remaining individuals (Fig. 3). At the same time, since the samples were not homogeneous regarding size, the dry weight of each sample was measured with one gram precision. The opening period lasted from April 16th to May 8th.
11
Figure 3.- Opening period: sieving and weighing fungi and collecting the last insects
Species determination and classifications
Identification of the reared insects was carried out by Clara González Alonso supported by Mats Jonsell, except for three of the collected moths which were identified by Bengt Å. Bengtsson (Eupithecia icterata, Ectoedemia (probably subbimaculella, otherwise E. albifasciella) and almost certainly Scoparia ambigualis).
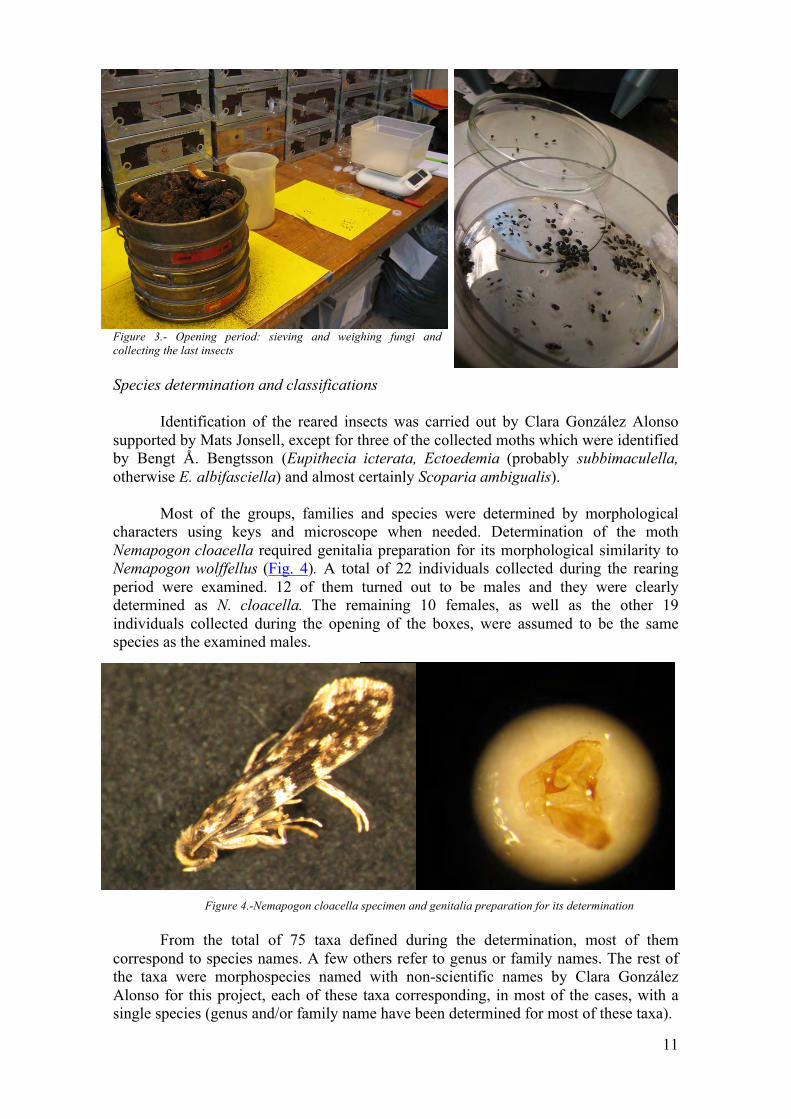
Most of the groups, families and species were determined by morphological
characters using keys and microscope when needed. Determination of the moth Nemapogon cloacella required genitalia preparation for its morphological similarity to Nemapogon wolffellus (Fig. 4). A total of 22 individuals collected during the rearing period were examined. 12 of them turned out to be males and they were clearly determined as N. cloacella. The remaining 10 females, as well as the other 19 individuals collected during the opening of the boxes, were assumed to be the same species as the examined males.
Figure 4.-Nemapogon cloacella specimen and genitalia preparation for its determination From the total of 75 taxa defined during the determination, most of them
correspond to species names. A few others refer to genus or family names. The rest of the taxa were morphospecies named with non-scientific names by Clara González Alonso for this project, each of these taxa corresponding, in most of the cases, with a single species (genus and/or family name have been determined for most of these taxa).
12
Red List categories follow three different versions of the Swedish Red List. The present list was published in 2005 (Gärdenfors 2005). However, also species red-listed in earlier versions (Ehnströmm et al., 1993 & Gärdenfors 2000) were considered as the former red-listing suggest that they have a higher interest in nature conservation than never red-listed species, although they do not reach the present limit for being red-listed.
The taxa were also classified in different groups regarding their relation to the
fungi. The defined categories were: fungivorous, saproxylic, parasitoids, hyperparasitoids, others and unknown. The insects feeding directly on the fungi material belong to the fungivorous category. The ones feeding strictly on the woody material of our system are here named saproxylic. Parasitoids are the insects parasiting any of the fungivorous or saproxylic species. Consequently, hyperparasitoids are the ones being parasitoids of the parasitoids of saproxylic or fungivorous species. The insects classified as others are the ones which do not depend on our fungi/wood or on the directly related insects for feeding, so we considered we found them on the samples because either they found a nice place for hibernating on the fruiting bodies or they were there just by chance. The classification was based on literature (Nationalnyckeln, 2005; Baranowski, 1985; Palm, 1959, Koch, 1989-1992 and Hansen, 1964) and supervisor’s opinion.
Statistical analyses
- Insect communities overview:
Rank-abundance curves were elaborated by ranking the species in sequence from most to least abundant (and from the species with the highest number of occurrences to the one with the lowest) along the horizontal axis. Their abundances and occurrences are displayed in log10 format on the vertical axis, so that species whose abundances/occurrences span several orders of magnitude can be easily accommodated on the same graph. Rank-abundance curves were also plotted separately for comparing the communities related to northern and southern shores. Interpretation of these curves was based on theoretical literature and applied studies (Feinsinger, 1948; Magurran, 2004; Encora, 2009; Ecoplexity, 2009)
- Variable associations:
A model was run using SAS 6.12 for Macintosh (SAS, 1989-96) to conduct multivariate Poisson regressions for some particular taxa. Poisson distributions were assumed because this distribution usually fits count data when many counts are zero (Quinn & Keough, 2002).
A total of 18 taxa, corresponding to the taxa with more than 10 occurrences and being either fungivorous and saproxylic species or parasites and predators of the previous ones, were included (Table 10).
Not all the environmental variables were included in the model. It was run for each taxa including the variables `weight´, `lake´, `shore´ and `sun exposure´ in that order. The variable `stem type´ was excluded for the analyses because only one sample corresponded to a laying tree, being the rest from erected stems. `Distance from the shore´ had also too little variation for being included in the model and `exposition side´ had too many categories for this type of analysis. `Stem diameter´ was excluded
13
because it was positively correlated to the variable `weight´, so it would probably explain almost the same part of the variation as the weight does. The same applies to the variable `size of the fungi´, also positively correlated to `weight´. These correlations were analyzed with STATGRAPHICS, using 2-tailed Pearson correlations and transforming the variables by the logarithmic function. For most of the studied groups, there was not enough data for the first category of `successional stage´ and that is the reason why this variable was also excluded from these regressions.
- A closer look to the variable `Successional stage´: To provide a wide view of the effect of the successional stage of the fruiting
bodies over the insect community, the number of species in different successional stages was plotted in sample-based rarefaction curves. Again, only the insects directly related to the fungi were considered. The software Estimate S was used for computing the expected species accumulation curves with 95% confidence intervals (sample-based rarefaction curves in the terminology of Gotelli & Colwell 2001).
In addition, a model including `successional stage´ was run for the only 6 taxa
which had enough data for this purpose. The multivariate regressions only include now the variables `weight´ due to the need of taking into account the heterogeneity regarding size of the samples, and `successional stage´.
14
Results General data for the whole community
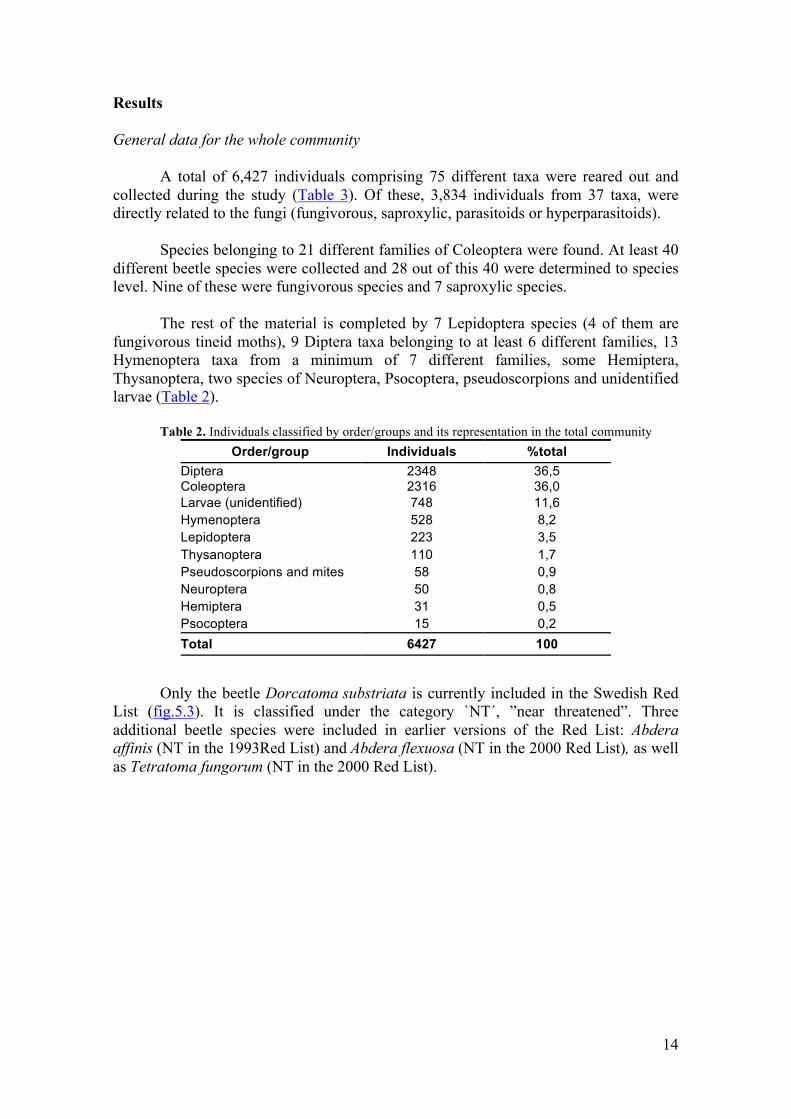
A total of 6,427 individuals comprising 75 different taxa were reared out and collected during the study (Table 3). Of these, 3,834 individuals from 37 taxa, were directly related to the fungi (fungivorous, saproxylic, parasitoids or hyperparasitoids).
Species belonging to 21 different families of Coleoptera were found. At least 40
different beetle species were collected and 28 out of this 40 were determined to species level. Nine of these were fungivorous species and 7 saproxylic species.
The rest of the material is completed by 7 Lepidoptera species (4 of them are
fungivorous tineid moths), 9 Diptera taxa belonging to at least 6 different families, 13 Hymenoptera taxa from a minimum of 7 different families, some Hemiptera, Thysanoptera, two species of Neuroptera, Psocoptera, pseudoscorpions and unidentified larvae (Table 2).
Table 2. Individuals classified by order/groups and its representation in the total community
Order/group Individuals %total Diptera Coleoptera
2348 2316
36,5 36,0
Larvae (unidentified) 748 11,6 Hymenoptera 528 8,2 Lepidoptera 223 3,5 Thysanoptera 110 1,7 Pseudoscorpions and mites 58 0,9 Neuroptera 50 0,8 Hemiptera 31 0,5 Psocoptera 15 0,2 Total 6427 100
Only the beetle Dorcatoma substriata is currently included in the Swedish Red
List (fig.5.3). It is classified under the category `NT´, ”near threatened”. Three additional beetle species were included in earlier versions of the Red List: Abdera affinis (NT in the 1993Red List) and Abdera flexuosa (NT in the 2000 Red List), as well as Tetratoma fungorum (NT in the 2000 Red List).

15
Table 3. Number of individuals of the collected taxa (in brackets occurrence, i.e number of samples on which a taxa was found). Most of the presented taxa correspond to scientific species names. Some of them are morphospecies names given by the author for this project. NT = species classified as “near threatened” in the last Swedish Red List (NT) = species classified as “near threatened” in earlier versions of the Swedish Red List
Taxa Order Family Group Red list category
Individuals (Occurrence)
Abdera affinis Coleoptera Melandryidae Fungivorous (NT) 573(29) Abdera flexuosa Coleoptera Melandryidae Fungivorous (NT) 407(37) Cis bidentatus Coleoptera Ciidae Fungivorous 26(8) Dorcatoma dresdensis Coleoptera Anobiidae Fungivorous 267(26) Dorcatoma substriata Coleoptera Anobiidae Fungivorous NT 64(17) Enicmus fungicola Coleoptera Latridiidae Fungivorous 1(1) Ennearthron cornutum Coleoptera Ciidae Fungivorous 631(54) Orthocis alni Coleoptera Ciidae Fungivorous 1(1) Tetratoma fungorum Coleoptera Tetratomidae Fungivorous (NT) 2(2) Anaspis thoracica Coleoptera Scraptiidae Saproxylic 22(17) Cerylon histeroides Coleoptera Cerylonidae Saproxylic 4(3) Dasytes caeruleaus Coleoptera Melyridae Saproxylic 7(6) Dasytes plumbeus Coleoptera Melyridae Saproxylic 1(1) Denticolis linearis Coleoptera Elitaridae Saproxylic 1(1) Trichaceble floralis Coleoptera Melyridae Saproxylic 1(1) Triplax Coleoptera Erotylidae Saproxylic 1(1) Agonum thoreyi Coleoptera Carabidae Others 3(1) Anthicus antherinus Coleoptera Anthicidae Others 1(1) Badister Coleoptera Carabidae Others 5(1) Brachytarsus nebulosus Coleoptera Anthribidae Others 1(1) Carabidae Coleoptera Carabidae Others 19(5) Cercyon Coleoptera Hydrophilidae Others 1(2) Chrysomelidae Coleoptera Chrysomelidae Others 10(10) Coccidula scutellata Coleoptera Coccinellidae Others 21(16) Coccinellidae Coleoptera Coccinellidae Others 3(3) Corticaria impressa Coleoptera Latridiidae Others 1(1) Curculionidae Coleoptera Curculionidae Others 2(2) Cyphon padi Coleoptera Scirtidae Others 1(1) Dromius queadrimaculatus Coleoptera Carabidae Others 3(3) Dyschirius globosus Coleoptera Carabidae Others 3(3) Galerucella nymphaeae Coleoptera Chrysomelidae Others 101(15) Hidraena Coleoptera Hydrophilidae Others 5(3) Hydrophilidae Coleoptera Hydrophilidae Others 47(11) Limnebius Coleoptera Hydraenidae Others 1(1) Phyllotreta undulata Coleoptera Chrysomelidae Others 4(4) Pterustichus minor Coleoptera Carabidae Others 1(1) Silis nitidula Coleoptera Cantharidae Others 1(1) Staphylinidae Coleoptera Staphylinidae Others 73(18) Archinemapogon yildizae Lepidoptera Tineidae Fungivorous 109(21) Nemapogon cloacella Lepidoptera Tineidae Fungivorous 41(15) Nemapogon nigralbellus Lepidoptera Tineidae Fungivorous 3(3) Nemapogon picarellus Lepidoptera Tineidae Fungivorous 66(15) Eupithecia icterata Lepidoptera Geometridae Others 1(1) Ectoedemia Lepidoptera Nepticulidae Others 1(1) Scoparia ambigualis Lepidoptera Crambidae Others 2(2) Cecidiomyidae2 Diptera Cecidiomyidae Fungivorous 64(9) Chloropidae1 Diptera Chloropidae Unknown 15(3)
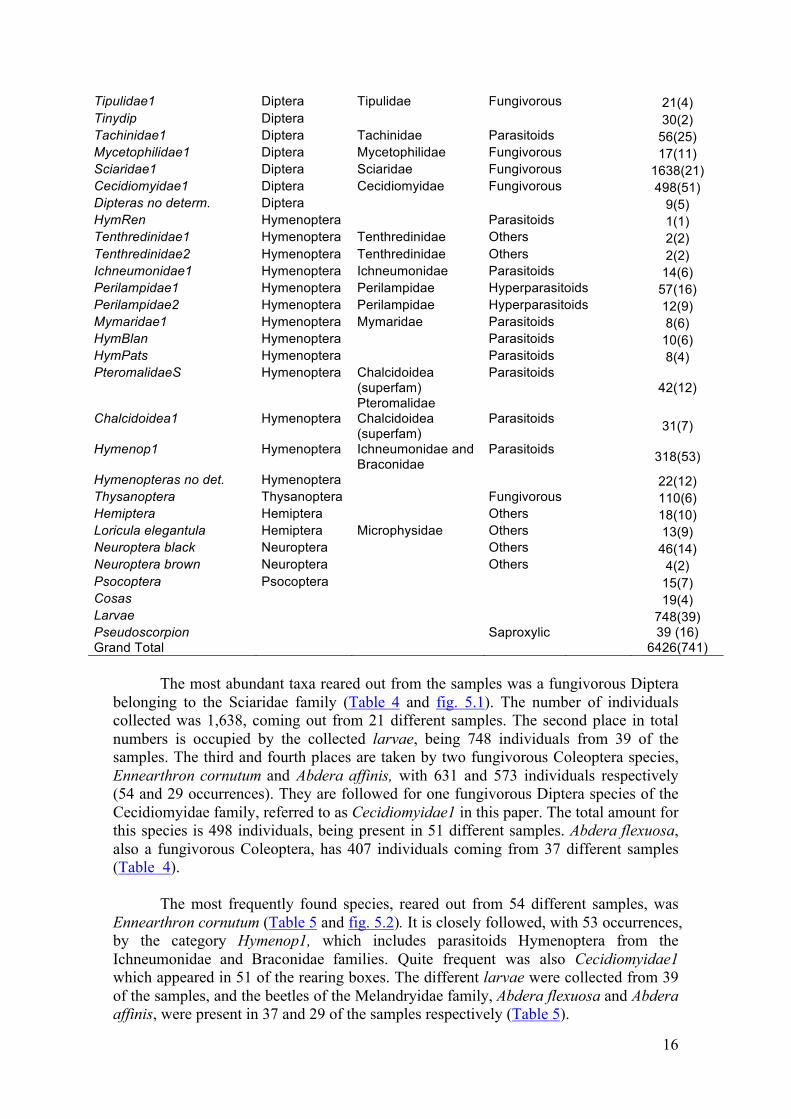
16
Tipulidae1 Diptera Tipulidae Fungivorous 21(4) Tinydip Diptera 30(2) Tachinidae1 Diptera Tachinidae Parasitoids 56(25) Mycetophilidae1 Diptera Mycetophilidae Fungivorous 17(11) Sciaridae1 Diptera Sciaridae Fungivorous 1638(21) Cecidiomyidae1 Diptera Cecidiomyidae Fungivorous 498(51) Dipteras no determ. Diptera 9(5) HymRen Hymenoptera Parasitoids 1(1) Tenthredinidae1 Hymenoptera Tenthredinidae Others 2(2) Tenthredinidae2 Hymenoptera Tenthredinidae Others 2(2) Ichneumonidae1 Hymenoptera Ichneumonidae Parasitoids 14(6) Perilampidae1 Hymenoptera Perilampidae Hyperparasitoids 57(16) Perilampidae2 Hymenoptera Perilampidae Hyperparasitoids 12(9) Mymaridae1 Hymenoptera Mymaridae Parasitoids 8(6) HymBlan Hymenoptera Parasitoids 10(6) HymPats Hymenoptera Parasitoids 8(4) PteromalidaeS Hymenoptera Chalcidoidea
(superfam) Pteromalidae
Parasitoids 42(12)
Chalcidoidea1 Hymenoptera Chalcidoidea (superfam)
Parasitoids 31(7)
Hymenop1 Hymenoptera Ichneumonidae and Braconidae
Parasitoids 318(53)
Hymenopteras no det. Hymenoptera 22(12) Thysanoptera Thysanoptera Fungivorous 110(6) Hemiptera Hemiptera Others 18(10) Loricula elegantula Hemiptera Microphysidae Others 13(9) Neuroptera black Neuroptera Others 46(14) Neuroptera brown Neuroptera Others 4(2) Psocoptera Psocoptera 15(7) Cosas 19(4) Larvae 748(39) Pseudoscorpion Saproxylic 39 (16) Grand Total 6426(741)
The most abundant taxa reared out from the samples was a fungivorous Diptera
belonging to the Sciaridae family (Table 4 and fig. 5.1). The number of individuals collected was 1,638, coming out from 21 different samples. The second place in total numbers is occupied by the collected larvae, being 748 individuals from 39 of the samples. The third and fourth places are taken by two fungivorous Coleoptera species, Ennearthron cornutum and Abdera affinis, with 631 and 573 individuals respectively (54 and 29 occurrences). They are followed for one fungivorous Diptera species of the Cecidiomyidae family, referred to as Cecidiomyidae1 in this paper. The total amount for this species is 498 individuals, being present in 51 different samples. Abdera flexuosa, also a fungivorous Coleoptera, has 407 individuals coming from 37 different samples (Table 4).
The most frequently found species, reared out from 54 different samples, was
Ennearthron cornutum (Table 5 and fig. 5.2). It is closely followed, with 53 occurrences, by the category Hymenop1, which includes parasitoids Hymenoptera from the Ichneumonidae and Braconidae families. Quite frequent was also Cecidiomyidae1 which appeared in 51 of the rearing boxes. The different larvae were collected from 39 of the samples, and the beetles of the Melandryidae family, Abdera flexuosa and Abdera affinis, were present in 37 and 29 of the samples respectively (Table 5).
17
Table 4. Most abundant taxa: Table 5. Most frequent taxa per sample:
Most abundant taxa Number of individuals
Sciaridae1 1638 Larvae 748 Ennearthron cornutum 631 Abdera affinis 573 Cecidiomyidae1 498 Abdera flexuosa 407 Hymenop1 318 Dorcatoma dresdensis 267 Thysanoptera 110 Archinemapogon yildizae 109 Galerucella nymphaeae 101 Staphylinidae 73 Nemapogon picarellus 66 Dorcatoma substriata 64
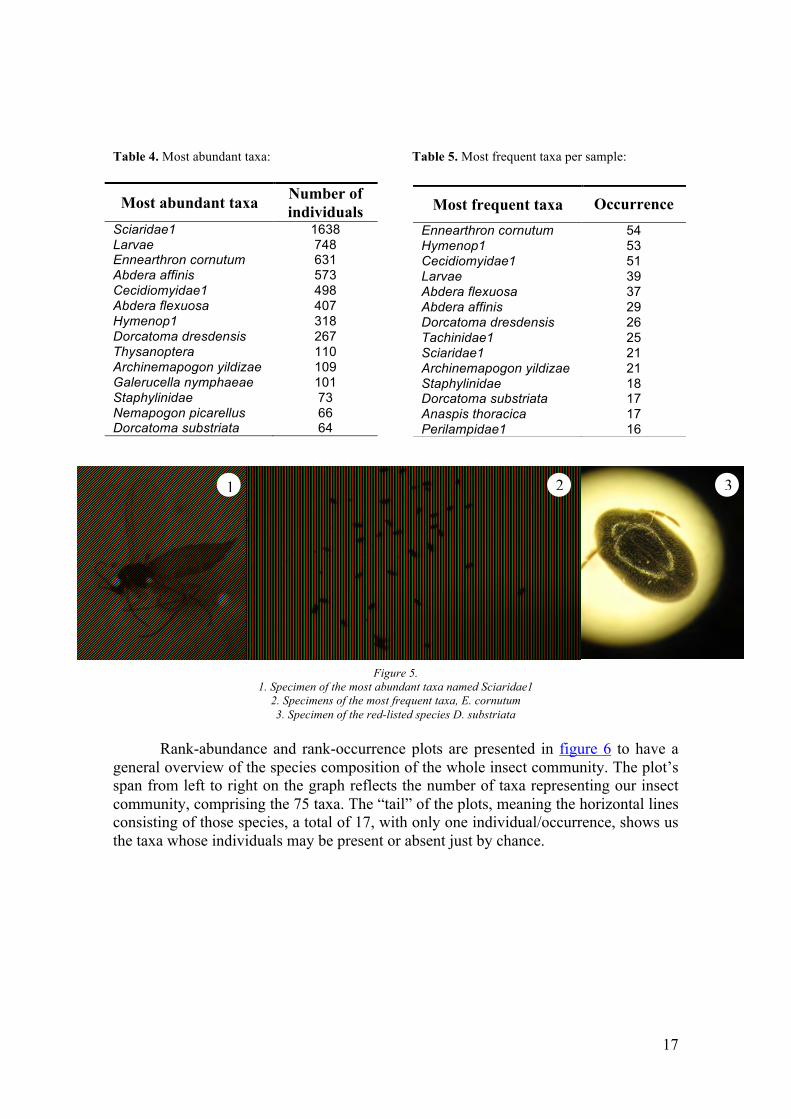
Figure 5. 1. Specimen of the most abundant taxa named Sciaridae1
2. Specimens of the most frequent taxa, E. cornutum 3. Specimen of the red-listed species D. substriata
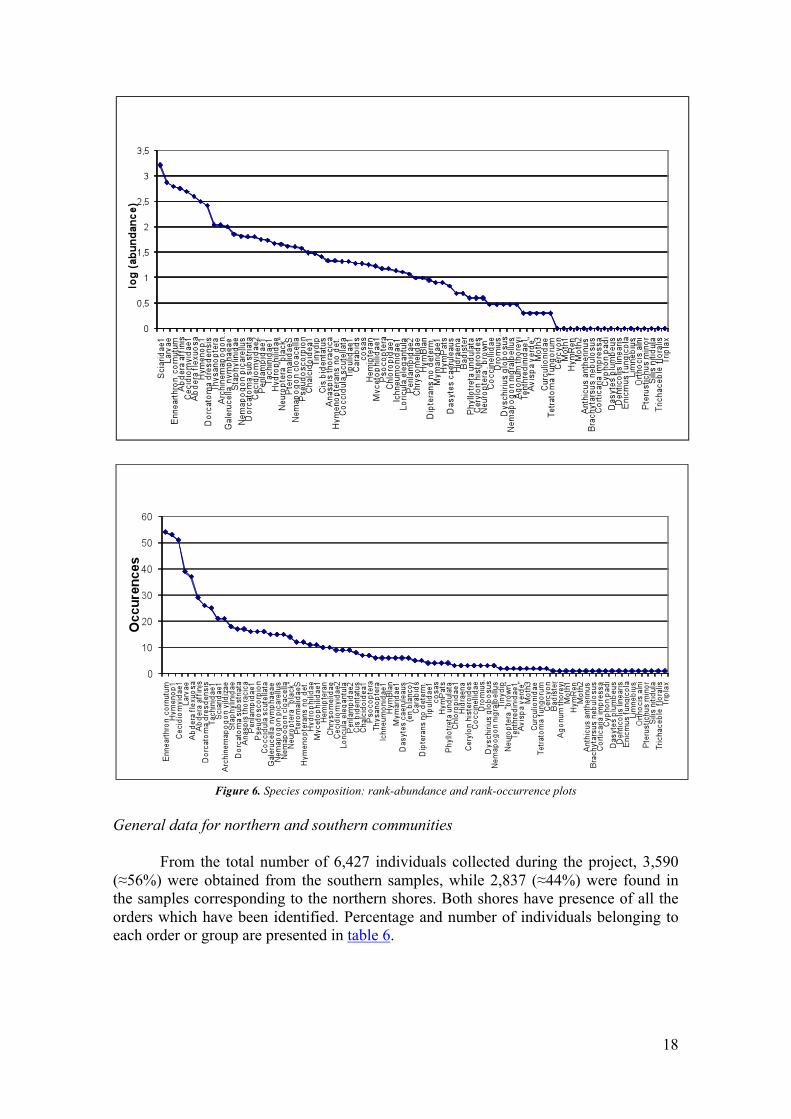
Rank-abundance and rank-occurrence plots are presented in figure 6 to have a
general overview of the species composition of the whole insect community. The plot’s span from left to right on the graph reflects the number of taxa representing our insect community, comprising the 75 taxa. The “tail” of the plots, meaning the horizontal lines consisting of those species, a total of 17, with only one individual/occurrence, shows us the taxa whose individuals may be present or absent just by chance.
Most frequent taxa
Occurrence
Ennearthron cornutum 54 Hymenop1 53 Cecidiomyidae1 51 Larvae 39 Abdera flexuosa 37 Abdera affinis 29 Dorcatoma dresdensis 26 Tachinidae1 25 Sciaridae1 21 Archinemapogon yildizae 21 Staphylinidae 18 Dorcatoma substriata 17 Anaspis thoracica 17 Perilampidae1 16
1 2 3
18
Figure 6. Species composition: rank-abundance and rank-occurrence plots General data for northern and southern communities
From the total number of 6,427 individuals collected during the project, 3,590 (≈56%) were obtained from the southern samples, while 2,837 (≈44%) were found in the samples corresponding to the northern shores. Both shores have presence of all the orders which have been identified. Percentage and number of individuals belonging to each order or group are presented in table 6.
19
Table 6. Individuals and percentages classified by order/group for northern and southern shores Order/group North
(individuals) South
(individuals) %total North
%total South
Coleoptera 981 1335 34,6 37,2 Diptera 736 1612 25,9 44,9 Larvae (unidentified) 575 173 20,3 4,8 Hymenoptera 263 265 9,3 7,4 Thysanoptera 104 6 3,7 0,2 Lepidoptera 91 132 3,2 3,7 Neuroptera 35 15 1,2 0,4 Pseudoscorpions and mites 32 26 1,1 0,7 Hemiptera 10 21 0,4 0,6 Psocoptera 10 5 0,4 0,1 Total 2837 3590 100 100
The red-listed species Dorcatoma substriata is present in both shore expositions, gathering a total of 64 individuals; 34 from 8 of the northern samples and 30 more from 9 of the southern samples. Abdera affinis, Abdera flexuosa and Tetratoma fungorum, the three species included in earlier versions of the Swedish Red List, are also present at both of the shore expositions.
The most abundant taxa in the northern samples were: larvae, Sciaridae1,
Abdera affinis, Cecidyiomidae1 and Ennearthron cornutum. At the southern samples were: Sciaridae1, Ennearthron cornutum, Abdera flexuosa, Abdera affinis and Cecidyiomidae1 (Table 7).
Regarding species richness, from the 75 defined taxa, 51 out of them turned out
to be present in both northern and southern shores. 62 taxa were identified in the northern samples and 63 in the southern samples. Thus, a total of 11 taxa appeared only in the South, while the same number of taxa appears only in the North. Most frequent taxa at northern and southern shores are presented in table 8.
Table 7. Most abundant taxa sorted in decreasing order in northern and southern samples
Most abundant taxa
North Number of individuals South
Number of individuals
Larvae 575 Sciaridae1 1290 Sciaridae1 348 Ennearthron cornutum 379 Abdera affinis 298 Abdera flexuosa 307 Cecidiomyidae1 269 Abdera affinis 275 Ennearthron cornutum 252 Cecidiomyidae1 229 Hymenop1 166 Larvae 173 Thysanoptera 104 Dorcatoma dresdensis 164 Dorcatoma dresdensis 103 Hymenop1 152 Abdera flexuosa 100 Galerucella nymphaeae 89 Cecidiomyidae2 53 Archinemapogon yildizae 67 Staphylinidae 51 Nemapogon picarellus 40 Archinemapogon yildizae 42 Dorcatoma substriata 30 Perilampidae1 36 Chalcidoidea1 30 Dorcatoma substriata 34 Tachinidae1 27
20
Table 8. Most frequent taxa sorted in decreasing order in northern and southern samples
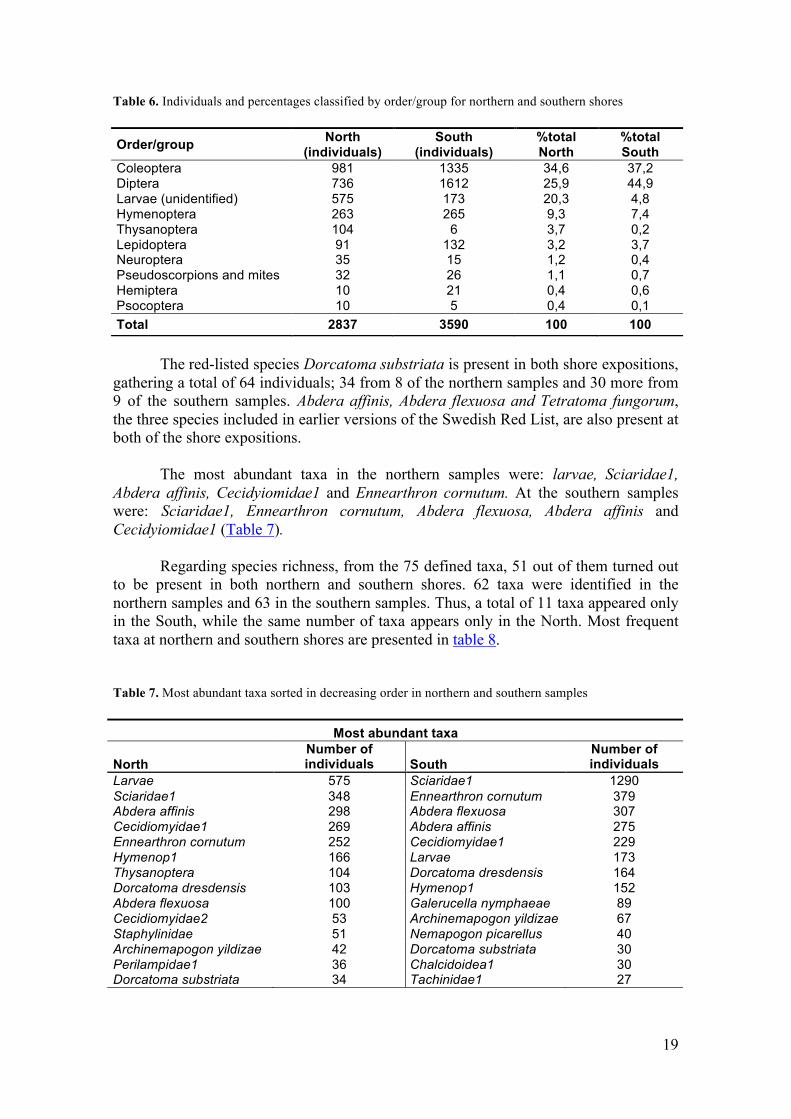
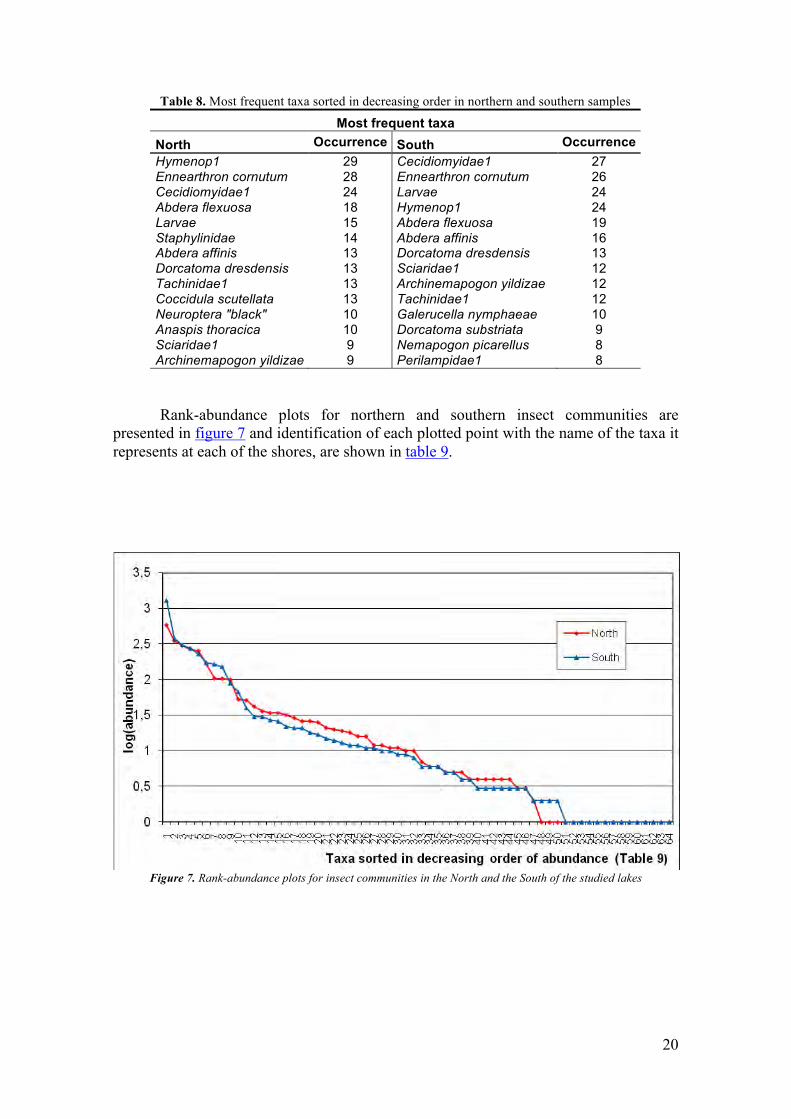
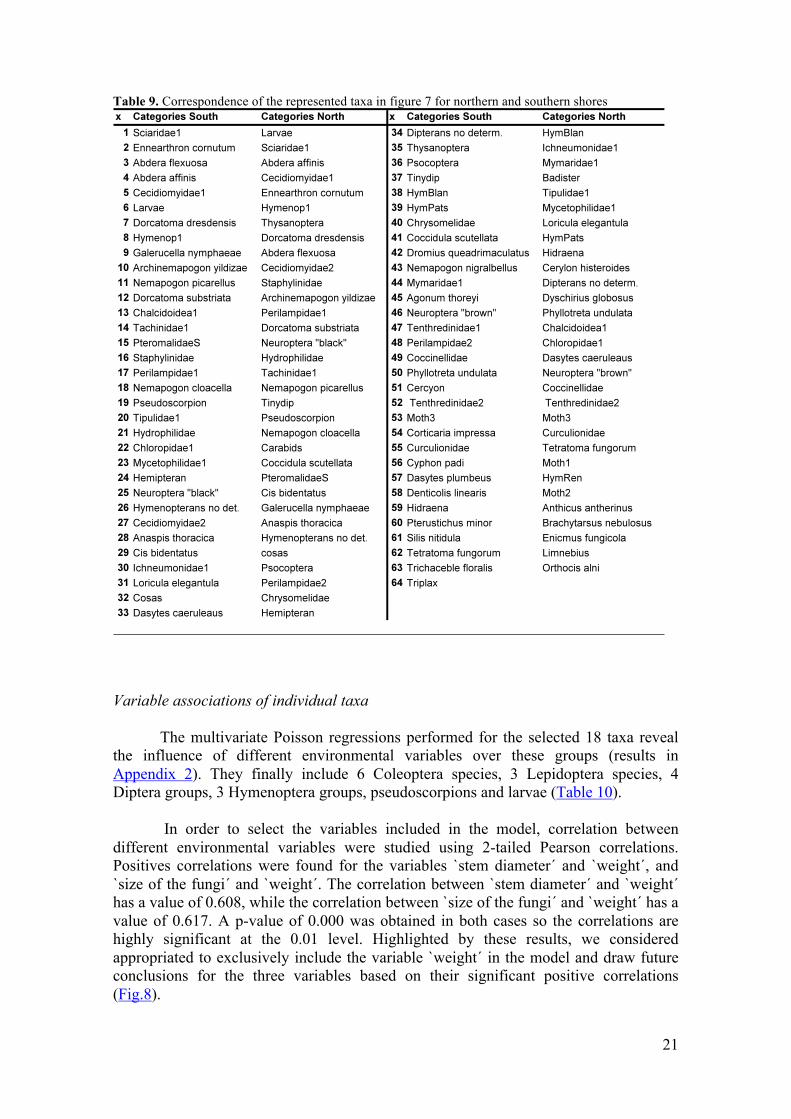
Most frequent taxa North Occurrence South Occurrence Hymenop1 29 Cecidiomyidae1 27 Ennearthron cornutum 28 Ennearthron cornutum 26 Cecidiomyidae1 24 Larvae 24 Abdera flexuosa 18 Hymenop1 24 Larvae 15 Abdera flexuosa 19 Staphylinidae 14 Abdera affinis 16 Abdera affinis 13 Dorcatoma dresdensis 13 Dorcatoma dresdensis 13 Sciaridae1 12 Tachinidae1 13 Archinemapogon yildizae 12 Coccidula scutellata 13 Tachinidae1 12 Neuroptera "black" 10 Galerucella nymphaeae 10 Anaspis thoracica 10 Dorcatoma substriata 9 Sciaridae1 9 Nemapogon picarellus 8 Archinemapogon yildizae 9 Perilampidae1 8 Rank-abundance plots for northern and southern insect communities are
presented in figure 7 and identification of each plotted point with the name of the taxa it represents at each of the shores, are shown in table 9.
Figure 7. Rank-abundance plots for insect communities in the North and the South of the studied lakes
21
Table 9. Correspondence of the represented taxa in figure 7 for northern and southern shores
Variable associations of individual taxa
The multivariate Poisson regressions performed for the selected 18 taxa reveal the influence of different environmental variables over these groups (results in Appendix 2). They finally include 6 Coleoptera species, 3 Lepidoptera species, 4 Diptera groups, 3 Hymenoptera groups, pseudoscorpions and larvae (Table 10).
In order to select the variables included in the model, correlation between
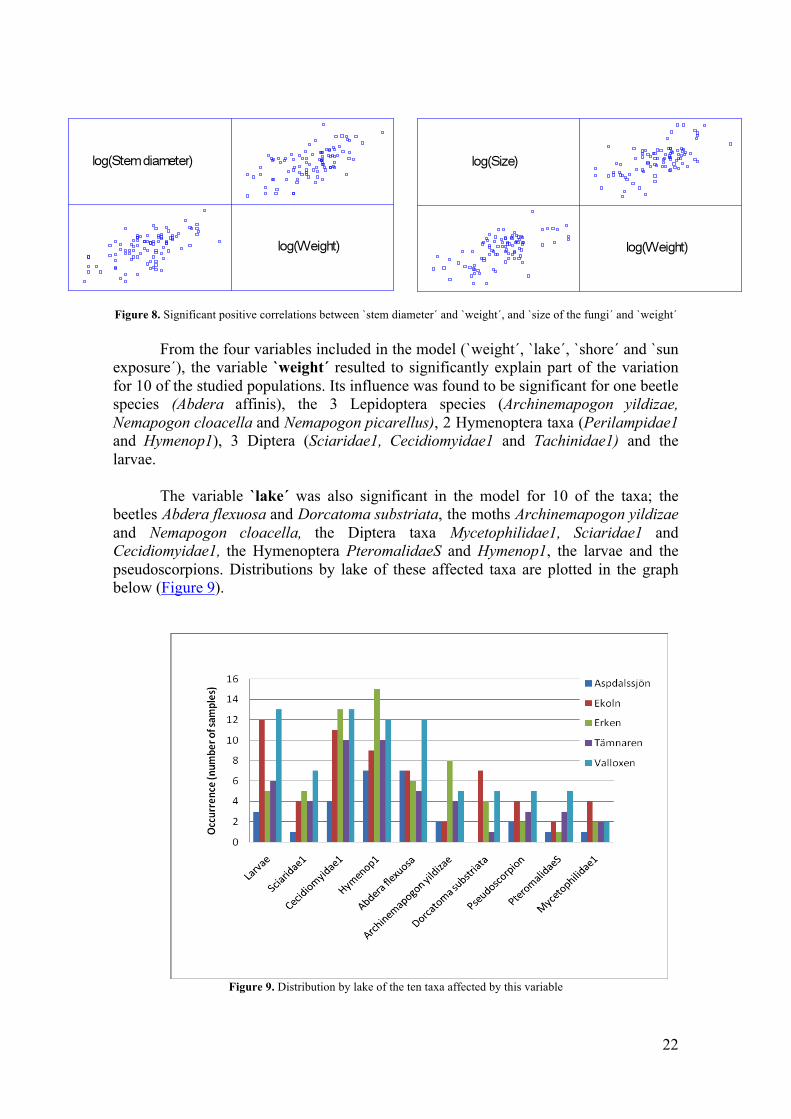
different environmental variables were studied using 2-tailed Pearson correlations. Positives correlations were found for the variables `stem diameter´ and `weight´, and `size of the fungi´ and `weight´. The correlation between `stem diameter´ and `weight´ has a value of 0.608, while the correlation between `size of the fungi´ and `weight´ has a value of 0.617. A p-value of 0.000 was obtained in both cases so the correlations are highly significant at the 0.01 level. Highlighted by these results, we considered appropriated to exclusively include the variable `weight´ in the model and draw future conclusions for the three variables based on their significant positive correlations (Fig.8).
22
Figure 8. Significant positive correlations between `stem diameter´ and `weight´, and `size of the fungi´ and `weight´
From the four variables included in the model (`weight´, `lake´, `shore´ and `sun exposure´), the variable `weight´ resulted to significantly explain part of the variation for 10 of the studied populations. Its influence was found to be significant for one beetle species (Abdera affinis), the 3 Lepidoptera species (Archinemapogon yildizae, Nemapogon cloacella and Nemapogon picarellus), 2 Hymenoptera taxa (Perilampidae1 and Hymenop1), 3 Diptera (Sciaridae1, Cecidiomyidae1 and Tachinidae1) and the larvae.
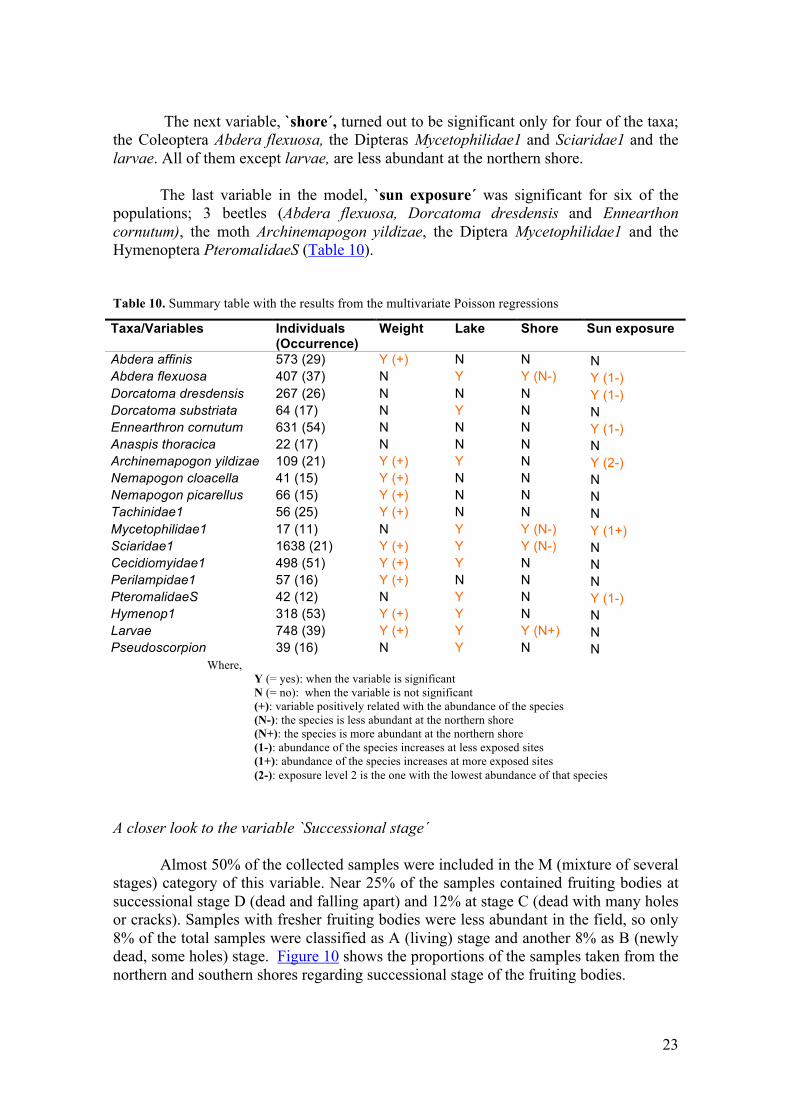
The variable `lake´ was also significant in the model for 10 of the taxa; the beetles Abdera flexuosa and Dorcatoma substriata, the moths Archinemapogon yildizae and Nemapogon cloacella, the Diptera taxa Mycetophilidae1, Sciaridae1 and Cecidiomyidae1, the Hymenoptera PteromalidaeS and Hymenop1, the larvae and the pseudoscorpions. Distributions by lake of these affected taxa are plotted in the graph below (Figure 9).
Figure 9. Distribution by lake of the ten taxa affected by this variable
23
The next variable, `shore´, turned out to be significant only for four of the taxa;
the Coleoptera Abdera flexuosa, the Dipteras Mycetophilidae1 and Sciaridae1 and the larvae. All of them except larvae, are less abundant at the northern shore.
The last variable in the model, `sun exposure´ was significant for six of the
populations; 3 beetles (Abdera flexuosa, Dorcatoma dresdensis and Ennearthon cornutum), the moth Archinemapogon yildizae, the Diptera Mycetophilidae1 and the Hymenoptera PteromalidaeS (Table 10).
Table 10. Summary table with the results from the multivariate Poisson regressions
Where, Y (= yes): when the variable is significant N (= no): when the variable is not significant (+): variable positively related with the abundance of the species (N-): the species is less abundant at the northern shore (N+): the species is more abundant at the northern shore (1-): abundance of the species increases at less exposed sites (1+): abundance of the species increases at more exposed sites (2-): exposure level 2 is the one with the lowest abundance of that species
A closer look to the variable `Successional stage´
Almost 50% of the collected samples were included in the M (mixture of several
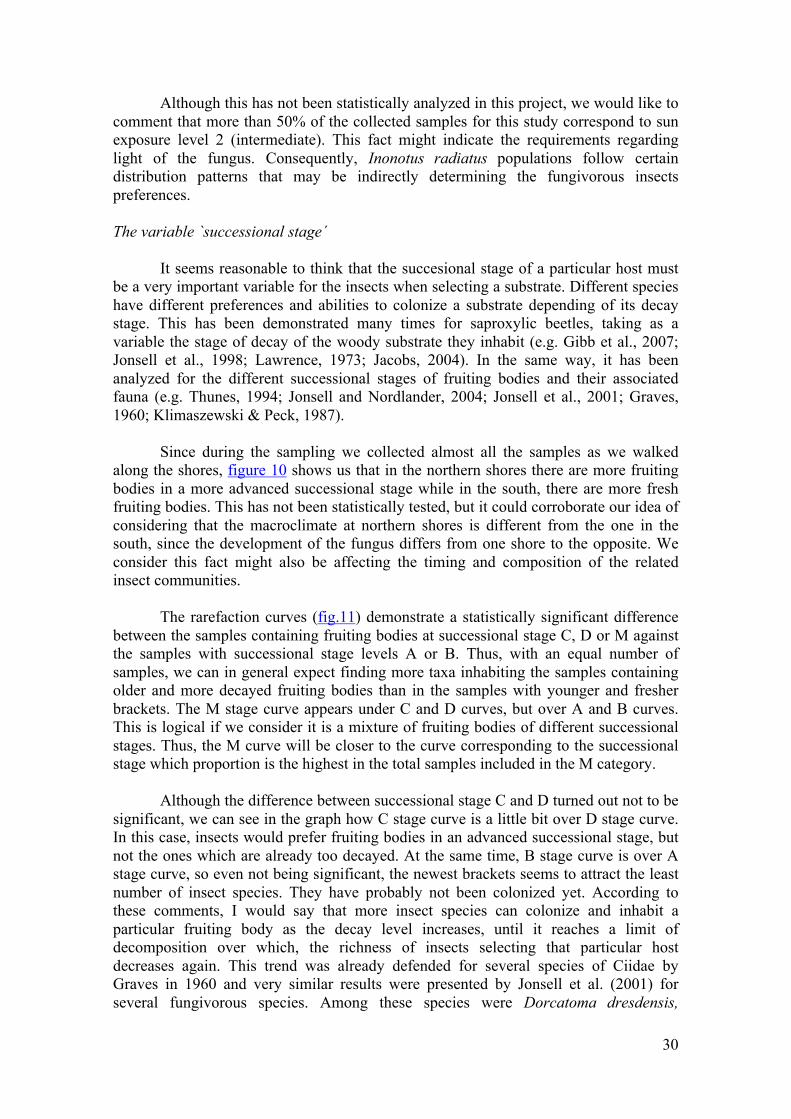
stages) category of this variable. Near 25% of the samples contained fruiting bodies at successional stage D (dead and falling apart) and 12% at stage C (dead with many holes or cracks). Samples with fresher fruiting bodies were less abundant in the field, so only 8% of the total samples were classified as A (living) stage and another 8% as B (newly dead, some holes) stage. Figure 10 shows the proportions of the samples taken from the northern and southern shores regarding successional stage of the fruiting bodies.
Taxa/Variables Individuals (Occurrence)
Weight Lake Shore Sun exposure
Abdera affinis 573 (29) Y (+) N N N Abdera flexuosa 407 (37) N Y Y (N-) Y (1-) Dorcatoma dresdensis 267 (26) N N N Y (1-) Dorcatoma substriata 64 (17) N Y N N Ennearthron cornutum 631 (54) N N N Y (1-) Anaspis thoracica 22 (17) N N N N Archinemapogon yildizae 109 (21) Y (+) Y N Y (2-) Nemapogon cloacella 41 (15) Y (+) N N N Nemapogon picarellus 66 (15) Y (+) N N N Tachinidae1 56 (25) Y (+) N N N Mycetophilidae1 17 (11) N Y Y (N-) Y (1+) Sciaridae1 1638 (21) Y (+) Y Y (N-) N Cecidiomyidae1 498 (51) Y (+) Y N N Perilampidae1 57 (16) Y (+) N N N PteromalidaeS 42 (12) N Y N Y (1-) Hymenop1 318 (53) Y (+) Y N N Larvae 748 (39) Y (+) Y Y (N+) N Pseudoscorpion 39 (16) N Y N N
24
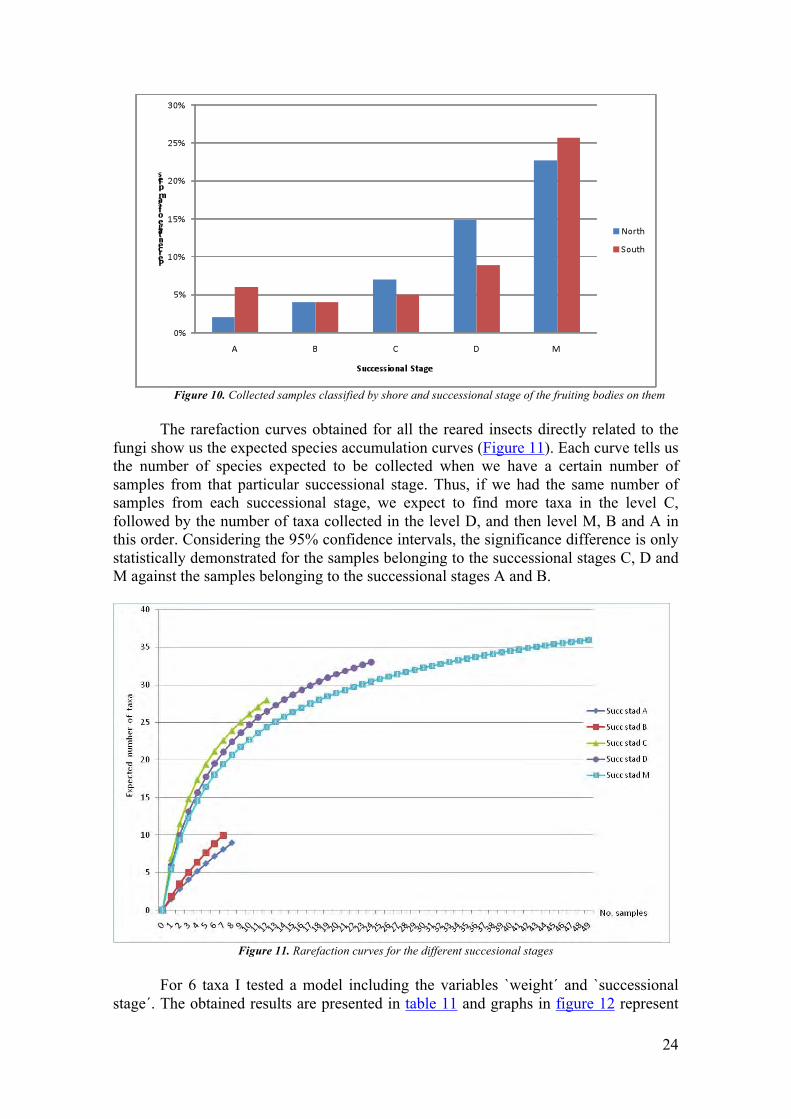
Figure 10. Collected samples classified by shore and successional stage of the fruiting bodies on them
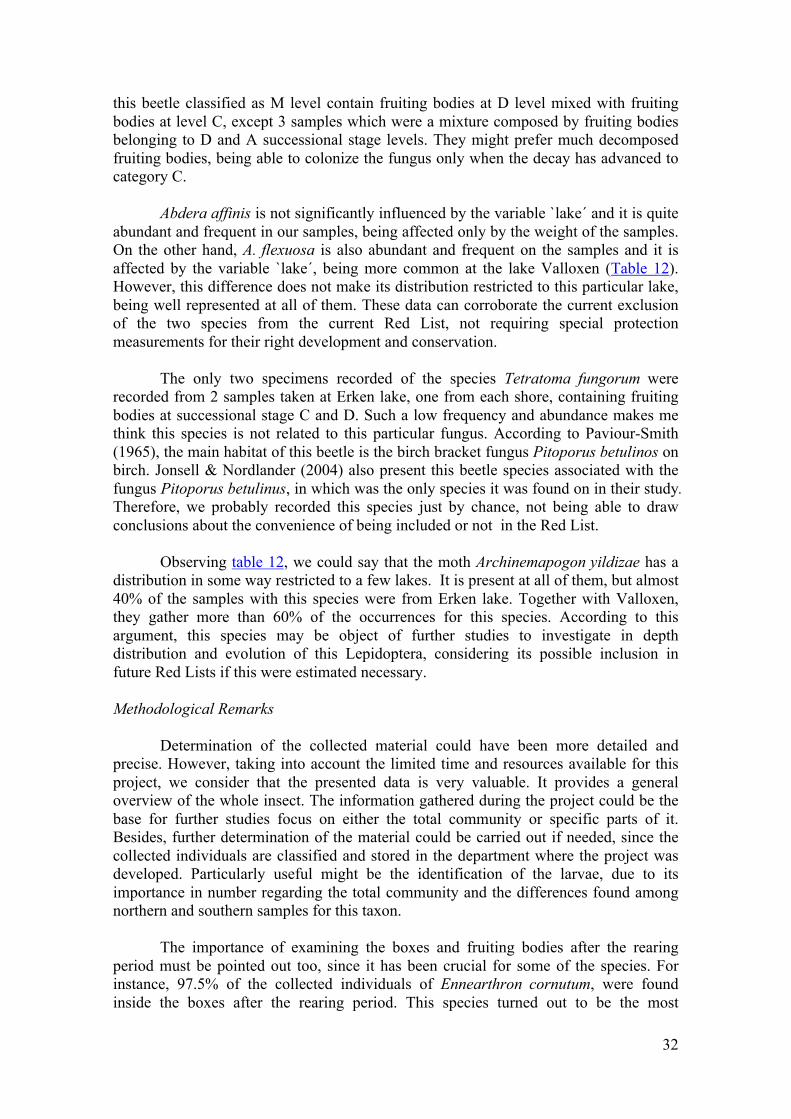
The rarefaction curves obtained for all the reared insects directly related to the
fungi show us the expected species accumulation curves (Figure 11). Each curve tells us the number of species expected to be collected when we have a certain number of samples from that particular successional stage. Thus, if we had the same number of samples from each successional stage, we expect to find more taxa in the level C, followed by the number of taxa collected in the level D, and then level M, B and A in this order. Considering the 95% confidence intervals, the significance difference is only statistically demonstrated for the samples belonging to the successional stages C, D and M against the samples belonging to the successional stages A and B.
Figure 11. Rarefaction curves for the different succesional stages
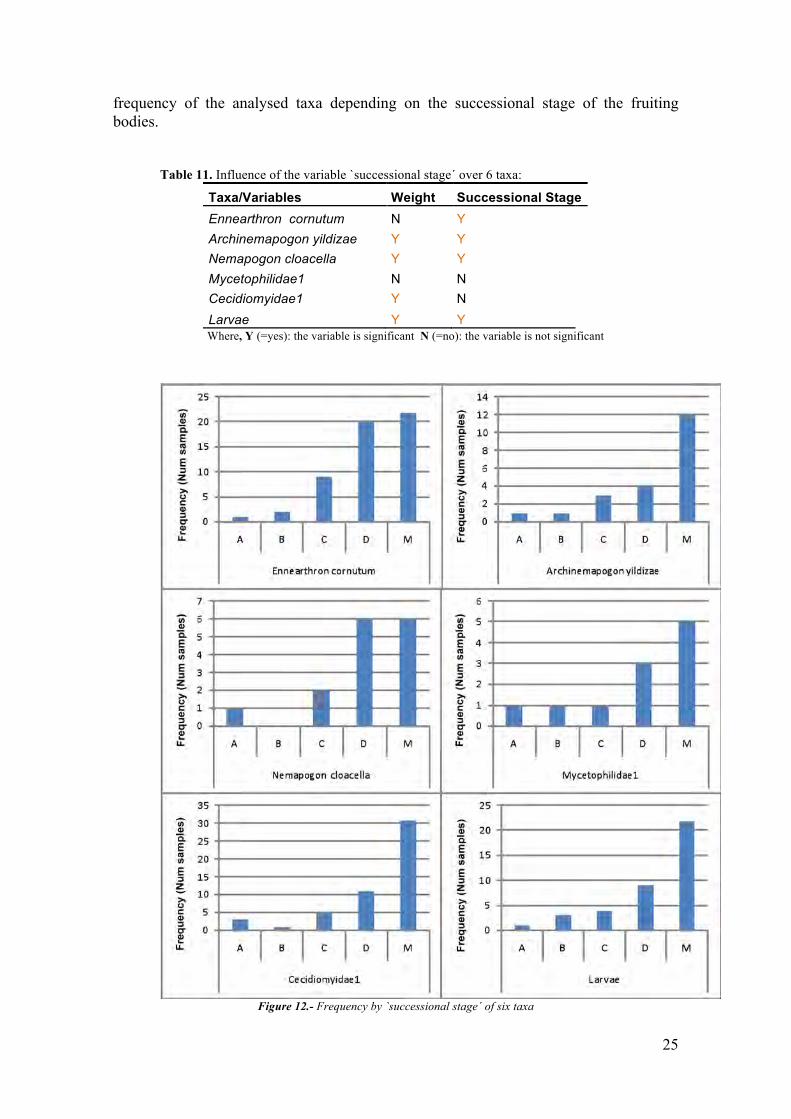
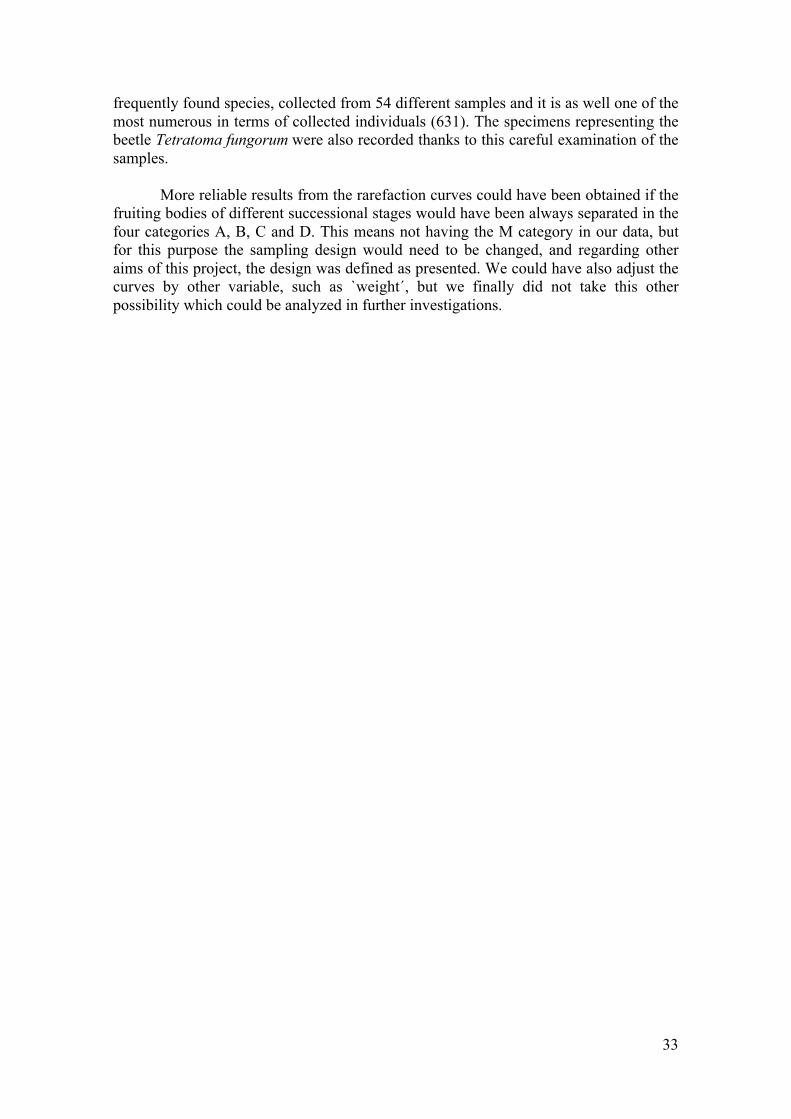
For 6 taxa I tested a model including the variables `weight´ and `successional
stage´. The obtained results are presented in table 11 and graphs in figure 12 represent
25
frequency of the analysed taxa depending on the successional stage of the fruiting bodies.
Table 11. Influence of the variable `successional stage´ over 6 taxa:
Taxa/Variables Weight Successional Stage Ennearthron cornutum N Y Archinemapogon yildizae Y Y Nemapogon cloacella Y Y Mycetophilidae1 N N Cecidiomyidae1 Y N Larvae Y Y Where, Y (=yes): the variable is significant N (=no): the variable is not significant
Figure 12.- Frequency by `successional stage´ of six taxa
26
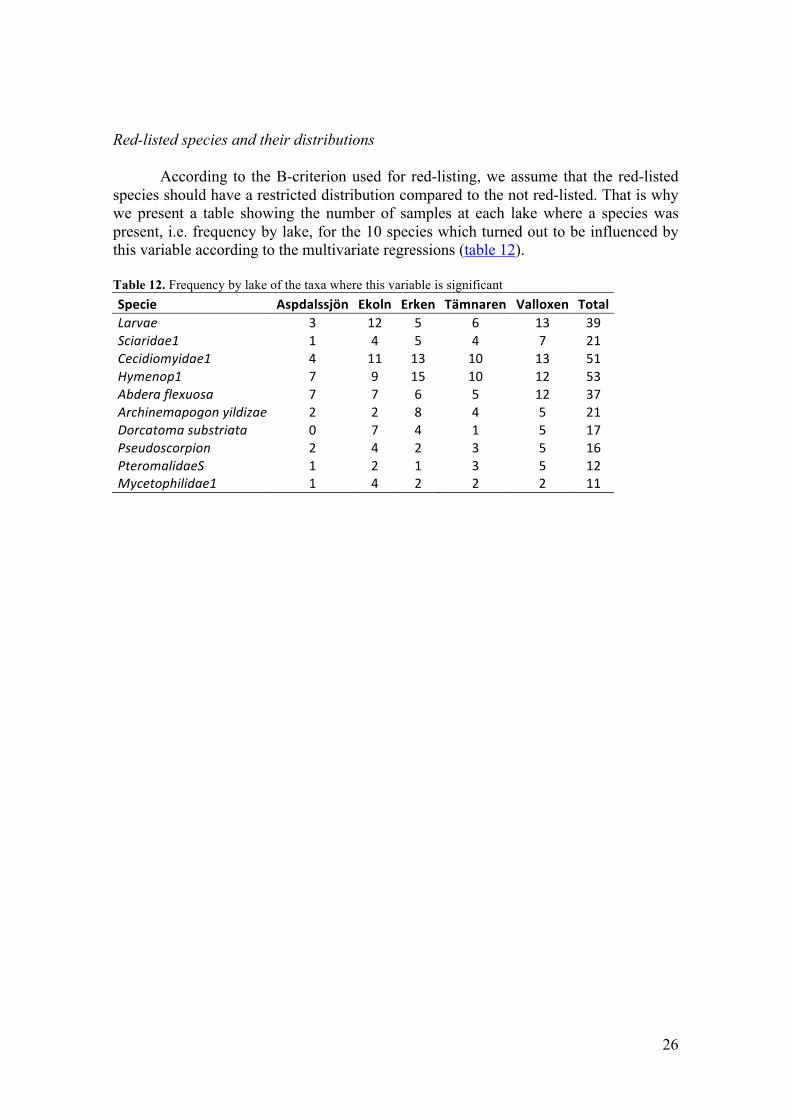
Red-listed species and their distributions According to the B-criterion used for red-listing, we assume that the red-listed species should have a restricted distribution compared to the not red-listed. That is why we present a table showing the number of samples at each lake where a species was present, i.e. frequency by lake, for the 10 species which turned out to be influenced by this variable according to the multivariate regressions (table 12). Table 12. Frequency by lake of the taxa where this variable is significant Specie Aspdalssjön Ekoln Erken Tämnaren Valloxen Total Larvae 3 12 5 6 13 39 Sciaridae1 1 4 5 4 7 21 Cecidiomyidae1 4 11 13 10 13 51 Hymenop1 7 9 15 10 12 53 Abdera flexuosa 7 7 6 5 12 37 Archinemapogon yildizae 2 2 8 4 5 21 Dorcatoma substriata 0 7 4 1 5 17 Pseudoscorpion 2 4 2 3 5 16 PteromalidaeS 1 2 1 3 5 12 Mycetophilidae1 1 4 2 2 2 11
27
Discussion General remarks about the collected data
Fulfilling the first aim of the project, valuable original data about the insect
community related to Inonotus radiatus have been gathered during the project. A few other studies presented data about the insects related to this particular fungus, but never covered the whole community. In contrast, these investigations were focused on only some orders, for instance, Coleoptera and Lepidoptera (Jonsell & Nordlander, 2004) or only Diptera (Ševčík, 2004). Compared to the presented data by Jonsell and Nordlander regarding fungivorous Coleptera, Tetratoma fungorum was reared in the present study while it was only found on other fungal species in their paper. On the other hand, they reported the species Cis alter, Cis jacquemartii, Cis glabratus and Bolitophagus reticulatus which were not collected from my samples. Regarding Lepidoptera species, four more species that were absent in their paper have been recorded during this project; Nemapogon nigralbellus, Achillea millefolium, Scoparia ambigualis and Ectoedemiya. Ševčík presented four species of Diptera, two of them from the Mycetophilidae family (Sciophila hirta and Dynatosoma fuscicorne), one Ditomyiidae (Ditomyia fasciata) and one Cecidiomyiidae (Lestodiplosis polypori), all of them collected from Inonotus radiatus samples. In the present project, determination of Diptera was completed only at family level, but we present at least 2 species of Cecidiomyiidae, one of Mycetophilidae and species belonging to the Chloropidae, Tipulidae, Tachinidae and Sciaridae families. This last family takes an important part of the gathered insect community; however, it was not recorded during Ševčík study.
Interpreting the rank-abundance plot for the whole community (fig.7), we can
see a species rich community composed by many taxa, specially having in mind that not all of these taxa have been determined to species level. The curve, as it has been founded for other insect communities, shows a steep gradient, which indicates low evenness; the high ranking species have much higher abundances than the low ranking species. These dominant taxa correspond to fungivorous Coleoptera, Diptera and Hymenoptera, although the unidentified larvae are also very numerous. At the same time, the rank-occurrence plot also presents a steep slope in the beginning of the curve, which points out that only a few taxa have a high frequency on our samples, while more than 36% of the taxa were only present in ten or less samples out of the 100 studied samples.
Comparing the rank-abundance plots obtained for the northern and southern
communities (fig. 8) we observe that the tail for the northern curve is a bit longer than the one for the southern curve, so in the North a few more taxa seems to be present in the samples just by chance. Other than their tails, though, the shapes for both plots are quite similar, with a relatively steep slope in the beginning of the curves, indicating, as it did for the global community, low evenness. However, sequence of species is different which make the composition of each community singular. For instance, in the southern community, Ennearthron cornutum is the second more abundant taxa, while it is in the fifth position in the northern one. In the North, larvae are the most abundant while in the South it places the sixth position. Thus, communities developed in northern and southern shores have at least a different composition.
28
Variable associations of individual taxa The studied taxa showed different responses; none of them were influenced by
all four considered variables (table 10). Only one taxa (Anaspis thoracica) was not affected by any of the variables and the rest were affected by 1, 2 or 3 variables at the same time. Besides the number of significant variables for each taxon, the affected taxa also show diverse responses against each of these influential variables. These facts can make deciding difficult when defining the right practices for protection, conservation or exploitation if a riparian forest. However, the more we learn about the substrate preferences and requirements of individual taxa, the better we can achieve a sustainable management of our forests.
In first place, the results show that the biggest influence over the studied taxa, is
caused by the `weight´ of the samples. We did expect this variable to have an important influence over the populations since previous studies had already demonstrated it. We consider that the inclusion of this variable in the model was essential, since we needed to take into account the heterogeneity of the sample size. All 10 taxa significantly related to the variable `weight´ become more abundant as the weight of the sample increases. This is probably analog to the mentioned positive relation generally found between the amount of deadwood and the abundance of saproxylic beetle species by authors like Økland (1995), Thunes et al (2000) or Grove (2002).
In the same way `stem diameter´ and `size of the fungi´ may also explain part of
the variation for the affected taxa, since the positive correlation between these variables and the variable `weight´ was demonstrated (Fig. 8). In general, little is known about the relationship between `stem diameter´ and the fungivorous insects present in the fruiting bodies growing on the stem. However, this argument may be in accordance with authors opinion that found positive relationships between saproxylic insects and stem diameter of the host trees (Jonsell, 1998; Ranius & Jansson, 2000), since positive relation between wood-inhabiting fungi and stem diameter has been demonstrated (Økland et al., 1995). Also, the positive relationship between the size of the fungi and the abundance and species richness of the related insects has been supported by authors like Økland et al. (1995), Komonen & Kouki (2005) or Midtgaard et al (1998). I would like to point out that we found this response for 10 of the study taxa, including all Lepidoptera species and most of the Diptera and Hymenoptera species, but we did not found such a trend for most of our fungivorous beetles. Only Abdera affinis was affected by this variable according to our results. Rukke (2002), in his study focused on fungivorous beetles feeding on F.fomentarius, found this trend for D.dresdensis (in contrast with our results for this species) and some other fungivorous beetles, although he did not found such a trend for E. cornutum, which is in accordance with our results.
Based on his results, Rukke (2002) recommended leaving enough dead wood in
the managed forest to assure the existence of Fomes fomentarius basidiocarps in order to preserve the diversity of fungivores in the forest. We could extend the recommendation to preserve the fungivorous species associated with our particular scenary; there is a need of maintaining Alnus glutinosa trees in the riparian forest and other deciduos species which together provide sufficient dead wood to assure an adequate supply of Inonotus radiatus basidiocarps of different qualities. These practices may also impact on the predators, parasitoids and hyperparasitoids related to the system,
29
since their development probably relies, at least partially, on the presence of these fungivorous species.
The variable `lake´ turned out to be one of the most influential variables in the system, being significant for 10 of the 18 taxa. The 5 studied lakes are geographically close enough for considering their general meteorological and ecological characteristics as common factors, so differences among the habitats provided at each lake probably derive from a lower level than mere geographical location. For a better understanding of the influence of the variable `lake´ over the insect communities, also other related variables characterizing the riparian forest present at each of the lakes should be studied. Thus, some variables that could be analyze in further investigations might be type of riparian forest, its composition, dominant tree species, human influence and/or history of the land, water quality…etc. In this way, we could better understand why a lake represents a more valuable spot for certain insects than other (apparently) similar lake.
The variable `shore´ has not been considered as a variable determining a
differential sun exposure level in opposite shores of a lake in any of the classical insect studies. Our results tell us that its influence is important for only 4 of the considered taxa, two of them being Diptera groups. Together with the affected beetle Abdera flexuosa, these Diptera seem to prefer the southern shores of the lakes, which we consider as more shaded. The last taxon affected by this variable includes all the unidentified larvae, which are more abundant in the more exposed shores represented by the northern shores. Maybe the larvae are more abundant at the northern shores than at the southern shores just because the insect community develops slower at this shore compared to the opposite one. The most abundant larvae in the north might develop into individuals of the less abundant taxa at the southern shores. In this way, the communities could present a similar structure regarding species composition, while the timing would be different.
At a different spatial scale, the variable `sun exposure´ also shows us the
importance of the received light for the individual taxa. It is significant for 6 taxa, including 3 Coleoptera, 1 Lepidoptera and 2 Hymenoptera taxa. The 2 Coleoptera, Dorcatoma dresdensis and Ennearthron cornutum, being influenced in the model only for this variable, turned out to be more attracted to the most shaded sites. The last Coleoptera affected, Abdera flexuosa, is also influenced by the variables `lake´ and `shore´. It is more abundant in the shaded sites than in the most exposed sites, and we mentioned that it is also more abundant in the southern shores considered as more shaded. It seems to be consequently associated with shaded sites at every level. In contrast, the Mycetophilidae Diptera are favored by sun-exposed sites, although they prefer the most shaded shore too. The Lepidoptera species, Archinemapogon yildizae, is more abundant in shaded sites and the least abundant in semi-shaded fruiting bodies, but it is not significantly influenced by the shore.
Particularly, the species Ennearthron cornutum turned out to be affected only by
sun exposure and it clearly prefers fruiting bodies at semi shaded or shaded sites. Some authors obtained similar conclusions for this and other Ciidae beetles (Jonsell et al., 2001; Thunes et al., 2000) while some others found beetle species with higher frequencies at more sun exposed sites (Midtgaard et al., 1998).
30
Although this has not been statistically analyzed in this project, we would like to comment that more than 50% of the collected samples for this study correspond to sun exposure level 2 (intermediate). This fact might indicate the requirements regarding light of the fungus. Consequently, Inonotus radiatus populations follow certain distribution patterns that may be indirectly determining the fungivorous insects preferences.
The variable `successional stage´
It seems reasonable to think that the succesional stage of a particular host must be a very important variable for the insects when selecting a substrate. Different species have different preferences and abilities to colonize a substrate depending of its decay stage. This has been demonstrated many times for saproxylic beetles, taking as a variable the stage of decay of the woody substrate they inhabit (e.g. Gibb et al., 2007; Jonsell et al., 1998; Lawrence, 1973; Jacobs, 2004). In the same way, it has been analyzed for the different successional stages of fruiting bodies and their associated fauna (e.g. Thunes, 1994; Jonsell and Nordlander, 2004; Jonsell et al., 2001; Graves, 1960; Klimaszewski & Peck, 1987).
Since during the sampling we collected almost all the samples as we walked
along the shores, figure 10 shows us that in the northern shores there are more fruiting bodies in a more advanced successional stage while in the south, there are more fresh fruiting bodies. This has not been statistically tested, but it could corroborate our idea of considering that the macroclimate at northern shores is different from the one in the south, since the development of the fungus differs from one shore to the opposite. We consider this fact might also be affecting the timing and composition of the related insect communities.
The rarefaction curves (fig.11) demonstrate a statistically significant difference between the samples containing fruiting bodies at successional stage C, D or M against the samples with successional stage levels A or B. Thus, with an equal number of samples, we can in general expect finding more taxa inhabiting the samples containing older and more decayed fruiting bodies than in the samples with younger and fresher brackets. The M stage curve appears under C and D curves, but over A and B curves. This is logical if we consider it is a mixture of fruiting bodies of different successional stages. Thus, the M curve will be closer to the curve corresponding to the successional stage which proportion is the highest in the total samples included in the M category.
Although the difference between successional stage C and D turned out not to be
significant, we can see in the graph how C stage curve is a little bit over D stage curve. In this case, insects would prefer fruiting bodies in an advanced successional stage, but not the ones which are already too decayed. At the same time, B stage curve is over A stage curve, so even not being significant, the newest brackets seems to attract the least number of insect species. They have probably not been colonized yet. According to these comments, I would say that more insect species can colonize and inhabit a particular fruiting body as the decay level increases, until it reaches a limit of decomposition over which, the richness of insects selecting that particular host decreases again. This trend was already defended for several species of Ciidae by Graves in 1960 and very similar results were presented by Jonsell et al. (2001) for several fungivorous species. Among these species were Dorcatoma dresdensis,

31
Dorcatoma robusta and Cis lineatocribratus. Other species wich has been also collected in the present study, such as Ennearthron cornutum, Cis bidentatus turned out to follow a slightly different pattern, increasing their frequency with the decay stage of the fruiting bodies. Other species were less frequent in the first successional stage, reached a maximum in the second category to decrease again in the third and the last stage.
Karl H. Thunes (1994) classified fruiting bodies of two different bracket fungi in
5 big groups, and he also presented a similar trend of preference by the related insects. The only difference is that he found more preference for the first stage than we have found.
Similar trend to the one we have found was also presented in a study about red-
listed saproxylic invertebrates by Jonsell et al. (1998). They considered 7 different categories of successional stage of the woody substrate and the highest number of species was found associated to the 6th category. The lowest number of species was found in the first successional stage and it increased until the 6th stage, to decline again in the last successional stage.
Four out of the six tested taxa (table 11) are influenced by the successional stage
of the fruiting bodies. This variable is not significant for the two Diptera taxa, while it is significant for the Coleoptera species, both Lepidoptera species and the larvae.
According to the multivariate regressions and the graph presented in figure 12,
the species Ennearthron cornutum is more frequent as more advanced is the decay stage of the fruiting bodies. This is in accordance with the results obtained for the same species in Jonsell et al. (2001). The model shows that the Lepidoptera Archinemapogon yildizae has preference for fruiting bodies in successional stage C, then D and finally A and B. In contrast, Jonsell el al. study (2001) pointed out different preferences, being the order B, C, A and D stages. Our results regarding Nemapogon cloacella explain that it has a preference for old fruiting bodies, but not too old. It prefers C stage, followed by D stage, A and in last place B stage. Larvae do not present a clear tendece for new or decayed fungi. They are attracted to B stage in first place, then D, A and C in that order.
Red-listed species
The species Dorcatoma substriata, at present classified as near threatened in the region, turned out to be relatively common in our samples. However, it responded to the variable `lake´ in the regressions and looking at table 12, we can see its distribution is more restricted than for other affected species, e. g. A. flexuosa. D. substriata is absent or almost absent in two of the lakes and it concentrates more than 40% of its total occurrences at one particular lake, Ekoln. This matches the B-criterion considered for red-listing, meaning our data supports the idea of maintaining the species on the Swedish Red List. On the other hand, we have not enough data to statistically analyze how the variable `successional stage´ influences this species, but it seems to be a very important variable regarding substrate preferences of this beetle. All the collected specimens were reared only from samples with fruiting bodies at C and/or D successional stage level. Actually, 16 out of a total of 17 samples which turned out to be inhabited by this beetle species contained at least some fruiting bodies at D level. The remaining sample contained exclusively fruiting bodies at successional stage C. It is not present at any sample containing only brackets from the A and B level. Samples with
32
this beetle classified as M level contain fruiting bodies at D level mixed with fruiting bodies at level C, except 3 samples which were a mixture composed by fruiting bodies belonging to D and A successional stage levels. They might prefer much decomposed fruiting bodies, being able to colonize the fungus only when the decay has advanced to category C.
Abdera affinis is not significantly influenced by the variable `lake´ and it is quite
abundant and frequent in our samples, being affected only by the weight of the samples. On the other hand, A. flexuosa is also abundant and frequent on the samples and it is affected by the variable `lake´, being more common at the lake Valloxen (Table 12). However, this difference does not make its distribution restricted to this particular lake, being well represented at all of them. These data can corroborate the current exclusion of the two species from the current Red List, not requiring special protection measurements for their right development and conservation.
The only two specimens recorded of the species Tetratoma fungorum were
recorded from 2 samples taken at Erken lake, one from each shore, containing fruiting bodies at successional stage C and D. Such a low frequency and abundance makes me think this species is not related to this particular fungus. According to Paviour-Smith (1965), the main habitat of this beetle is the birch bracket fungus Pitoporus betulinos on birch. Jonsell & Nordlander (2004) also present this beetle species associated with the fungus Pitoporus betulinus, in which was the only species it was found on in their study. Therefore, we probably recorded this species just by chance, not being able to draw conclusions about the convenience of being included or not in the Red List.
Observing table 12, we could say that the moth Archinemapogon yildizae has a distribution in some way restricted to a few lakes. It is present at all of them, but almost 40% of the samples with this species were from Erken lake. Together with Valloxen, they gather more than 60% of the occurrences for this species. According to this argument, this species may be object of further studies to investigate in depth distribution and evolution of this Lepidoptera, considering its possible inclusion in future Red Lists if this were estimated necessary.
Methodological Remarks
Determination of the collected material could have been more detailed and
precise. However, taking into account the limited time and resources available for this project, we consider that the presented data is very valuable. It provides a general overview of the whole insect. The information gathered during the project could be the base for further studies focus on either the total community or specific parts of it. Besides, further determination of the material could be carried out if needed, since the collected individuals are classified and stored in the department where the project was developed. Particularly useful might be the identification of the larvae, due to its importance in number regarding the total community and the differences found among northern and southern samples for this taxon.
The importance of examining the boxes and fruiting bodies after the rearing
period must be pointed out too, since it has been crucial for some of the species. For instance, 97.5% of the collected individuals of Ennearthron cornutum, were found inside the boxes after the rearing period. This species turned out to be the most
33
frequently found species, collected from 54 different samples and it is as well one of the most numerous in terms of collected individuals (631). The specimens representing the beetle Tetratoma fungorum were also recorded thanks to this careful examination of the samples.
More reliable results from the rarefaction curves could have been obtained if the
fruiting bodies of different successional stages would have been always separated in the four categories A, B, C and D. This means not having the M category in our data, but for this purpose the sampling design would need to be changed, and regarding other aims of this project, the design was defined as presented. We could have also adjust the curves by other variable, such as `weight´, but we finally did not take this other possibility which could be analyzed in further investigations.
34
Acknowledgments
In first place, I thank my supervisors for making this project real and teaching me so much about this wonderful bug’s world and about Scandinavia and its people. Thank you Mats, the authentic Swede loving snow, ice, and cold who really needs to swim on the lake when it is (only) 20ºC outside. You made me feel as a true researcher from the beginning to the end. Thanks for your support. Thank you Atte, my Finnish supervisor, for your valuable help with the statistics and what is more, for your contagious enthusiasm during the whole project. Thank you both for such a funny days “hunting bugs” walking through amazing frozen lakes. I need to thank you too for your patience and support until the last moment, even being separated for so many kilometres. Of course, thank you for improving my Swedish, Finnish and English. Thank you, Bengt Å. Bengtsson, for helping us with the determination of the moths.
Thank you “Vita” for your help and friendship. Thanks for sharing with me lab,
greenhouse, pancakes and even a dog, always with a smile on your face. Thanks for those intense adventures you, Vincent, the car, the snow, the lakes and I lived together. Thanks for helping me with my bugs and for teaching me more about yours and your amazing pictures.
Thank you José Antonio Saíz de Omeñaca, my Spanish supervisor, who
accepted to be my supervisor without even knowing me and always supported me from Madrid with interest. Thank you Paz Arraiza, Elena Rascón, Frank Sterner and Maria Starkenberg, without your help and dedication these experiences would not be possible.
Thank you, Ignacio, for being always there. Thank you for supporting me every
time, for making my life full of laughs and plans. Thank you for the great excursion to the frozen lake “en busca de la cámara perdida”. You make those “sad moments” change into happy ones. Thanks for sharing with me the good and the bad times.
Many thanks to my family: Maite, Pipi, Alipio, Natalia, Susana, Mario and tiny
Adrián. Without you and your love nothing would be the same. Thanks for your support in the distance and for your visits to know a little bit more about my Swedish life and of course, about my bugs. Thank you to Celia and Maca. We three are always together even living in three different countries. Thanks for making me know that this would be like this forever.
Thanks to my old friends from Madrid and to my new friends from almost
everywhere. They are also part of my life and part of this project. Special thanks to my classmates from Montes, it was great to go through our University years together and I am happy to know we will go through many other things together.
35
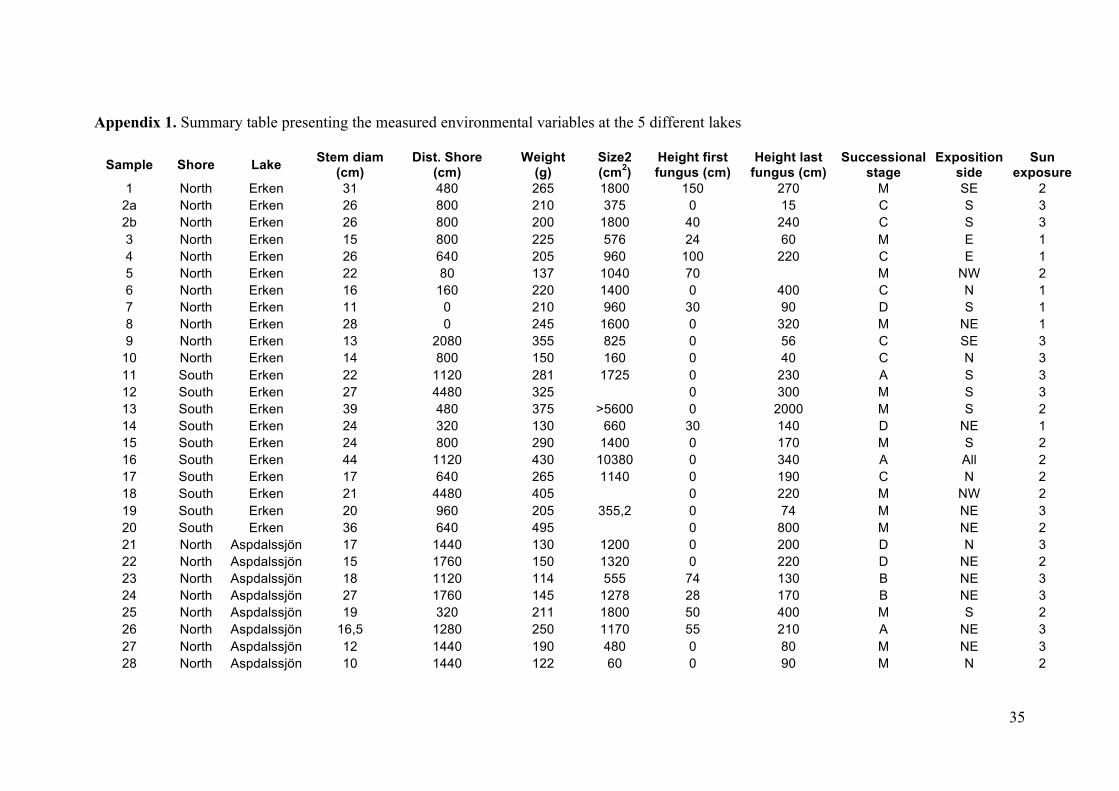
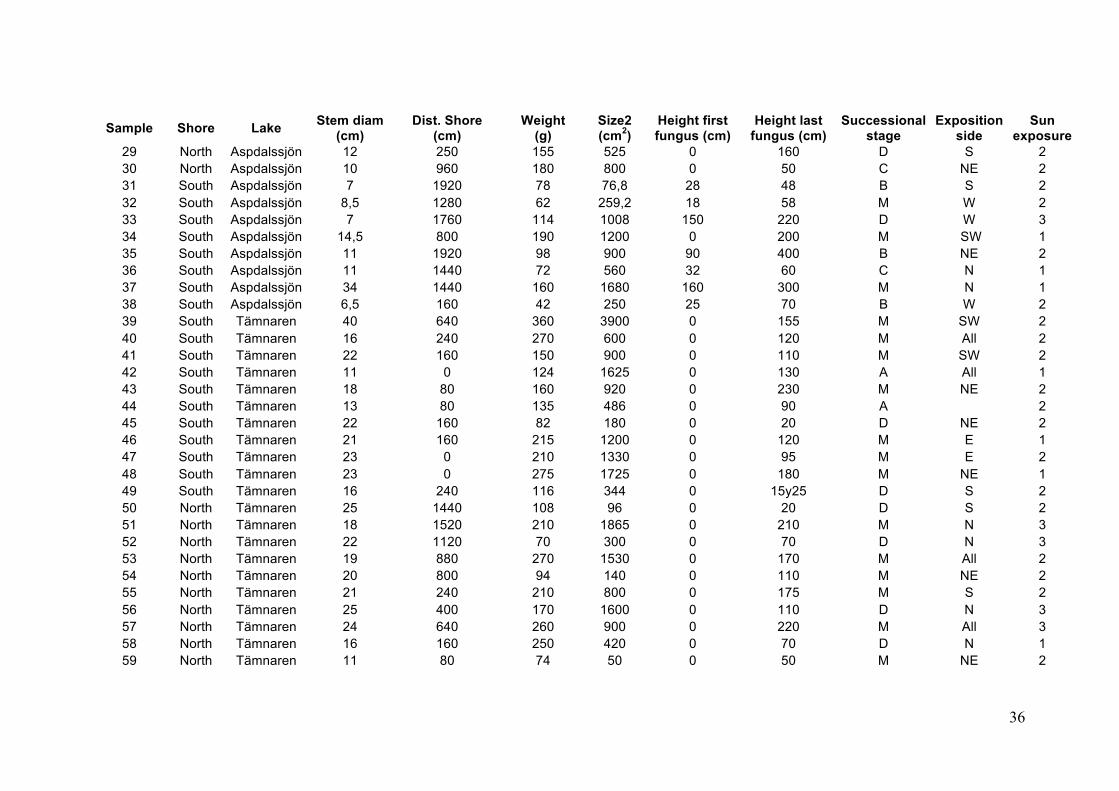
Appendix 1. Summary table presenting the measured environmental variables at the 5 different lakes
Sample Shore Lake Stem diam (cm)
Dist. Shore (cm)
Weight (g)
Size2 (cm2)
Height first fungus (cm)
Height last fungus (cm)
Successional stage
Exposition side
Sun exposure
1 North Erken 31 480 265 1800 150 270 M SE 2 2a North Erken 26 800 210 375 0 15 C S 3 2b North Erken 26 800 200 1800 40 240 C S 3 3 North Erken 15 800 225 576 24 60 M E 1 4 North Erken 26 640 205 960 100 220 C E 1 5 North Erken 22 80 137 1040 70 M NW 2 6 North Erken 16 160 220 1400 0 400 C N 1 7 North Erken 11 0 210 960 30 90 D S 1 8 North Erken 28 0 245 1600 0 320 M NE 1 9 North Erken 13 2080 355 825 0 56 C SE 3
10 North Erken 14 800 150 160 0 40 C N 3 11 South Erken 22 1120 281 1725 0 230 A S 3 12 South Erken 27 4480 325 0 300 M S 3 13 South Erken 39 480 375 >5600 0 2000 M S 2 14 South Erken 24 320 130 660 30 140 D NE 1 15 South Erken 24 800 290 1400 0 170 M S 2 16 South Erken 44 1120 430 10380 0 340 A All 2 17 South Erken 17 640 265 1140 0 190 C N 2 18 South Erken 21 4480 405 0 220 M NW 2 19 South Erken 20 960 205 355,2 0 74 M NE 3 20 South Erken 36 640 495 0 800 M NE 2 21 North Aspdalssjön 17 1440 130 1200 0 200 D N 3 22 North Aspdalssjön 15 1760 150 1320 0 220 D NE 2 23 North Aspdalssjön 18 1120 114 555 74 130 B NE 3 24 North Aspdalssjön 27 1760 145 1278 28 170 B NE 3 25 North Aspdalssjön 19 320 211 1800 50 400 M S 2 26 North Aspdalssjön 16,5 1280 250 1170 55 210 A NE 3 27 North Aspdalssjön 12 1440 190 480 0 80 M NE 3 28 North Aspdalssjön 10 1440 122 60 0 90 M N 2
36
Sample Shore Lake Stem diam (cm)
Dist. Shore (cm)
Weight (g)
Size2 (cm2)
Height first fungus (cm)
Height last fungus (cm)
Successional stage
Exposition side
Sun exposure
29 North Aspdalssjön 12 250 155 525 0 160 D S 2 30 North Aspdalssjön 10 960 180 800 0 50 C NE 2 31 South Aspdalssjön 7 1920 78 76,8 28 48 B S 2 32 South Aspdalssjön 8,5 1280 62 259,2 18 58 M W 2 33 South Aspdalssjön 7 1760 114 1008 150 220 D W 3 34 South Aspdalssjön 14,5 800 190 1200 0 200 M SW 1 35 South Aspdalssjön 11 1920 98 900 90 400 B NE 2 36 South Aspdalssjön 11 1440 72 560 32 60 C N 1 37 South Aspdalssjön 34 1440 160 1680 160 300 M N 1 38 South Aspdalssjön 6,5 160 42 250 25 70 B W 2 39 South Tämnaren 40 640 360 3900 0 155 M SW 2 40 South Tämnaren 16 240 270 600 0 120 M All 2 41 South Tämnaren 22 160 150 900 0 110 M SW 2 42 South Tämnaren 11 0 124 1625 0 130 A All 1 43 South Tämnaren 18 80 160 920 0 230 M NE 2 44 South Tämnaren 13 80 135 486 0 90 A 2 45 South Tämnaren 22 160 82 180 0 20 D NE 2 46 South Tämnaren 21 160 215 1200 0 120 M E 1 47 South Tämnaren 23 0 210 1330 0 95 M E 2 48 South Tämnaren 23 0 275 1725 0 180 M NE 1 49 South Tämnaren 16 240 116 344 0 15y25 D S 2 50 North Tämnaren 25 1440 108 96 0 20 D S 2 51 North Tämnaren 18 1520 210 1865 0 210 M N 3 52 North Tämnaren 22 1120 70 300 0 70 D N 3 53 North Tämnaren 19 880 270 1530 0 170 M All 2 54 North Tämnaren 20 800 94 140 0 110 M NE 2 55 North Tämnaren 21 240 210 800 0 175 M S 2 56 North Tämnaren 25 400 170 1600 0 110 D N 3 57 North Tämnaren 24 640 260 900 0 220 M All 3 58 North Tämnaren 16 160 250 420 0 70 D N 1 59 North Tämnaren 11 80 74 50 0 50 M NE 2
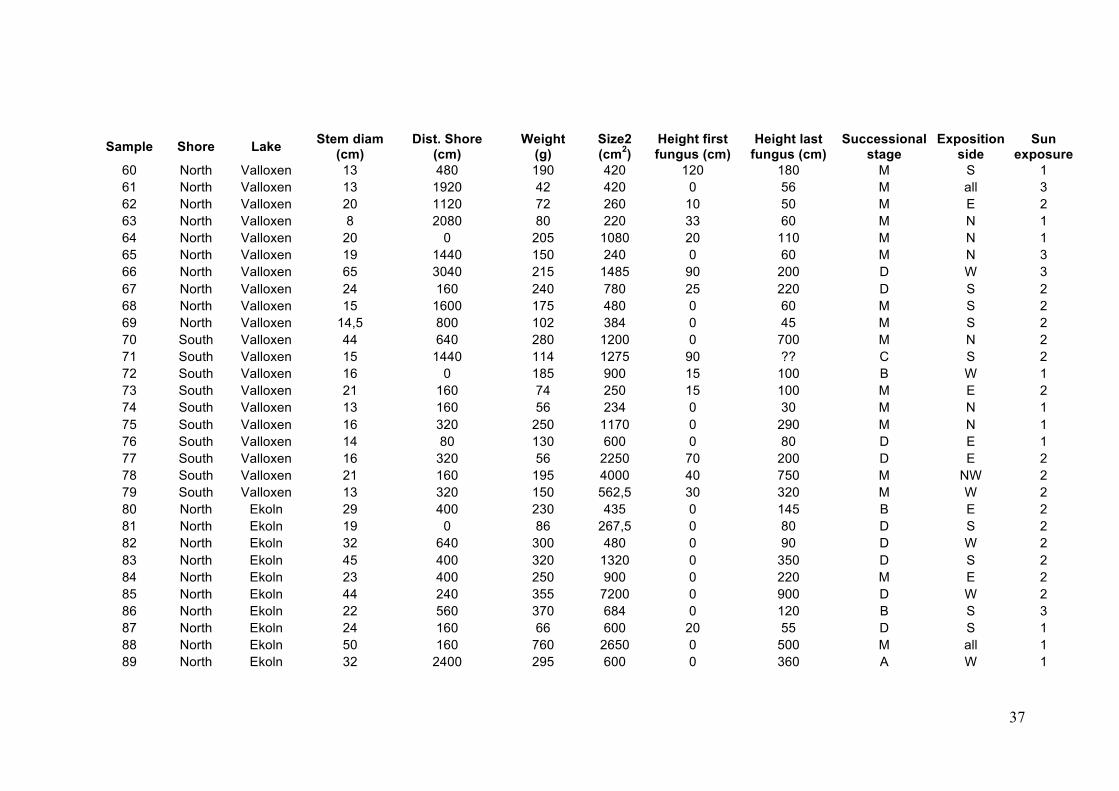
37
Sample Shore Lake Stem diam
(cm) Dist. Shore
(cm) Weight
(g) Size2 (cm2)
Height first fungus (cm)
Height last fungus (cm)
Successional stage
Exposition side
Sun exposure
60 North Valloxen 13 480 190 420 120 180 M S 1 61 North Valloxen 13 1920 42 420 0 56 M all 3 62 North Valloxen 20 1120 72 260 10 50 M E 2 63 North Valloxen 8 2080 80 220 33 60 M N 1 64 North Valloxen 20 0 205 1080 20 110 M N 1 65 North Valloxen 19 1440 150 240 0 60 M N 3 66 North Valloxen 65 3040 215 1485 90 200 D W 3 67 North Valloxen 24 160 240 780 25 220 D S 2 68 North Valloxen 15 1600 175 480 0 60 M S 2 69 North Valloxen 14,5 800 102 384 0 45 M S 2 70 South Valloxen 44 640 280 1200 0 700 M N 2 71 South Valloxen 15 1440 114 1275 90 ?? C S 2 72 South Valloxen 16 0 185 900 15 100 B W 1 73 South Valloxen 21 160 74 250 15 100 M E 2 74 South Valloxen 13 160 56 234 0 30 M N 1 75 South Valloxen 16 320 250 1170 0 290 M N 1 76 South Valloxen 14 80 130 600 0 80 D E 1 77 South Valloxen 16 320 56 2250 70 200 D E 2 78 South Valloxen 21 160 195 4000 40 750 M NW 2 79 South Valloxen 13 320 150 562,5 30 320 M W 2 80 North Ekoln 29 400 230 435 0 145 B E 2 81 North Ekoln 19 0 86 267,5 0 80 D S 2 82 North Ekoln 32 640 300 480 0 90 D W 2 83 North Ekoln 45 400 320 1320 0 350 D S 2 84 North Ekoln 23 400 250 900 0 220 M E 2 85 North Ekoln 44 240 355 7200 0 900 D W 2 86 North Ekoln 22 560 370 684 0 120 B S 3 87 North Ekoln 24 160 66 600 20 55 D S 1 88 North Ekoln 50 160 760 2650 0 500 M all 1 89 North Ekoln 32 2400 295 600 0 360 A W 1
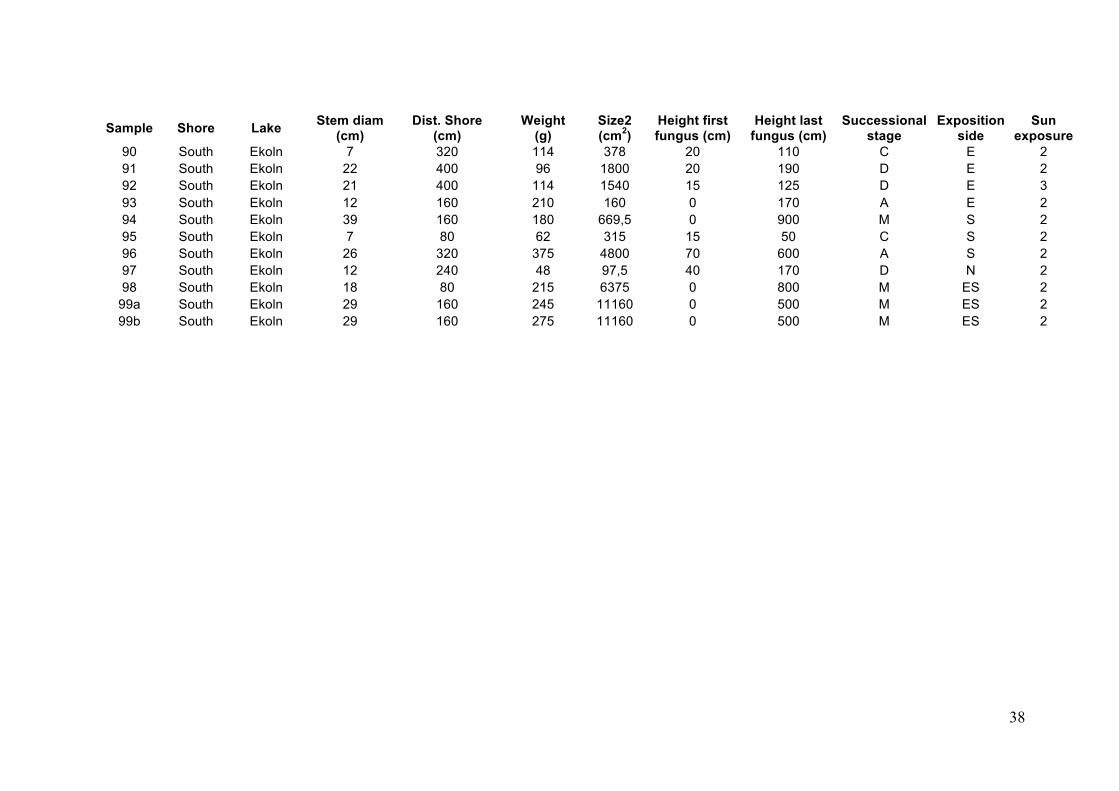
38
Sample Shore Lake Stem diam (cm)
Dist. Shore (cm)
Weight (g)
Size2 (cm2)
Height first fungus (cm)
Height last fungus (cm)
Successional stage
Exposition side
Sun exposure
90 South Ekoln 7 320 114 378 20 110 C E 2 91 South Ekoln 22 400 96 1800 20 190 D E 2 92 South Ekoln 21 400 114 1540 15 125 D E 3 93 South Ekoln 12 160 210 160 0 170 A E 2 94 South Ekoln 39 160 180 669,5 0 900 M S 2 95 South Ekoln 7 80 62 315 15 50 C S 2 96 South Ekoln 26 320 375 4800 70 600 A S 2 97 South Ekoln 12 240 48 97,5 40 170 D N 2 98 South Ekoln 18 80 215 6375 0 800 M ES 2
99a South Ekoln 29 160 245 11160 0 500 M ES 2 99b South Ekoln 29 160 275 11160 0 500 M ES 2
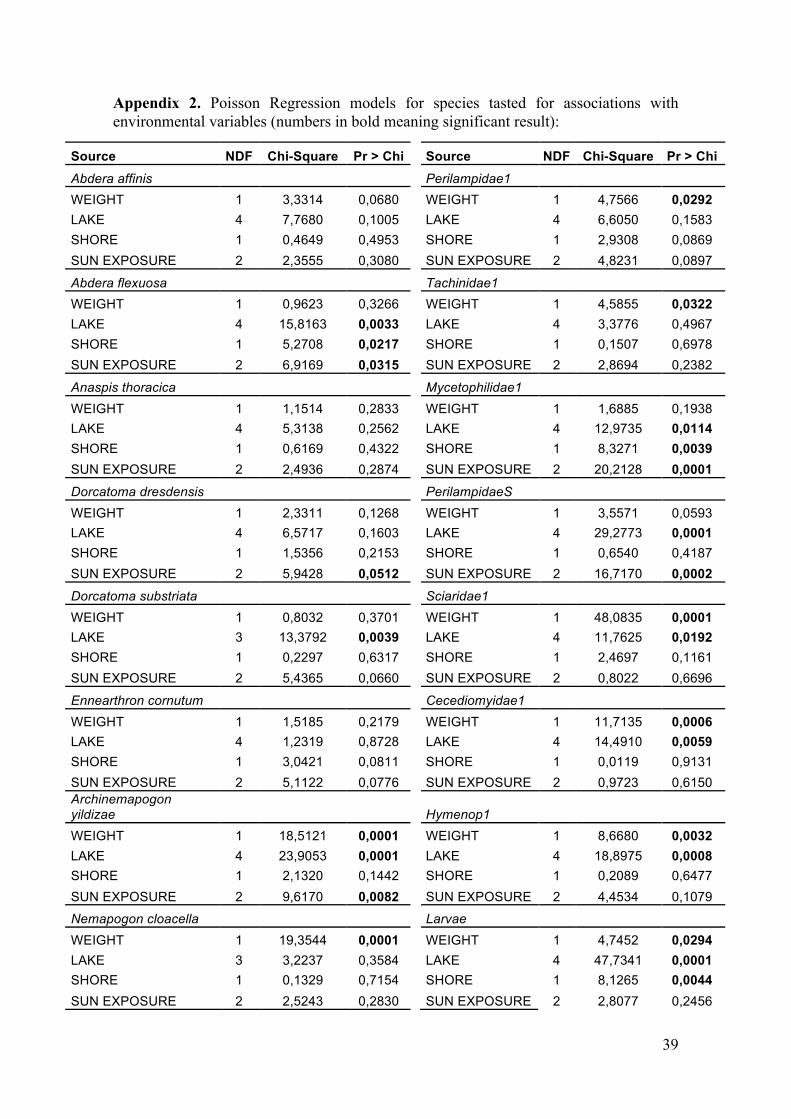
39
Appendix 2. Poisson Regression models for species tasted for associations with environmental variables (numbers in bold meaning significant result):
Source NDF Chi-Square Pr > Chi Source NDF Chi-Square Pr > Chi Abdera affinis Perilampidae1 WEIGHT 1 3,3314 0,0680 WEIGHT 1 4,7566 0,0292 LAKE 4 7,7680 0,1005 LAKE 4 6,6050 0,1583 SHORE 1 0,4649 0,4953 SHORE 1 2,9308 0,0869 SUN EXPOSURE 2 2,3555 0,3080 SUN EXPOSURE 2 4,8231 0,0897
Abdera flexuosa Tachinidae1 WEIGHT 1 0,9623 0,3266 WEIGHT 1 4,5855 0,0322 LAKE 4 15,8163 0,0033 LAKE 4 3,3776 0,4967 SHORE 1 5,2708 0,0217 SHORE 1 0,1507 0,6978 SUN EXPOSURE 2 6,9169 0,0315 SUN EXPOSURE 2 2,8694 0,2382
Anaspis thoracica Mycetophilidae1 WEIGHT 1 1,1514 0,2833 WEIGHT 1 1,6885 0,1938 LAKE 4 5,3138 0,2562 LAKE 4 12,9735 0,0114 SHORE 1 0,6169 0,4322 SHORE 1 8,3271 0,0039 SUN EXPOSURE 2 2,4936 0,2874 SUN EXPOSURE 2 20,2128 0,0001 Dorcatoma dresdensis PerilampidaeS WEIGHT 1 2,3311 0,1268 WEIGHT 1 3,5571 0,0593 LAKE 4 6,5717 0,1603 LAKE 4 29,2773 0,0001 SHORE 1 1,5356 0,2153 SHORE 1 0,6540 0,4187 SUN EXPOSURE 2 5,9428 0,0512 SUN EXPOSURE 2 16,7170 0,0002 Dorcatoma substriata Sciaridae1 WEIGHT 1 0,8032 0,3701 WEIGHT 1 48,0835 0,0001 LAKE 3 13,3792 0,0039 LAKE 4 11,7625 0,0192 SHORE 1 0,2297 0,6317 SHORE 1 2,4697 0,1161 SUN EXPOSURE 2 5,4365 0,0660 SUN EXPOSURE 2 0,8022 0,6696
Ennearthron cornutum Cecediomyidae1 WEIGHT 1 1,5185 0,2179 WEIGHT 1 11,7135 0,0006 LAKE 4 1,2319 0,8728 LAKE 4 14,4910 0,0059 SHORE 1 3,0421 0,0811 SHORE 1 0,0119 0,9131 SUN EXPOSURE 2 5,1122 0,0776 SUN EXPOSURE 2 0,9723 0,6150 Archinemapogon yildizae Hymenop1 WEIGHT 1 18,5121 0,0001 WEIGHT 1 8,6680 0,0032 LAKE 4 23,9053 0,0001 LAKE 4 18,8975 0,0008 SHORE 1 2,1320 0,1442 SHORE 1 0,2089 0,6477 SUN EXPOSURE 2 9,6170 0,0082 SUN EXPOSURE 2 4,4534 0,1079
Nemapogon cloacella Larvae WEIGHT 1 19,3544 0,0001 WEIGHT 1 4,7452 0,0294 LAKE 3 3,2237 0,3584 LAKE 4 47,7341 0,0001 SHORE 1 0,1329 0,7154 SHORE 1 8,1265 0,0044 SUN EXPOSURE 2 2,5243 0,2830 SUN EXPOSURE 2 2,8077 0,2456
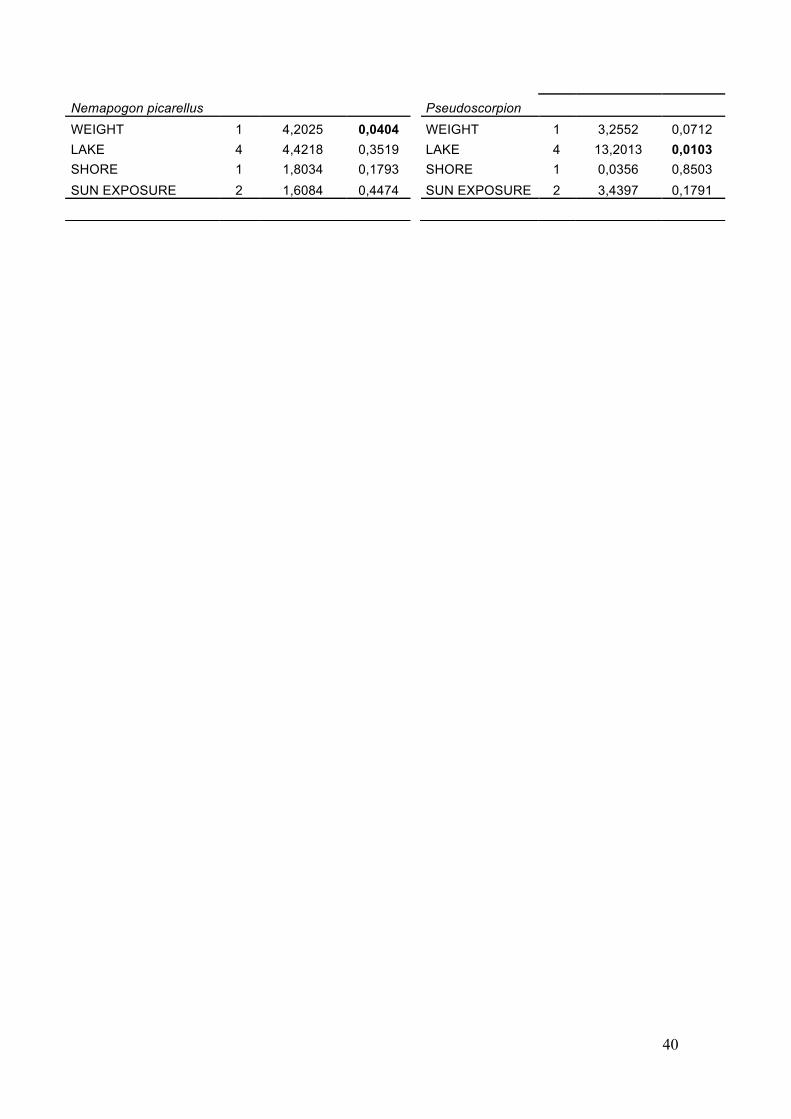
40
Nemapogon picarellus Pseudoscorpion WEIGHT 1 4,2025 0,0404 WEIGHT 1 3,2552 0,0712 LAKE 4 4,4218 0,3519 LAKE 4 13,2013 0,0103 SHORE 1 1,8034 0,1793 SHORE 1 0,0356 0,8503 SUN EXPOSURE 2 1,6084 0,4474 SUN EXPOSURE 2 3,4397 0,1791
41
Bibliography and references
- Bader P., Jansson S. and Jonsson B.G., 1995. Wood-inhabiting fungi and substratum decline in selectively logged boreal spruce forests. Biological Conservation 72: 355–362.
- Baranowski, R, 1985. Central and Northern European Dorcatoma (Coleoptera: Anobiidae). With a key and description of a new species. Entomologica Scandinavia 16:203-207.
- Berg, A, Ehnström, B., Gustafsson, L., Hallingbäck, T.. Jonsell, M., and
Weslien, J., 1994. Threatened plant, animal, and fungus species in Swedish forests: distribution and habitat associations. Conservation Biology 8: 718-731.
- Berg, A, Ehnström, B., Gustafsson, L., Hallingbäck, T. Jonsell, M. And Weslien, J., 1995. Threat Levels and Threats to Red-Listed Species in Swedish Forests. Conservation Biology 9: 1629-1633.
- Brunet, J. and Isacsson, G., 2008. Influence of snag characteristics on
saproxylic beetle assembalages in south Swedish beech forest. Springer Science+Business Media B.V. 2008.
- Buczacki, S. and Harris, K. 1998. Guide to pests, diseases and disorders of garden plants. Collins.
- Bütler Sauvain, R. 2003. Dead wood in managed forests: how much and how
much is enough? : development of a snag-quantification method by remote sensing & GIS and snag targets based on Three-toed woodpeckers' habitat requirements. Thèse EPFL, no 2761 (2003). Dir.: Rodolphe Schlaepfer.
- Cobos Suarez, J.M. 1988. Contribución al conocimiento de la fauna de L.)
Gaertner] y su control. Boletín de Sanidad Vegetal. Ministerio de Agricultura, Pesca y Alimentación. España. No. 14. 349pp.
- Ehnström, B., Gärdenfors, U. & Lindelöw, Å. 1993. Rödlistade evertebrater i
Sverige 1993. (Swedish Red-list of Invertebrates 1993). Databanken för hotade arter.
- Ehnström, B., 2003. Leaving Dead Wood for Insects in Boreal Forests - Suggestions for the Future. Scandinavian Journal of Forest Research 16: 91- 98.
- Eliasson, C.U., Ryrholm, N., Holmer, M., Jilg, K., Grädenfors, U., 2005.
Nationalnyckeln till Sveriges Flora och Fauna. Fjärilar: Dagfjärilar. Hesperiidae – Nymphalidae.
- Feinsinger, P. 1948. Designing field studies for biodiversity conservation.
The Nature Conservancy 2001. Island press.
42
- Germain, H.G., Laflamme, L., Bernier, L., Boulet, B. and Hamelin, R.C.,
2002. DNA polymorphism and molecular diagnosis in Inonotus spp. Can. J. Plant Pathol. 24:194-199.
- Gibb, H., Hilszczajski, J., Hjältén, J., Danell, K., Ball, J.P., Pettersson, R.B.
and Alinvi, O. 2007. Responses of parasitoids to saproxylic hosts and habitat: a multi-scale study using experimental logs. Oecologia 155: 63-74.
- Gilberston, R.L. 1969. A new species of Inonotus on Southwestern
sycamores. The southwestern naturalist 14: 123-125.
- Gilbertson R.L., Ryvarden L. 1986. North American Polypores. Vol. I. Fungiflora, Oslo.
- Gilbertson R.L., Ryvarden L. 1987. North American Polypores. Vol. II.
Fungiflora, Oslo.
- Gotelli, N. J. & Colwell, R. K. 2001. Quantifying biodiversity: procedures and pitfalls in the measurement and comparison of species richness. Ecology Letters 4: 379-391.
- Gottlieb A. M, Wright J. E. and Moncalvo J-M. 2002. Inonotus s. l. in
Argentina – morphology, cultural characters and molecular analyses. Mycological Progress 1: 299-313.
- Grand, L.F. and Vernia, C.S., 2005 - Biogeography and hosts of poroid wood
decay fungi in North Carolina: species of Coltricia, Coltriciella and Inonotus. Department of Plant Pathology, North Carolina State University, Raleigh, North Carolina
- Graves, R.C. 1960. Ecological observations on the insects and other inhabitants of woody shelf fungi (Basidiomycetes: Polyporaceae) in the Chicago area. Annals of the Entomological Society of America.
- Grove, S.J. 2002. Saproxylic insect ecology and the sustainable management
of forests. Annual Reviews Ecol. Syst. 33: 1-23. - Gärdenfors, U. 2000. Rödlistade arter i Sverige 2000. The 2000 Red List of
Swedish species. ArtDatabanken, SLU, Uppsala.
- Gärdenfors, U. 2005. Rödlistade arter i Sverige 2005. ArtDatabanken, SLU, Uppsala.
- Hansen, V. 1964. Fortegnelse over Danmarks biller 1. og 2. del. (Catalogue of the Coleoptera of Denmark 1 and 2nd part). Entomologiske Meddelelser 33: 1-507.
- Harmon, M.E., Franklin, J.F., Swanson, F.J., Sollins, P., Gregory, S.V.,
Lattin, J.D., Anderson, N.H., Cline, S.P., Aumen, N.G., Sedell, J.R.,
43
Lienkaemper, G. W., Cromack, K., Cummins, K. W. and JR. 1986. Ecology of coarse woody debris in temperate ecosystems. Advances in Ecological research. Vol. 15.
- Intini, M. and Tello, M. L. 2003. Comunicación Investigaciones sobre
hongos xilófagos de árboles urbanos en Europa: primera cita de Inonotus rickii (Pat.) Reid en España. Bol. San. Veg. Plagas, 29: 277-279.
- Johansson, T. 1999. Site Index Curves for Common Alder and Grey Alder
Growing on Different Types of Forest Soil in Sweden. Scandinavian Journal of Forest Research 14: 441- 453.
- Jonsell, M., Nordlander, G. & Ehnström, B. 2001. Substrate associations of
insects breeding in fruiting bodies of wood-decaying fungi. Ecological Bulletins 49: 173-194.
- Jonsell, M. & Nordlander, G. 1999. Insects in polypore fungi as indicator
species: a comparison between forest sites differing in amounts and continuity of dead wood. Forest Ecology and Management 157: 101-118.
- Jonsell, M. & Nordlander, G. 2004. Host selection patterns in insects
breeding in bracket fungi. Ecological Entomology 29: 697-705.
- Jonsell, M., Weslien, J. and Ehnström, B. 1998. Substrate requirements of red-listed saproxylic invertebrates in Sweden. Biodiversity and Conservation 7: 749-764.
- Jonson, B.G. and Jonsell, M. 1999. Exploring potential biodiversity
indicators in boreal forests. Biodiversity and Conservation 8: 1417–1433.
- Jonsson, M. & Nordlander, G., 2006. Insect colonization of fruiting bodies of the wood-decaying fungus Fomitopsis pinicola at different distances from an old-growth forest. Biodiversity and Conservation 15: 295-309.
- Kajba, D. and Gračan, J. 2003. Technical Guidelines for genetic
conservation and use for black alder (Alnus glutinosa). EUFORGEN International Plant Genetic Resources Institute, Rome, Italy. 4 pages.
- Klimaszewski, J. and Peck S.B. 1987. Succession and phenology of beetle faunas (Coleoptera) in the fungus Polyporellus squamosus (Huds.: Fr.) Karst. (Polyporaceae) in Silesia, Poland. Canadian Journal of Zoology 65: 542–550
- Koch, K. 1989-1992. Die Käfer Mitteleuropas. Ökologie. Band 1-3. Goecke & Evers, Krefeld.
- Kouki, J., Löfman S., Martikainen, P., Rouvinen, S. and Uotila, A., 2001. Forest Fragmentation in Fennoscandia: Linking Habitat Requirements of Wood-associated Threatened Species to Landscape and Habitat Changes. Scandinavian Journal of Forest Research 16: 27 – 37.
44
- Komonen, A. 2003. Hostspots of insect diversity in boreal forests.
Conservation biology 17: 976-981.
- Komonen, A., 2006. Local spatial pattern of two specialist beetles species (Ciidae) in the fruiting bodies of Fomitopsis pinicola. Ecoscience 13:272–377.
- Komonen, A. 2009. Riparian forest characteristics and their variation along
the lakeshore-upland ecotone. Scandinavian Journal of Forest Research. - Komonen, A. & Kouki, J. 2005. Occurrence and abundance of fungus-
dwelling beetles (Ciidae) in boreal forests and clearcuts: habitat associations at two spatial scales. Animal biodiversity and Conservation.
- Komonen, A., Niemi, M. E. & Junninen, K. 2008. Lakeside riparian forests
support diversity of wood fungi in managed boreal forests. Canadian Journal of Forest Research, 38: 2650-2659.
- Larsson, T.-B. 2001. Biodiversity evaluation tools for European forests.
Ecological Bulletins, 50.
- Legon, N.W. & Henrici, A. with Roberts, P.J., Spooner, B.M. & Watling, R., 2005. Checklist of the British and Irish Basidiomycota. Royal Botanic Gardens, Kew.
- Lindhe, A., Lindelöw. A., Åsenblad, N. 2005. Saproxylic beetles in standing
dead wood density in relation to substrate sun-exposure and diameter. Biodiversity and Conservation 14: 3033-3053.
- Magurran, A.E. 2004. Measuring biological diversity. Blackwell Science
Ltd - Midtgaard, F., Rukke, B.A. and Sverdrup-Thygeson, A. 1998. Habitat use of
the fungivorous beetle Bolithophagus reticulatus (Coleoptera: Tenebrionidae): Effects of basidiocarp size, humidity and competitors. European Journal of Entomology 95: 559-570.
- Muñoz, M. C., Cobos, J. M. 1986. Exudaciones gomosas en alisos (Alnus
glutinosa (L.) Gaertner asociadas con la presencia de hongos vasculares. Bol. San. Veg. Plagas, 12:167-179.
- Naiman, R.J. and Décamps H. 1990. The Ecology and Management of Aquatic-Terrestrial Ecotones. Man and the biosphere series.
- Neuman, J.J., 1914. The Polyporaceae of Wisconsin. Madison, Wis., The
State
- Olsson, J., 2008. Colonization patterns of wood-inhabiting fungi in boreal forest. PhDthesis, Umeå University
45
- Økland, B., Bakke A., Hagvar, S. and Kvamme, T., 1995. What factors
influence the diversity of saproxylic beetles? A multiscaled study from a spruce forest in southern Norway. Biodiversity and Conservation 5: 75-100.
- Palm, T. 1959. Die Holz- und Rindenkäfer der süd- und mittelschwedischen
Laubbäume. Opuscula Entomologica Supplementum 16: 1-374.
- Paviour-Smith, K. 1965. Some Factors Affecting Numbers of the Fungus Beetle Tetratoma fungorum F. Journal of Animal Ecology 34: 699-724.
- Quinn, G.P. & Keough, M.J. 2002. Experimental design and data analysis for biologists. Cambridge University Press.
- Ramos, A.P., Caetano, M. F. and Melo, I. 2007. Inonotus rickii (Pat.) Reid:
an important legnicolous basidiomycete in urban trees. Revista de Ciencias Agrarias. 5ºCongreso de la Sociedad Portuguesa de Fitopatología, Coimbra 2007.
- Ranius, T. and Jansson, N., 2000. The influence of forest regrowth, original
canopy cover and tree size on saproxylic beetles associated with old oaks. Biological Conservation 95: 85–94.
- Risser P.G. 1995. The Status of the Science Examining Ecotones BioScience
45: 318-325.
- Rukke, B.A., 2002. Fungivorous beetles in basidiocarps of Fomes fomentarius respond differently to microhabitat variables. European J. Entomology 99: 43-52.
- Schiemer, F. and Zalewski, M., 1992. The importance of riparian ecotones
for diversity and productivity of riverine fish communities. Netherlands Journal of Zoology 42: 323-335.
- Schigel, D.S., 2009. Polypore assemblages in boreal old-growth forests, and associated Coleoptera. Botanical Museum, Finnish Museum of Natural History and University of Helsinki, Finland, 2009.
- Stenbacka, F., 2009. Response of saproxylic insect communities to forestry: implications for conservation Doctoral Thesis - Faculty of Forest Sciences, Swedish University of Agricultural, Umeå
- Ševčík, J., 2006. Diptera associated with fungi in the Czech and Slovak Republics. Čas. Slez. Muz. Opava (A), 55, suppl.2: 1-84.
- Thunes, K.H 1994. The coleopteran fauna of Piptoporus betulnus and Fomes
fomentarius (Aphyllophorales: Polyporaceae) in western Norway. Entomologica Fennica.
46
- Thunes, K.H, Midtgaard, F., Gjerde, I., 2000. Diversity of the Coleoptera of the bracket fungus Fomitopsis pinicola in a Norwegian spruce forest- Biodiversity and Conservation, 9: 833–852.
- Wagner, T. and Fischer, M. 2002. Proceedings towards a natural
classification of the worldwide taxa Phellinus s.l. and Inonotus s.l., and phylogenetic relationships of allied genera. Mycological Society of America, Lawrence. Mycologia 94: 998-1016
Internet sources:
- ArtDatabanken 2009 - Swedish Species Information Centre. Official Swedish Red Lists www.artdata.slu.se/english/redlist.asp
- Borowiec, L. 2009. Iconographia Coleopterorum Poloniae (Chrząszcze Polski) http://www.colpolon.biol.uni.wroc.pl
- Colwell, R. K. 2006. EstimateS: Statistical estimation of species and shared species from samples. Version 8.0.0. http://viceroy.eeb.uconn.edu/EstimateS.
- Ecoplexity – Teaching ecological complexity, 2009. Community analyses;
rank-abundant plots. http://ecoplexity.org/community_analysis
- Encora - Coastal portal, 2009. Measurements of biodiversity
http://www.coastalwiki.org/coastalwiki/Measurements_of_biodiversity
- IUCN, 2010. IUCN Red List of Threatened Species, Version 2010.1. http://www.iucnredlist.org/
- IUCN, 2001. IUCN Red List Categories and Criteria version 3.1. http://www.iucnredlist.org/technical-documents/categories-and-criteria/2001-categories-criteria#categories
- The beetle fauna of Germany by Christopf Benisch, 2007-2010.
http://www.kerbtier.de/cgi-bin/enFeature.cgi
- The insects of Cedar Creek, 2002. http://cedarcreek.umn.edu/insects/index.html
- WWF Report, October 2004. Deadwood – Living forests.
http://assets.panda.org/downloads/deadwoodwithnotes.pdf


![Den svenska prepositionen - Öppna sidor [GUL] · PDF fileInstitutionen för slaviska språk Den svenska prepositionen ovanpå och dess ryska motsvarigheter Ryska Specialarbete C (RY](https://img.dokumen.tips/doc/110x75/5a86a0417f8b9ad30c8d3adb/den-svenska-prepositionen-ppna-sidor-gul-fr-slaviska-sprk-den-svenska-prepositionen.jpg)