Embed Size (px)
Citation preview

Intro Stats 2 Final Exam Review Name__________________________________ _
MULTIPLE CHOICE. Choose the one alternative that best completes the statement or answers the question.
Find the margin of error for the given confidence interval.
1) In a survey of 7200 T.V. viewers, 40% said they watch network news programs. Find the margin of
error for this survey if we want 95% confidence in our estimate of the percent of T.V. viewers who
watch network news programs.
A) 0.4% B) 1.30% C) 1.48% D) 1.15% E) 0.848%
1)
2) In a survey of 280 adults over 50, 80% said they were taking vitamin supplements. Find the margin
of error for this survey if we want a 99.7% confidence in our estimate of the percent of adults over
50 who take vitamin supplements.
A) 10.5% B) 4.69% C) 13.8% D) 7.17% E) 17.2%
2)
Use the given degree of confidence and sample data to construct a confidence interval for the population proportion.
3) A survey of 865 voters in one state reveals that 408 favor approval of an issue before the
legislature. Construct a 95% confidence interval for the percentage of all voters in the state who
favor approval.
A) (46.9%, 47.5%)
B) (42.3%, 52.0%)
C) (43.6%, 50.4%)
D) (44.4%, 50.0%)
E) (43.1%, 51.2%)
3)
4) Of 362 randomly selected medical students, 29 said that they planned to work in a rural
community. Construct a 99.7% confidence interval for the percentage of all medical students who
plan to work in a rural community.
A) (4.34%, 11.7%)
B) (3.7%, 12.2%)
C) (4.69%, 11.3%)
D) (7.00%, 9.02%)
E) (5.66%, 10.4%)
4)
Provide an appropriate response.
5) In a survey of 1,000 television viewers, 40% said they watch network news programs. For a 90%
confidence level, the margin of error for this estimate is 2.5%. If we want to be 95% confident,
how will the margin of error change?
A) Since more confidence requires a wider interval, the margin of error will be larger.
B) Since more confidence requires a wider interval, the margin of error will be smaller.
C) Since more confidence requires a more narrow interval, the margin of error will be smaller.
D) Since more confidence requires a more narrow interval, the margin of error will be larger.
E) There is not enough information to determine the effect on the margin of error.
5)
1
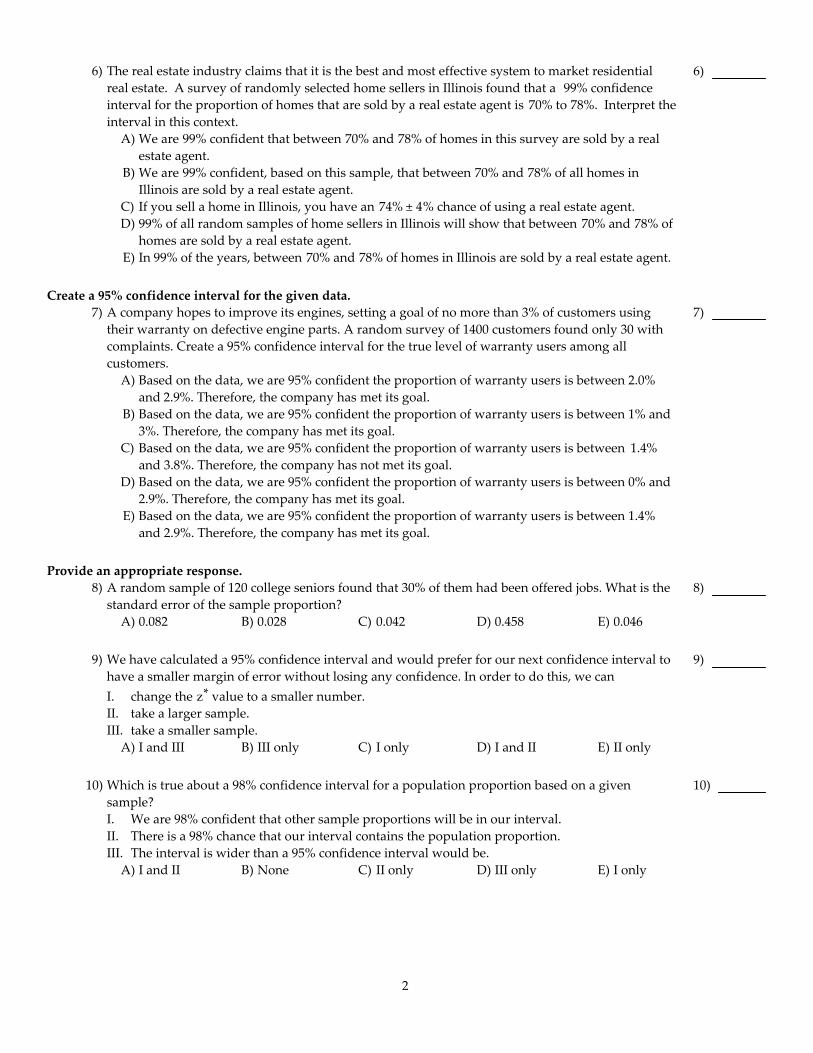
6) The real estate industry claims that it is the best and most effective system to market residential
real estate. A survey of randomly selected home sellers in Illinois found that a 99% confidence
interval for the proportion of homes that are sold by a real estate agent is 70% to 78%. Interpret the
interval in this context.
A) We are 99% confident that between 70% and 78% of homes in this survey are sold by a real
estate agent.
B) We are 99% confident, based on this sample, that between 70% and 78% of all homes in
Illinois are sold by a real estate agent.
C) If you sell a home in Illinois, you have an 74% ± 4% chance of using a real estate agent.
D) 99% of all random samples of home sellers in Illinois will show that between 70% and 78% of
homes are sold by a real estate agent.
E) In 99% of the years, between 70% and 78% of homes in Illinois are sold by a real estate agent.
6)
Create a 95% confidence interval for the given data.
7) A company hopes to improve its engines, setting a goal of no more than 3% of customers using
their warranty on defective engine parts. A random survey of 1400 customers found only 30 with
complaints. Create a 95% confidence interval for the true level of warranty users among all
customers.
A) Based on the data, we are 95% confident the proportion of warranty users is between 2.0%
and 2.9%. Therefore, the company has met its goal.
B) Based on the data, we are 95% confident the proportion of warranty users is between 1% and
3%. Therefore, the company has met its goal.
C) Based on the data, we are 95% confident the proportion of warranty users is between 1.4%
and 3.8%. Therefore, the company has not met its goal.
D) Based on the data, we are 95% confident the proportion of warranty users is between 0% and
2.9%. Therefore, the company has met its goal.
E) Based on the data, we are 95% confident the proportion of warranty users is between 1.4%
and 2.9%. Therefore, the company has met its goal.
7)
Provide an appropriate response.
8) A random sample of 120 college seniors found that 30% of them had been offered jobs. What is the
standard error of the sample proportion?
A) 0.082 B) 0.028 C) 0.042 D) 0.458 E) 0.046
8)
9) We have calculated a 95% confidence interval and would prefer for our next confidence interval to
have a smaller margin of error without losing any confidence. In order to do this, we can
I. change the z* value to a smaller number.
II. take a larger sample.
III. take a smaller sample.
A) I and III B) III only C) I only D) I and II E) II only
9)
10) Which is true about a 98% confidence interval for a population proportion based on a given
sample?
I. We are 98% confident that other sample proportions will be in our interval.
II. There is a 98% chance that our interval contains the population proportion.
III. The interval is wider than a 95% confidence interval would be.
A) I and II B) None C) II only D) III only E) I only
10)
2
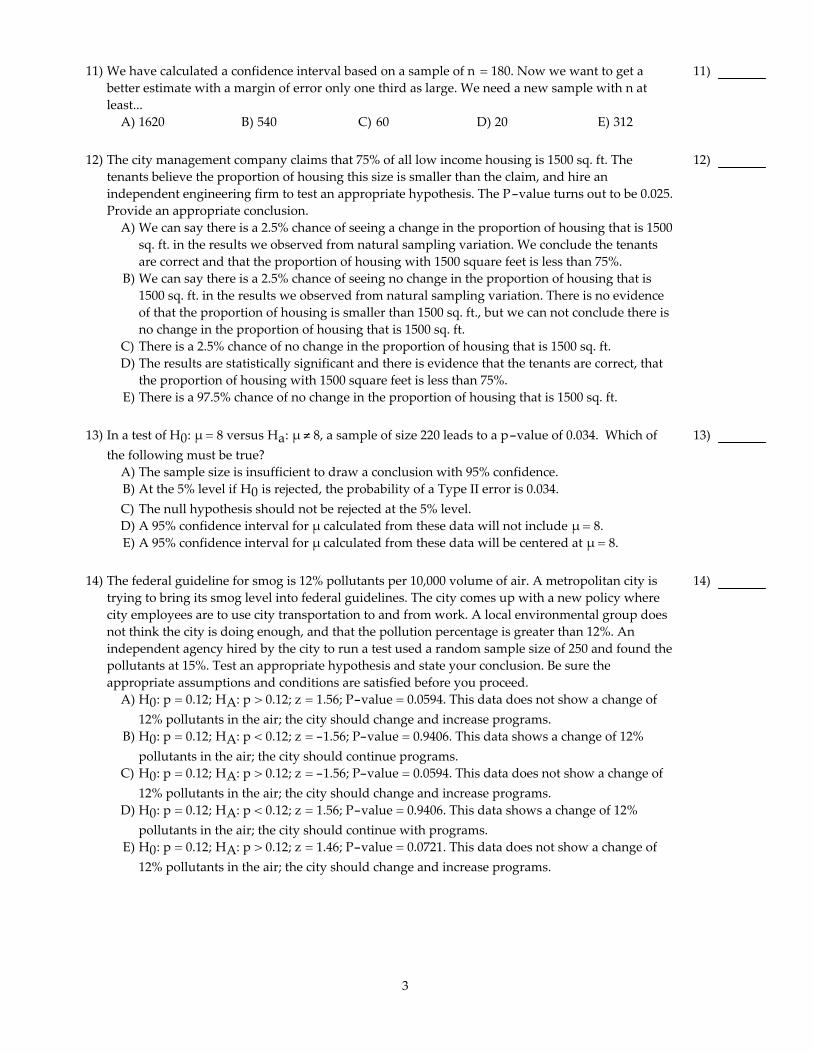
11) We have calculated a confidence interval based on a sample of n = 180. Now we want to get a
better estimate with a margin of error only one third as large. We need a new sample with n at
least...
A) 1620 B) 540 C) 60 D) 20 E) 312
11)
12) The city management company claims that 75% of all low income housing is 1500 sq. ft. The
tenants believe the proportion of housing this size is smaller than the claim, and hire an
independent engineering firm to test an appropriate hypothesis. The P-value turns out to be 0.025.
Provide an appropriate conclusion.
A) We can say there is a 2.5% chance of seeing a change in the proportion of housing that is 1500
sq. ft. in the results we observed from natural sampling variation. We conclude the tenants
are correct and that the proportion of housing with 1500 square feet is less than 75%.
B) We can say there is a 2.5% chance of seeing no change in the proportion of housing that is
1500 sq. ft. in the results we observed from natural sampling variation. There is no evidence
of that the proportion of housing is smaller than 1500 sq. ft., but we can not conclude there is
no change in the proportion of housing that is 1500 sq. ft.
C) There is a 2.5% chance of no change in the proportion of housing that is 1500 sq. ft.
D) The results are statistically significant and there is evidence that the tenants are correct, that
the proportion of housing with 1500 square feet is less than 75%.
E) There is a 97.5% chance of no change in the proportion of housing that is 1500 sq. ft.
12)
13) In a test of H0: μ = 8 versus Ha: μ ≠ 8, a sample of size 220 leads to a p-value of 0.034. Which of
the following must be true?
A) The sample size is insufficient to draw a conclusion with 95% confidence.
B) At the 5% level if H0 is rejected, the probability of a Type II error is 0.034.
C) The null hypothesis should not be rejected at the 5% level.
D) A 95% confidence interval for μ calculated from these data will not include μ = 8.
E) A 95% confidence interval for μ calculated from these data will be centered at μ = 8.
13)
14) The federal guideline for smog is 12% pollutants per 10,000 volume of air. A metropolitan city is
trying to bring its smog level into federal guidelines. The city comes up with a new policy where
city employees are to use city transportation to and from work. A local environmental group does
not think the city is doing enough, and that the pollution percentage is greater than 12%. An
independent agency hired by the city to run a test used a random sample size of 250 and found the
pollutants at 15%. Test an appropriate hypothesis and state your conclusion. Be sure the
appropriate assumptions and conditions are satisfied before you proceed.
A) H0: p = 0.12; HA: p > 0.12; z = 1.56; P-value = 0.0594. This data does not show a change of
12% pollutants in the air; the city should change and increase programs.
B) H0: p = 0.12; HA: p < 0.12; z = -1.56; P-value = 0.9406. This data shows a change of 12%
pollutants in the air; the city should continue programs.
C) H0: p = 0.12; HA: p > 0.12; z = -1.56; P-value = 0.0594. This data does not show a change of
12% pollutants in the air; the city should change and increase programs.
D) H0: p = 0.12; HA: p < 0.12; z = 1.56; P-value = 0.9406. This data shows a change of 12%
pollutants in the air; the city should continue with programs.
E) H0: p = 0.12; HA: p > 0.12; z = 1.46; P-value = 0.0721. This data does not show a change of
12% pollutants in the air; the city should change and increase programs.
14)
3

15) A P-value indicates
A) the probability of observing a sample value as far or farther from the hypothesized value,
when the null hypothesis is true.
B) the probability of the observed statistic given that the alternative hypothesis is true.
C) the probability that the alternative hypothesis is true.
D) the probability that the null hypothesis is true.
E) the probability the null is true given the observed statistic.
15)
16) A statistics professor wants to see if more than 80% of her students enjoyed taking her class. At the
end of the term, she takes a random sample of students from her large class and asks, in an
anonymous survey, if the students enjoyed taking her class. Which set of hypotheses should she
test?
A) H0: p < 0.80
HA: p ≠ 0.80
B) H0: p < 0.80
HA: p > 0.80
C) H0: p = 0.80
HA: p > 0.80
D) H0: p = 0.80
HA: p < 0.80
E) H0: p > 0.80
HA: p = 0.80
16)
Explain what the P-value means in the given context.
17) A state university wants to increase its retention rate of 4% for graduating students from the
previous year. After implementing several new programs during the last two years, the university
reevaluates its retention rate and comes up with a P -value of 0.075. What is reasonable to
conclude about the new programs ?
A) There is a 7.5% chance of the new programs having no effect on retention.
B) There is a 92.5% chance of the new programs having no effect on retention.
C) There is some evidence the new programs are more effective, but not enough to conclude the
new programs have no effect on retention.
D) We can say there is a 7.5% chance of seeing the new programs having an effect on retention
in the results we observed from natural sampling variation. We conclude the new programs
are more effective.
E) Thereʹs only a 7.5% chance of seeing the new programs having no effect on retention in the
results we observed from natural sampling variation. We conclude the new programs are
more effective.
17)
4

18) After a political ad campaign for a cityʹs mayor, pollsters check the disapproval ratings. They test
the hypothesis that the ads produced no change against the alternative that the ratings are now
below 13%, and find a P-value of 0.11. Provide an appropriate conclusion.
A) There is an 89% chance the ads produced no change in ratings.
B) We can say there is an 11% chance of seeing the ads produce a ratings change in the results
we observed from natural sampling variation. We conclude the disapproval ratings are
lower.
C) There is an 11% chance the ads produced no change in ratings.
D) Thereʹs only an 11% chance of seeing the ads produce no ratings change in the results we
observed from natural sampling variation. We conclude the disapproval ratings are lower.
E) There is little evidence the disapproval ratings are lower, but not enought to conclude the
ratings remained the same.
18)
Provide an appropriate response.
19) An entomologist writes an article in a scientific journal which claims that fewer than 12% of male
fireflies are unable to produce light due to a genetic mutation. Identify the Type I error in this
context.
A) The error of failing to reject the claim that the true proportion is at least 12% when it is
actually less than 12%.
B) The error of failing to accept the claim that the true proportion is at least 12% when it is
actually less than 12%.
C) The error of rejecting the claim that the true proportion is less than 12% when it really is less
than 12%.
D) The error of accepting the claim that the true proportion is at least 12% when it really is at
least 12%.
E) The error of rejecting the claim that the true proportion is at least 12% when it really is at
least 12%.
19)
20) A skeptical paranormal researcher claims that the proportion of Americans that have seen a UFO,
p, is less than 5%. Identify the Type II error in this context.
A) The error of accepting the claim that the true proportion is at least 5% when it really is at
least 5%.
B) The error of rejecting the claim that the true proportion is at least 5% when it really is at least
5%.
C) The error of failing to reject the claim that the true proportion is at least 5% when it is
actually less than 5%.
D) The error of accepting the claim that the true proportion is at least 5% when it is actually less
than 5%.
E) The error of rejecting the claim that the true proportion is less than 5% when it really is less
than 5%.
20)
21) Suppose that a conveyor used to sort packages by size does not work properly. We test the
conveyor on several packages (with Ho: incorrect sort) and our data results in a P-value of 0.016.
What probably happens as a result of our testing?
A) We reject H0, making a Type II error.
B) We correctly fail to reject H0.
C) We reject H0, making a Type I error.
D) We fail to reject H0, committing a Type II error.
E) We correctly reject H0.
21)
5

SHORT ANSWER. Write the word or phrase that best completes each statement or answers the question.
22) On many highways state police officers conduct inspections of driving logbooks from
large trucks to see if the trucker has driven too many hours in a day. At one truck
inspection station they issued citations to 49 of 348 truckers that they reviewed. Based on
the results of this inspection station, construct and interpret a 95% confidence interval for
the proportion of truck drivers that have driven too many hours in a day, and explain the
meaning of ʺ95% confidence.ʺ
22)
23) A company has surveyed a sample of its employees to find out how many might take
advantage of a weight loss program. The table below shows the results. For which of the
groups could we use our methods of inference to determine a 95% confidence interval for
the proportion of employees who would be willing to participate in the program?
Group
Number of
Employees
Number
Surveyed
Percent to
Participate
Building A 5200 250 8%
Building B 1190 150 7%
Building C 248 20 9%
23)
24) A newspaper article reported that a poll based on a sample of 800 voters showed the
Presidentʹs job approval rating stood at 62%. They claimed a margin of error of
± 3%. What level of confidence were the pollsters using?
24)
25) Do more than 50% of U.S. adults feel they get enough sleep? According to Gallupʹs
December 2004 Lifestyle poll, 55% of U.S. adults said that that they get enough sleep. The
poll was based on a random sample of 1003 U.S. adults. Test an appropriate hypothesis
and state your conclusion in the context of the problem.
25)
26) A recent psychiatric study from the University of Southampton observed a higher
incidence of depression among women whose birth weight was less than 6.6 pounds than
in women whose birth weight was over 6.6 pounds. Based on a P-value of 0.0248 the
researchers concluded there was evidence that low birth weights may be a risk factor for
susceptibility to depression. Explain in context what the reported P-value means.
26)
27) A recent medical study observed a higher frequency of heart attacks among a group of
bald men than among another group of men who were not bald. Based on a P -value of
0.062 the researchers concluded there was some evidence that male baldness may be a risk
factor for predicting heart attacks. Explain in this context what their P-value means.
27)
MULTIPLE CHOICE. Choose the one alternative that best completes the statement or answers the question.
Using the t-tables, software, or a calculator, estimate the critical value of t for the given confidence interval and degrees
of freedom.
28) 90% confidence interval with df = 4.
A) 2.353 B) 2.132 C) 1.645 D) 4.604 E) 1.533
28)
29) 95% confidence interval with df = 15
A) 1.960 B) 2.145 C) 1.753 D) 2.131 E) 2.120
29)
6

30) 99% confidence interval with df = 24
A) 2.492 B) 2.797 C) 2.779 D) 2.807 E) 1.711
30)
Use the t-tables, software, or a calculator to estimate the indicated P-value.
31) P-value for t ≥ 1.44 with 45 degrees of freedom
A) 0.9215 B) 0.1569 C) 0.9085 D) 0.0784 E) 0.0915
31)
32) P-value for t > 1.44 with 45 degrees of freedom. This is a two-tail test.
A) 0.0785 B) 0.1916 C) 0.9215 D) 0.0808 E) 0.1568
32)
Provide an appropriate response.
33) How much fat do reduced fat cookies typically have? You take a random sample of 50 reduced -fat
cookies and test them in a lab, finding a mean fat content of 3.2 grams and a standard deviation of
1.1 grams of fat. Have the conditions and assumptions for inference been met?
A) No, it is not a random sample.
B) No, we have sampled more than 10% of the population.
C) No, the sample is not big enough to satisfy the nearly normal condition.
D) No, the sample is not likely to be representative.
E) Yes, all conditions and assumptions are reasonably assumed to be met.
33)
34) How tall is your average statistics classmate? To determine this, you measure the height of a
random sample of 15 of your 100 fellow students, finding a mean height of 68 inches and a
standard deviation of 2.3 inches. Have the conditions and assumptions for inference been met?
A) Yes, all conditions and assumptions have been met.
B) No, the sample wasnʹt random.
C) No, the population is not likely to be Normal.
D) No, the sample is more than 10% of the population.
E) No, the sample is not representative.
34)
35) A researcher wants to estimate the mean cholesterol level of people in his city. He sets up a
walk-in clinic, and measures the cholesterol of 85 people, finding a mean level of 224 and a
standard deviation of 8. Have the conditions and assumptions for inference been met?
A) No, the sample is not random.
B) No, the sample is more than 10% of the population.
C) Yes, all conditions and assumptions have been met.
D) No, the the sample data is likely to be skewed.
E) No, the sample does not meet the Nearly Normal condition.
35)
Interpret the confidence interval.
36) Data collected by child development scientists produced the following 90% confidence interval for
the average age (in months) at which children say their first word: 10.1 < μ(age) < 13.7.
A) Based on this sample, we can say, with 90% confidence, that the mean age at which children
say their first word is between 10.1 and 13.7 months.
B) If we took many random samples of children, about 90% of them would produce this
confidence interval.
C) 90% of the children in this sample said their first word when they were between 10.1 and 13.7
months old.
D) We are 90% sure that the average age at which children in this sample said their first word
was between 10.1 and 13.7 months.
E) We are 90% sure that a child will say his first word when he is between 10.1 and 13.7 months
old.
36)
7

37) A credit union took a random sample of 40 accounts and obtained the following 90% confidence
interval for the mean checking account balance at the institution: $2199 < μ(balance) < $3820.
A) We are 90% sure that the mean balance for checking accounts in the sample was between
$2199 and $3820.
B) We are 90% confident that the mean checking account balance at this credit union is between
$2199 and $3820, based on this sample.
C) If we took random samples of checking accounts at this credit union, about nine out of ten of
them would produce this confidence interval.
D) About 9 out of 10 people have a checking account balance between $2199 and $3820.
E) We are 90% confident that the mean checking account balance in the U.S. is between $2199
and $3820.
37)
38) You want to estimate the average gas price in your city for a gallon of regular gas. From your
sample of 15 gas stations, you calculate a 95% confidence interval of ($1.98, $2.16)
A) You are 95% confident that the average price for a gallon of gas in the country is within $0.09
of $2.07.
B) If you took many samples of gas stations in your city, about 95% of them would produce this
confidence interval.
C) 95% of all samples of gas stations will have average costs between $1.98 and $2.16.
D) You are 95% sure that gas stations in this sample have average costs between $1.98 and $2.16.
E) You are 95% sure that the average price for a gallon of gas in your city is between $1.98 and
$2.16.
38)
Use the given sample data to construct the indicated confidence interval for the population mean.
39) n = 10, x = 13.7, s = 4.4
Find a 95% confidence interval for the mean.
A) (10.60, 16.80)
B) (10.60, 16.83)
C) (11.15, 16.25)
D) (10.57, 16.83)
E) (10.55, 16.85)
39)
40) n = 30, x = 92.4, s = 7.4
Find a 90% confidence interval for the mean.
A) (90.10, 94.70)
B) (88.68, 96.12)
C) (90.12, 94.68)
D) (88.68, 94.68)
E) (89.64, 95.16)
40)
Use the given sample data to construct the indicated confidence interval for the population mean.
41) The principal randomly selected six students to take an aptitude test. Their scores were:
75.2 87.7 70.5 77.1 82.1 72.9
Determine a 90% confidence interval for the mean score for all students.
A) (82.80, 82.80)
B) (82.80, 72.37)
C) (72.37, 82.80)
D) (82.90, 72.27)
E) (72.27, 82.90)
41)
8
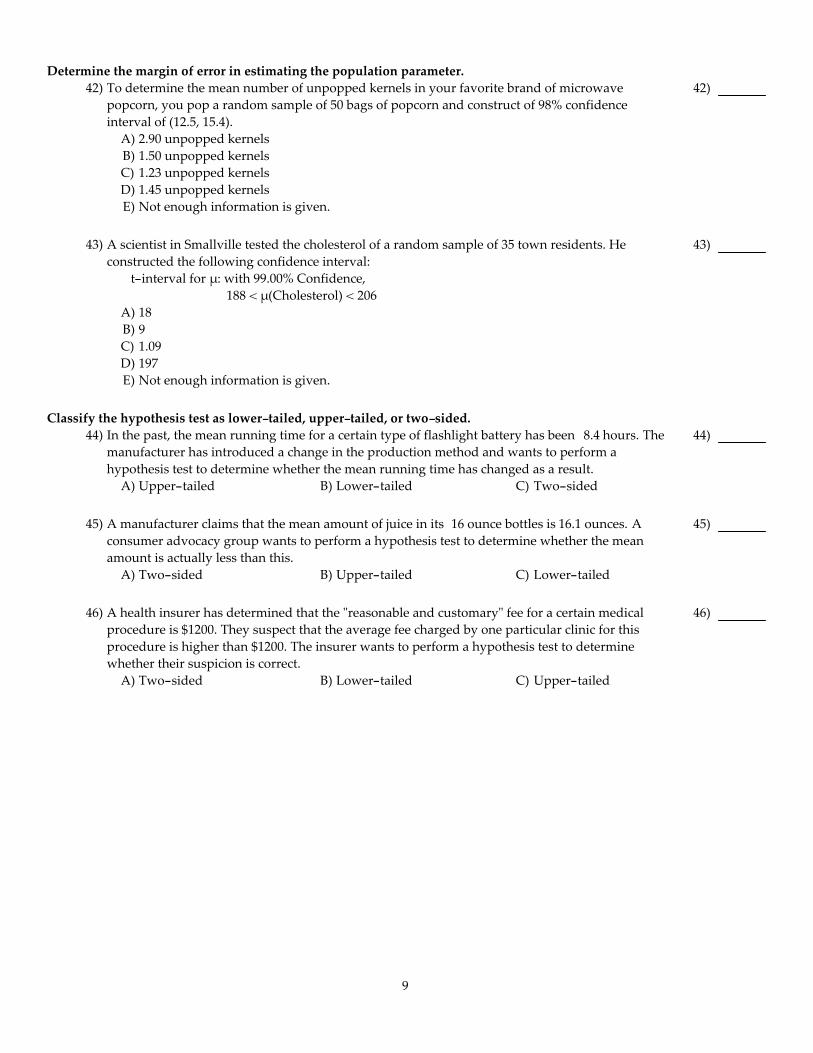
Determine the margin of error in estimating the population parameter.
42) To determine the mean number of unpopped kernels in your favorite brand of microwave
popcorn, you pop a random sample of 50 bags of popcorn and construct of 98% confidence
interval of (12.5, 15.4).
A) 2.90 unpopped kernels
B) 1.50 unpopped kernels
C) 1.23 unpopped kernels
D) 1.45 unpopped kernels
E) Not enough information is given.
42)
43) A scientist in Smallville tested the cholesterol of a random sample of 35 town residents. He
constructed the following confidence interval:
t-interval for μ: with 99.00% Confidence,
188 < μ(Cholesterol) < 206
A) 18
B) 9
C) 1.09
D) 197
E) Not enough information is given.
43)
Classify the hypothesis test as lower-tailed, upper-tailed, or two-sided.
44) In the past, the mean running time for a certain type of flashlight battery has been 8.4 hours. The
manufacturer has introduced a change in the production method and wants to perform a
hypothesis test to determine whether the mean running time has changed as a result.
A) Upper-tailed B) Lower-tailed C) Two-sided
44)
45) A manufacturer claims that the mean amount of juice in its 16 ounce bottles is 16.1 ounces. A
consumer advocacy group wants to perform a hypothesis test to determine whether the mean
amount is actually less than this.
A) Two-sided B) Upper-tailed C) Lower-tailed
45)
46) A health insurer has determined that the ʺreasonable and customaryʺ fee for a certain medical
procedure is $1200. They suspect that the average fee charged by one particular clinic for this
procedure is higher than $1200. The insurer wants to perform a hypothesis test to determine
whether their suspicion is correct.
A) Two-sided B) Lower-tailed C) Upper-tailed
46)
9

For the given hypothesis test, explain the meaning of a Type I error or a Type II error, as specified.
47) A manufacturer claims that the mean amount of juice in its 16-ounce bottles is 16.1 ounces. A
consumer advocacy group wants to perform a hypothesis test to determine whether the mean
amount is actually less than this. The hypotheses are:
H0: μ = 16.1 ounces
HA
: μ < 16.1 ounces
Explain the result of a Type I error.
A) The advocacy group will conclude that the mean amount of juice is less than 16.1 ounces
when in fact it is 16.1 ounces.
B) The advocacy group will conclude that the mean amount of juice is 16.1 ounces when in fact
it is 16.1 ounces.
C) The advocacy group will conclude that the mean amount of juice is 16.1 ounces when in fact
it is less than 16.1 ounces.
D) The advocacy group will conclude that the mean amount of juice is greater than 16.1 ounces
when in fact it is 16.1 ounces.
E) The advocacy group will conclude that the mean amount of juice is less than 16.1 ounces
when in fact it is less than 16.1 ounces.
47)
48) A man is on trial accused of murder in the first degree. The prosecutor presents evidence that he
hopes will convince the jury to reject the hypothesis that the man is innocent. This situation can be
modeled as a hypothesis test with the following hypotheses:
H0: The defendant is not guilty.
HA
: The defendant is guilty.
Explain the result of a Type II error.
A) The jury will conclude that the defendant is guilty when in fact he is not guilty.
B) The jury will fail to reach a decision.
C) The jury will conclude that the defendant is not guilty when in fact he is not guilty.
D) The jury will conclude that the defendant is not guilty when in fact he is guilty.
E) The jury will conclude that the defendant is guilty when in fact he is guilty.
48)
Use a hypothesis test to test the given claim.
49) Is the mean lifetime of particular type of car engine greater than 220,000 miles? To test this claim, a
sample of 23 engines is measured, yielding an average of 226,450 miles and a standard deviation of
11,500 miles.
A) Reject the null hypothesis of μ=220,000 with a P-value of 0.01338. There is sufficient
evidence that the engines last longer than 220,000 miles.
B) Reject the null hypothesis of μ=220,000 with a P-value of 0.00669. There is sufficient
evidence that the engines last longer than 220,000 miles.
C) There is not enough information to perform the test.
D) Fail to reject the null hypothesis of μ=220,000 with a P-value of 0.9933. There is not
sufficient evidence that the engines last longer than 220,000 miles.
E) Fail to reject the null hypothesis with a P-value of 0.07352.There is not sufficient evidence
that the engines last longer than 220,000 miles.
49)
10

50) Marc wants to know if the mean age of the prison population in his city is less than 26 years. He
obtains a random sample of 25 prisoners, and finds a mean age of 24.4 years and a standard
deviation of 9.2 years. What is his conclusion?
A) Fail to reject the null hypothesis of μ = 26 with a P-value of 0.1966. There is not sufficient
evidence that the mean age is less than 26 years.
B) There is not enough information to perform the test.
C) Reject the null hypothesis of μ = 26 with a P-value of 0.018. There is sufficient evidence that
the mean age is less than 26 years.
D) Fail to reject the null hypothesis of μ = 26 with a P-value of 0.8034. There is not sufficient
evidence that the mean age is less than 26 years.
E) Reject the null hypothesis of μ = 26 with a P-value of 0.0425. The evidence suggests that the
mean age is less than 26 years.
50)
51) A large software company gives job applicants a test of programming ability, and the mean score
for the test has been 160 in the past. Twenty-five applicants are randomly selected from one large
university and they produce a mean score of 165, with a standard deviation of 13. Does this
indicate that the sample comes from a population with a mean score greater than 160?
A) Yes. With a P-value of 0.0332, we reject the null hypothesis of μ=160.
B) Yes. With a P-value of 0.0024, we reject the null hypothesis of μ=160.
C) No. With a P-value of 0.9668, we fail to reject the null hypothesis of μ=160.
D) No. With a P-value of 0.0664, we fail to reject the null hypothesis of μ=160.
E) No. With a P-value of 0.9336, we fail to reject the null hypothesis of μ=160.
51)
Provide an appropriate response.
52) Suppose that scores for men on an aptitude test have greater variability than scores for women on
the same test. In other words, the population standard deviation is greater for the population of
men than for the population of women. Based on a sample of size 50, a 95% confidence interval for
the mean score, μ, of all women has a margin of error of 2.2. Which of the following confidence
intervals will have a smaller margin of error?
A. A 99% confidence interval for the mean score of women. Sample size = 50
B. A 95% confidence interval for the mean score of women. Sample size = 100
C. A 95% confidence interval for the mean score of men. Sample size = 50
A) A and B B) A, B, C C) C D) A E) B
52)
53) Suppose you have obtained a confidence interval for μ, but wish to obtain a greater degree of
precision. Which of the following would result in a narrower confidence interval?
A. Increasing the sample size while keeping the confidence level fixed
B. Decreasing the sample size while keeping the confidence level fixed
C. Increasing the confidence level while keeping the sample size fixed
D. Decreasing the confidence level while keeping the sample size fixed
A) A and D B) B and C C) B and D D) C and D E) A and C
53)
54) Which of the following is true about Studentʹs t-models?
I. They are unimodal, symmetric, and bell-shaped.
II. They have fatter tails than the Normal model.
III. As the degrees of freedom increase, the t-models look more and more like the Normal.
A) I and III B) II an III C) I and II D) I, II, III E) I only
54)
11

55) A wildlife biologist wants to determine the mean weight of adult red squirrels. She captures 10
squirrels she believes to be representative of the species and weighs them, finding a mean of 12.32
grams and standard deviation of 1.88gm. Assuming these squirrels can be considered a random
sample of all red squirrels which of the following formulas gives a 95% confidence interval for the
mean weight of all squirrels?
A) 12.32 ± 2.2281.88
10
B) 12.32 ± 2.2621.88
10
C) 12.32 ± 2.2621.88
9
D) 12.32 ± 1.961.88
10
E) 12.32 ± 2.2281.88
9
55)
56) We want to know the mean winning score at the US Open golf championship. An internet search
gives us all the scores for the history of that tournament, and we create a 95% confidence interval
based on a t-distribution. This procedure was not appropriate. Why?
A) The population standard deviation is known, so we should have used a z-model.
B) In big golf tournaments the players are not randomly selected.
C) Tiger Woodsʹ recent record-setting score is probably an outlier.
D) The entire population of scores was gathered so there is no reason to do inference.
E) Since these are the best players in the world, the scores are probably skewed.
56)
57) An elementary school principal wants to know the mean number of children in families whose
children attend this school. He checks all the families using the schoolʹs registration records, and
we use the TI-83 to create a 95% confidence interval based on a t-distribution. This procedure was
not appropriate. Why?
A) The recent record-setting family with twelve children is probably an outlier.
B) The entire population of families was gathered so there is no reason to do inference.
C) At a given school families are not randomly selected.
D) The population standard deviation is known, so he should have used a z-model.
E) Since these families are from only one school, the family sizes may be skewed.
57)
SHORT ANSWER. Write the word or phrase that best completes each statement or answers the question.
58) Students investigating the packaging of chocolate chip cookies purchased 10 16 -ounce
bags of a particular brand. They carefully weighed the contents of each bag, recording the
following weights (in ounces): 16.6, 15.2, 16.5, 15.9, 15.9, 16.2, 16.3, 15.8, 15.6, 16.0. The
students plan to test the hypothesis that the mean weight agrees with the companyʹs
stated weight on each bag. Decide whether or not the conditions and assumptions for
inference with a t-test are satisfied. Explain your answer.
58)
59) A group of researchers wants to determine the mean annual household income for
families receiving services at a large community center. They randomly select ten families
and record the following household incomes: $23,955, $22,740, $22,660, $23,800, $23,500,
$24,250, $14,340, $20,390, $24,150, $24,200. Decide whether or not the conditions and
assumptions for inference with a t-test are satisfied. Explain your answer.
59)
12

60) The distribution of the number of vacation days per year offered by different U.S.
companies is skewed to the right. We collect data on the number of vacation days from a
random sample of 60 companies across the United States. Why is it okay to use these data
for inference even though the population is skewed?
60)
61) The distribution of the number of vacation days per year offered by different U.S.
companies is skewed to the right. The mean and standard deviation of the 60 companies
in our sample were 22 days and 9 days, respectively. Specify the sampling model (shape,
center, spread) for the mean number of vacation days of such samples.
61)
62) The distribution of the number of vacation days per year offered by different U.S.
companies is skewed to the right. Find a 95% confidence interval for the mean number of
vacation days offered by U.S. companies. Explain what ʺ95% confidenceʺ means in this
context.
62)
63) A government report on housing costs says that single-family home prices nationwide are
skewed to the right, with a mean of $235,700. We collect price data from a random sample
of 50 homes in Orange County, California. Why is it okay to use these data for inference
even though the population is skewed?
63)
64) A government report on housing costs says that single-family home prices nationwide are
skewed to the right, with a mean of $235,700. We collect price data from a random sample
of 50 homes in Orange County, California. The standard deviation of the 50 homes in our
sample was $25,500. Specify the sampling model (shape, center, spread) for the mean price
of such samples.
64)
65) A government report on housing costs says that single-family home prices nationwide are
skewed to the right, with a mean of $235,700. We collect price data from a random sample
of 50 homes in Orange County, California. This sample of randomly chosen homes
produced a 90% confidence interval for the mean price in Orange County of ($233954,
$246046). Does this interval provide evidence that single-family home prices are
unusually high in this county? Explain briefly.
65)
66) A government report on standard of living says that family incomes nationwide are
skewed to the right, with a mean of $33400. We collect income data from a random
sample of 50 local families. Why is it okay to use these data for inference even though the
population is skewed?
66)
67) A government report on standard of living says that family incomes nationwide are
skewed to the right, with a mean of $33400. We collect income data from a random
sample of 50 local families. The standard deviation of the 50 incomes in our sample was
$25,530. Specify the sampling model (shape, center, spread) for the mean income of such
samples.
67)
13

MULTIPLE CHOICE. Choose the one alternative that best completes the statement or answers the question.
68) A college alumni fund appeals for donations by phoning or emailing recent graduates. A random
sample of 300 alumni shows that 40% of the 150 who were contacted by telephone actually made
contributions compared to only 30% of the 150 who received email requests. Which formula
calculates the 99.7% confidence interval for the difference in the proportions of alumni who may
make donations if contacted by phone or by email?
A) (0.40 - 0.30) ± 3(0.40)(0.60)
150 +
(0.30)(0.70)
150
B) (0.40 - 0.30) ± 3(0.40)(0.60)
300 +
(0.30)(0.70)
300
C) (0.40 - 0.30) ± 3(0.35)(0.65)
150 +
(0.35)(0.65)
150
D) (0.40 - 0.30) ± 3(0.35)(0.65)
300
E) (0.40 - 0.30) ± 3(0.35)(0.65)
150
68)
Construct the indicated confidence interval for the difference in proportions. Assume that the samples are independent
and that they have been randomly selected.
69) A survey of randomly chosen adults found that 26 of the 63 women and 42 of the 73 men follow
regular exercise programs. Construct a 95% confidence interval for the difference in the
proportions of women and men who have regular exercise programs.
A) (0.405, 0.738)
B) (0.373, 0.770)
C) (-0.202, 0.738)
D) (-0.202, 0.770)
E) (-0.33, 0.01)
69)
70) A marketing survey involves product recognition in New York and California. Of 558 New
Yorkers surveyed, 193 knew the product while 196 out of 614 Californians knew the product.
Construct a 99.7% confidence interval for the difference in the proportions of New Yorkers and
Californians who knew the product.
A) (-0.0617, 0.1150)
B) (-0.0034, 0.0566)
C) (-0.0442, 0.0975)
D) (-0.0443, 0.0566)
E) (0.0247, 0.0286)
70)
14

Interpret the given confidence interval.
71) Suppose the proportion of women who follow a regular exercise program is pw and the
proportion of men who follow a regular exercise program is pm. A study found a 90% confidence
interval for pw - pm is (-0.025, 0.113). Give an interpretation of this confidence interval.
A) We are 90% confident that the proportion of men who follow a regular exercise program is
between 2.5% less and 11.3% more than the proportion of women who follow a regular
exercise program.
B) We know that 90% of all random samples done on the population will show that the
proportion of women who follow a regular exercise program is between 2.5% less and 11.3%
more than the proportion of men who follow a regular exercise program.
C) We are 90% confident that the proportion of women who follow a regular exercise program
is between 2.5% less and 11.3% more than the proportion of men who follow a regular
exercise program.
D) We know that 90% of women exercise between 2.5% less and 11.3% more than men.
E) We know that 90% of men exercise between 2.5% less and 11.3% more than women.
71)
72) Suppose the proportion of sophomores at a particular college who purchased used textbooks in the
past year is ps and the proportion of freshmen at the college who purchased used textbooks in the
past year is pf. A study found a 90% confidence interval for ps - pf is (0.239, 0.427). Give an
interpretation of this confidence interval.
A) We are 90% confident that at this college the proportion of freshmen who bought used
textbooks is between 23.9% and 42.7% higher than the proportion of sophomores who
bought used textbooks.
B) We know that 90% of sophomores bought between 23.9% and 42.7% more used textbooks
than freshmen at this college.
C) We know that 90% of all random samples done on the population will show that the
proportion of sophomores who bought used textbooks is between 23.9% and 42.7% higher
than the proportion of freshmen who bought used textbooks.
D) We are 90% confident that at this college the proportion of sophomores who bought used
textbooks is between 23.9% and 42.7% higher than the proportion of freshmen who bought
used textbooks.
E) We are 90% confident that sophomores at this college bought between 23.9% and 42.7% more
used textbooks than freshmen.
72)
73) A marketing survey involves product recognition in New York and California. Suppose the
proportion of New Yorkers who recognized a product is p1 and the proportion of Californians
who recognized the product is p2. The survey found a 95% confidence interval for p1 - p2 is
(-0.21, -0.18). Give an interpretation of this confidence interval.
A) We know that 95% of New Yorkers recognized the product between 1.8% and 2.1% more
often than Californians.
B) We know that 95% of all random samples done on the population will show that the
proportion of Californians who knew the product is between 1.8% and 2.1% higher than the
proportion of New Yorkers who knew the product.
C) We are 95% confident that the proportion of Californians who recognized the product is
between 1.8% and 2.1% higher than the proportion of New Yorkers who recognized the
product.
D) We are 95% confident that the proportion of New Yorkers who recognized the product is
between 1.8% and 2.1% higher than the proportion of Californians who recognized the
product.
E) We know that 95% of Californians recognized the product between 1.8% and 2.1% more
often than New Yorkers.
73)
15

Construct the indicated confidence interval for the difference between the two population means. Assume that the
assumptions and conditions for inference have been met.
74) A grocery store is interested in determining whether or not a difference exists between the shelf
life of two different brands of doughnuts. A random sample of 100 boxes of each brand was
selected and the shelf life in days was determined for each box. The sample results are given
below.
Brand A Brand B
x = 2.1 x = 2.9
s = 0.8 s = 1.1
n = 100 n = 100
Find a 90% confidence interval for μA - μB, the difference in mean shelf life between brand A and
brand B.
A) (-1.53, -0.08)
B) (0.08, 1.53)
C) (2.1, 2.9)
D) (-1.03, -0.58)
E) (0.58, 1.03)
74)
Use the paired t-interval procedure to obtain the required confidence interval for the mean difference. Assume that the
conditions and assumptions for inference are satisfied.
75) A test of writing ability is given to a random sample of students before and after they completed a
formal writing course. The results are given below. Construct a 99% confidence interval for the
mean difference between the before and after scores if d(after-before) = -2.0 and sd =2.6457
Before 70 80 92 99 93 97 76 63 68 71 74
After 69 79 90 96 91 95 75 64 62 64 76
A) (-0.1, 4.1)
B) (-0.2, 4.2)
C) (-4.5,0.5)
D) (-13.6, 17.6)
E) (1.2,2.8)
75)
Interpret the given confidence interval.
76) A researcher was interested in comparing the salaries of female and male employees of a particular
company. Independent random samples of female employees (sample 1) and male employees
(sample 2) were taken to calculate the mean salary, in dollars per week, for each group. A 90%
confidence interval for the difference, μ1- μ
2, between the mean weekly salary of all female
employees and the mean weekly salary of all male employees was determined to be (-$110, $60).
A) Based on these data, with 90% confidence, male employees at this company average between
$110 less and $60 more per week than the female employees.
B) We know that 90% of all random samples done on the employees at this company will show
that the average female salary is between $110 less and $60 more per week than the average
male salary.
C) We are 90% confident that a randomly selected female employee at this company makes
between $110 less and $60 more per week than a randomly selected male employee.
D) We know that 90% of female employees at this company make between $110 less and $60
more than the male employees.
E) Based on these data, with 90% confidence, female employees at this company average
between $110 less and $60 more per week than the male employees.
76)
16

SHORT ANSWER. Write the word or phrase that best completes each statement or answers the question.
Use a two proportion z-test to perform the required hypothesis test. State the conclusion.
77) Use the given sample data to test the claim that p1 > p2.
Sample 1 Sample 2
n1 = 85 n2 = 90
x1 = 38 x2 = 23
77)
78) Use the given sample data to test the claim that p1 < p2.
Sample 1 Sample 2
n1 = 462 n2 = 380
x1 = 84 x2 = 95
78)
Use a paired t-test to perform the required hypothesis test for two population means. Assume that the conditions and
assumptions for inference are satisfied.
79) Five students took a math test before and after tutoring. Their scores were as follows.
Subject A B C D E
Before 67 75 79 69 75
After 71 84 77 72 87
Do the data suggest that the tutoring has an effect on the math scores? Perform a paired
t-test at the 5% significance level.
79)
Decide whether or not the conditions and assumptions for inference with the two -proportion z-test are satisfied.
Explain your answer.
80) A poll of randomly selected Americans between the ages of 20 and 29 reports that 35 of
410 men and 59 of 398 women suffered from insomnia at least once a week during the past
year.
80)
81) An Illinois study examined the effect of day care on behavior in toddlers. Randomly
selected parents who had a toddler in full-time day care were asked if their child had
behavioral problems. The researchers found that among 987 parents surveyed, 212 said
their child had behavioral problems. Among 349 randomly selected parents with a
toddler at home, 17 reported that their child had behavioral problems.
81)
82) A researcher wishes to determine whether the proportion of American women who smoke
differs from the proportion of American men who smoke. He wants to test the hypothesis
H0: p1 = p2 where p1 represents the proportion of American women who smoke and p2
represents the proportion of American men who smoke. He randomly selects 100 married
couples. Among the 100 women in the sample are 21 smokers. Among the 100 men are 29
smokers. Are the assumptions for a two-sample z-test for two population proportions
met? If not, which assumption is violated and why?
82)
83) A researcher wished to test the claim that the rate of defectives among the computers of
two different manufacturers is the same. She selected two independent random samples
and found that 1.5% of 400 computers from manufacturer A were defective and 3.5% of
200 computers from manufacturer B were defective.
83)
17

Use a two proportion z-test to perform the required hypothesis test. State the conclusion.
84) A researcher finds that of 1,000 people who said that they attend a religious service at least
once a week, 31 stopped to help a person with car trouble. Of 1,200 people interviewed
who had not attended a religious service at least once a month, 22 stopped to help a
person with car trouble. Do the data provide sufficient evidence to conclude that the two
proportions are different?
84)
Decide whether or not the conditions and assumptions for inference with a two -sample t-interval are satisfied. Explain
your answer.
85) A study was conducted to determine which cab company gives quicker service.
Companies A and B were each called at 50 randomly selected times. The response times
were recorded. The results were as follows.
Company A Company B
Mean response time 7.6 minutes 6.9 minutes
Standard deviation 1.4 minutes 1.7 minutes
85)
86) The owner of a large apartment complex had an in-ground swimming pool installed in an
effort to increase tenant satisfaction. Nine tenants were randomly selected to complete a
questionnaire that assessed their level of satisfaction with the apartment complex. Their
scores before and after the installation of the pool are shown. The owner wants to assess
the effectiveness of the pool in increasing tenant satisfaction.
Tenant
Number
Level of Satisfaction
Before Pool
Level of Satisfaction
After Pool
1 2 3
2 1 1
3 3 5
4 4 3
5 2 4
6 5 5
7 2 3
8 3 3
9 3 4
86)
18

Answer KeyTestname: INTROSTATS 2 FINAL EXAM REVIEW
1) D
2) D
3) C
4) B
5) A
6) B
7) E
8) C
9) E
10) D
11) A
12) D
13) D
14) E
15) A
16) C
17) C
18) E
19) E
20) C
21) C
22) Conditions:
* Independence: We assume that one truckerʹs driving times do not influence other truckerʹs driving times.
* Random Condition: We assume that trucks are stopped at random.
* 10% Condition: This sample of 348 truckers is less than 10% of all truckers.
* Success/Failure: 49 tickets and 299 tickets are both at least 10, so our sample is large enough.
Under these conditions the sampling distribution of the proportion can be modeled by a Normal model.
We will find a one-proportion z-interval.
We know n = 348 and p^ = 0.14, so SE( p
^ ) =
p^q^
n =
(0.14)(0.86)
348 = 0.0186
The sampling model is Normal, for a 95% confidence interval the critical value is z* = 1.96.
The margin of error is ME = z* × SE(p^ ) = 1.96(0.0186) = 0.0365.
The 95% confidence interval is 0.14 ± 0.0365 or (0.1035, 0.1765).
We are 95% confident that between 10.4% and 17.7% of truck drivers have driven too many hours in a day.
If we repeated the sampling and created new confidence intervals many times we would expect about 95% of those
intervals to contain the actual proportion of truck drivers that have driven too many hours in a day.
23) Building A only.
24) Since ME = z*p^q^
n, we have z* =
0.03
(0.62)(0.38)
800
≈ 1.75
P(-1.75 < z < 1.75) = 92%.
19
Answer KeyTestname: INTROSTATS 2 FINAL EXAM REVIEW
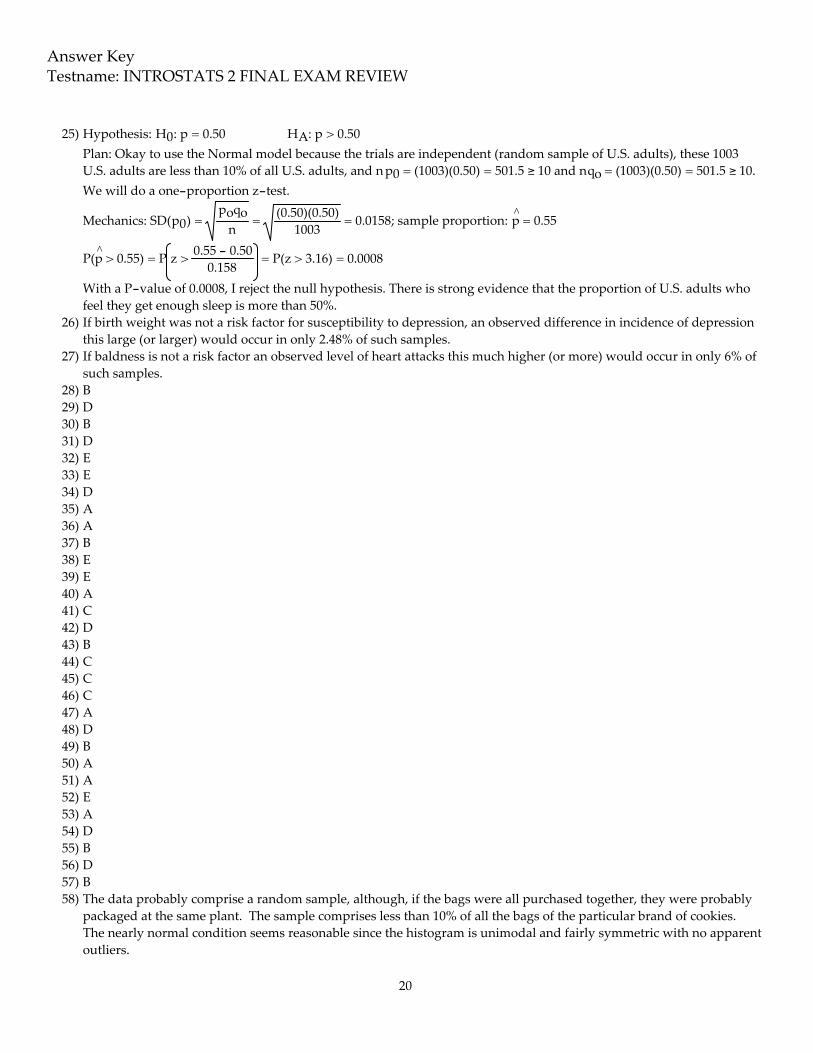
25) Hypothesis: H0: p = 0.50 HA: p > 0.50
Plan: Okay to use the Normal model because the trials are independent (random sample of U.S. adults), these 1003
U.S. adults are less than 10% of all U.S. adults, and np0 = (1003)(0.50) = 501.5 ≥ 10 and nqo = (1003)(0.50) = 501.5 ≥ 10.
We will do a one-proportion z-test.
Mechanics: SD(p0) = poqo
n =
(0.50)(0.50)
1003 = 0.0158; sample proportion: p
^ = 0.55
P(p^ > 0.55) = P z >
0.55 - 0.50
0.158 = P(z > 3.16) = 0.0008
With a P-value of 0.0008, I reject the null hypothesis. There is strong evidence that the proportion of U.S. adults who
feel they get enough sleep is more than 50%.
26) If birth weight was not a risk factor for susceptibility to depression, an observed difference in incidence of depression
this large (or larger) would occur in only 2.48% of such samples.
27) If baldness is not a risk factor an observed level of heart attacks this much higher (or more) would occur in only 6% of
such samples.
28) B
29) D
30) B
31) D
32) E
33) E
34) D
35) A
36) A
37) B
38) E
39) E
40) A
41) C
42) D
43) B
44) C
45) C
46) C
47) A
48) D
49) B
50) A
51) A
52) E
53) A
54) D
55) B
56) D
57) B
58) The data probably comprise a random sample, although, if the bags were all purchased together, they were probably
packaged at the same plant. The sample comprises less than 10% of all the bags of the particular brand of cookies.
The nearly normal condition seems reasonable since the histogram is unimodal and fairly symmetric with no apparent
outliers.
20
Answer KeyTestname: INTROSTATS 2 FINAL EXAM REVIEW
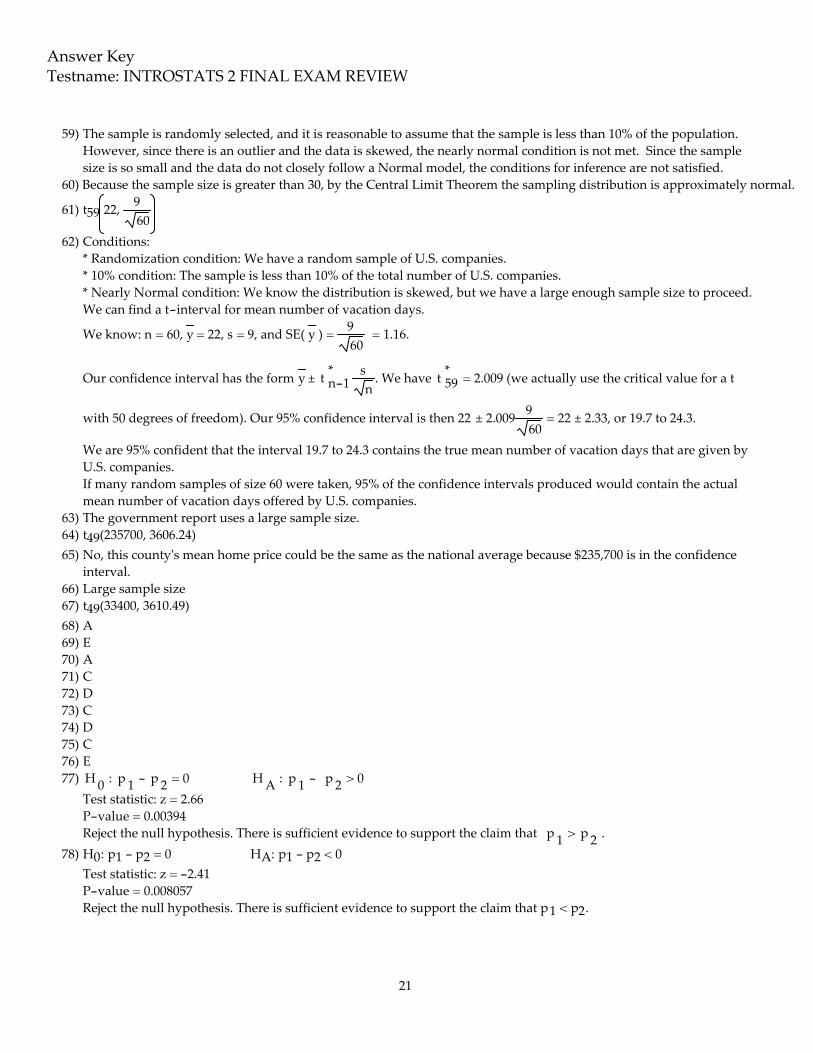
59) The sample is randomly selected, and it is reasonable to assume that the sample is less than 10% of the population.
However, since there is an outlier and the data is skewed, the nearly normal condition is not met. Since the sample
size is so small and the data do not closely follow a Normal model, the conditions for inference are not satisfied.
60) Because the sample size is greater than 30, by the Central Limit Theorem the sampling distribution is approximately normal.
61) t59 22, 9
60
62) Conditions:
* Randomization condition: We have a random sample of U.S. companies.
* 10% condition: The sample is less than 10% of the total number of U.S. companies.
* Nearly Normal condition: We know the distribution is skewed, but we have a large enough sample size to proceed.
We can find a t-interval for mean number of vacation days.
We know: n = 60, y = 22, s = 9, and SE( y ) = 9
60 = 1.16.
Our confidence interval has the form y ± t*n-1
s
n. We have t
*59 = 2.009 (we actually use the critical value for a t
with 50 degrees of freedom). Our 95% confidence interval is then 22 ± 2.0099
60 = 22 ± 2.33, or 19.7 to 24.3.
We are 95% confident that the interval 19.7 to 24.3 contains the true mean number of vacation days that are given by
U.S. companies.
If many random samples of size 60 were taken, 95% of the confidence intervals produced would contain the actual
mean number of vacation days offered by U.S. companies.
63) The government report uses a large sample size.
64) t49(235700, 3606.24)
65) No, this countyʹs mean home price could be the same as the national average because $235,700 is in the confidence
interval.
66) Large sample size
67) t49(33400, 3610.49)
68) A
69) E
70) A
71) C
72) D
73) C
74) D
75) C
76) E
77) H0: p
1- p
2= 0 H
A: p
1- p
2> 0
Test statistic: z = 2.66
P-value = 0.00394
Reject the null hypothesis. There is sufficient evidence to support the claim that p1> p
2.
78) H0: p1 - p2 = 0 HA: p1 - p2 < 0
Test statistic: z = -2.41
P-value = 0.008057
Reject the null hypothesis. There is sufficient evidence to support the claim that p1 < p2.
21

Answer KeyTestname: INTROSTATS 2 FINAL EXAM REVIEW
79) H0: μ
d=0
HA
: μd≠ 0
Test statistic: t = -2.134
P-value = 0.0998
Do not reject H0. At the 5% significance level, the data do not provide sufficient evidence to conclude that the
tutoring has an effect on the math scores.
80) The assumptions and conditions necessary for inference are satisfied. The samples are both random. Each sample
contains less than 10% of the population. The samples are independent of each other. There are at least 10 successes
and at least 10 failures in each sample.
81) The assumptions and conditions necessary for inference are satisfied. The samples are both random. Each sample
contains less than 10% of the population. The samples are independent of each other. There are at least 10 successes
and at least 10 failures in each sample.
82) The assumptions and conditions necessary for inference are not satisfied. Since married couples were surveyed, the
two samples are not independent.
83) The assumptions and conditions necessary for inference are not satisfied. There are only 6 defectives from
manufacturer A and 7 defectives from manufacturer B. This violates the success/failure condition which requires that
at least 10 successes and at least 10 failures be observed in each sample.
84) H0: p1 - p2 = 0 HA: p1 - p2 ≠ 0
Test statistic: z = 1.93
P-value = 0.0537
Fail to reject the null hypothesis. There is not sufficient evidence to conclude that the two proportions are different.
85) The conditions and assumptions for inference appear to be satisfied. The samples are independent of each other. The
samples appear to be independent and random since the times were selected randomly and we can assume that the 50
calls represent fewer than 10% of the total calls to each company. Since both sample sizes are larger than 40, the
Central Limit Theorem applies.
86) The two-sample t-test cannot be used on this data. These are not two independent samples. These are before and
after scores for the same individuals.
22