Embed Size (px)
Citation preview

2. Project Title: Environment and Container Life Source Term
Evolution of Near Field Project No.
06002.01.08 1 06002.01.07 1
k d Release of new software
Name
0 Release of modified software:
Read OnlyIRead- Write AdditiodChangeLDelete
0 Enhancements made
0 Corrections made
0 Change of access software
0 Software Retirement
6. Validation Status
O X Validated
0 Limited Validation
0 Not Validated Explain: Validated in December, 2003 c--
7. Persons Authorized Access
L. Yang R. Pabalan V. Jain
RO RO RO
8. Element Manager Approval: Date: 7 17/04 8
9. Remarks:
WRA Form TOP-6 (09101)

CENTER FOR NUCLEAR WASTE REGULATORY ANALYSES QA VERIFICATION REPORT
FOR +ACQUIRED SOFTWARE NOT TO BE MODIFIED C
Software Title/Name: [ m% CSP Version: b0b 9e04L 2*3 1 , '=
Demonstration workstation: LDNX Operating System: WT*83dC, '-e@
J NOTE: Acquired software may or may not meet all requirements and will be evaluated on
Installation Testing [TOP-018, Section 5.61
Has installation testing been conducted for each intended computer platform and operatig system? Yes: tf NO: o N/A:O
Computer Platforms: ~ f i 'c Operating Systems:-d;,&e Location of Acceptance Test Results: -'&& & o& >J
Comments:.
0
~~
Software Output [TOP-018, Section 55.41
[s software designed so that individual runs are uniquely identified by date, time, name of software a@ version? yes:^ NO: B/ N/A:O
Date and Time Displayed:- NameNersion Displayed: Comments:
m
NOTE: Output identification content and format is typically
Medium Documentation [TOP-018, Section 5.5.61
The physical labeling of software medium (tapes, disks, etc.) contains: P r o g r d a m e , Module/Name/Title, Module Revision, File type (ASCII, OBJ, EXE), Recording Date, and Operating System s)?
Yes: d No:O N/A:O Zomments:
(04/01) Page 1 of 3
CENTER FOR NUCLEAR WASTE REGULATORY ANALYSES QA VERIFICATION REPORT
FOR +ACQUIRED SOFTWARE NOT TO BE MODZFZED 4-
Is the Software Summary Form (Form TOP-4-1) completed and signed? Yes: 8/ N ~ : O N/A:CI
~ Date of Approval: '2 1 cl %a=q
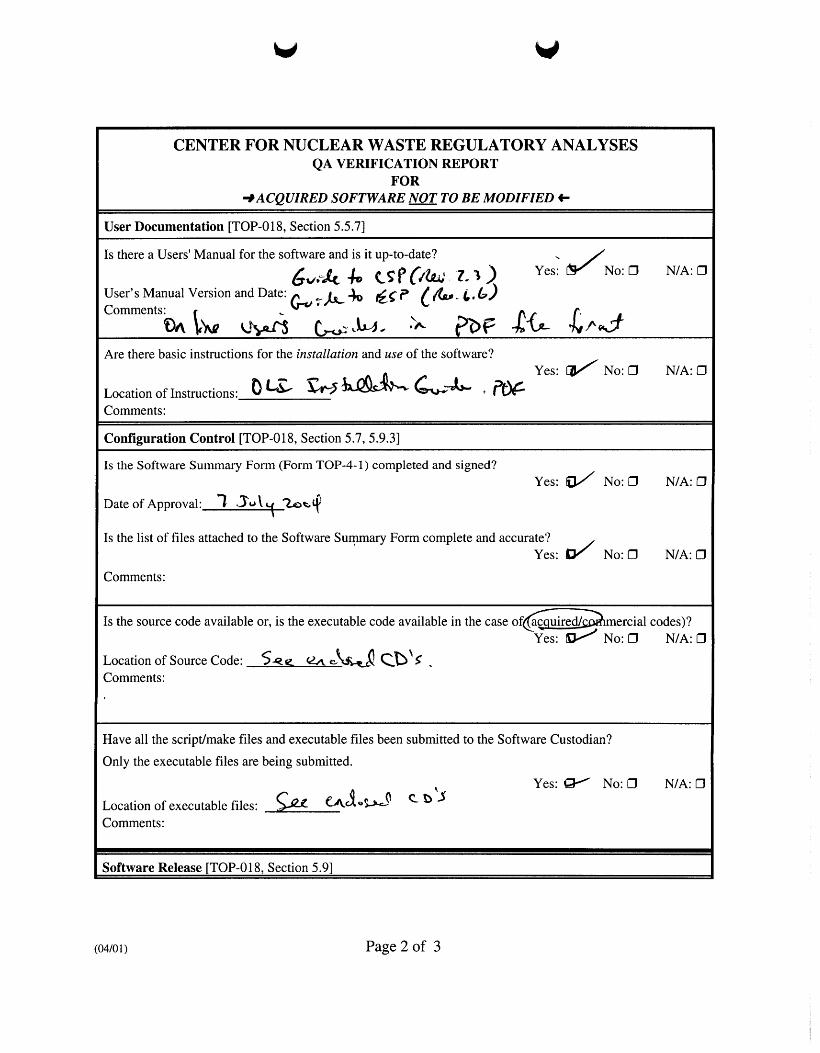
I User Documentation [TOP-01 8, Section 5.5.73
Is there a Users' Manual for the software and is it up-to-date?
User's Manual Version and Date: Comments :
&.& .tc C$P(& 7 3 ) Yes: ' /No: 0 N/A: 0
;-h +, 6s: ( 6 6.6)
I Are there basic instructions for the installation and use of the software? Yes: I / NO: o N/A: CI
Location of Instructions: W L -wuQJJ-LA *?(% I I Comments:
I Configuration Control [TOP-018, Section 5.7,5.9.3]
Is the list of files attached to the Software Suynary Form complete and accurate?
Comments: Yes: W' N ~ : O N/A:O
Is the source code available or, is the executable code available in the case o f ~ ~ ~ & m e r c i a l codes)?
Location of Source Code: Comments:
Yes: / N ~ : O N/A:O
5 . 4 ~ a &-J cws,
Have all the scriptlmake files and executable files been submitted to the Software Custodian? Only the executable files are being submitted.
Location of executable files: % UJ0U- Comments :
Yes: Ig, No:O N/A:O 0 Cb'5
I Software Release [TOP-018. Section 5.91
(04/0 1 ) Page2of 3

CENTER FOR NUCLEAR WASTE REGULATORY ANALYSES QA VERIFICATION REPORT
FOR +ACQUIRED SOFTWARE NOT TO BE MODIFIED C
Upon acceptance of the software as verified above, has a Software Release Notice (SRN), Form TOP-6 been issued and does the version number of the software match the documentation?
Yes: Q/ NO: o N/A:o SRN Number: 3169 Comments:
I Software Validation [TOP-01 8, Section 5.101
Has a Software Validation Test Plan (SVTP) been prepared for the range of application of the software? Y e s 0 No: 0 N/A:@
Version and Date of SVTP: - Date Reviewed and Approved via QAP-002: - Comments:
Has a Software Validation Test Report (SVTR) been prepared that documents the results of the validation cases, interpretation of the results, and determination if the software has been validated?
GSV, L E G G-5 Pcgt 7=0a Yes: / No: 0 N/A:O Version and Date of SVTR: cs ’ 1 ‘ ”) S h - 4 2 Date Reviewed and Approved via QAP-002: 10 Comments. :
2-3
Additional Comments:
- S%w are Evaluakr/User/Da t e Software CustodianDate
(04101) Page3 of 3

ESP 7 . 0
Volume in drive R is OLI70 Volume Serial Number is 2594-E69B
Directory of R:\
09/24/2001 10:45a <DIR> acrobat 09/24/2001 09:28a 1,039,140 datal.cab 09/24/2001 09:28a 40 , 627 datal. hdr 09/24/2001 09:28a 25,530,394 data2.cab 10/05/2000 02:Olp 339,565 ikernel.ex- 09/24/2001 09:28a 435 1ayout.bin 09/24/2001 10:46a <DIR> OLI Manual 03/18/1999 03:44p 164,822 setup.bmp 10/05/2000 03:OOp 54,272 Setup.exe 09/24/2001 09:28a 84 Setup.ini 09/24/2001 09:04a 157,465 Setup.inx
9 File(s) 27,326,804 bytes
Directory of R:\acrobat
09/24/2001 10:45a <DIR> 09/24/2001 10:42a <DIR> . . 03/19/1999 01:25p 5,455,526 ACRD4ENU.EXE
1 File(s) 5,455,526 bytes
Directory of R:\OLI Manual
09/24/2001 10:46a <DIR> 09/24/2001 10:42a <DIR> 04/27/2000 08:51a 03/25/1998 04:12p 03/25/1998 04:12p 03/25/1998 04:05p 03/25/1998 04:07p 03/25/1998 04:09p 03/25/1998 04:llp 03/25/1998 04:05p 07/13/1999 03336~ 07/13/1999 03 : 30p 07/14/1999 09:52a 07/13/1999 03:35p 07/13/1999 03:35p 07/13/1999 03:29p 04/27/2000 08:51a 04/27/2000 08:49a 04/18/2001 02:24p 11/16/1999 12:49p
18 File(s)
. . 395,717 CSP Manua1.pdf 29,917 ENG Chapter 6.pdf 67,203 ENG Chapter 5.pdf 42,078 ENG Chapter l.pdf 271,198 ENG Chapter 2.pdf 146,790 ENG Chapter 3.pdf 100,801 ENG Chapter 4.pdf 17,243 Engine 1ndex.pdf 26,215 ESP Chapter 5.pdf 36,888 ESP Chapter l.pdf 242,829 ESP Chapter 2.pdf 391,703 ESP Chapter 3.pdf 20,702 ESP Chapter 4.pdf 16,381 ESP 1ndex.pdf 733,369 ESP Manua1.pdf 680,377 OLI Engine Manua1.pdf 101,457 OLI High Temperature Manual.pdf 120,422 OLI Installation Guide.pdf 3,441,290 bytes
Total Files Listed: 28 File(s) 36,223,620 bytes 6 Dir(s) 0 bytes free

ESP 6.6; CSP 2.3
Volume in drive R is OLI66 Volume Serial Number is 6CF9-30D9
Directory of R:\
05/17/2001 09/12/2002 09/12/2002 09/12/2002 09/05/2001 09/12/2002 05/17/2001 03/18/1999 10/05/2000 09/12/2002 09/09/2002
11 : 25a <DIR> Adobe Acrobat 5.0 Reader 09 : 52a 2,473,236 datal.cab 09 : 52a 88 , 627 datal. hdr 09: 52a 65,191,288 data2.cab 03 : 24a 344,923 ikernel.ex- 09: 52a 435 1ayout.bin 11: 25a <DIR> OLI Manual 03 : 44p 164,822 setup.bmp 03 : OOp 54,272 Setup.exe 09 : 52a 84 Setup.ini 03 :lop 157,554 setup.inx
9 File(s) 68,475,241 bytes
Directory of R:\Adobe Acrobat 5.0 Reader
05/17/2001 11:25a <DIR> 05/17/2001 11:25a <DIR> . . 09/12/2002 10:21a 10,432,544 rp505enu.exe
1 File(s) 10,432,544 bytes
Directory of R:\OLI Manual
05/17/2001 11:25a <DIR> 05/17/2001 11:25a cDIR> . . 09/06/2002 11:21a 346,345 CSP Manual.pdf 09/06/2002 12:21p 698 , 427 ESP Manual .pdf 09/06/2002 12:39p 3,883,325 OLI Engine Manual.PDF 04/18/2001 02:24p 101,457 OLI High Temperature Manual.pdf 11/16/1999 12:49p 120,422 OLI Installation Guide.pdf
5 File(s) 5 , 149 , 976 bytes
Total Files Listed: 15 File(s) 84,057,761 bytes 6 Dir(s) 0 bytes free

SOFTWARE VALIDATION REPORT FOR ENVIRONMENTAL SIMULATION PROGRAM (ESP)
VERSION 6.6 CORROSION SIMULATION PROGRAM (CSP)
VERSION 2.3, ENVIRONMENTAL SIMULATION PROGRAM
FOR CONCENTRATED BRINES (ESPCB) VERSION 7.0 ALFA, AND
STREAMANALYZER 1.2
Prepared for
U.S. Nuclear Regulatory Commission Contract NRC-02-02-012
Prepared by
Lietai Yang Center for Nuclear Waste Regulatory Analyses
San Antonio, Texas
December 2003
Approved by:
) Z / r 9 / o ' 7 1 W
Date 4
Corrosion Science and Process Engineering

CONTENTS
Section Page
FIGURES . . . . . . . . . . . . . . . . . . . . . . . . . . . . . . . . . . . . . . . . . . . . . . . . . . . . . . . . . . . . . . . . . . v ACKNOWLEDGMENTS . . . . . . . . . . . . . . . . . . . . . . . . . . . . . . . . . . . . . . . . . . . . . . . . . . . . . . vii
1 SCOPE OF THE VALIDATION . . . . . . . . . . . . . . . . . . . . . . . . . . . . . . . . . . . . . . . . . . . 1
2 SYSTEM REQUIREMENTS . . . . . . . . . . . . . . . . . . . . . . . . . . . . . . . . . . . . . . . . . . . . . . 1 2.1 Software . . . . . . . . . . . . . . . . . . . . . . . . . . . . . . . . . . . . . . . . . . . . . . . . . . . . . . . 1 2.2 Hardware . . . . . . . . . . . . . . . . . . . . . . . . . . . . . . . . . . . . . . . . . . . . . . . . . . . . . . 2
3 PREREQUISITES . . . . . . . . . . . . . . . . . . . . . . . . . . . . . . . . . . . . . . . . . . . . . . . . . . . . . 2
4 ASSUMPTIONS AND CONSTRAINTS . . . . . . . . . . . . . . . . . . . . . . . . . . . . . . . . . . . . 2
5 TESTCASES . . . . . . . . . . . . . . . . . . . . . . . . . . . . . . . . . . . . . . . . . . . . . . . . . . . . . . . . . 3 Test Case 1-NaCI Solubility as a Function of Temperature . . . . . . . . . . . . . . . 3 5.1.1 Testlnput . . . . . . . . . . . . . . . . . . . . . . . . . . . . . . . . . . . . . . . . . . . . . . . . 3 5.1.2 Test Procedure . . . . . . . . . . . . . . . . . . . . . . . . . . . . . . . . . . . . . . . . . . . . 3 5.1.3 Test Results . . . . . . . . . . . . . . . . . . . . . . . . . . . . . . . . . . . . . . . . . . . . . . 3 Test Case 2-NaCI and/or KCI Solubility in Mixed NaCI+KCI Solutions . . . . . . . 3 5.2.1 Testlnput . . . . . . . . . . . . . . . . . . . . . . . . . . . . . . . . . . . . . . . . . . . . . . . . 3 5.2.2 Testprocedure . . . . . . . . . . . . . . . . . . . . . . . . . . . . . . . . . . . . . . . . . . . . 4 5.2.3 Test Results . . . . . . . . . . . . . . . . . . . . . . . . . . . . . . . . . . . . . . . . . . . . . . 4 Test Case 3-Solubility of MgCI, in CaCI,-NaC I.KCI Solutions . . . . . . . . . . . . . 6 5.3.1 Testlnput . . . . . . . . . . . . . . . . . . . . . . . . . . . . . . . . . . . . . . . . . . . . . . . . 7 5.3.2 Test Procedure . . . . . . . . . . . . . . . . . . . . . . . . . . . . . . . . . . . . . . . . . . . . 7 5.3.3 Test Results . . . . . . . . . . . . . . . . . . . . . . . . . . . . . . . . . . . . . . . . . . . . . . 7 Test Case 4-Vapor Pressure of KCI Solutions at 300 "C [572 OF] as a Function of Concentration . . . . . . . . . . . . . . . . . . . . . . . . . . . . . . . . . . . . . . . . . . 7 5.4.1 Testlnput . . . . . . . . . . . . . . . . . . . . . . . . . . . . . . . . . . . . . . . . . . . . . . . . 7 5.4.2 Test Procedure . . . . . . . . . . . . . . . . . . . . . . . . . . . . . . . . . . . . . . . . . . . . 7 5.4.3 Test Results . . . . . . . . . . . . . . . . . . . . . . . . . . . . . . . . . . . . . . . . . . . . . . 7 Test Case 5-Lowering of Vapor Pressure by CaCI, in Aqueous Solutions at 100 "C [212 OF] as a Function of Concentration . . . . . . . . . . . . . . . 8 5.5.1 Testlnput . . . . . . . . . . . . . . . . . . . . . . . . . . . . . . . . . . . . . . . . . . . . . . . . 9 5.5.2 Test Procedure . . . . . . . . . . . . . . . . . . . . . . . . . . . . . . . . . . . . . . . . . . . . 9 5.5.3 Test Results . . . . . . . . . . . . . . . . . . . . . . . . . . . . . . . . . . . . . . . . . . . . . 10 Test Case 6-Lowering of Vapor Pressure by NaNO,, NaOH, NaHSO,, and NaHCO, in Aqueous Solutions at 100 "C [212 OF] . . . . . . . . . . . . . . . . . . . . . . 10 5.6.1 Testlnput . . . . . . . . . . . . . . . . . . . . . . . . . . . . . . . . . . . . . . . . . . . . . . . 10 5.6.2 Test Procedure . . . . . . . . . . . . . . . . . . . . . . . . . . . . . . . . . . . . . . . . . . . 10 5.6.3 Test Results . . . . . . . . . . . . . . . . . . . . . . . . . . . . . . . . . . . . . . . . . . . . . 10 Test Case 7-Deliquescence Point of Mixed NaCI-NaN0,-KNO, Salts . . . . . . 11 5.7.1 Testlnput . . . . . . . . . . . . . . . . . . . . . . . . . . . . . . . . . . . . . . . . . . . . . . . 11 5.7.2 Test Procedure . . . . . . . . . . . . . . . . . . . . . . . . . . . . . . . . . . . . . . . . . . . 11 5.7.3 Test Results . . . . . . . . . . . . . . . . . . . . . . . . . . . . . . . . . . . . . . . . . . . . . 12
5.1
5.2
5.3
5.4
5.5
5.6
5.7
ii

CONTENTS (continued)
Section Page
5.8 Test Case 8-Stability Diagram for Nickel-Water System . . . . . . . . . . 12 5.8.1 Testlnput . . . . . . . . . . . . . . . . . . . . . . . . . . . . . . . . . . . . . . . . . . . . . . . 12 5.8.2 Test Procedure . . . . . . . . . . . . . . . . . . . . . . . . . . . . . . . . . . . . . . . . . . . 13 5.8.3 Test Results . . . . . . . . . . . . . . . . . . . . . . . . . . . . . . . . . . . . . . . . . . . . . 13 Test Case 9-Solubility of NaNO, and NaOH at Concentrations Beyond30M . . . . . . . . . . . . . . . . . . . . . . . . . . . . . . . . . . . . . . . . . . . . . . . . . . . 13 5.9.1 Testlnput . . . . . . . . . . . . . . . . . . . . . . . . . . . . . . . . . . . . . . . . . . . . . . . 13 5.9.2 Test Procedure . . . . . . . . . . . . . . . . . . . . . . . . . . . . . . . . . . . . . . . . . ; . 16 5.9.3 Test Results . . . . . . . . . . . . . . . . . . . . . . . . . . . . . . . . . . . . . . . . . . . . . 16 Test Case 1 0-Lowering of Vapor Pressure by NaNO, , NaOH. NaHSO,. and NaHCO, in Aqueous Solutions at 100 "C [212 O F ] Using Private Databases . 16
5.9
5.1 0
6 CONCLUSIONS . . . . . . . . . . . . . . . . . . . . . . . . . . . . . . . . . . . . . . . . . . . . . . . . . . . . . 17
7 REFERENCES . . . . . . . . . . . . . . . . . . . . . . . . . . . . . . . . . . . . . . . . . . . . . . . . . . . . . . 17
APPENDIX-CASE DATA FILES
iii

w
TABLES
ls
Table Page
1 2
3
4
5
6
7
8
9
Comparison of the Calculated NaCl Solubilities with the Experimental Values . . . . . . . 4 Comparison of Experimental and Calculated Solubility of NaCl and/or KCI in Mixed NaCI-KCI Solutions . . . . . . . . . . . . . . . . . . . . . . . . . . . . . . . . . . . . . . . . . . . . . . . 5 Comparison of Experimental and Calculated Solubility of MgCI, in CaCI,-KCI-NaCI Solutions . . . . . . . . . . . . . . . . . . . . . . . . . . . . . . . . . . . . . . . . . . . . . . . . . . . . . . . . . . . . . 8 Comparison of Experimental and Calculated Vapor Pressure of KCI Solutions
Comparison of Experimental and Calculated Vapor Pressure of CaCI, Solutions at100°C[2120F] . . . . . . . . . . . . . . . . . . . . . . . . . . . . . . . . . . . . . . . . . . . . . . . . . . . . . 10 Comparison of Experimental and Calculated Vapor Pressure of NaNO,, NaOH, and NaHSO, Solutions at 100 "C [212 OF] . . . . . . . . . . . . . . . . . . . . . . . . . . . . . . . . . . . . . . 1 1 Comparison of Experimental and Calculated Deliquescence Relative Humidity of NaN0,-NaCI-KNO, Mixture at 86 "C [186.8 OF] . . . . . . . . . . . . . . . . . . . . . . . . . . . . . . 12 Comparison of the Calculated pH and Potential Values with the Data from Published Literatures . . . . . . . . . . . . . . . . . . . . . . . . . . . . . . . . . . . . . . . . . . . . . . . . . . 13 Comparison of the Calculated Solubilities with the Experimental Values for Concentrated NaNO, and NaOH Solutions . . . . . . . . . . . . . . . . . . . . . . . . . . . . . . . . . 16
at300°C[5720F] . . . . . . . . . . . . . . . . . . . . . . . . . . . . . . . . . . . . . . . . . . . . . . . . . . . . . . 9

ACKNOWLEDGMENTS
This report was prepared to document work performed by the Center for Nuclear Waste Regulatory Analyses (CNWRA) for the U.S. Nuclear Regulatory Commission (NRC) under Contract No. NRC-02-02-012. The activities reported here were performed on behalf of the NRC Office of Nuclear Material Safety and Safeguards, Division of Waste Management. The report is an independent product of the CNWRA and does not necessarily reflect the views or regulatory position of the NRC.
The author thanks J. Gonzalez for her assistance in preparing this report. The author is also grateful to R. Pabalan for technical discussions, and to L. Browning and W. Patrick for their reviews of the manuscript.
QUALITY OF DATA, ANALYSES, AND CODE DEVELOPMENT
DATA: No data were generated for this report.
ANALYSES AND CODES: This report documents quality assurance software validation activities for ESP 6.6ESP2.3, StreamAnalyzerl.2, and ESPCB 7.0. These software packages were developed by OLI systems. Calculation results are documented in Scientific Notebook 572.
vi i

1 SCOPE OF THE VALIDATION
This report documents the validation of the following OLI simulation software packages: Environmental Simulation Program (ESP) Version 6.6/Corrosion Simulation Program (CSP) 2.3, StreamAnalyser 1.2 and Environmental Simulation Program for Concentrated Brines (ESPCB) Version 7.0, as described in the software validation test plan (Yang, 2002). These software packages are the recent versions of the simulation programs. The validation test plan was for earlier versions of the software packages that were available at the time the plan was prepared. Because there are no significant difference between the newer and the older versions of these software packages, the test plan for the older versions of the package was used to validate these newer versions. The validation involved comparing calculated results with experimental data available in the literature.
ESP/CSP, StreamAnalyzer, and ESPCB are different packages of the simulation family developed by OLI Systems, Inc. (Morris Plains, New Jersey). ESP is for evaluating the thermodynamic properties of different streams in a chemical process in industrial and environmental applications. ESP has a large database of thermodynamic parameters and represents standard-state properties using the Helgeson-Kirkham-Flowers (1 981 ) equation-of- state and excess properties using the aqueous activity coefficient expressions developed by Bromley (1 972) and Pitzer (1 973, 1991). These models enable simulation of aqueous chemical systems using ESP for temperatures to 300 "C [572 O F ] , pressures to 1,500 atm [2,204 psi], and ionic strengths up to 30 molal. CSP is for evaluating the thermodynamic properties that are related to the characteristics of corrosion and the corrosion rate of a metal in a given solution system. A regular ESP/CSP package contains both the ESP and CSP components. StreamAnalyzer is essentially a component of the ESP and packaged as a stand-alone software for evaluating the thermodynamic behavior of components of a single aqueous stream. StreamAnalyzer has been added with a user-friendly graphic interface. ESPCB is a special version of ESP specifically developed for Southwest Research Institute@, which contains an additional Mixed Solvent Electrolyte Model and some additional new data. ESPCB is suitable for use in highly concentrated salts (close to or above 30 molal).
The scope of the validation was within the following ranges:
Temperature: 0 to 300 "C [0-572 OF] Pressure: Ionic Strength:
0 to 1500 atm (saturation pressure of water) [0-2204 psi] 0 to 30 molal for the ESP 6.6, CSP 2.3 and StreamAnalyzer 1.2 0 to 50 molal for ESPCB 7.0 Alfa
The validation for CSP is limited to stability diagram calculation. The calculation for corrosion rate is not part of this validation.
2 SYSTEM REQUIREMENTS
2.1 Software
The family of the OLI simulation packages ESP Version 6.6/CSP Version 2.3, StreamAnalyser Version 1.2, and ESPCB Version 7.0 Alfa run in a Windows environment (95, 98, 2000, Me and NT). The validation test was conducted in Windows 2000.
1

2.2 Hardware
The family of the OLI simulation packages ESP Version 6.6/CSP Version 2.3, StreamAnalyzer Version 1.2, and ESPCB Version 7.0 Alfa run on the IBM PC family of microcomputers or compatible systems. According to the license agreement for PC users, the software can be installed on many computers. However, a hardware key is required on the microcomputer that runs the program. With only one hardware key issued to a license holder, only one user is allowed to use the software at a given time. The family of the OLI simulation packages can also run on a network. With a network license, the program can be run by users at different computers on the network. However, only one user is allowed to use the software at any given time. The validation test was conducted with a Pentium Ill PC.
The input and output parameters can be printed to either a printer or a text spreadsheet file. The CSP and StreamAnalyzer also support graphical output to printers.
3 PREREQUISITES
Running the OLI simulation packages and compiling the results as a spreadsheet file requires spreadsheet software, such as MS Excel 97.
4 ASSUMPTIONS AND CONSTRAINTS
The user of OLI packages is assumed to be familiar with chemical thermodynamics.
The ESP 6.6ESP2.3 and StreamAnalyser 1.2 are based on the standard-state properties using the Helgeson-Kirkham-Flowers (1 981 ) equation-of-state and excess properties using the aqueous activity coefficient expressions developed by Bromley (1 972) and Pitzer (1 973,1991). The software has the following limitations:
Water content: Temperature: Ionic Strength: Pressure:
> 65 percent (Molar basis) -50 to 300 OC [- 122 to 572 OF] 0 to 30 molal 0 to 1500 atm [0 to 2,204 psi]
The limitations for the ESPCB 7.0 Alfa are:
Water content: Temperature: Ionic Strength: Pressure:
up to 100 percent (Molar basis) -50 to 300 "C [- 122 to 572 O F ] up to fused salts 0 to 1,500 atm [0 to 2,204 psi]
2

U V
5 TESTCASES
The test cases described in this section involve calculations of mineral solubilities and vapor pressures of salt solutions and salt mixtures in the temperature range of 0 to 300 "C [32 to 572 OF].
5.1 Test Case 1-NaCl Solubility as a Function of Temperature
The solubility of NaCl(s) was calculated from 25 to 300 "C [77 to 572 OF] to verify if the ESP6.6KSP2.3, StreamAnalyzer 1.2, and ESPCB 7.0 can be used to accurately calculate the solubility of a single salt at different temperature conditions.
5.1.1 Test Input
Input temperatures were 25, 50, 75, 100, 125, 150, 175, 200, 225, 250, 275, and 300 "C. Below 100 "C [77, 122, 167, 21 2, 257, 302, 347, 392, 437 and 572 OF], the input pressure was 1 .O atm [14.7 psi]. At 100 OC [212 OF] and above, the input pressure was the vapor saturation pressure at the temperature of interest.
5.1.2 Test Procedure
The test was run by specifying the calculation types as constant pressure at temperatures lower than 100 "C [212 OF] and bubble point at temperatures equal or above 100 "C [212 OF].
5.1.3 Test Results
The results of calculations with ESP6.6ESP2.3, StreamAnalyserl.2 and ESPCB7.0 Alfa were saved to three files named ESP-Case1 .XIS, StreamAnalyser-Case1 .XIS, and EXPCB-Case1 .XIS, respectively (see Appendix). These files list the temperatures and pressures used in the calculation, the resulting ionic strength, and the calculated concentrations of Na+ and CI-. The calculated Na+ (or CI-) concentrations were compared with experimental data given in Liu and Lindsay (1 972) and Linke (1965), as shown in Table 1. The deviation (%Dev) of the test results from the experimental data are within ~ 1 0 percent and, therefore, are acceptable. The A 0 percent criterion is arbitrarily set in the validation test plan because + l o percent variation in concentration would not significantly affect the estimated performance of the engineered barrier system in the repository system.
5.2 Test Case 2-NaCI and/or KCI Solubility in Mixed NaCI+KCI Solutions
The solubility of NaCl and/or KCI was calculated at different temperatures and compared with experimental data. The test was to determine the ability of the OLI software to accurately calculate the solubility of a mineral salt in a solution containing two types of dissolved salts and at different temperature conditions.
5.2.1 Test Input
Input temperatures was 40, 100, and 150 "C [104, 21 2, and 302 O F ] . Below 100 "C [212 O F ] , the input pressure was1 .O atm [14.7 psi]. At 100 "C [212 OF] and above, the input pressure was the
3

SOFTWARE SUMMARY FORM
01. Summary Date: 07/06/04
04. Software Date: 2003
02. Summary prepared by (Name and phone) L. Yang (210) 522 2483
05. Short Title:
I
08. Software Type:
0 Automated Data System
Computer Program
0 Subroutinehlodule
OLI ESP 6.6, ESPCB 7.0 alfa, CSP 2.3 and
cessing Mode: 7 Interactive
CI Batch
0 Combination
1 1. Submitting Organization and Address:
CNWWSwRI 6220 Culebra Road San Antonio, TX 78228
13. Software Application:
03. Summary Action:
Updating
07. Internal Software ID:
10. Application Area
~ c ~ ~ & c / E n g i n e e r i n g 0 Auxiliary Analyses 0 Total System PA CI Subsystem PA 0 Other
b. Specific:
_ _ _ ~ ~~
12. Technical Contact@) and Phone:
L. Yang (210) 522 2483 R. Pabalan (210) 522 5304
This software predicts the speciation of an aqueous solution and the stability of metals in at given chemistry conditions.
14. Computer Platform
PC
18. Computer Memory Requirements :
40 MB
15. Computer Operating System:
16. Programming Language( s) :
9812000 I NIA
19. Tape Drives:
NIA
20. Disk Units:
22. Other Operational Requirements
16 MB RAM
17. Number of Source Program Statements:
NIA
2 1. Graphics:
NIA
23. Software Availability: 0 Available a Limited 0 In-House ONLY 0 In-House ONLY
25.
Software Developer : -0LI Systems, Inc. Date:

Table 1. Comparison of the Calculated NaCl Solubilities wi
S.A. Calc. S(m) 6.15 6.28 6.47 6.69 6.95 7.25 7.58 %Dev 0.09 0.15 0.10 0.15 0.24 0.71 0.16
:h the Experimental Values 200 I 225 I 250 I 275 I 300 7.97 I 8.44 I 8.99 I 9.65 I 10.41 7.961 8.391 8.891 9.461 10.16
-0.121 -0.501 -1.141 -1.91 1-2.41 7.98 I 8.35 I 8.78 I 9.33 I 10.22 0.04 I -0.97 I -2.33 I -3.31 I -1.86 7.96 I 8.39 I 8.89 I 9.46 I 10.16
-0.121 -0.501 -1.141 -1.91 1-2.41 ~~ ~
*Compiled data are from Pabalan, 2002; original data are from Linke, 1965; for Tc75 "C and Liu and Lindsay, 1972 for T>75 "C.
References:
Linke, W.F. Solubilities of Inorganic and Metal Organic Compounds. Vols. 1 and 2. 4th Edition. Washington, DC: American Chemical Society. p. 1,070. 1965.
Liu, C. and W.T. Lindsay. "Thermodynamics of Sodium Chloride Solutions at High Temperatures." Journal of Solution Chemistry. No. 1. pp. 45-69. 1972.
Pabalan, R.T. "Software Validation Report for Solcalc, Version 1 .O." San Antonio, Texas: CNWRA. 2002.
vapor saturation pressure at the temperature of interest. When the solubility of NaCl was calculated, a fixed value of K' concentration and an extra amount of NaCl were specified in the input stream. On the other hand, when the solubility of KCI was calculated, a fixed value of Na' concentration and an extra amount of KCI were specified in the input stream. The solubilities of the two salts in the eutonic solution of NaCl and KCI were calculated by specifying extra amounts of both NaCl and KCI in the input stream.
5.2.2 Test Procedure
The test was run by specifying the calculation types as constant pressure at temperatures lower than 100 "C [212 O F ] and bubble point at temperatures equal or above 100 "C [212 O F ] .
5.2.3 Test Results
The results of calculations with ESP6.6KSP2.3, StreamAnalyserl.2, and ESPCB7.0 Alfa were saved to three files named ESP-Case2.xls, StreamAnalyser-Case2.xls, and EXPCB-Case2.xls, respectively (see Appendix). These files list the temperatures and pressures used in the calculation, the resulting ionic strength, and the calculated concentrations of Na', K'and CI-. The calculated Na', K', (or CI-) concentrations were compared with experimental data given in Linke (1965), as shown in Table 2. The deviations of the test results obtained with the ESP 6.6 and StreamAnalyzer 1.2 from the experimental data are within * lo percent and, therefore, considered acceptable for ESP 6.6 and StreamAnalyzer 1.2. The A 0 percent criterion is arbitrarily set in the validation test plan because + l o percent variation in concentration would not significantly affect the estimated performance of the engineered barrier system in the repository system. However, the deviation for ESPCB are beyond the * lo percent target even at 40 "C [ lo4 O F ] . Therefore, ESPCB is not acceptable for solubility calculations with the NaCI-KCI-H,O system. The vendor acknowledges that there was a
4

ESP ESPCB
Calc.
6.225
5.795
5.540
5.389
5.016
6.690
%Dev
0.121
-0.109
-0.671
-0.377
-2.031
0.153
2.167
2.651
4.1 19 -3.764 4.373
- 4.322 -
0.660
0.1 70
- 3.342 -
2.992 -8.773 3.286
Table 2. Comparison of Experimental and Calculated Solubility of NaCl and/or KCI in Mixed NaCI- KCI Solutions
40
5.694 I -0.957 100
4.856 I 1.361
4.832 I -2.188
7.249 I 0.711
5.439 I -4.545 150
4.953 I -4.476
Solubility of KCI (m)
I ESP I ESPCB I StreamAnalyzer
Calc. %Dev I Calc. I %Dev Calc. %Dev mNaCl I Measured* (m)
~~~~~ ~ ~
4.333 I 5.363 I -0123 I 5.603 0 1 5.37 5.603 4.333
1.748 I 4.28 4.373 2.1 68
1.827 I 4.21 4.322 2.652 40
3.486 I 3.32 3.342 0.659
3.592 I 3.28 3.286 0.171
0 1 7.54 7.688 1.958 I 7.530 I -0.131 I 7.688 1.959
1.717 I 6.44 6.440 0.000 I - I - I 6.440 0.001 100
1.744 I 6.32 6.421 1.606 I - I - I 6.422 1.607
2.567 I 5.90 5.874 -0.437 I 5.552 I -5.899 I 5.874 - 0.435
5

0 9.02 9.382
1.71 1 8.13 8.156
150 2.567 7.64 7.592
3.422 7.15 7.063
4.278 6.71 6.570
4.008 9.114 -9.092 9.382 4.009
0.317 - 1.041 8.156 0.318
7.592 -0.634 -0.634 7.094 - -1.218 _. -7.150 7.063 -1.218
-2.087 5.943 -11.429 6.570 -2.087
Measured*
5.008
Calc. %Dev
4.996 - 0.232
Calc.
2.611
4.668
6.381
2.325
4.338
5.943
2.611
4.668
6.381
%Dev
-0.601
-1.398
-2.096
- 1 1.501
-8.355
-8.820
-0.602
-1.397
-2.095
Table 2. Comparison of Experimental and Calculated Solubility of NaCl and/or KCI in Mixed NaCI- KCI Solutions (continued)
Solubility of NaCl and KCI in a NaCI-KCI Mixture
KCI 5 NaCl Solubility (m)
Measured* Calculation
ESP 40 2.627
100 4.734 4.708 I 4.610 I -2.075
150 6.51 8 4.791 I 4.624 I -3.491
ESPCB 40 2.627 5.008 I 4.897 I -2.224
100 4.734 4.708 I 4.361 I -7.380
4.791 I 4.178 I -12.788 150 6.51 8
5.008 4.996 - 0.232
4.708 4.610 -2.075 I 4.791 4.624 - 3.492
Stream Analyzer
40 2.627
100 4.734
150 6.51 8
*Data are from Pabalan, 2002; original data from Linke, 1965.
References:
Linke, W.F. Solubilities of lnorganic and Metal Organic Compounds. Vols. 1 and 2. 4th Edition. Washington, DC: American Chemical Society. 1965.
Pabalan, R.T. “Software Validation Report for Solcalc, Version 1 .O.” San Antonio, Texas: CNWRA. 2002.
problem with their data bank for some mixed salts for ESPCB 7.0 and claimed that the problem with the NaCI-KCI system has been resolved for their future release of the software.
5.3 Test Case 3-Solubility of MgCI, in CaCI,-NaCI-KCI Solutions
The solubility of MgCI, in CaCI,-NaCI-KCI solutions was calculated at 0 and 50 “C [32 and 122 O F ] and compared with experimental data. The test was to determine the ability of the OLI packages to accurately calculate the solubility of minerals in a solution containing multicomponent dissolved salts.
6

w w
5.3.1 Test Input
The input temperature was 0 and 50 OC [32 and 122 O F ] and the input pressure was 1 .O atm [14.7 psi]. The concentrations of Ca2', Na' and K' were varied, and the saturated concentration of Mg2' was calculated with a slight excess of MgCI, in the solid phase.
5.3.2 Test Procedure
The test was run by specifying the calculation type as isothermal.
5.3.3 Test Results
The results of calculations with ESP6.6ESP2.3, StreamAnalyser 1.2 and ESPCB7.0 Alfa were saved to three files named ESP-Case3.xls, StreamAnalyser-Case3.xls, and ESPCB-Case3.xls, respectively (see Appendix). These files list the temperature and pressure used in the calculation, the resulting ionic strength, and the calculated concentrations of Ca2', Na', K+, Mg2+, and CI-. The calculated Mg2+ concentrations were compared with solubility data given by Korin and Roy (1 988), as shown in Table 3. For ESPCB, the deviations of the test results from the experimental data are within d 0 percent and, therefore, are acceptable. However, for ESP and StreamAnalyzer, the deviations of the test data at a high CaCI, concentration (A .2 molal) are 15.4 percent, which is higher than the A 0 percent target. Therefore, ESP and StreamAnalyzer should be used with caution for solutions containing multi- component salts.
5.4 Test Case 4-Vapor Pressure of KCI Solutions at 300 OC [572 OF] as a Function of Concentration
The vapor pressure of KCI solutions as a function of concentration was calculated and compared with experimental data. The test was to determine the ability of the OLI packages to accurately calculate the vapor pressures of single alkaline-chloride solutions.
5.4.1 Test Input
The input temperature was 300 "C [572 OF] and the input pressure was the vapor saturation pressure at the temperature of interest. The input KCI concentrations were varied.
5.4.2 Test Procedure
The test was run by specifying the calculation type as bubble point.
5.4.3 Test Results
The results of calculations with ESP6.6KSP2.3, StreamAnalyserl.2, and ESPCB7.0 Alfa were saved to three files named ESP-Case4.xls, StreamAnalyser-Case4.xls, and ESPCB-Case4.xls, respectively (see Appendix). These files list the temperature and pressure used in the calculation, the resulting ionic strength, and the calculated concentrations of K' and CI-. The calculated KCI solution vapor pressure was compared with vapor pressure data from
7

U w
Table 3. Comparison of Experimental and Calculated Solubility of MgCI, in CaCI,-KCI-NaCI I Solutions I
Temp (“C)
50
0
*Korin, E.J. and A.S. Roy. “Heterogeneous Equilibrium in the Quinary System NaCI-KCI-MgCI,-CaCI,-H,O in 0-50 “C Temperature Range.” Journal of Chemical Engineering Data. Vol. 33. pp. 60-64. 1988.
Zarembo, et al. (1976), as shown in Table 4. The test results are considered acceptable because they are within i10 percent of experimental data.
5.5 Test Case 5-Lowering of Vapor Pressure by CaCI, in Aqueous Solutions at 100 “C [212 O F ] as a Function of Concentration
The vapor pressures of CaCI, solutions as a function of concentration were calculated and compared with experimental data. The test was to determine the ability of the OLI packages to accurately calculate the vapor pressures of alkaline-earth-metal chloride solutions.
8

Table 4. Comparison of Experimental and Calculated Vapor Pressure of KCI Solutions at 300 “C [572 OF]
0.966 1.392
I Vapor Pressure (Bar)
84.78 80.27 -5.32 80.10 -5.53 79.22 -6.56 83.32 79.19 -4.95 79.01 -5.17 79.19 -4.95
I ESP I ESPCB I StreamAnalyzer
I I I I I I
KCI Concentration (m) I Measured* I Calc. I %Dev I Calc. I %Dev I Calc. I %Dev 0.549 I 85.70 I 81.35 I -5.07 I 81.24 I -5.20 I 81.35 I -5.07
1.904 I 81.78 I 77.95 I -4.68 I 77.82 I -4.85 I 77.95 I -4.68 2.954 I 79.02 I 75.60 I -4.32 I 75.64 I -4.28 I 75.60 I -4.32 3.388 I 77.62 I 74.71 I -3.75 I 74.82 I -3.61 I 74.71 I -3.75
4.528 I 74.56 I 72.56 I -2.68 I 72.78 I -2.39 I 72.56 I -2.68
*Data are from Pabalan, 2002; original data are from Zarembo, et al., 1976.
References:
Pabalan, R.T. “Software Validation Report for Solcalc, Version 1 .O.” San Antonio, Texas: CNWRA. 2002.
Zarembo, V.I., N.A. Antonov, V.N. Gilyarov, and M.K. Fedorov. “Activity Coefficients of KCI in the System KCI-H20 at Temperatures of 150-350 “C and Pressures up to 1500 kg/cm2.” Journal of Applied Chemistry. Vol. 49. pp. 1,259-1,263. 1976.
5.5.1 Test Input
The input temperature was 100 “C [212 O F ] and the input pressure was the vapor saturation pressure. The input CaCI, concentrations were varied.
5.5.2 Test Procedure
The test was run by specifying the calculation type as bubble point.
5.5.3 Test Results
The results of calculations with ESP6.6ESP2.3, StreamAnalyserl.2, and ESPCB7.0 Alfa were saved to three files named ESP-Case5.xls, StreamAnalyser-Case5.xls and EXPCB-CaseS.xls, respectively (see Appendix). These files list the temperature and pressure used in the calculation, the resulting ionic strength, and the calculated concentrations of Ca2+ and CI-. The calculated CaCI, solution vapor pressure was compared with handbook vapor pressure data (Weast, 1984) as shown in Table 5. The deviations of the test results from the experimental data are within + lo percent and, therefore, considered acceptable.
9

ESP
CaCI, Concentration (m)
ESPCB Stream Analyzer
0.5 Measured*
0.978
0.948 1
Calc. %Dev Calc. %Dev Calc. %Dev 0.974 -0.339 0.975 -0.278 0.974 -0.340
0.946 -0.147 0.948 0.005 0.946 -0.147
2
0.781
0.682
3 0.776 -0.567 0.784 0.454 0.776 -0.567
- 1.578 0.671 -1.578 0.682 - 0.052 0.671 4
5 *CRC Handbook of (
0.875 I 0.871 I -0.380 I 0.876 I 0.162 I 0.871 I -0.380
0.580 I 0.568 I -1.918 I 0.579 I -0.021 I 0.568 I -1.919 :hemistry and Physics. Lide, D.R. ed. 77'h Edition. p. 5-109. 1997.
5.6 Test Case 6-Lowering of Vapor Pressure by NaNO,, NaOH, NaHSO,, and NaHCO, in Aqueous Solutions at 100 "C [212 O F ]
The vapor pressures of NaNO,, NaOH, NaHSO,, and NaHCO, solutions were calculated according to the validation plan. However, NaHCO, involves a large amount of CO, and it is not clear if the partial pressure of CO, was included in the measured pressure for the determination of the lowering of the vapor pressure in the original experiment. Therefore, the results from the NaHCO, solution were not used in this report. Only the calculated data for NaNO,, NaOH, and NaHSO, solutions were compared with the experimental data.
5.6.1 Test Input
The input temperature was 100 OC [212 O F ] and the input pressure was the vapor saturation pressure. The input concentrations of NaNO,, NaOH and NaHSO, were varied.
5.6.2 Test Procedure
The test was run by specifying the calculation type as bubble point.
5.6.3 Test Results
The results of calculations with ESP6.6KSP2.3, StreamAnalyserl.2, and ESPCB7.O Alfa were saved to three files named ESP-Case6.xls, StreamAnalyser-Case6.xls, and ESPCB-CaseG.xls, respectively (see Appendix). These files list the temperature and pressure used in the calculation, the resulting ionic strength, and the calculated concentrations of cations and anions. The calculated solution vapor pressures were compared with handbook vapor pressure data (Weast, 1984), as shown in Table 6. The deviations of the test results from the experimental data are within +IO percent and, therefore, considered acceptable, except in the case with NaHSO, at high concentrations for the ESP and StreamAnalyzer. The ESP and StreamAnalyzer for high concentrations of salt solutions (>IO molal) should be used with caution.
10

Table 6. Comparison of Experimental and Calculated Vapor Pressure of NaNO,, NaOH, and NaHSO, Solutions at 100 "C [212 O F ]
I Vapor Pressure of NaN03 Solution (atm)
NaN03 Concentration (m)
4 6
2
8 10
NaOH Concentration (m)
2 4 6 8 10
NaHSO, Concentration (m)
2 4 6 8 10
*CRC Handbook of
~
ESP ESPCB Stream Analyzer
Measured* Calc. %Dev Calc. %Dev Calc. %Dev
0.881 0.882 0.142 0.889 0.835 0.882 0.141 0.827 0.829 0.282 0.848 2.598 0.829 0.282
0.939 0.938 -0.173 0.937 -0.259 0.938 -0.174
0.779 0.778 -0.181 0.811 4.1 30 0.778 -0.181 0.738 0.730 -1.193 0.776 5.057 0.730 -1.193
Vapor Pressure of NaOH Solution (atm) ESP ESPCB Stream Analyzer
Measured* Calc. %Dev Calc. %Dev Calc. %Dev 0.937 0.930 -0.656 0.932 -0.528 0.930 -0.657 0.859 0.854 -0.533 0.856 -0.331 0.854 -0.534
- 0.245 0.773 0.771 -0.245 0.765 - 1.068 0.771 0.680 0.686 0.930 0.664 -2.337 0.686 0.928 0.587 0.603 2.694 0.562 -4.248 0.603 2.692
Vapor Pressure of NaHSO, Solution (atm) ESP ESPCB StreamAnalyzer
Measured* Calc. %Dev Calc. %Dev Calc. %Dev 0.938 0.929 -0.926 0.928 - 1.093 0.929 -0.926 0.868 0.848 -2.324 0.857 - 1.305 0.848 -2.324 0.805 0.762 -5.354 0.789 - 1.906 0.762 -5.355 0.750 0.688 -8.256 0.731 -2.531 0.688 -8.256 0.696 0.623 -10.402 0.676 -2.837 0.623 - 10.402
Chemistry and Physics. Lide, D.R. ed. 771h Edition. p. 5-109. 1997.
5.7 Test Case 7-Deliquescence Point of Mixed NaCI-NaNO, -KNO, Salts
The mutual deliquescence point of mixed NaCI-NaN0,-KNO, salts was calculated and compared with experimental data. The test was to determine the ability of the OLI Packages to accurately calculate the mutual deliquescence point of mixed salts.
5.7.1 Test Input
The input temperature was 86 OC [186.8 O F ] . The input concentrations of NaNO,, NaCI, and KNO, were specified such that undissolved NaNO,, NaCI, and KNO, were present in the output streams.
5.7.2 Test Procedure
The test was run by specifying the calculation type as bubble point.
11

5.7.3 Test Results
ESP ESPCB Measured* Calc. %Dev Calc. %Dev
43.4 53.2 22.7 46.8 7.8
The results of calculations with ESP6.6ESP2.3, StreamAnalyserl.2, and ESPCB7.0Alfa were saved to three files named ESP-Case7.xls, StreamAnalyser-Case7.xls, and ESPCB-Case7.xls, respectively (see Appendix). These files list the temperature and pressure used in the calculation, the resulting ionic strength, and the calculated concentrations of Na+ and NO,, Cl-, and K’. The calculated deliquescence points are the ratio between the vapor pressure of the three saturated salts and the vapor pressure of water or the activity of water directly reported in the StreamAnalyzer. The calculated values were compared with the deliquescence point measured in the experiments (Yang, et al., 2001), as shown in Table 7. The deviations of the test result obtained with the ESPCB from the experimental data are within A 0 percent and, therefore, considered acceptable. However, the deviations of the test results from both the ESP and the StreamAnalyzer are approximately 23 percent. This large discrepancy probably occurred because the ionic strength of the solution (26.2 calculated by ESPCB) was close to the upper limit of the ESP and StreamAnalyzer. Therefore, only ESPCB can be used to calculate the deliquescence properties of the salts. For those systems ESPCB does not support, ESP or StreamAnalyzer can only be used for qualitative analysis, such as examining the trend of the deliquescence as the compositions change.
Stream Analyzer Calc. %Dev 53.4 23.0
Pabalan, R.T., L.Yang, and L. Browning. “Effect of Salt Formation on the Chemical Environment of Drip Shields and Waste Packages at the Proposed Nuclear Waste Repository at Yucca Mountain, Nevada. ” CNWRA 2002-03. San Antonio, Texas: CNWRA. 2002.
5.8 Test Case 8-Stability Diagram for Nickel-Water System
The stability diagram of nickel-water system at 25 OC [77 O F ] was calculated and compared with a published stability diagram. The test was to determine the ability of the OLI ESP6.WSP2.3 to accurately calculate the stability diagram of metals in solution.
5.8.1 Test Input
The input temperature used was 25 “C [77 OF]. HCI and NaOH were used as the acid and base titrants, respectively, for pH adjustment. Only water was specified in the input stream. The concentration of Ni2+ was set at the trace species amount (1 x 1 0-6 M), which is specified in the Option menu under Trace Species Amount submenu.
12

5.8.2 Test Procedure
B C D
The test was run in the pH range of 0 to 14 and the potential range of - 1 .O to 2.0 V. An E-pH diagram under standard state (1 M activity for dissolved species) was produced.
5.44 6.03 -0.59 0.63 0.52 0.10 5.46 6.04 -0.58 -0.21 -0.24 0.03 13.99 14.01 -0.02 0.71 0.59 0.1 2
5.8.3 Test Results
A hard copy of the output stability diagram (E-pH diagram) from the run with ESP6.6ESP2.3 is shown in Figure 1. A published E-pH diagram for the same system is shown in Figure 2 (Pourbaix, 1974). The important lines (2, 3, 6, 7, 9, 1 1, and 14) in the two diagrams are close to each other. Detailed comparisons between the calculated and the published potential and pH values for selected points are presented in Table 8. The deviations of the calculated potential results from the published data are within kO.15 V from values showing on the published E-pH diagrams, and thus considered acceptable. The deviations of the calculated pH results from the published data are less than kO.1 for data points D, E, and F. However, the deviation of the calculated pH results from the published data for points B and C are approximately 0.6. These data points (8 and C) involve Ni(OH), for which the reported thermodynamic data vary significantly (Bard, et al., 1985). The large variation in these data corresponds to a pH variation in the range of 5.4 to 7.1. Therefore, the deviations for pH values are also considered acceptable even though the acceptable pH error was originally set to k0.3 in the validation plan (Yang, 2002).
I Table 8. Comparison of the Calculated pH and Potential Values with the Data from Published I Literatures I I DH I Potential I I Data Point I Calculated I Reference* I Error I Calculated I Reference* I Error I
I E I 14.00 I 13.99 I 0.01 I 0.17 I 0.06 1 0.1 1 I I F I 14.00 I 13.99 I 0.02 I -0.74 I -0.72 I -0.03 I *Pourbaix, M. "Reference: Atlas of Electrochemical Equilibriua." 2nd Edition. p. 333. Houston, Texas: NACE International. 1974.
5.9 Test Case 9-Solubility of NaNO, and NaOH at Concentrations Beyond 30 M
The solubilities of NaNO, and NaOH salts were calculated and compared with experimental data. The test was to determine the ability of the ESPCB software to accurately calculate the solution properties of extremely concentrated aqueous solutions.
5.9.1 Test Input
The input temperature used was from 94 to 202 OC [201.2 to 395.6 O F ] . The input concentrations of NaNO, and NaOH were specified such that undissolved NaN0,and NaOH were present in the output streams.
13

2.0
1.4
0.8 n W I
W z
0.2
-0.4
-1 .o
0 2 4 6 8 10 12 14
Ni++ B
a
0 I
0 2 4 6 8 10 12 14 PH
2.0
1.4
0.8
0.2
-0.4
-1 .o
Figure 1. Calculated E-pH Diagram for Nickel-Water System
14

2
198
196
174
192
1
098
-096
Z -0,4
-0,2
0
-0,2
-0,4
-0,6
-0,8
-1
n
w
1 2 3 4 5 6 7 8 9 1 0 1 1 1 2 1 3 1 4 2 I I I I I I I I I 1; I I I I
k, 1
196
194
192
1
098
-096
-094
-0,2
-0
-092
-094
-0,6
-0,8
0 1 2 3 4 5 6 7 8 9 1 0 1 1 1 2 1 3 1 4 PH
Figure 2. E-pH Diagram for the Nickel Water System from Published Literature (Pourbaix, 1974)
15

5.9.2 Test Procedure
The test was run by specifying the calculation type as bubble point.
5.9.3 Test Results
The results of calculations with ESPCB7.0 Alfa were saved to EXPCB- Case9.xls (see Appendix). The file lists the temperature and pressure used in the calculation, the resulting ionic strength, and the calculated concentrations of Na’, NO,-, and OH-. The calculated solubility values were compared with the published solubility data (Linke, 1965), as shown in Table 9. The deviations of the test results from the experimental data are within *10 percent and, therefore, considered accept able.
Table 9. Comparison of the Calculated Solubilities with the Experimental Values for Concentrated NaNO, and NaOH Solutions
201.6 59.8 60.0 0.22
~~~ ~ ~
“Linke, W.F. and A. Seidell. “Solubilities of Inorganic and Metal-Organic Compounds K-Z.” Vol. I I , 4th Edition. Washington, DC: American Chemical Society. pp. 1,070 and 1,084. 1965.
5.10 Test Case 10-Lowering of Vapor Pressure by NaNO, NaOH, NaHSO,, and NaHCO, in Aqueous Solutions at 100 “C [212 O F ] Using Private Databases
This test case was specified in the validation test plan (Yang, 2002).
According to the user manual, in addition to the public database, OLI simulation packages contain several private databases such as Geochem, Ceramic, and Corrosion. In most simulations, the public database contains all the thermodynamic data that are required. However, there are cases where some species required in a simulation cannot be found in the public database. In this case, one or more private databases that contain the required species must be activated by the user. The OLI engine will search the private databases first (according to the sequence in the activated private list) for all the species involved in the simulation. If there are still species that are not found in the specified private databases, the public database will be activated. During the test, it was learned that data for a required species are only stored in one of these databases. If they are in the public database, they cannot be found in any of the other databases. This originally planned test case could not be completed and was cancelled.
16

6 CONCLUSIONS
OLI ESP6.6KSP2.3, StreamAnalyzer 1.2, and ESPCB 7.0 were tested in the following cases:
1. 2.
3. 4.
5.
6.
7. 8. 9.
Solubility of a single salt (NaCI) in the temperature range from 25 to 300 “C [77 to 572 O F ] .
Solubility of binary salts (NaCI and/or KCI) in the temperature range from 40 to 150 “C [ lo4 to 302 OF]. Solubility of MgCI, in CaCI,-NaCI-KCI Solutions at 0 and 50 “C [32 to 122 O F ] .
Vapor pressure of an alkaline chloride (KCI) solution at 300 “C [572 O F ] at concentrations up to 4.5 M. Lowering of vapor pressure by an alkaline-earth-metal chloride (CaCI,) in an aqueous solutions at 100 “C [212 O F ] at concentrations up to 5 M. Lowering of vapor pressure by a nitrate (NaNO,), a hydroxide (NaOH) and a bisulphate (NaHSO,) in aqueous solutions at 100 “C [212 OF]. Mutual deliquescence point of a multi-component salt mixture (NaCI-NaNO, -KNO,). Stability diagram for a metal (Nickel) in a water system (EPS 6.6KSP2.3 only). Solubility of a salt (NaNO,) and a hydroxide (NaOH) at concentrations beyond 30 M (ESPCB only).
Except for case 2, the results obtained with ESPCB 7.0 are acceptable. The vendor acknowledged that there was a problem with their data bank for some mixed salts (case 2) for ESPCB 7.0 and claimed that the problem with the NaCI-KCI system has been resolved for their future release of the software.
The results obtained with ESP6.6KSP2.3 and StreamAnalyzer 1.2 are acceptable for cases 1, 2, 4, 5, 8 and 9; but not acceptable for cases 3, 6, and 7. In cases 3, 6 and 7, the results are from 10 to 23 percent off the experimentally obtained data. Therefore, ESP6.6KSP2.3 and StreamAnalyzerl.2 should be used with caution for solutions containing multi-component salts or at ionic strength greater than 10 molal. When the ionic strength approaches the upper ionic strength limit of the software, 30 molal, ESP and StreamAnalyzer can only be used to perform qualitative analyses such as trend analysis.
7 REFERENCES
The following documents are referenced in this report.
Bard, A,, R. Parsons, and J. Jordan. “Standard Potential in Aqueous Solution.” Chapter 12. New York City, New York: Marcel Dekker Publishers. 1985.
Bromley, L.A. “Approximate Individual Ion Values of p (or B) in Extended Debye-Huckel Theory for Uni-Univalent Aqueous Solutions at 298.1 5 K.” Journal of Chemical Thermodynamics. Vol. 4. p. 669. 1972.
Helgeson, H.C., D.H. Kirkham, and G.C. Flowers. “Theoretical Prediction of the Thermodynamic Behavior of Aqueous Electrolytes at High Pressures and Temperatures IV Calculation of Activity Coefficients, Osmotic Coefficients, and Apparent Molal and Standard and Relative Partial Molal Properties to 600 “C and 5 kb.” American Journal of Science. Vol. 281. p. 1,249. 1981.
17

Korin, E.J. and A.S. Roy. “Heterogeneous Equilibrium in the Quinary System NaCI-KCI-MgCI,- CaCI,-H,O in 0-50 “C Temperature Range.” Journal of Chemical Engineering Data. Vol. 33. pp. 60-64. 1988.
Linke, W.F. Solubilities of Inorganic and Metal Organic Compounds. Vols. 1 and 2. 4th Edition. Washington, DC: American Chemical Society. 1965.
Liu, C. and W.T. Lindsay. “Thermodynamics of Sodium Chloride Solutions at High Temperatures.” Journal of Solution Chemistry. No. 1. pp. 45-69. 1972.
Pourbaix, M. “Atlas of Electrochemical Equilibriua in Aqueous Solutions.” 2nd Edition. J. Franklin, English translation. Houston, Texas: NACE International. p. 333. 1974.
Pitzer, K.S. “Thermodynamics of Electrolytes 1 : Theoretical Basis and General Equations.” Journal of Physics and Chemistry. Vol. 77. p. 268. 1973.
Pitzer, K.S. Activity Coefficients in Electrolyte Solutions. K.S. Pitzer, ed. 2nd Edition. Boston, Massachusetts: Chemical Rubber Company, CRC Press. pp. 75-1 53. 1991.
Weast, R.C., ed. Handbook of Chemistry and Physics. 64th Edition. Boston, Massachusetts: CRC Press. 1984.
Yang, L., R.T. Pabalan, and L. Browning. “Experimental Determination of the Deliquescence Relative Humidity and Conductivity of Multi-Component Salt Mixtures.” Scientific Basis for Nuclear Waste Management XXV. Symposium Proceedings Vol. 71 3. Boston, Massachusetts: Materials Research Society. pp. 135-1 42. 2001.
Yang, L. “Software Validation Test Plan for Environmental Simulation Program (ESP) Version 6.5/Corrosion Simulation Program (CSP) Version 2.2, Environmental Simulation Program for Concentrated Brine Solutions (ESPCB) Version 7.0 Alfa and StreamAnalyzer 1.2.” San Antonio, Texas: CNWRA. 2002.
Zarembo, V.I., N.A. Antonov, V.N. Gilyarov, and M.K. Fedorov. “Activity Coefficients of KCI in the System KCI-H20 at Temperatures of 150-350 “C and Pressures up to 1500 kg/cm2.” Journal of Applied Chemistry. Vol. 49. pp. 1,259-1,263. 1976.
18

V
Appendix
Case Data Files
The following data files are in the CD enclosed with this report
Results from ESP:
ESP-Case1 .XIS E S P-C ase2. XI s ESP-Case3.xls ESP-Case4.xls E S P-Case5. XI s E S P-Case6 .XI s ES P-Case7. XI s ES P-Case8. XIS
Test Results from ESPCB ESPCB-Case1 .XIS E S PC B-Case2. XI s ES PC B-Case3 .XI s ES PCB-Case4.xls ES PC B-Case5 .XI s ES PC B-Case6 .XI s ES P C B-Case7. XI s ES PCB-Case9 .XIS
Test Results from SteamAnalyzer
Stream Analyser-Case1 .XIS Stream Analyser-Case2.xls StreamAnalyser-Case3.xls, StreamAnalyser-Case4.xls, Stream Analyser-CaseS.xls, St reamAnalyser-Case6.xIs, St ream Anal yse r-Case7 .XIS,
19