Embed Size (px)
Citation preview

Evolution of Magnetic Setting in Flare Productive Active Regions
Yixuan Li
Space Weather Research LabNew Jersey Institute of Technology

March 10, 2010
Introduction
In recent years, it has been widely reported that photosphere magnetic fields can experience some rapid, significant and permanent changes during X-and M-class flares.
Wang et al. (2002) detected a permanent increase in the magnetic flux of the leading polarity and a decrease of smaller magnitude in the following polarity.
Sudol and Harvey (2005) conducted a survey of 15 X-class flares, and found that abrupt and persistent changes in the photospheric longitudinal magnetic fields are common features associated with X-class flares.

March 10, 2010
Introduction (Cont.)
The figure is from Liu et al. (2005)
Recent white-light (WL) observations demonstrated a consistent pattern of changes in sunspot structures (Wang et al. 2004; Deng et al. 2005; Liu et al. 2005; Chen et al. 2007).
March 10, 2010
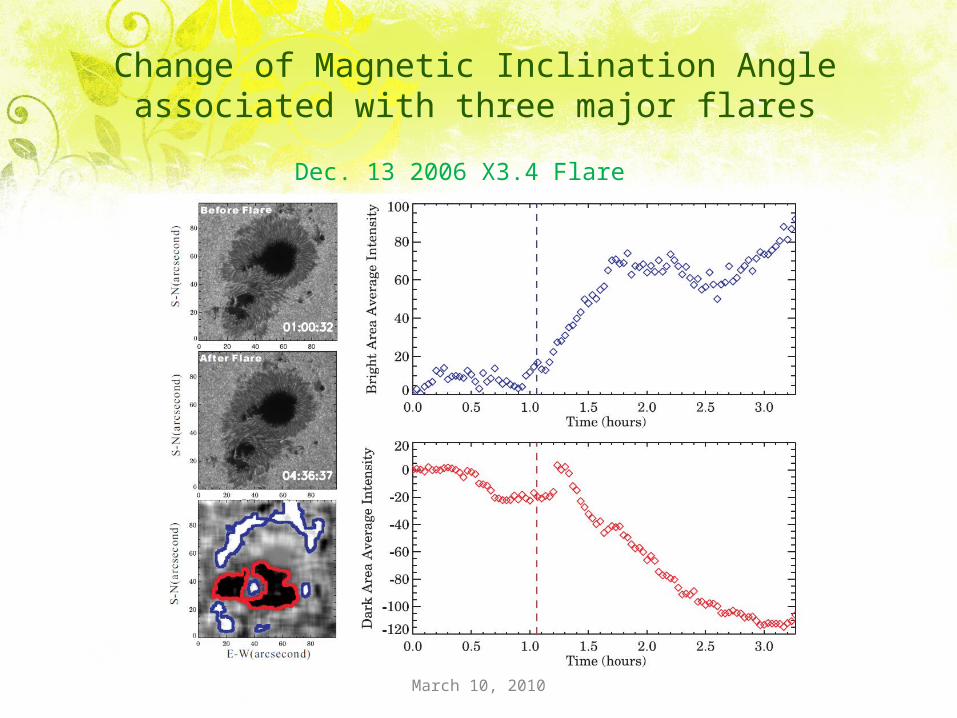
Change of Magnetic Inclination Angle associated with three major flares
Dec. 13 2006 X3.4 Flare

March 10, 2010
Change of Magnetic Inclination Angle associated with three major flares (Cont.) Distribution of Magnetic Inclination
Angle and Transverse Field Strength Decay Regions Enhance Region
March 10, 2010
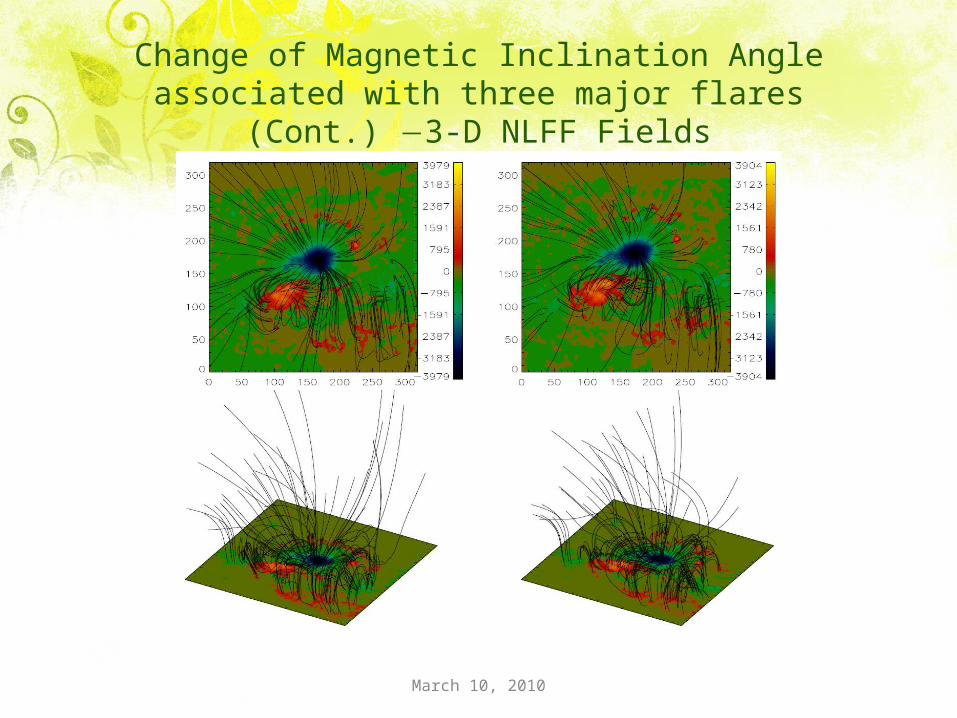
Change of Magnetic Inclination Angle associated with three major flares (Cont.) 3-D NLFF Fields

March 10, 2010
Change of Magnetic Inclination Angle associated with three major flares (Cont.) The Height Variation
Using the 3-D NLFF fields, we plot the mean value of magnetic inclination angle in the decayed (top) and enhanced(bottom) areas as a function of altitude for two time bins. Blue: Before the flare. Red: After the flare.

March 10, 2010
Jan. 15 2005 X2.6 FlareAug. 25 2001 X5.3 Flare
Left Top: TRACE WL images. The FOV is 160"×180". Left Middle & Bottom: The time variation of the mean magnetic inclination angle and transverse field in decayed area (blue) and enhanced area (red). The dotted curve is the time derivative of GOES X-ray flux. The vertical green and orange lines indicate the time ranges chosen to calculate the mean values before and after the flares. Right: same as left, except that the FOV of TRACE WL images is 300"×300".
Change of Magnetic Inclination Angle associated with three major flares (Cont.) Temporal Variation

March 10, 2010
Change of Magnetic Inclination Angle associated with three major flares (Cont.)
The Change of Different Parameters
Parameters
Magnetic Inclination
Angle θ (Degree)
Transverse Field
Strength Bt (Gauss)
Continuum Intensity I
(DN)
Doppler Width2
W (mA2)
Filling Factor
f
2006 Dec.13
X3.4 Event
Decayed Regions
↑~ 3.3º ↓~ 16% ↑~ 4% Barely change
↓~ 15%
Enhanced Regions
↓~ 5º ↑~ 20% ↓~ 7% ↑~ 9% ↑~ 10%
2001 Aug. 25
X5.3 Event
Decayed Regions
↑~ 5º ↓~ 17%
Enhanced Regions
↓~ 4.8º ↑~ 15%
2005 Jan. 15
X2.6 Event
Decayed Regions
↓~ 1.8º ↓~ 10%
Enhanced Regions
↓~ 2.7º ↑~ 21%

March 10, 2010
Data Sources for Current and Future Research
Instrument TemporalResolutio
n
Pixel Resolution
FOV Time Coverage
Hinode/SOT/SP1
Normally A few
hours
0.16" 300"×160"
From Sep. 2006
SDO/HMI2 12 minutes
1" Full disk Later this year
BBSO/DVMG3 1 min 0.6" 360"×360"
From 19991 Hinode/Solar Optical Telescope (SOT) / Spectral-polarimeter (SP)2Solar Dynamics Observatory (SDO) / Helioseismic and Magnetic Imager (HMI) 3 BBSO (Big Bear Solar Observatory) / Digital Vector Magnetograph (DVMG)
March 10, 2010
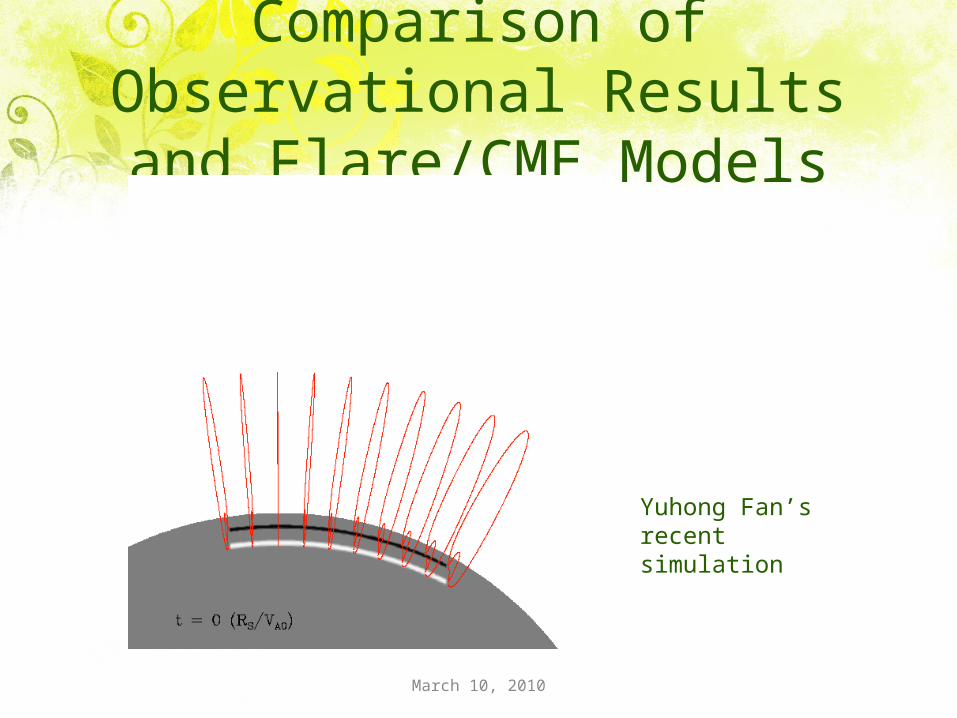
Comparison of Observational Results and Flare/CME Models
Yuhong Fan’s recent simulation

March 10, 2010
Comparison of Observational Results and Flare/CME Models (Cont.)
Level 5 transverse field Bt
March 10, 2010
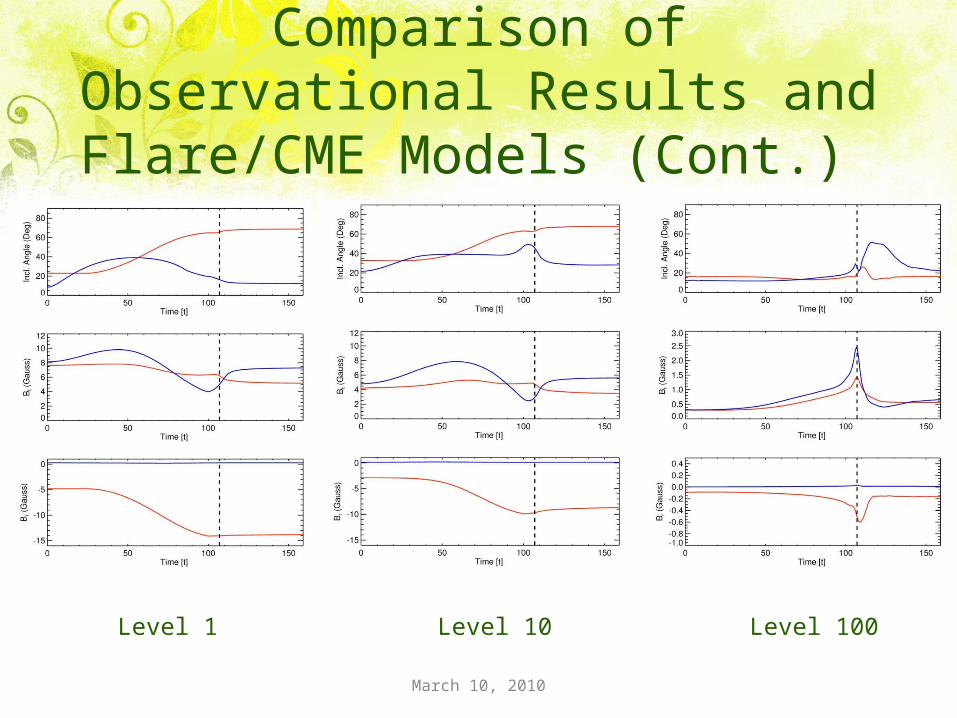
Comparison of Observational Results and Flare/CME Models (Cont.)
Level 1 Level 10 Level 100
March 10, 2010
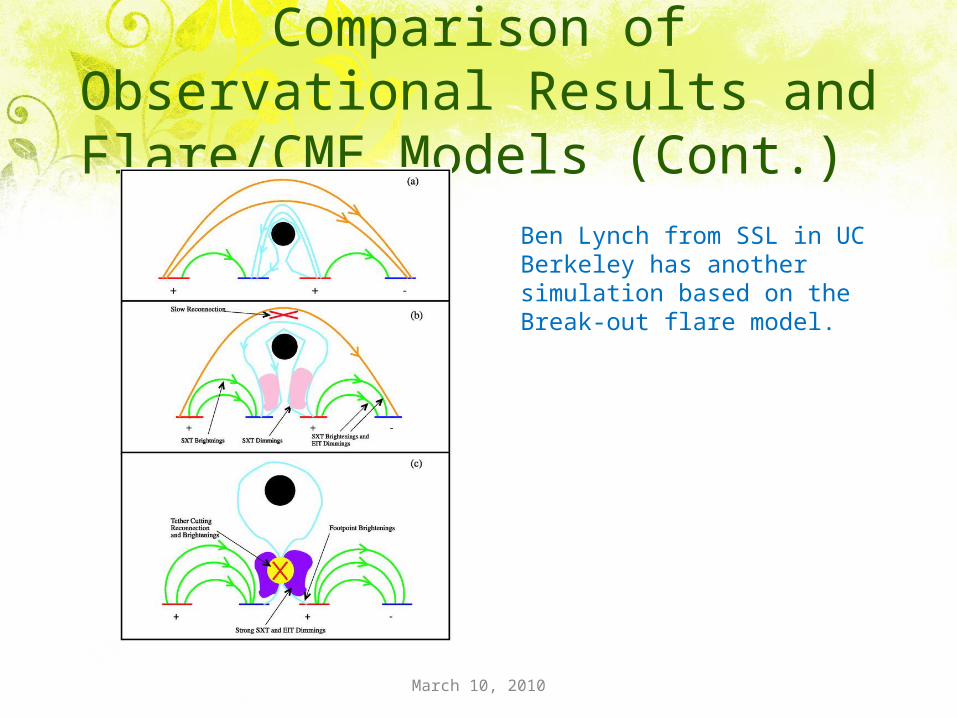
Comparison of Observational Results and Flare/CME Models (Cont.)
Ben Lynch from SSL in UC Berkeley has another simulation based on the Break-out flare model.
March 10, 2010
ConclusionAfter the flare, the mean inclination angle at the
inner penumbral/umbra enhanced regions decreases. The result suggests that inner penumbral fields change from a more vertical to a more inclined configuration after the flare.
We quantitatively compare our observations with recent MHD simulations of eruption, which shows the evidence of field lines turn to more horizontal near the surface, immediately following the eruption.