Embed Size (px)
Citation preview

..,
Lizard Ecology: Historical and
Experimental Perspectives.
L. J. Vitt and E. R. Pianka, Eds.
Princeton Univ. Press. 1994.
CHAPTER.6
PHYLOGENETIC PERSPECTIVES ON THE
EVOLUTION OF LIZARD TERRITORIALITY
· Emflia P .. Martins
The evolution of ecological and behavioral traits is difficult to study because of the absence of such traits from the fossi~ record. For example, variation in lizard territoriality both within and among species may be due to differences in Hfe-history patterns, availability of ecological resources, access to mates, or- ontogenetic and phylog~netic c;onstraints. Many studies at the intraspecific level have attempted to uncover reasons for differences among individuals, between the sexes, and across populations in territorial behavior using correlational analysis, experimental manipulations, and theoretical considerations (see reviews in Ca,rpenter 1967; Rand 1967; Stamps 1977, 1983). However, patterns of natural and sexual selection found within extant species may not be the same as those that have been operating through evolutionary time, and the hypotheses resulting from intraspecific ecological studies cannot easily be confirmed through reference to the fossil record. At the interspecific level, studies of territoriality have been limited primarily to considerations of the importance of factors such as sexual dimorphism, foraging mode, and taxonomic status in the evolution of territorial behavior
, without any statistical means of taking phylogenetic information into account (e.g., see references above). In recent years, however, the development of new comparative analysis techniques and modem phylogenies make it possible to infer the patterns and processes of ecology and behavior in ways that were previously impossible. Here, I illustrate the use of such techniques to study the (1) eyolutionary origins, (2) adaptive function, and (3) evolutionary processes underlying lizard territorial behavior. This paper is not intended to serve as a review of the available literature on lizard territorial behavior {several important papers have not been included), and the results of the analyses included herein are decided.iy preliminary due to several limitations of the data and techniques that are described in greater detail below. Rather, the main goal of this paper is to illustrate ·the use of phylogenetic comparative techniques to a specific question in the evolution of lizard behavioral ecology, and to generate new hypotheses about the evolution of territoriality that lend insight .into fruitful areas for future research at both intra- and interspecific levels.
118 Lizard Ecology
Definitions of Territoriality
Noble (1939) defined a territory as "any defended area." Brown and Orians ( 1970) extended this definition by requiring that a territory satisfy three conditions. A territory must be (l)a ·fixed area that is (2) defended with behavioral acts that evoke escape or avoidance so that (3) the area becomes one of exclusive use with respect to rivals. Stamps. (1977) suggested that lizards defend only three types of areas: ( 1) all or a large portion of the home range, (2) small areas ,within the range such as basking or shelter sites, and (3) no specific geographic area, but a "personal s12ace'' surrounding the individual animal. Although only the first two of these have been traditionally consid.,. ered to be "territories," several species of lizards (e.g., most teiids and lacertids) fall into the .third ·category by displaying considerable aggression towards other individuals without consistently defending any particular geo-
graphic area. The second part of Brown and Orians' (1970) definition can ·also be
extended. Several authors (e.g., Pitelka 1959; Schoener 1968a; Rose 1982; . Smith 1985) have suggested that a territory is an area of exclusive use
whether or not behavioral aCts that evoke escape or avoidance are observed. Using this idea, I have developed a second categorization scheme to consider the different types of defense behavior or levels of aggression that are generally observed in lizards. First, lizards often engage in combat behavior -aggressive acts involving physical co~tact that may result in injury. Wrestling, biting, and other forms of direct physical aggression would fall into this category. Lizards also engage in a number of threat behavior patternsaggressive communicative 9-isplays produced in response to another animal but without physical contact or risk of injury. Agonistic or "challenge" pushup displays, "full shows," and other visual displays that are directed towards another animal but which are produced from a distance are examples of this category. Finally, lizards may defend particular areas using a combinat!on of indirect displays such as chemical signals or broadcast displays (e.g., "assertion" push-up displays) that evoke escape or avoidance. These indirect 'displays occur, in the absence of direct contact_ with other animals and when the defender is not at risk of injury.
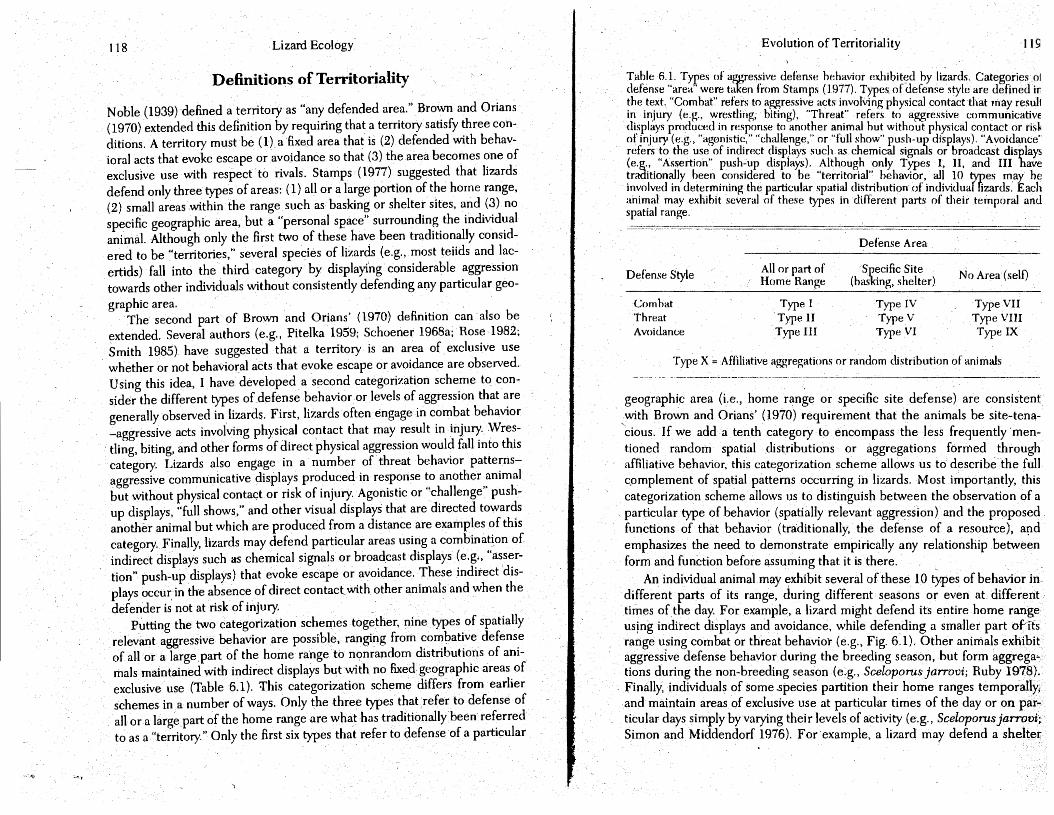
Putting the two categorization schemes together, nine types of spatially relevant aggressive behavior are possible, ranging from combative defense of all or a large part of the home range to n<;mrandom distributions of animals maintained with indirect displays but with no fixed geographic areas of exclusive use (Table 6.1). 'rhis categorization scheme differs from ·earlier schemes in a number of ways. Only the three types that refer to defense of all or a large part of the home range are what has traditionally been referred to as a "territory." Only the first six types that refer to defense of a particular
Evolution of Territoriality 119
Table 6.1. Types of aggressive defense behavior exhibit~::d by lizards. Categories ol defense "area" were taken from Stamps (1977). Types of defense style are defined ir the text. "Combat'' refers to aggressive acts involving physical contact that may resuJl in injury (e.g .. wrestling; biting), "Threat" refers to aggressive communicative displays produced in response to another animal but without physical contact or ris~ of injury (e.g., "agonistic," "challenge," or "full show" push-up displays). "Avoidance' refers to the use of indirect displays such as chemical signals or broadcast displays (e.g., "Assertion" push-up displaxs). Although only Types I, II, and III· nave traditionally been considered to be "territorial" behavior, all 10 types may be involved in determining the particular spatial distribution of individuaf fizards. Each animal may exhibit several of these types in different parts of their temporal and spatial range.
Defense Area
Defense Style All or part of Home Range
;S~ecific Site (ha.<~ ing, shelter) No Area (self)
Com hat Type I Type rv Type VII Threat Type II TypeV Type VIII Avoidance Type III Type VI Type IX
Type X= Affiliative aggregations or random distribution of animals
geographic area (i.e., home range· or specific site defense) are consistent with Brown and Orians' (1970) requirement that the animals be site-tena
.. cious. If we add a tenth category to encompass the less frequently men-tioned random spatial distributions or aggregations formed through affiliative behavior, this categorization scheme allows us tO describe the full c.omplemerH of spatial patterns occurring in lizards. Most importantly, this categorization scheme allows us to distinguish between the observation. of a particular type of behavior (spatially relevant aggr~ssion) and the proposed functions of that behavior (traditionally, the defense of a resoutce), afld emphasizes the need to demonstrate empirically any relationship between form and function before assuming that it is there.
An individual animal may exhibit several of these 10 types of behavior in, different parts of its range, during different seasons or even at. different times ofthe day. For example, a lizard might defend its entire home range· usjng indirect displays and avoidance, while defending a smaller part ofTts range using combat or threat behavior (e.g., Fig. 6.1) .. Other animals exhibit aggressive defense behavior during the breeding season, but form aggrega• tions during the non-breeding season (e:g., Sceloporos jarrovi;. Ruby 1978).
. finally, individuals of some .species partition their home ranges temporally,and maintain areas of exclusive use at particular times of the day or on particular days simply by varying their levels of activity (e.g., Sceloporos jarrovi; Simon and Middendorf 1976). Forexample, alizard may defend a shelter

; .,.
120 Lizard Ecology
N
t
Figure 6.1. Il~ustra~o~ ~f pos~ible ch~ng~s in the spatial distribution of territorial defense style m an mdivtdual hzard wtth hme.
site using combat behavior during most of its "inactive" periods, exhibit threat displays toward intruders in a larger subset of its home range. during hours of the day when it is most active, and continuously defend its entire home range using indirect displays to encourage avoidance. Defense area, behavioral ·defense style, and spatia-temporal variation are all important components of a lizard's territorial behavior, and will contribute substantially
Evolution of Territoriality 121
to its ability to maintain a stable position in the overall spatial distribution of that species. Unfortunately, such detailed information on the territorial behavior of even a single species of lizard is rare.
I. Inferring the Origins of Lizard Territoriality
One common use of comparative studies in ecology is t~ infer the evolutionary origins of particular behavioral or ecological patterns. The evolutionary origins of territorial behavior can be inferred from comparative data using standard systematics techniques such as maximum parsimony and outgroup analys,is (e.g., Fitch 1971; ·see Maddison and Maddison 1992 for a summary of available techniques and friendly computer programs to conduct the analysis; and Brooks and McLennan 1991 for a general description of the use of parsimtmy reconstruction to infer the evolution of phenotypes). As with most comparative studies, all of these techniques require averaging over broad forms of within-species variati()n (e.g., individual, age, sex, seasonal, and population differences) and the assumption that differences among species, genera, families, or other taxonomic levels are substantially greater than differences within that level. 1 will discuss this problem at greater length below.
-Territory area
Data and methods
In her extensive review of the Hterature, Stamps ( 1977) found that despite some variation within families, most species of phrynosomatids and chamaeleonids (including former agamids) exhibit defense of large parts of their ·home ranges. In contrast, although anguids, teiids, lacertids, and varanids often exhibit aggressive behavior or defense of their immediate surroundings, they -do not generally defend specific geographic areas within their ranges. Scincids, xantusiids, and cordylids seem to be intermediate, and defend small parts of their ranges containing sheltering sites {this last categorization is so!llewhat questionable given the very small amount of information available about the territorial behavior of these lizard families). Gekkonids are somewhat ambiguous as they include some species that clearly exhibit home range defense and others that seem to have only spe· cific site defense. Although r have scored them as primarily having homt: range defense to conduct the analysis, this characterization is questionable (See Stamps 1977 and references therein for detailed descriptions. Mon recent information on the territorial behavior of many species of lizards :i available in several modem studies, but as the broad classification of lizart families is still roughly correct in the light of this new information~ I do no review that information herein.) /

;,.),., tl,
122 Lizard Ecology
Cb ~ .-§'
-~ Cb ~ r:' .,!Jj ~ 0 0 0 Cb e -~ 0 s ~ t1 gj 0 ~ 0 0
~ ~ ~ ~ ~ ~ ~ tJi. ~ ~ tJi ~ ~ tlj ;{;' .'fj 0 :;;: ~ 0!:: 0 ;.:s ~ -~ ~ .l:j .'fj s ~ ~ f::' C)-~* tJi dJ ~ ~ ~ s ~
gj ~ § ~ ~ ~ ~ ~ C) ~ ~ ~ ~--~ a a~~-~~~-~~~~~~§ I
Lacertiformes m
lguania
J~~ Angu,!morpha
l
Figure 6.2. Phylogeny for 14 lizard families for which there is information regarding the amount of area defended. Cladogram and metataxa names were develE>:red as a combination of information fr<?m Estes et at (1988) and Frost and Etheriage (1989), both of whom used morphological characters and parsimony algorithms to infer evolutionary relationships. lnformation,regarding spacing patterns is summarized by Stamps (1977), who considers three types of territorial behavior. Black refers to those families that exhibit defense of much or all of their home ranges. Dark gray refers to families that seem to exhibit defense of specific areas within their ranges (e.g., shelter sites, burrows, or basking sites). Light gray refers to those families that do not show defense of any particular geographic area. Standard parsimony reconstruction techniques were used to,infer the ancestral states of this character (see text for further explanation).
Although Stamps (1977) considered differences in territorial area defended by different families of lizards inthe context o~ Camp's (1923) classification of those families, the same data~an be used to infer the evolutionary origins of territory area if standard systematics techniques are used to overlay territorial behavior on a phylogeny. Essentially, parsimony reconstruction argues that evolutionary changes ·are rare, and that the ancestral state of a character in a group of organisms is likely to be the most common character exhibited by that group. W~ can recreate the ancestral state of a clade by beginning wi~h the most recent set_ of sister taxa (e.g., teiids and lac-
. ertids) and estimating the state of their most recent common ancestor (at Lacertiformes) as being equal tp the most common state observed in the set of sister taxa (no defense of a specific geographic area; see Fig. 6.2). This _ information is then used to infer the state of the next ancestor and so on.
In some ~ases, this simple procedure may not be sufficient to d~termine
- I Evolution ofTerritoriality 123
all ancestral states of a character in a phylogeny. For example, the ancestor of teiids, lacertids, and xahtusiids might exhibit either defense of no area (as do the teiids and lacertids) ot the defense of specific sites (as do the xantusiids). More generally, if equal· numbers of the sister t::pc:a exhibit different character states, more information is necessary to determine which of the sfates was shared by the hypothetical ancestor of the chide. Outgroup analysis can help to resolve these problems. For example, given that the next closest relatives of this dade (scincids and cordylids) exhibit specific-site defense, fewer total evolutionary changes would be required if the ancestor of teiids, lacertids, and xantusiids also exhibited_specific-site defense (see Brooks and McLennan 1991 for a general description of the uses of outgroup analysis). ,
· Ranking of the types of possible evolutionary changes or character "ordering" can also help resolve such problems. For example, using simple parsimony reconstruction and. outgroup analysis, the ancestor of all Autarchoglossa might have exhibited home range defense (as do the gekkonids), defe~se of no particular geographic area (as do the Anguimorpha), or specific-site defense (as do the other groups within the Autarchoglossa). Without further information, it is difficult to infer the state of this ancestral group. However, if we also assume that shifts from the defense of no geographic area to defense of specific sites are easier to produce and therefore more common than shifts. from the, defense of no area to full home range defense, it seems most likely that the ancestor of .the. Autarchoglossa will have exhibited specific-site defense, thereby providing a transition between the home range defense of the primitive ·ancestors and the defense of no particular area exhibited by the anguids and varanids. Various other options are' possible in the parsimonious reconstruction of .character evolution and numerous algorithms have been developed to estimate the states of all hypothetical ancestors on a phylogenetic tree from comparative data (see Maddison and Ma~dison 1993 for detailed descriptions of available algorithms).
!,{esults
Using c}ata reviewed by Stamp~ (1977), a phylogeny created combining work of Estes et al. (1988) and Frost and Etheridge (1989), and parsimony techniques described above, it is possible to infer evolutionary origins of the amount of area defended by lizards in general (Fig. 6.2). Given the preponderance of home range defense within the Iguania it seems highly likely that the ancestor of this group also had home rang~ defense. In fact, if the three types of territorial area are also assumed to lie on a continuum from defense of a large area to defense of no area at all it seems that home range defense was probably the primitive condition for all lizards. Furthermore, most eyolutionaiychanges that have occurred among lizards have involved decreases

•t ....
124 Lizard Ecology
in the amount of area defended. For example, at least two independent evolutionary changes from specific-site defense to defense of no fixed area are likely to have occurred-first in the divergence of the Lacertiformes ( teiids and lacertids) and second in the divergence of Anguimorpha (anguids and varanids-although lack of information regarding the latter group makes this conclusion rather tentative). A third evolutionary change probably led from home range defense to specific-site defense at the formation of the Autarchoglossa. More evolutionary changes are likely to have occurred_within the Gekkonidae and Chamaeleonidae to account for substantial variation within these families in the amo~nt of area defended, but further studies of these lizards would be needed to determine the details of such changes.
Assumptions and possible problems
The results of the analysis descr\bed above .should be considered cautiously as they depend on only a few main points, and changes in the available information regarding the behavior of certain lizard families could result in drastically different conclusions. First, although the conclusion that home range defense is the primitive condition for all Iguania is relatively robust to changes in the available data, the conclusion that home range defense is primitive to all lizards depends substantially on the home range
. defense. presumed to be characteristic of the Gekkonidae. For example, if the gekkonids as a family were categorized as having site-specific rather than home range defense, it would be impossible to infer the ancestral state of all lizards without reference to an outgroup {e.g., tuataras). In this situation, we would ~oriclude that the ancestor of all lizards probably exhibited the same type of behavior as the outgroup. Unfortunately, categorization of the Gekkonidae is difficult given the limited information available, and as stated earlier, many species of geckos seem to exhibit site-specific while ·others exhibit home range defense. As the inferred primitive condition for all lizards depends on the type of territorialit)! exhibited by the Gekkonidae (and possibly tuataras), it is likely to change ~~.s more data regarding these groups become available.
Similarly, conclusions regarding the placement of evolutionary changes on the-'phylogeny depend in large part on the assumption that site-specific defense is intermedia~e between defense of no geographic area and defense of entire home ranges, and on the observation of site-specific defense in xantusiids, scincids, and cordylids., Unfortunately, information about the specific mechanisms of tenitorial behavior including the costs of specific-site defense and aggression witheut defense of specific areas is also unknown, and it is difficult to justify the assumption behind the ordering of this character with real data. Furthermore, information on the areas defended by these three lizard families is sparse, and it is quite possible that further study will demonstrate that these groups do not actually exhibit true defense of spe-
Evolution of Territoriality 125
cific geographic areas. Changes in either the assumption of character ordering or the categorization of thes~ families could lead to dramatically different hypotheses regarding the _amount of area defended by hypothetical ancestral species and in·where specific evolutionary, changes occurred.
Suggestions for future r~search
Despite possible problems, results of this analysis lead to several suggestions of interesting areas for 'future research. First, since the parsimony reconst11.,1ction strongly suggests that defense of all or a large part of a home range is the primitive condition for all Iguania (and less strongly that home range defense is primitive for all lizards), one simple explanation for the existence of home range defense in modern Iguania is that the ancestors of this group also exhibited home range defense and that either there is- little genetic variation in the trait or selection has not acted sufficiently strongly to eliminate the behavior. An alternative hypothesis is that stabilizing selection may have acted to maintain the defense of home ranges. However, there is no direct evidence in the comparative data to· support this hypothesis, and the same patterns can easily be explained solely on the basis of phylogenetic history without need for further adaptive explanations. Selection is more likely to have acted in those species that do not exhibit home range defense, where there may have been a cost to th~ defense of home ranges leading to the adaptive loss of traditional territorial behavior. Thus, future studies of the mechanisms underlying the defense of home rang~s including the potential physiological or energetic costs to territorial defense ·may be particularly useful, as would be studies of the spatial behavior of geckos and chameleons that exhibit variation in the amount of area defended.
Comparisons of the ecologies of teiids and/or anguids to those of scincids and/or xantusiids may also be helpful in determining why defense of no area has evolved from site-specific defense. Further determination of the origins of home range defense in lizards might be better obtained through comparison of the social behavior of lizards to the· spacing patterns of tuataras, turtles, birds, or even mammals rather than solely through comparing the territorial behavior of different species of lizards. Although detailed studies of the territorial behavior of any single species may provide in.sight into the ·evolutionary fdrces that maintain ter:ritorial behavior, they are unlikely to say much about the origins of home range defense in this group because of the prolonged temporal distance from the evolutionary adoption of home range defense to extant species. Similarly, elucidation of the primary forces and any general patterns constraining and maintaining "true" territorial behavim in lizards is probabi¥ better obtained through examining spec:ies . withir those clades in which this type of territorial behavior is thought to be the pri· mary pattern (e.g., Phrynosomatidae and Agaminae). ·

'l
126 Lizard Ecology
Territory defense style
The same sort of analysis can be repeated looking at different types of defense behaV-ior (i.e., combat, threat, or indirect displays) rather than the amount of area that is defended. Unfortunately, there does not seem to be sufficient quantitative evidence in the literature to suggest that· different families of lizards use different- types of defense behavior preferentially. It may be that variation within families is comparable to, or even exceeds, variation among families and that a phylogenetic comparative study would not be useful ~t this level or simply that the available information is insufficient. Nevertheless, itis possible to look at this question at the genus or species level within a smaller clade. For example, all 13 species of Sceloporos for which data are available exhibit some sort of home range defense (see refer-
- ences in Table 6.2). Although S. orcutti and S. magister show very little . direct agonistic behavior, they are site-tenacious, and individual males and
females seem t~ maintain nonoverlapping home ranges through broadcast or other-..types of indirect displays (Type Ill; e.g., Mayhew 1963; Tanner and Krogh 1973; Tinkle 1976; Tinkle and Dunham 1986). Although very little has been published about the aggressive behavior of S. woodi, S. variabilis, and S. · clarkii, they seem to follow a similar pattern (Type III; Fitch 1973; Lee 1974; Tinkle and Dunham 1986; and pers. obs.). In contrast, both male and female S. jarrovi, S. poinsettii, and S. olivaceus exhibit combat and threat behavior in defense of large parts of their home ranges during the breeding season (Types -1 and II), but form nonagonistic aggregations in the winter Il)Onths (Type X; e.g., Blair 1960; Ballinger 1973a; Ruby 1977). The remaining species (S. merriami, S. graciosus, S. virgqtus, S. undulatus, and s. occidentalis) seem to be more toward the other extreme in which territories are defended aggressively throughout most of . their active se~sons using combat and/or threat behavior patterns (though the intensity of aggression may decrease somewhat after the breeding season; Types I and II; e.g., Milstead 1970; Vinegar 1975a; Rose 1982; Davis and Ford 1983; Martins 1991, 1993). -
Although Sceloporos are likely to be monophyletic (Wiens 19.93), specifics. of the phylogenetic relationships among Sceloporos ·are still under considerable debate (see Sites ~tal. 1992 for a review), and it is difficult to have much certainty in any one phylogenetic hypothesis. In one recent study, Mindell et al. (1989) provided a hypothesis of the phylogenetic relationships among species of 19 Sceloporos based on allozyme data that include 9 of the species considered in this study. In earlier work, Larsen and Tanner .(1974, 1975) provided an analysis of morphological data that include' the four remaining species (S. magister, $. woodi, S. orcutti, and S.- grdeiosus). A combination of. these, two hypotheses is presented in Fig. 6.3. This
Evolution of Territoriality 12~
Table 6,2. Means of the,measl1rements available from the literature of 13 species o Scelaporus lizards, used for interspecific comparisons in this study. In studie containing data from several populations or subspecies, each ~o{Julation was countec as a separate measurement. Esf!mates of body size from Fitc .1978) were includec in all cases. HR is home range.
Species HR Size Densi~ Body Size References
(m2) (lizards I a) (mm) ----
M F M F All MSVL FSVL
jarrovi 551 258 15 22 73 83 74 Ballinger 1973a; Ruby 1978 1981; Beuchat 1982; Rub) and Dunham 1984; Ruby and Baird 1994
graciosus 47 - - - 80 55 55 Stebbins1944; Tinkle 1973; Burkholder and Tanner 1974; Deslippe and M'Closkey 1991
virgatus 970 349 35 38 79 54 60 Smith 1981,1985; Rose 1981; Vinegar 1975a,b
undulatus 683 271 - - 25 59 63 Crenshaw 1955; Kennedy (unpubl. in Turner 1969); Ferrson and Bohlen 197 ; Tinkle 1972; Tinkle and Ballinger 1972; Ferner 1973; Vin1:ar · 1975a,c; Jones an Droge 1980; Tinkle and Dunham 1986; Jones and Ballinter 1987; Jones et al. 1987
olivaceus 684 293 - - 51 83 93 Blair 1960
variabilis 580 - - - - 66 53 Fitch 1978
occidental is 72 56 - - .'32 72 75 Tanner ,and Hopkin 1972; Davis and Ford 1983
merriami 201 84 56 56 112 52 50 Dunham 1980; Ruby and Dunham 1987b
poinsettii - - - - 96 116 97 Ballinger 1973a
orcutti 5385 3563 - - .57 102 92 Mayhew 1963; Weintraub (unpubl. in Tumt;rl969)
woodi - ,- - - 35 47 50 Jackson and Telford'J974;, Lee 1974
rrulgister - - - - 7 104 93 Parker and Pianka 1973; Tanner and Krogh 1973; Tinkle 1976
clarkii - - - - 24 103 '89 Tinkle and Dunham 1986
-f' ~
128 Lizard Ecology
phylogeny is alm{)st certainly imperfect and will change as systematists continue to work with this group of li7.ards. As the categories of defense style proposed above are also rather rough, available information for the different
, species is poor, and there is considerable within-species variability in the types of aggressive defense used (some of which is reviewed below), all results from this analysis should be considered with caution. Again, my purpose herein is not so !flUCh to reach firm conclusions regarding the evolution of territorial behavior, but to illustrate the use of certain techniques and generate new hypotheses for future research.
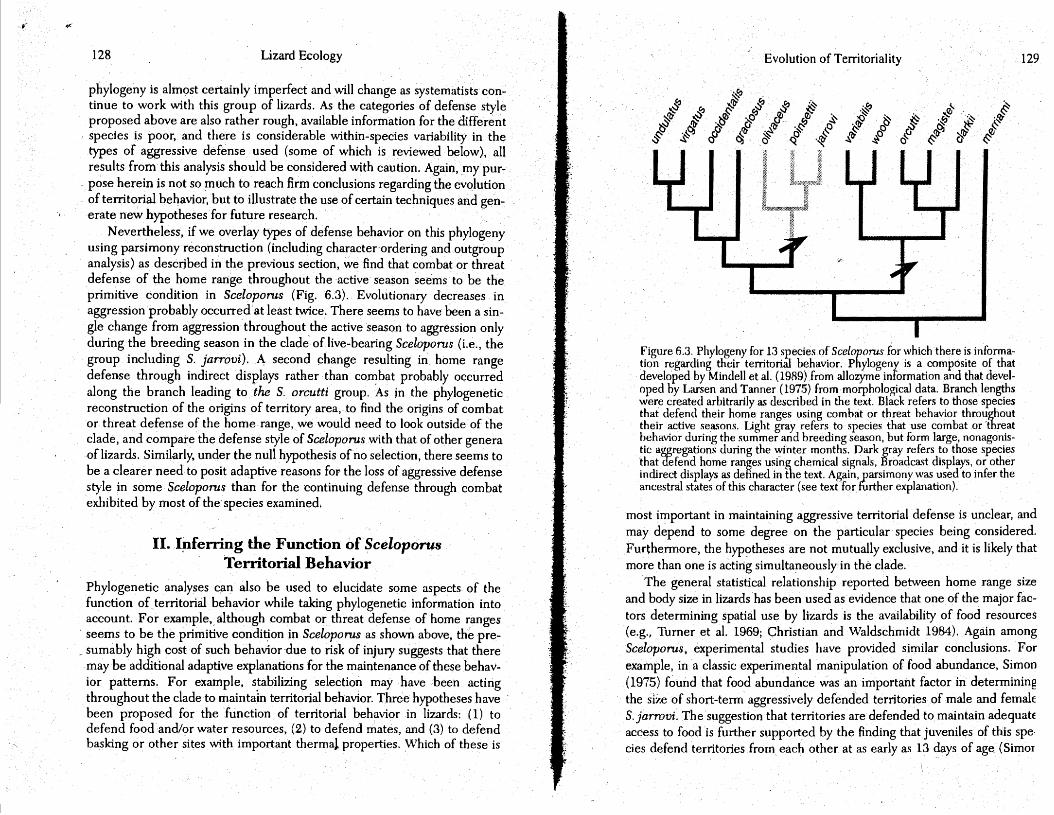
Nevertheless, if we. overlay types of defense behavior on this phylogeny using parsimony reconstruction (including character'ordering and outgroup analysis) as descrjbed in the previous section, we find that combat or threat defense of the home range throughout the active season seems to be the primitive condition in Sceloporus (Fig. 6.3). Evolutionary decreases ih aggression probably occurred at least twice. There seems to have been a single change from aggression throughout the active season to aggression only during the breeding season in the clade of live-bearing Sceloporos (i.e., the group including S. jarrovi). A second change resulting in home range defense through indirect displays rather than coll"!bat probably occurred along the branch leading to the S. orcutti group. As in the phylogenetic reconstruction of the origins of territory area, to find the origins of combat or threat defense of the home range •. we would need to look outside of the clade, and compare the defense style of Sceloporos with that of other genera of lizards. Similarly, under the null hypothesis ofno selection, there seems to be a clearer need to posit adaptive reasons fov the loss of aggressive defense style in some Sceloporos than for the continuing defense through combat exhibited by most of the species examined.
II. I~ferring the Function of Sceloporus Territorial Behavior
Phylogenetic analyses can also be used to elucidate some aspects of the function of territorial behavior while taking phylogenetic information into account. For example, although combat or threat defense of home ranges seems to be the primitive condi~on in Sceloporos as shown above, the presumably high cost of such behavior·due to risk of injury suggests that there may be additional adaptive explanations for the maintenance of these behavior patterns. For example, stabilizing selection may have been acting throughout the clade to maintain territorial behavior. Three hypotheses have · been proposed for the 'function of territorial behavior in lizards: ( 1) to defend food and/or water resources, (2) to defend mates, and (3) to defend basking or other sites with important thermal properties. Which of these is
Evolution of Territoriality
F, ~ F,
~qj ~ ~ gj
§ ~(;J)
~ . {Ji ~ ~ ~
G ·~" ~ F,(lj ;s. 'es-"(j # .~tfi ·~ ~0
Q ~ ~ ~ ·~ 0 ~ 0 '( ".-::
~ "~ .& ~ . . ~ .. ~ ....
w~~·~~~v ~ 0 ;) ~ ~... ~
~tr:r ~o &c.; ~tti atr:r fi
Figure 6.3. Phylogeny for 1.3 species of Sceloporus for which there is information regarding their territorial behavior. Phylogeny is a composite of that developed by Mindell et al. (1989) from allozyme information and that developed by Larsen and Tanner (1975) from morphological data. Branch lengths were created arbitrarily as described in the text. Black refers to those species that defend their home ranges using combat or threat behavior throughout their active seasons. Light gray refers to species that use combat or 'threat behavior during the summer and breeding season, but form large, nonagonistic aggregations during the. ~inter months. Dark gray refers to those species that defend home ranges using chemical signals, Broadca-;t displays, or other indirect displays as defined in the text. Again, parsimony was used to infer the ancestral states of this character (see text for further explanation).
129
most important in maintaining aggressive territorial defense is unclear, and may depend to some degree on the particular· species being considered. Furthermore, the hypotheses are not mutually exclusive, and it is likely that more than one is acting simultaneously in the clade.
The general statistical relationship reported between home range size and body size in lizards has been used as evidence that one of the major factors determining spatial use by lizards is the. availability of food resources (e.g., Turner et al. 1969; Christian and Waldschmidt 1984). Again among Sceloporos, experimental studies have provided similar conclusions. For example, in a classic experimental manipulation of food abundance, Simon (1975) found that food abundance was an important factor in determining the s17.e of short-term aggressively defended territories of male and female S. jarrovi. The suggestion that territories are defended to maintain adequat~ access to food is further supported by the finding that juveniles of this spe· cies defend territories from. each other at as early as 13 days of age (Simor

130 Lizard Ecology
and Middendorf 1980) and exhibit substantial aggression at a young age towards adults as well as to other juveniles (Ruby and Baird 1994). Agonistic behavior between different age classes may be held at a~minimum despite the substantial overlap between the_ home ranges of juveniles and adults by temporal and microhabitat partitioning of the home range (Simon and Middendorf 1976).
In contrast, the results of Ballinger (19'7.3a) and Ruby (1986) suggest that on a time scale longer than a few days there may be little or no relationship between availability of food and territory size for adult male S. jarrovi. These studies and the more detailed work of Ruby (1978, 1981) and Ruby and Baird (1994) suggest that the size of aggressively defended home ranges of adult male S. jarrovi may depend more on the number of females that they enclose than on any difference in food availability. Endocrinological studies seem to support this shggestion by showing that the aggressive territorial behavior of adult male_ S. jarrovi is mediated by testosterone and tightly linked to the reproductive behavior of these animals. Cycles of testosterone levels of male· S. jarrovi parallel the yearly cyCle of aggressive territorial defensewith testosteron~ levels reaching an all-tirrielow when the lizards are clumped in winter aggregations (Moore 1986; Ruby 1978). Males with testosterone implants have larger territories and exhibit more aggressive behavior (Moore 1988; Moore and Marler 1987), while castrated males show substat:Itially decreased levels of aggression' and have. smaller territorjes (Moore 1987). Males with testosterone implants also suffer greater mortality (Marler and Moore 1988) probably due to the higher energetic cost of increased aggressive territorial b!=lhavior (Marler and Moore 1991). Thus. although males, females. and juveniles may all·hold .some minimal territory to defend food resources, the aggressive territorial behavior of adult males is also linked to reproduction and is probably due at least in part to a need to. defend a large number of mates.
_ Variation in territoriality between the sexes and among different age classes has also been used to compare the importance of ecological to reproductive requirements. :For example, S, virgatus females have clearly defined territories without fighting, while males have larger home ranges with considerable overlap (Smith 1985). Male home range size was positively related to the frequency of courtship and mating behavior in this species, indicating the importance of mate defense in determining the need for male territoriality. Similarly, Rose (1981) found a substantial decrease in activity levels of adult males after the breeding season that would make it impossible for , males to defend areas of exclusive use after this period (although there was no corresponding decrease in aggression towards territorial intruders when the animals were actually active). This again suggests that territorial defense is for mates rather than for food resources. Variation in female. territories
Evolution of Territoriality 131
was not explained as easily. Smith (1985) found little relationship betWee1 body size and home range size in S. virgatus in either males or female (though this result may be due to a small sample size, it is almost statisticall: significant), suggesting that territories are not held to defend food resources Furthermore, females are usually larger in body size than are males, sug gesting that they would probably need larger rather than smaller territorie, than _males if their territories were used· primarily to defend food. Rose (1981) suggested that females may still be holding territories to defend foo< resources, but can maintain smaller territories by tolerating less home rang{ overlap.
Studies of S. graciosus, S. occidentalis, and S. rnerriamihave illustrated~ third factor by examining the importance of thermal requirements on lizarc spatial distributions and territoriality. Adolph {1990a,b) showed that micro, habitat use inS. graciosus and S. occidentalis depends both on theavailabil· ity of thermally suitable microhabitats and on species-typical preferences foJ particular microhabitat structures. Grant and Dunham (1988, 1990) anc Grant (1990) further showed that thermal requirements place a major con· straint on the activity levels of S. rnerriami resulting in significant populatior differences in growth rates, adult body si7.e, and age of first reproduction The specific importance of thermal requirements to te.rritorial behavior ha: not been studied in these ·species.
Other studies have not found conclusive evidence that either of tht other two proposed hypotheses (i.e., territories for food or territories fo: mates) explain all of the variation in territorial behavior or have had contra dictory results. Several have been unwilling to attribute a single function tc
·territoriality. In a ·classic series of competition experiments, Dunham (1980 showed-that population density of s. merriami is unrelated to the density 0
the sympatric Urosaurus, which are similar in size and ecological require ments and. would almost certainly compete, for food. Ruby and Dunhan (1987b) confirmed this suggestion by examining home ranges of S. rnerri ami, concluding that variation in home range size is not explained by any sin gle factor such as food availability, density of either sex, or ther~a requirements, but may be determined by a complex interaction of all three Similarly, Rose (1976) found no relationship between prey size and bod: size within either S. occidentalis or S. graciosus and no indication that hom• ranges varied with either ·body size or food availability. Davis and Fort
, (1983) also found no relationship between home range and body size in~ occidentalis when comparing animals of different age and sex classes. The concluded that male territories are probably used in 'part to defend femal€ as a decrease in aggressive behravior was observed after the breeding seaso had ended.
.Similarly, Deslippe and M'Closkey (1991) found no differences amon

t .1'
132 Lizard Ecology
S. graciosus home ranges in terms of food availability. Although they also found that experimental removal of female S. graciosus from male ranges did not lead to detectable changes in male home range size, they conclud~d that males may hold territories to guarantee long-term reproductive success. Ferguson et al. (1983) found that supplemental feeding of S. undulatus juveniles resulted in less overt aggression (i.e., territoriality), less dispersion, and no exclusive home ranges, suggesting that food -is a critical reason for maintaining territories. In contrast,Jones et al. (1987b) found no effect of supplemental food and/or water on hatchling home range size in the same species. At the population level, Tinkle (1972) found a density of S. undulatus on a Utah site at the edge of their range with several other species of lizards that were likely to be comp~titors (e.g., Uta, Cnemid.ophoros) that was about twice that found by Jones and Ballinger· ( 1987) for a population in Nebraska where mortality due to predation is low and food is probably not limiting. This result is contrary to what would be predicted if territories are being maintained to defend food resources.
Although there is ·little direct ·information on the territorial behavior of other species of Sceloporus, Ballinger (l973a) reports a pattern of territoriality in S. · poinsettii similar to that found in S. jarrovi with aggregations of one adult male and, several females and juveniles during the early summer. Pairs. formed in the fall during the mating season and at least some individuals were often found repeatedly in certain predictable geographic centers of activity, suggesting that they may have distinct home ranges or territories.
· Mayhew (1963) reports that alt~ough individual S. orcutti were not observed to engage. in aggressive territorial interactions and several males may 'share a single rock, these animals occupy certain preferred sites repeatedly, and may have territories through avoidance rather than defense. Tanner and Krogh ( 1973). report territorial behavior in S. magister but present· few details as to the size and quality of those territories or to differences between the sexes or arnong age classes in territorial behavior. Some information on the territorial behavior or spatial distributions of S. olivaceus, S. variabilis, S. woodi, and S. clarkii is also available (and summarized in Table 6.2).
Overall, results of studies on various species of Sceloporos suggest that home range defense in Sceloporus is due to a complex interaction of factors including defense of food resources, mates, and sites with particular thermal properties, as ,well as phylogenetic constraints. However, defense of mates seems to be a primary factor for adult males, while adult females and juveniles may also defend territories for access to ecological resources such as food. More work is· clearly needed to determine whether thermal requirements play a major role in the spatial distributions of lizards. These results are not entirely convincing because of variation among species and disagree-
Evolution of Territoriality 133
ments'ln the .results of many studies. A comparative analysis at the i~terspecific level can be partic~larly useful in this sort of situation as a means of determining whether any of the observed patterns can be generalized.· For example, a multiple regression of territory size on food resources, number of mates, and thermal characteristics could lend insight into which of these factors are more important than others at the interspecific level.
Meth~ds The data
Many complications ·arise when doing this sort of comparative study. Data collected. by different investigators on different projects are likely to present abroader, more objective view of lizard behavioral ecology, swamping many of the biases that may be caused by the predispositions of any ·particular researcher. Ori. the other hand, measurements made by different researchers may not reflect the same biological phenomenon, and are subject to interobserver error. In terms of the territorial behavior or spatial distribution$ of lizards, some researchers have estimated territory size by setting up artificial encounters at presumed boundaries. Others have determined home range size from sightings of undisturbed animals or by distinguishing areas of exclusive use and using any one . of several different estimation ~techniques (e.g., see Rose 1982). Still others have established · population density from direct counts, mark-recaptures or other density estimation techniques (e.g., see Turner 1977 for general discussion). Although all of these are relevant to the definition of spatially relevant agonistic behavior proposed above, they are unlikely to be directly comparable
·as required for interspecific analyses. To my knowledge, published estimates of territory sizes from staged
encounters are available for only one species of Sceloporus (S. jarrovi; Simon 1975; Simon and Middendorf 1976, 1980). Estimates of male home range sizes of nine species of Sceloporus are available, if all studies that have made some attempt to estimate home range sizes from sightings of lizards are considered, regardless of the estimation technique applied. Estimates of female home range sizes are only available for seven species, and as the results· of analyses obtained using these were not different from those obtained wh_en considering male home range sizes alone, results for females are not reported herein. Population density estimates are the most common sort of measurement of lizard spatial· distribution, and are available for a total of 12 species of Sceloporus. Separate ,estimates of male and· female densities are available for only three species. As these and all other species for which there is some qualitative information have been reported to have roughly equal sex ratios, only total adult population density is considered in the following analyses (Table 6.2); Needless to say, although these data represent a huge quantity of time and careful observation, they form a rather

<-r
134 Lizard Ecology
scanty, mixed set of data that will r~sult in many problems with interprehition. Again, results should be judged with caution, and considered as a
· means of generating new ideas and testable hypotheses rather than as firm conclusions in and of themselves.
Phylogenetic analyses
Most statistical analyses of comparative data either implicitly or explicitly involve the use· of phylogenetic information. As most statistical techniques (e.g.; t-tests, regression, AN OVA, nonparametric statistics) require that the data be statistically indepe.ndent of one another, not taking phylogenetic information into account is equivalent to assuming that the species divergea essentially instantaneously from a single ancestor in a "star" radiation. We can improve on this estimate by incorporating the phylogeny of Figure 6.3 in the analysis, using a technique such as those proposed by· Felsenstein (1985), Cheverud and Dow (1985), Huey and Bennett (1987), Grafen (1989), Lynch (1991a) for continuously varying traits, or Maddison (1990), · Janson 0992), or Sanderson (1993) for categorical or state variables (see Harvey and Pagel1991; Losos and Miles 1994 for reviews). Any of the techniques for use with continuous variables (e.g., population density, home range size) can be used to transfoqn species data into phylogenetically rele-
. vant and statisti_cally independent variables that can then be ~nalyzed. using standard statistical approaches.
As an illustration, I will apply only Felsenstein's (1985) metllod of independent contrasts~ Given a known phylogeny and modeling character evolution as a standard Brownian Motion process: this technique transforms raw species data into a set of "contrasts" or differences between pairs of species that are statistically independent of one another and that have ,been standardized to have a mean qf zero and variance of one.·This technique (and all . of the others as well) requires information as to the branch lengths of the phylogeny in units of expected variance of phenotypic evolution (i.e., the amount ofphenotypic change expected to occur along each branch). This quantity can be either known or estimated, but is generally difficult to obtain. For this study, branch lengths were created rather arbitrarily simply by setting the distance between sister species equal to one, and creating progressively longer branches as relationships became more distant (Fig. 6.3; for alternative ways of obtaining branch lengths, see Felsenstein 1985; Grafen 1989; Gittleman and Kot 1990; Martins and Garland 1991; Martins 1993). Of course, results of a phylogenetic comparative study can only be as reliable as the phylogeny on which they are based. The arbitrary nature with
~ which these branch lengths were obtained provides one more reason for considering the final conclusions of this study with caution.
Evolution of Territoriality 135
Using phylogenetic correlations to infer territorial function
A phylogenet_ic approach to the question of adaptive function involves looking for relationships among evolutionary changes in various traits on a macroevolutionary leveL In terms of the evolution of territoriality, for example, we might expect that under ~he first hypot4esis (defense of territories
-for food), evolutionary changes in spatial distributions or territorial behavior of l!zards would be closely related to evolutionary changes in foraging patterns, including preferred diets, food availability, or foraging mode. Evolutionary relationships between the two types of traits could have existed in the past or may currently exist among species whether or not a relationship between food abundance and territory size exists within a single species. To test this hypothesis ·using comparative data, quantitative measures of the traits in. several ·different species are. needed. Although quantitative esti~ mates of food abundance are not available for many of the 13 species of Sceloporus> for which population densities and! or home. ranges have ·been estimated, body size can be used as a rough indicator of food availability as larger animals will require more food to maintain the same basic activity levels as smaller animals. If territories are being maintained to defend food resources, then larger-bodied animals should also have larger territories and lower population densities. As'mentioned earlier, this sort of argument hasbeen made in comparingthe food uses ofmale and female lizards, but !Tlight
· also be used to compare different species. Body sizes for most species oflizards are easily available from the literature (e.g., Table 6.2).
For the second hypothesis· (defense of territories for· mates), we might expect relationships between terdtorial quality an9. the number of mates, Although direct measures of number of mates for particular lizards are not usually available in the literature, degree of sexual dimorphism (e.g.,_ in body" size) can also be used as an estimate of mating system or Jhe strength of potential sexual selection acting on different lizard species (e.g., Stamps 1983). Under this second hypothesis, we would predict a significant relationship between population density or home range size with sexual dimor~ phism. In the current study. residuals from a regression of male body size (mean snout-ventlength [SVL]) on fema.le body size were used as estimate~ of the degree of sexual dimorphism in different species. As the data used in this regression ~ere species tnean phenotypes, I applied Felsenstein~s (1985) technique and the phylogeny of Fig. 6.3 to correct the data for statis:tical nonindependence due to phylogenetic relationships before conducting the regression and calculating residuals (forcing the regression through· the origin as required by the method).
U nforti:mately, there were not s~fficient data to consider the importance of the third proposed function (defense of thermal resources) on territorial
e'
136 Lizard Ecology
....I 0.02 > en I Y = 0.70 X +e Ul ....I 0.01 <( :2 ~
I • en 0 til <(
g: -0.01 z 0 0
-0.02 -0.03 -0.02 -0.01 0 0.01 0.02 0.03
CONTRASTS IN FEMALE SVL
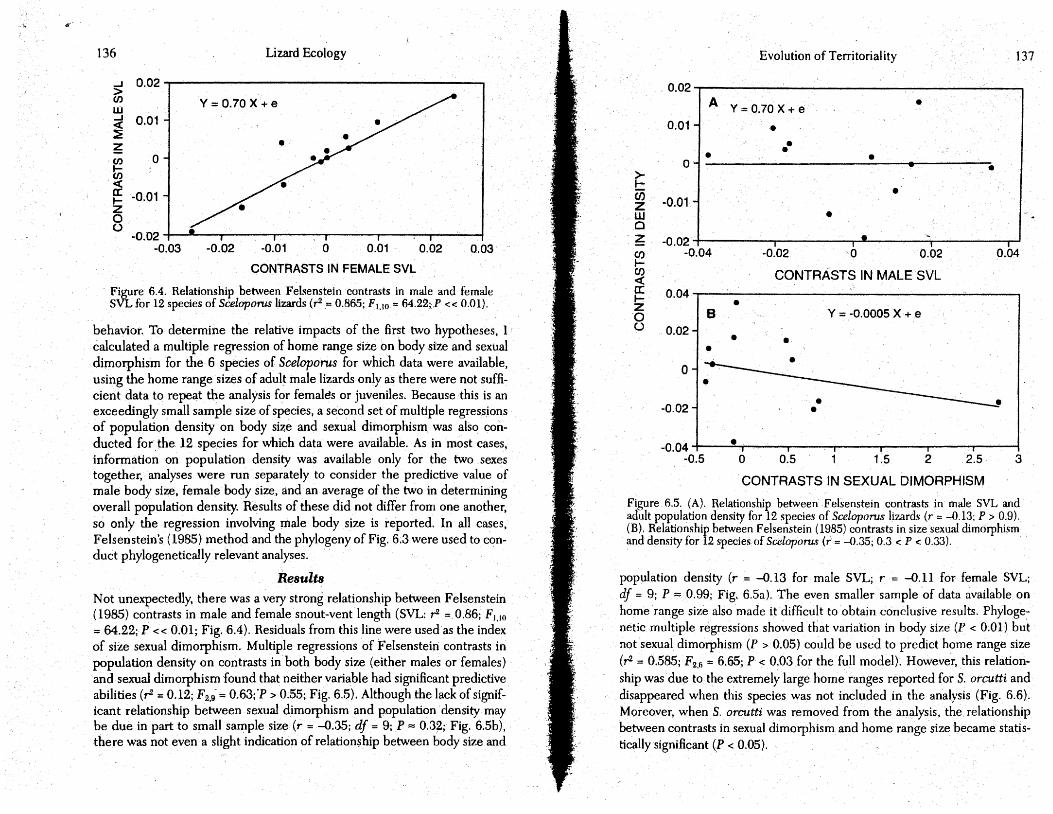
Figure 6.4. Relationship between Felsenstein contrasts in male and female SVL for 12 species of Sceloporus lizards (r2 .= 0.865; F1,10 = 64.22;:.P << 0.01).
behavior. To determine the relative impacts of the first two hypotheses, I calculated a multiple regression of home range size on body size and sexual dimorphism for the 6 species of Sceloporos for which data were available, using the home range sizes of adult male lizards only as there were not sufficient data to repeat the analysis for females or juveniles. Because this is an exceedingly small sample size of species, a sec<;md set of multiple regressions of population density on body size and sexual dimotphism was also conducted for. the 12 species for which data were available. As in most cases, information on population density was available only for the two sexes together, analyses were run separately to consider the predictive value of male body size, female body size, and an average of the two in determining overall population density. Results of these did not differ from one another, so only the regression involving male body size is reported. In all cases, Felsenstein's (1985) method and the phylogeny of Fig. 6:3 were used to conduct phylogenetically relevant analyses.
Results Not unexpectedly, there was a very strong relationship between Felsenstein (1985) contrasts in male and female snout-vent length (SVL: r2 =. 0.86; F1,1o = 64.22; P << 0.01; Fig. 6.4). Residuals from this line were used as the index of size sexual dimotphism. Multiple regressions of Felsenstein contrasts in population density on contrasts in both body size (either males or females) and sexual dimotphism found that neither variable had significant predictive abilities (r = 0.12; F2.9 = 0.63;'P > 0.55; Fig. 6.5). Although the lack of significant relationship between sexual dimorphism and population density may be due in part to small sample size (r = -0.35; df = 9; P = 0.32; Fig. 6.5b), there was not even a slight indication of relation~ hip between body size and
Evolution of Territoriality 137
0.02 ..,....----------------------,
A Y=0.70 X+ e • 0.01 •
•• • • 0
• ~ (ij z -0.01 w Cl
~ CJ) 1-CJ) <( ct !z ·o 0
• -0.02 04
-0. -0.02 ·0 0.02
CONTRASTS IN MALE SVL 0.04
• B y = -0.0005X + e
0.02~ • • • I~ 0
-0.02
-0.04 • -0.5 0 0.5 1 1.5 2 2.5
CONTRASTS IN SEXUAL DIMORPHISM
•
0.04
3
Figure 6.5. (A). Relationship between Felsenstein contrasts in male SVL and adult population density for 12 species of Sceloporus lizards (r = -0.13; P > 0.9). (B). Relationship between Felsenstein (1985) contrasts in size sexual dimorphism and density for 12 species of Sceloporus (r = -0.35; 0.3 < P < 0.33).
population density (r = -0.13 for male SVL; r = -0.11 for female SVL; df = 9; P == 0.99; Fig. 6.5a). The even smaller sample of data available on home range size also made it difficult to obtain conclusive results. Phylogenetic. multiple regressions showed that varialion in body size (P < 0.01) but not sexual dimorphism (P > 0.05) could be used to predict home range size (,-2 0.585; F2,(; = 6.65; P < 0.03 for the full model). However, this relationship was du~ to the extremely large home ranges reported for S. orcutti and disappeared. when this species was not included in the analysis (Fig. 6.6). Moreover, when S. orcutti was removed from the analysis, the. relationship between contrasts in sexual dimorphism and home range size became statistically significant (P < 0.05).

.....
138 Lizard Ecology
~2
A Y = 125.3 X+ e
• 0 f •
w -1 N I __...-- • c;; -2 w
" z -3 <( I e a: .;.4 w
-0.02 -0.015 -1.01 ~ -0.005 0 0.005 0.01 0.015 0 J: CONTRASTS IN MALE SVL ~ en t- I B. • en <(
0 a: t-z 0 -1 (.)
-2
-31 "' Y = -0.17 X + e
• -4
-0.5 0 0.5 1 1.5 2 2.5 3
CONTRASTS IN SEXUAl.. DIMORPHISM
Figure 6.6. (A). Relationship betwe. en Felsenstein contrasts in . male SVL. and male home range size for 9 s.pecies of/Scelopoms lizards (P < 0.1). Contrast between S. variObilis and S .. orcutti is a ~ighly influential point due to very large home range reported for S. orcu.tti. (B). Relationship between Felsenstein (1985) contraSts in size sexual dimorphism. and male home range size for 9 species of Scelopoms (0.1 < P < 0.2). ~
Discussion
Overall, there seems to be little 9r no .evidence to suggest that evolutionary changes in· territorial behavior are related to evolutionary changes in either body si~e or sexual dimorpnism in Sceloporns once phylogenetic relationships have been taken into account. These results are somewhat surprising given the positive relationship between body size and home range size found in earlier studies (e.g .• Turner et al. 1969; Christian and Waldschmidt !984), ·
~Evolution of Territoriality 139
and emphasizes the importance of doing this sort of analysis in a phylogenetic context. As the above analyses are all phylogenetically based, they can also be used to infer patterns in the evolutionary changes that have occurred. If anything, the analysis suggests that further studies might find a relationship between population density and degree of sexual dimorphism if data from more species can be considered. It seems unlikely that more data will strengthen the predicted relationship between population density and body size. Analyses involving home range size suggest that studies of S. orcutti rriay be particularly useful to determine why it seems to exhibit such an unusually large home range.
III. Inferring Rates of Phenotypic Evolution
Model and method
A final potentially useful perspective is obtained by trying to infer the rate or .. tempo" of the process underlying the evolution of territorial behaVior from comparative data. Differences among species in their spatial distributions'. are the result of the particular evolutionary process underlying that trait. For example, imagine that territorial behavior is a purely neutral character, with all evolutionary changes being the result of random genetic fluctuations .. In this case, differences in the territorial behavior of two related species should be directly related to the amount of time since they diverged from one another, the rate of mutation, and population size (Lynch and Hilll986). On the other hand, if natural or sexual selection has been acting on territorial behavior, . differences between species should also· be a function of the nature., strength, and direction of the selective forces acting on the trait.
,) Many ways of estimating rates of phenotypic evolution from comparative data have been proposed (e.g., Haldane 1949; Lande 1976; 1977; Gingerich 1983; Templeton 1986; Raup 1987; Baverstock and Adams 1987; Turelliet al. 1988; Lynch 199Q; Garland 1992; Martins 1994). In this final section. of the chapter,I will apply the technique described in Martins (1994) as an illustration of the types of· insight that can be gained through such an approach. ,
Using comparative data and estimates of time since divergence of various pairs of species (i.e., a phylogeny with branch lengths in units of time}, it is possible to. obtain a visual depiction of the phenotypic divergence among species with time. For example, envision all Sceloporus as beginning at some initial time (i.e., at the base of the phylogeny of Fig. 6.3) with only a single an,cestral species and consequently a betWeen-species divergence or variance in territorial behavior of zero. As evolution and speciation proceed, territorial behavior begins to differ among species, increasing the level of

.e r:
140 Lizard Ecology
among·species variance in territoriality. For example, under a neutral model. of phenotypic evolution, species that have been separated for long periods oftime are expected to have diverged to a greater flXtent than recently sepa· rated species. In this case, the relationship between among-speCies phenotypic variance and time could be described by a straight line with a positive or increasing slope. The slope of this line is the rate of phenotypic evolution· forth~ particular trait being considered. Under a model of stabilizing selection, species are expected to diverge up to some asymptotic point at which th'ey begin to evolve in parallel. A plot of the amount of divergence among spe~ies with time can thus be used to yield insight into the particular evolutionary processes underlying phenotypic traits, or to the differences in evo-lutionary processes underlying ~hose traits~ ·'
Lynch (199la) suggested a way to estimate the variance between pairs of species that can be used in creating such a scatterplot. Martins (1994) pro.:. vi des an extens~on of this technique that allowS" for estimation of the rate of phenotypic evolution (the slope ofthe best-fit line) while taking phylogenetic relationships into account. A line can be fit to the data using either a neutral model of phenotypic evolution or one incorporating stabilizing selection, and the technique includes a test todetermine whether consideration of stabilizing selection improves the fit of the modeL The technique can also . be used in conjunction with methods to estimate evolutionary correlations (e.g., Felsenstein 1985; mentioned above under Section II) as a means of estimating branch lengths in units of expeeted v~riance of change for use with such methods. The technique described in Martins (1994) differs from most other phylogenetic methods described in this chapter in that it allows for incorporation of data on the level of within-species variability inherent in the traits of interest.
Results
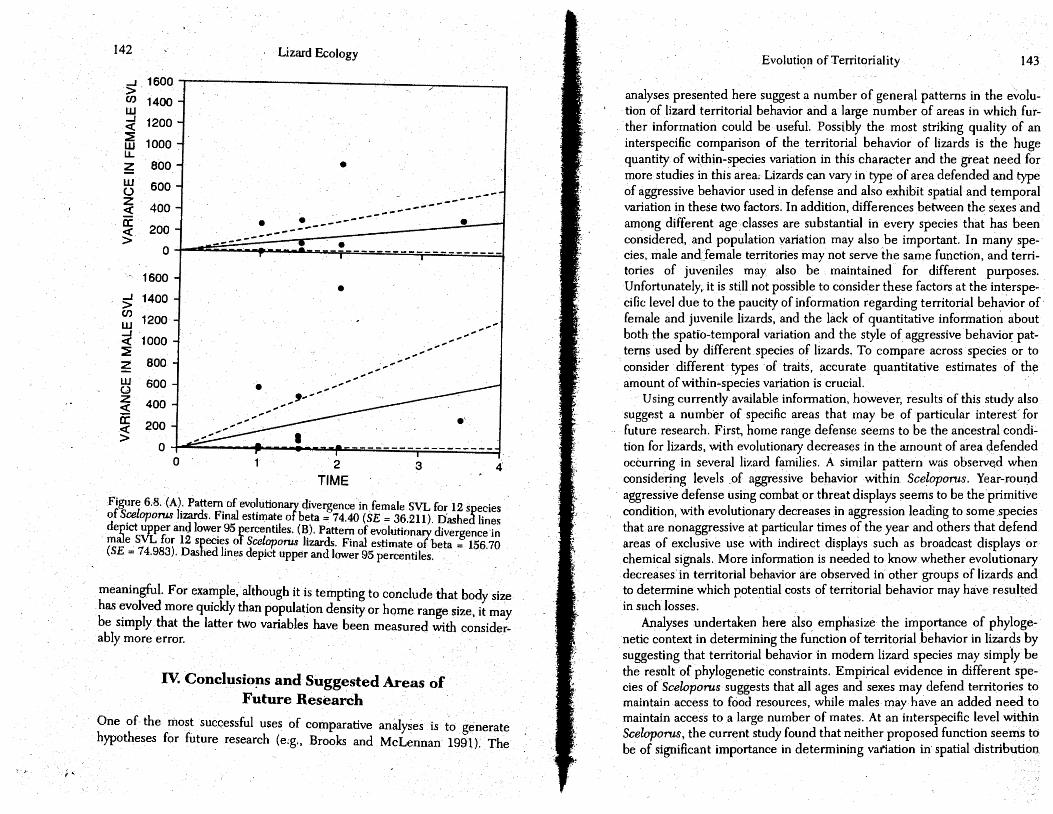
Applying this technique . to the vario~s traits measured from Sceloporus (Table 6.2), I found that a simple model of neutral phenotypic evolution fit all of the variables reasonably well and that there is no need to posit the added forces of natural or sexual stabilizing selection · (chi-squared tests; P > 0.05 in all cases). This does not necessarily mean that selection has not been acting on these traits, but rather that the available data and the particular technique chosen do not provide sufficient evidence to prove that it has. Assuming a neutral model of phenotypic evolution (i.e., Brownian motion), the estimated rates of pheno.typic evolution in male body size, 'female body size, and adult population density are significantly different from 2;ero (rate± SE = 156.70 ± 75.0 for male SVL; 74.70 ± 36.2 for female SVL; and 587.02 ± 180.3 for population density; Figs. 6.7 and 6.8), while estimated rates of phenotypic evolution of sexual dimorphism and home range size
Evolution of Territoriality 141
4
>-1-(ij
3 z w 0
~ 2 w (.) ·z ~ 1 0::' <( >
a J ~----7-,--- a ' I I 2 3 4
TIME
Figure 6.7. Pattern of evolutionary divergence in adult population density for 12 species of Scelopoms lizards: Final estimate of beta = 587.02 (SE = 180.328). Dashed lines depict upper arid lower 95 percentiles.
·were not significantly different from zero (P > 0.05 in all cases). In the latter case, again, the results do not necessarily mean that sexual dimorphism and home range size have not evolved. The· results simply suggest that the available data and the technique do not have sufficient statistical power to demonstrate conclusively that differences among species cannot be explained using measurement error and within-species variability alone.
Differences amqng "the relative rates of phenotypic evolution ·in Sceloporus show that male body size seems to have evolved about twice as quickly as female body size. Sexual dimorphism in body size has evolved so slowly in comparison as to be indistinguishable from a zero rate of evolutionary change. These comparisons assume that phenotypic variances of these characters have been measured on similar scales. The few estimates of standard errors that are available for male and f~male body size suggest that these two variables were generally measured with similar amounts of accuracy (Table 6.2). If we further assume that other forms of within·species variability (e.g., population variation) are similar for the two sexes, and that there is no overall bias towards one sex being larger than the other (in fact, 6 of the 13 species in Table 6.2 have larger females than males while 7 species exhibit the reverse), then the above comparisons of rnale body size, female body size, and degree of size sexual ,dimorphism would be reasonable. If estimates of the within-species variation or measurement error in these and the other variables were available, it would also be possible to compare: the rate of phenotypic evolution of population density to rate of evolutior in body size. As it stands, however, these rates have been estimated in differ· ent units of measurement. and direct comparisons are not biol<>gicall~
t',> , ....
142 , Lizard Ecology
s 1600,-~----------~------~--~--------00 w -J < ~ w ~
~
1000
800 • w 0 z < oc ~
~ ------200- • • ------------___ .,.._ ......... ---
0 .---------- • , : -~---=------ J .----------
600
400
- 1600
5 1400
~ 1200 -J < 1000 ~
~ 800 w 600 Gl z 400 <
•
..... . ... .. ,,,. ..... ' ...... ......
........ ...... ~;,"""'
...... ...... .........
oc 200 ...... .... ............... _______
...... . . ~
~ !Ifill'.'' 0
0 1 2 TIME
3 4'
Figure 6;8. (A). Pattern of evolutionary divergence infemale SVL fo~ 12 species of Sceloporus lizards. Final estimate of beta= 74.40 (SE = 36.211). Dashed lines depict upper and lower 95 percentiles. (B). Pattern of ev_o .. lutionary divergence'in male SVL for 12 species oT Sceloporus lizards. Final estimate of beta = 156.70 {SE = 74.983). Dashed lines depict upper and lower 95 percentiles.
meaningful. For example •. although it is tempting to conclude that body size has evolved more quickly than population density or home range size, it may be simply that the latter two variables have been measured with considerably more error.
Iv. Conclusio~s and Suggested Areas of Future Research
One of the most successful uses of comparative analyses is to generate hypotheses for future research (e:g., Brooks and McLennan· 1991). The
Evoluti<?n of Territoriality 143
analyses presented here suggest a number of gener~l patterns in the evolution of lizard territorial behavior and a large number of areas in which further information could be useful. Possibly the most striking quality of an interspecific comparison of the territorial behavior of lizards is the huge quantity of within-species variation in this character and the great need for more studies in this area; Lizards can vary in type of area. defended and type ofaggressive behavior used in defense and also exhibit spatial and temporal variation in these two factors. In addition, differences between the sexes and among different age classes are substantial in every species that has been considered, and population variation may also be important. In many species, male andfemale territories may not serve the same function, and territories of juveniles may also be maintained for different purposes. Unfortunately, it is still not possible to consider these factors at the interspecific level due to the paucity of information regarding territorial behavior.of female and juvenile lizards, and the lack of quantitative informatio~ about both the spatio-temporal variation and the style of aggressive behavio~ patterns ·used by different. species of lizards, To compare across species or to consider different types ·oftraits, accurate quantitative estimates of the amount of within-species variation is crucial.
Using currently available information, however, results of this study also suggest a number . of specific areas that may be of particular interest' for future research. First, home range defense seems to be the ancestral condition for lizards, with evolutionary decreases in the amount of area defended occurring in several lizard families. A similar pattern was obseiVed when considering levels _of aggressive behavior within Sceloporns. Year-round aggressive defense using combat or threat displays seems to be the primitive condition, with evolutionary decreases _in aggression leading to some .species that are nonaggressive at particular times of the year and others that defend areas of exclusive use with indirect displays such as broadcast di$plays or chemical signals. More information is needed to know whether evolutionary decreases·in territorial behavior are obseiVed in'·other groups of lizards and to determine which potential costs of territorial behavior may have resulted in such losses.
Analyses undertaken here also emphasize the importance of phylogenetic context in determining the function of territorial behavior in lizards by suggesting that territorial behavior in modem lizard species may simp'Iy be the result of phylogenetic constraints. Empirical evidence in different species of Sceloporns suggests that all ages and sexes may defend territories to maintain access to food resources, while males may have an added need to maintain access to a large number of mates. At an interspecific level within Sceloporns, the current study found that neither proposed function seems to be of significant importance in determining vatiation in· spatial distribU,tion

c,.)
144 Lizard Ecology
patterns. Once phylogenetic information was taken into account,. there was really no evidence to suggest that variation in spatial distribution could be explained by variation in food resources. A very slight indication of a relationship between spatial distributio~ and sexual dimorphism, however, suggested that with a larger sample of species we might find that reproductive requirements· are of some importance in maintaining the spatial distributions of adult males. Overall, however, it seems likely that phylogenetic constraints have played a primary role.
Finally, the considera{:!on of processes underlying phenotypic evolution gave very little evidence that a response to selective forces in determining territorial behavior could be detected at the interspecific level. It was also difficult to compare patterns of phenotypic evolution across species without accurate estimates of within-species variation in all of the traits to be used for scaling. Considering only variables involving body size, it appears that male body size has evolved about twice as rapidly as female body size, and that both have evolved more quickly than size sexual dimorphism. Contrary to the results of Fitch (1978), this suggests that selection may be acting more strongly on male body size than on female body size. Intraspecific studies of the selective forces acting on males versus females might thus be particularly useful.
Overall, a phylogenetic perspective can be an important tool in describing general patterns and suggesting important areas for future research. The nonrandom spatial distributions of lizards are the result of a complex set of behavior patterns that have evolved due to complex interactions among various selective' forces and phylogenetic history. Within-species variation in this character is also striking, with differences among individuals, sexes, age classes and populations only augmenting the spatial and temporal variation in the type of territorial behavior exhibited. All of these components are important, and all should be considered in any thorough discussion of lizard territorial behavior.
Acknowledgments
Thanks are due to David Cox,. LorrB.ine Heisler, Mike Pfrender, Don Price, and Judy Stamps for many useful discussions, to Joe Felsenstein and Michael Lynch for general advice~ and to Jonathan Losos, .. Judy Stamps, arid Laurie Vitt for comments on the manuscript. This work was supported by an NSF postdoctoral fellowship.


![From Personalism to Territoriality - [email protected] Home](https://img.dokumen.tips/doc/110x75/61fb40b32e268c58cd5bf937/from-personalism-to-territoriality-emailprotected-home.jpg)