Embed Size (px)
Citation preview

Evolution of large eddies in compressible shear layersDimitri Papamoschou and Asi Bunyajitradulya Citation: Physics of Fluids (1994-present) 9, 756 (1997); doi: 10.1063/1.869230 View online: http://dx.doi.org/10.1063/1.869230 View Table of Contents: http://scitation.aip.org/content/aip/journal/pof2/9/3?ver=pdfcov Published by the AIP Publishing
This article is copyrighted as indicated in the article. Reuse of AIP content is subject to the terms at: http://scitation.aip.org/termsconditions. Downloaded to IP:
128.200.90.57 On: Tue, 11 Feb 2014 22:24:26

This a
Evolution of large eddies in compressible shear layersDimitri Papamoschou and Asi BunyajitradulyaDepartment of Mechanical and Aerospace Engineering, University of California, Irvine, California 92717
~Received 15 July 1996; accepted 7 November 1996!
The evolution of large turbulent eddies has been investigated in seven supersonic shear layers withaverage convective Mach numbersMc ranging from 0.22 to 0.86 and with large variation in densityand velocity ratios. A two-laser, single-detector planar laser-induced fluorescence technique wasused to visualize the flow and its evolution. Two-dimensional pattern matching yielded theconvective velocity of the eddies. ForMc.0.3, fast and slow modes of eddy propagation weredetected in supersonic–subsonic and supersonic–supersonic combinations, respectively. Anempirical model for the convective velocity is proposed. Plan views reveal coexistence of two- andthree-dimensional disturbances. Interaction among eddies appears significantly suppressed. Thefindings have direct impact on supersonic jet noise and are very relevant to supersonic combustion.© 1997 American Institute of Physics.@S1070-6631~97!00703-4#
is
anepreowoe-aityse
tema
ite—f
skeRwe
ep
erfo-
aat
-llthis
blethe
aran-
tion
wo-elly.im-theif-is
I. INTRODUCTION
The role of large eddies, or ‘‘coherent structures,’’central in the investigation of turbulence in practical systemSince the subsonic shear-layer experiments of BrownRoshko1 the fluid-mechanics community has come to accthe fact that large-scale motions are an inseparable featuturbulent shear flows. For subsonic flows, it has been shby numerous works that large eddies are principally respsible for fluid entrainment into the mixing region. The rmarkable similarities between the quasi-deterministic behior of large eddies and the predictions of linear stabiltheory lend credence to the notion that large eddies reprethe most amplified instability of the flow.2 Although largeeddies are obvious in visualizations, it is difficult to attributo them a universal description. Definition depends to soextent on the means and goals of the investigation. Perhthe most specific one, proposed by Hussain,3 treats the co-herent structure as ‘‘a connected turbulent fluid mass winstantaneously phase-correlated vorticity over its spatialtent.’’ In this paper we use a similar—albeit less rigorousdefinition which centers on the phase-correlated field opassive scalar.
In compressible shear flows, the role of large eddiemore perplexing. Before discussing it, let us first define acompressibility parameter, the convective Mach number.ferring to Fig. 1, it is the Mach number of the dominant floinstability with respect to either freestream of the shear laythus it takes two values:
Mc15U12Uc
a1, Mc2
5Uc2U2
a2, ~1!
whereUc is the phase speed of the instability. This concof an instability Mach number was introduced by Mack4 inhis linearized treatment of compressible boundary layLater, it was proposed as a compressibility parameterturbulent shear layers,5,6 with Uc representing the eddy convective velocity. A ‘‘symmetric’’ Lagrangian model for thelarge structure,6 whereby the two freestreams suffer equtotal-pressure loss as they are entrained towards a stagnpoint inside the mixing region, gives
756 Phys. Fluids 9 (3), March 1997 1070-6631/97/9(rticle is copyrighted as indicated in the article. Reuse of AIP content is sub
128.200.90.57 On: Tue,
s.dtofnn-
v-
nt
eps
hx-
a
isye-
r;
t
s.r
lion
Mc1'Mc2
'DU
a11a2. ~2!
The corresponding dimensionless convective velocity is
Uc2U2
U12U25
1
11Ar2 /r1. ~3!
Even though the prediction of Eq.~2! may be inaccurate forhigh compressibility, the ‘‘average’’ convective Mach number Mc5DU/(a11a2) is still a useful measure of overashear-layer compressibility and will be used as such inpaper.
Experiments on the turbulent structure of compressishear layers agree widely on two key points. First,growth rate declines with increasingMc , with similar reduc-tions in the turbulent fluctuating velocities and shestresses.6–8 Second, turbulence becomes more disorgized, with less two-dimensional coherence, asMc exceeds avalue of around 0.5.9 Linear stability theory and direcnumerical simulation predict the growth-rate suppressquite well ~see for example Refs. 10 and 11!. Theory andsimulation also predict that, above a certainMc , three-dimensional disturbances are more unstable than tdimensional ones.12,13On the surface, this correlates with thincreased three-dimensionality observed experimenta9
Note, however, that analyses and computations typicallypose a certain wave obliquity and examine its effect ongrowth rate; the possibility of co-existence of waves of dferent obliquities, and investigation of their interactions,seldom explored.
FIG. 1. Shear-layer geometry and nomenclature.
3)/756/10/$10.00 © 1997 American Institute of Physicsject to the terms at: http://scitation.aip.org/termsconditions. Downloaded to IP:
11 Feb 2014 22:24:26

This a
FIG. 2. Test-section schematic.
erie
in-ns,s
v
ve
s
olit
rs-
thngar
stluysWty
ivpath
sitoethheen
ated
ur-w-ch
63ontheon-ed inhedm-ber.andd thest-
entch-
Another central area of compressible turbulence—whless agreement is found—deals with the evolution of eddand in particular with their convective velocityUc . The con-vective velocity is important because it influences entrament into the mixing region14 and has direct impact on supersonic jet noise.15 Double-exposure schlieren observatioof shear layers by Papamoschou,16 covering ten flow casesshowed nearly ‘‘frozen’’ patterns convecting with velocitievery different from those predicted by Eq.~3!. In layers com-posed of two supersonic streams, eddies traveled with alocity close to that of the slow freestream~slow modes!while in supersonic–subsonic layers they traveled with alocity close to that of the fast freestream~fast modes!. Fastmodes were subsequently observed by Fourguetteet al.17
who used planar Mie scattering and two-dimensional crocorrelations to track eddies at the edge of a supersonic~one case!. In the work by Hallet al.,18 fast modes weredetected by correlation of wall pressure traces, createdMach waves, in a supersonic–subsonic shear layer. It is nworthy that fast and slow modes are also found in stabianalysis of supersonic shear layers and jets.19,20On the otherhand, a recent study of supersonic–subsonic shear layeElliott et al.21 ~two cases!, using product formation and onedimensional space-time correlations, concluded thatUc is afunction of transverse position and is roughly equal tolocal mean velocity. A similar result was found in a reactiexperiment by Seitzmanet al.,22 where the edges of the shelayer were visualized using OH/acetone fluorescence.
Clearly, our understanding of compressible eddies islacking. The purpose of this study is to examine the evotion of shear-layer turbulence using diagnostic and analtools that we believe capture the nature of large eddies.focus on the most dominant instability, which—in similarito the subsonic experience—we assume takes the formlarge vortical structures. We use a slowly diffusing passscalar to visualize, at least approximately, the streamlineterns responsible for entrainment of that scalar fromfreestream into the vortical core. We define large eddiesphase-correlated two-dimensional patterns of that passcalar, the size of the pattern being of the same order aslocal thickness of the shear layer. Phase correlation is dby a 2D pattern matching technique which yields the convtive velocity of the eddies. At the same time, we observelevel of interaction between eddies and characterize tthree-dimensionality. We cover a variety of shear layers
Phys. Fluids, Vol. 9, No. 3, March 1997rticle is copyrighted as indicated in the article. Reuse of AIP content is sub
128.200.90.57 On: Tue,
es
-
e-
-
s-jet
byte-y
by
e
ill-ise
ofet-easvehenec-eir-
compassing supersonic–subsonic and the less-investigsupersonic–supersonic combinations.
II. FACILITY AND DIAGNOSTICS
Experiments were performed in the UCI Supersonic Tbulence Laboratory. The facility used is a two-stream, blodown wind tunnel in which a variety of gases and Manumbers can be selected to form a shear layer~Fig. 2!. At themeasurement location the test section is 45 mm high andmm wide. Optical access is provided by quartz windowsall four walls of the test section. The downstream side oftest section is connected to a low-pressure dump tank cnected to a vacuum pump. Gaseous acetone can be seedeither of the shear-layer streams. Injection is accomplisby supplying liquid acetone at high pressure through atoizing nozzles placed 1.5 m upstream of the settling chamThe flow of gases and acetone is controlled by solenoidpressure-regulating valves. Pressure transducers recordestatic-pressure distribution on the upper and lower tesection walls and the total pressures of each stream.
The diagnostic technique used to visualize the turbulstructure and its evolution is summarized in Fig. 3. The te
FIG. 3. Double/offset-exposure PLIF used for study of eddy evolution.
757D. Papamoschou and A. Bunyajitradulyaject to the terms at: http://scitation.aip.org/termsconditions. Downloaded to IP:
11 Feb 2014 22:24:26
57340071347
This a
TABLE I. Test parameters and results~velocities in m/s!.
Case Mc Gas1 Gas2 M 1 M 2
r2
r1 U1 U2 Uca Uc Mc1
Mc2
N22A21 0.22 Air Argon 2.0 2.1 1.78 530 425 470 470 0.22 0.2N15N03 0.52 Air Air 1.5 0.3 0.72 430 120 281 345 0.26 0.6N15N03P 0.52 Air Air 1.5 0.3 0.72 430 120 281 389 0.15 0.8N14A02 0.54 Air Argon 1.4 0.2 1.03 390 70 229 333 0.21 0.8N20N04 0.63 Air Air 2.0 0.4 0.58 500 130 339 462 0.15 1.0H15N16 0.67 Helium Air 1.5 1.6 6.26 1130 440 639 462 0.89 0.H19N20 0.83 Helium Air 2.0 1.9 5.85 1280 500 731 536 1.10 0.H16N08 0.86 Helium Air 1.6 0.8 4.46 1170 250 546 724 0.60 1.
aEquation~3!.
eanwla
sneeibp-hto
heos
e-stene
lierwa-littthkicthgue
rethch
code
ate asng-ndthe
ckoftioned
er
e
.
nique is based on laser-induced fluorescence of acetoncomprehensive discussion of which can be found in Lozet al.23 Gaseous acetone, at mole fractions around 1%,seeded in one of the shear-layer streams. Two adjacentsheets, generated by the fourth harmonic~266 nm! outputs oftwo independently pulsed Nd:YAG lasers~Continuum Sure-lite II ! sliced the shear layer. At the test section, each lasheet was 0.3 mm thick and about 30 mm wide; pulse egies were approximately 20 mJ. The ultraviolet sheetscited the acetone molecules which fluoresced in the visrange~l'480 nm!, thus marking the seeded fluid. The ustream sheet was triggered first, and the downstream ssecond with a time delayDt. Both sheets were imaged ona single detector~Princeton Instruments ICCD 576S/RB!. ByadjustingDt, the evolution of a turbulent feature seen in tfirst sheet was captured in the second sheet. Crcorrelations, discussed later, yielded the distanceDx traveledby identifiable features. The convective velocity was thcomputed byUc5Dx/Dt. Precise synchronization of the lasers and camera with the solenoid valves was achieved ua data acquisition/control system on a 486DX-66 compuThe time delay between the two lasers was independeconfirmed by a photodiode placed in the path of the sheexiting the test section.
III. EXPERIMENTAL CONDITIONS
The double/offset-exposure PLIF technique was appat an axial locationx 5 180 mm downstream of the splitteplate. The corresponding non-dimensional distancex/u'2000, whereu is the calculated boundary-layer momentum thickness of the fast stream at the edge of the spplate; thus we believe the flow to be fully developed atmeasurement location. Static pressures were around 40and the typical Reynolds number based on shear-layer thness was 23105. The total pressures were set such thatshear layers were pressure matched. To prevent chokinthe flow and to provide near-zero pressure gradients, theper and lower test section walls diverged at a combinangle of 3°.
Mach numbers at the measurement location (x5180mm! were inferred from measurements of the total pressuand of the local wall static pressure; they are close tonominal values associated with the nozzle blocks of Ma1.5 and Mach 2.0. Table I lists the conditions for the eigcases we investigated, in order of increasingMc . For ease of
758 Phys. Fluids, Vol. 9, No. 3, March 1997rticle is copyrighted as indicated in the article. Reuse of AIP content is sub
128.200.90.57 On: Tue,
, aoasser
err-x-le
eet
s-
n
ingr.tlyts
d
s
erePak-eofp-d
seht
reference, each case is assigned a name consisting of afor the gases~N for air, A for argon, H for helium! and theirMach numbers. For example, case H16N08 means heliumMach 1.6 and air at Mach 0.8. Case N15N03P is the samN15N03, only the visualizations are plan views. Alternati~fast-stream and slow-stream! injection of acetone was performed for cases N22A21, N15N03, N14A02, H15N16, aH16N08. In the remaining cases, acetone was injected infast stream.
IV. CROSS-CORRELATION METHOD
As mentioned in the Introduction, we define and traan eddy using the two-dimensional cross-correlationa passive scalar, in this case acetone concentrac(x,y,t). A spatial pattern of acetone signal is distinguishfrom the background by the fluctuationc8(x,y,t)5c(x,y,t)2^c(x,y,t)&, where^ & denotes the spatial average. Considtwo realizations of anLx3Ly pattern, one att50 and theother att5Dt. The two-dimensional cross-correlation of thtwo realizations is
C~j,h,Dt !51
LxLyE0
LyE0
Lxc8~x1j,y1h,Dt !
3c8~x,y,0!dxdy. ~4!
The extension of Eq.~4! to our images is outlined in Fig. 4We define an image fieldF(j,h), typically the entire image.Recall that the left half ofF corresponds tot50 and theright half to t5Dt. In the left half ofF, we select a template
FIG. 4. Illustration of 2D cross-correlation method. TemplateT(x,y) con-taining turbulent feature slides over entire image fieldF(j,h).
D. Papamoschou and A. Bunyajitradulyaject to the terms at: http://scitation.aip.org/termsconditions. Downloaded to IP:
11 Feb 2014 22:24:26

t
th
le
nas
eer8tav
atsilaers
ostthd
e
e
iont
omieebur
lelaf t-leu-
aexa
n-enflowsedts,
arearefaste is
rt-
ther-
This a
T(x,y), of size M3N, containing the pattern of interes(x, y, j, andh are treated now as integers!. The templateslides in both directions over the entire image field, andfollowing correlation is computed:
CTF~j,h!51
MN(j50
M
(h50
N
T8~x,y!F8~x1j,y1h!, ~5!
whereT85T2^T& andF85F2^F&, ^ & denoting the spatiaaverage over theM3N region of the template and of thoverlapping image field. WhenT8 slides on the right half ofthe image (t5Dt), Eq. ~5! becomes a space-time correlatioin two dimensions. The correlation coefficient is defined
RTF~j,h!5CTF~j,h!
ACFF~j,h!CTT
~6!
and takes the value of 1.0 for perfect correlation, i.e., whthe template overlaps with itself. Typical template sizes wM5N5150 pixels, while the image field was as large as 33576 pixels. The cross-correlation procedure is computionally intensive, each correlation taking an average of fihours to process on a Pentium 100 computer.
To assess the sensitivity of results on choice of templwe performed cross-correlations on the same image unine different template sizes and locations, each tempcontaining a sizable portion of the turbulent feature of intest. This was done for one image of each of the eight caexamined. The resulting standard deviation in theUc mea-surement was 5% or less. For each flow case, we crcorrelated an average of ten images. The standard deviaof Uc from one image to the other was also around 5%,highest value being 7% for case N15N03P. We conclutherefore, that the uncertainty in the reported valuesUc , forall the cases, is no larger than 7%. For each case, we nnoticed an excursion ofUc beyond that uncertainty.
This correlation procedure amounts to phase alignmbetween the structure att50 and its evolution att5Dt. Thatis, to compute the convective velocity, we set a criterbased on the shape of the original structure which we trymatch at a later time. However, that criterion changes frone image pair to the next. The resulting definition of eddis thus similar to Hussain’s,3 who used certain features of thvorticity field as a criterion to define coherent structures,less rigorous since our criterion changes while Hussain’smained constant.
V. RESULTS
In the course of our investigation, we have obtainedlarge number of PLIF images which are single- or doubexposure. We have seen consistently the presence ofstructures. They appear to be an inseparable feature oflow, even though at highMc their shape can vary significantly from one picture to the next. In some of the doubexposure images we cannot track features because wetoo long or too short aDt in the method of Fig. 3, an unavoidable part of the experimentation process.
Approximately two hundred images with large-scale fetures that can be followed from the first sheet to the nhave been collected. In all these images, one can m
Phys. Fluids, Vol. 9, No. 3, March 1997rticle is copyrighted as indicated in the article. Reuse of AIP content is sub
128.200.90.57 On: Tue,
e
ne4-e
e,ngte-es
s-ionee,
ver
nt
o
s
te-
a-rgehe
-sed
-tke
‘‘manual’’ Uc measurements by following with the eye idetifiable features.24 Eighty one of these images have becross-correlated, i.e., an average of ten images for eachcase. Selection of an image for cross-correlation was baon factors such as uniformity of lighting and lack of sponot the ability to identify trackable features. TheUc valuesfrom cross-correlations and from manual measurementsvery close. However, only the cross-correlation valuesincluded in this paper. The images are presented with thestream always on top. The stream seeded with acetonidentified as the bright one.
First we discuss the qualitative features of the flow, staing with the supersonic–subsonic combinations. Figure 5~a!presents a transverse view of case N15N03 (Mc50.52), withacetone seeded in the low-speed stream~the term FOV de-notes the axial extent of the field of view!. The large turbu-lent features can be easily followed from the first sheet tosecond (Dt570 ms! though they lack the organized rolle
FIG. 5. Selected images of supersonic-subsonic cases:~a! N15N03 withacetone seeded in slow stream~FOV565 mm,Dt570 ms); ~b! N15N03with acetone seeded in fasts stream~FOV565 mm, Dt570 ms); ~c!N14A02 ~FOV551 mm,Dt565 ms).
759D. Papamoschou and A. Bunyajitradulyaject to the terms at: http://scitation.aip.org/termsconditions. Downloaded to IP:
11 Feb 2014 22:24:26
eyf t
eeessuw
faforeonntint
na1
ntruc-nic
6
re
03csersere 7uc-n.omtionureislues
eri-r-
nts-n-co-alfalfof
ctive
re-es
This a
type structure seen in subsonic experiments~Ref. 1, for ex-ample!. The eddies deform very slightly, even though thare subjected to significant shear, represented in terms oeddy roll-over time t5d/DU5(0.01 m)/(320 m/s)531ms. In other words, withinDt570 ms, the eddy should havrotated about twice, yet it appears quite the same. This inness of the large eddies is a typical feature of the comprible shear layers investigated here. To ensure that our reare not biased on the side in which we seed acetone,alternated the injection side. Figure 5~b! shows an image ocase N15N03 with acetone injected in the high-speed streThe qualitative features of the flow are the same as beand, as we will see later, the convective velocity measument is not affected by the injection side. Indeed, acetappears to mark well the turbulent structure across the ethickness of the layer. As the convective Mach numbercreases, eddies become less organized but, because ofinertness, can still be easily followed. Figure 5~c! shows arepresentative images of case N14A02 (Mc50.54).
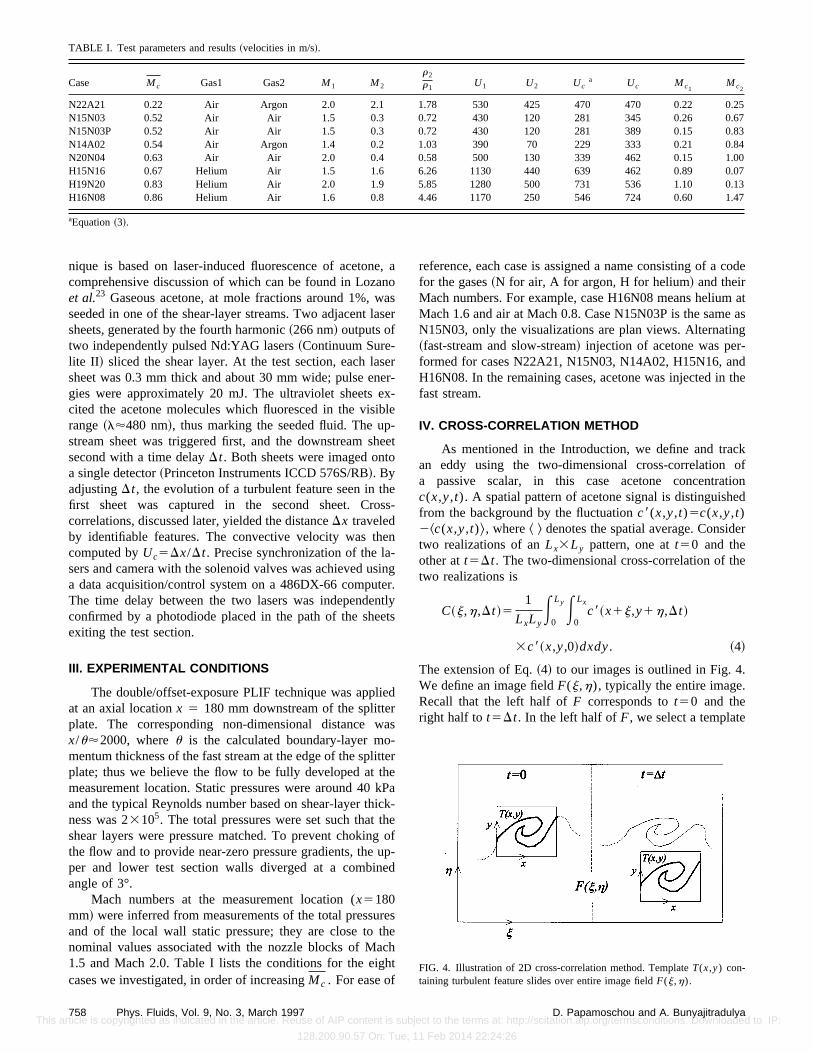
We now turn to the supersonic–supersonic combitions. Figure 6~a! shows an image of case N22A2
FIG. 6. Selected images of supersonic-supersonic cases:~a! N22A21~FOV554 mm,Dt560 ms); ~b! H15N16~FOV551 mm,Dt555 ms); ~c!H19N20 ~FOV560 mm,Dt560 ms).
760 Phys. Fluids, Vol. 9, No. 3, March 1997rticle is copyrighted as indicated in the article. Reuse of AIP content is sub
128.200.90.57 On: Tue,
he
rt-s-ltse
m.re-eire-heir
-
(Mc50.24) which has very low compressibility. Evethough both freestreams are supersonic, the turbulent sture looks remarkably similar to that observed in subsoshear layers, that is, organized roller-type structures. AsMc
increases, the features become less organized. Figures~b!and 6~c! show images of cases H15N16 (Mc50.67) andH19N20 (Mc50.83) where the inert and disorganized natuof the eddies is evident.
We acquired plan view images of case N15N(Mc50.48) by rotating the tunnel 90°, keeping the optiunchanged. The shear layer was sliced at various transvpositions from the low-speed to the high-speed side. Figushows a typical image at the middle of the layer. The strture is fairly chaotic with no two-dimensional organizatioLike its transverse counterpart, it stays nearly frozen frone exposure to the next. There is no significant eddy moin the spanwise direction, i.e., movement of the structoccurs uniformly in the flow direction. Since the structurechaotic but propagates frozen, it presents all possible vaof obliquity to the freestreams~it helps to think of the struc-ture as a wave front in this respect!. In other words, both 2Dand 3D disturbances are present. This contrasts with numcal simulations that predict—or impose—that only distubances of a certain obliquity are present.
We now present the measurements ofUc obtained by thecross-correlation scheme of Eq.~5!. Figure 8~a! shows an-other transverse image of case N15N03 (Mc50.52), accom-panied by a contour plot of the correlation coefficieRTF(j,h). The template used for this particular croscorrelation is visible in the image. When the template cotaining the turbulent eddy matches itself, the correlationefficient is 1.0. This is seen as the first peak, on the left hof the correlation plot. The second peak on the right hindicates the best match of the template with the evolutionthe eddy. The axial distance between the two peaks,Dx,represents the distance traveled by the eddy. The convevelocity is then calculated byUc5Dx/Dt. In this case,Uc5377 m/s, much higher than the value of 281 m/s pdicted by Eq.~3!. Figure 8~b! shows an example for casH19N20. Here we computeUc5547 m/s, considerably lesthat the 731 m/s predicted by Eq.~3!. For the plan view case
FIG. 7. Example of a plan-view cross section, case N15N03P~FOV551mm,Dt560 ms).
D. Papamoschou and A. Bunyajitradulyaject to the terms at: http://scitation.aip.org/termsconditions. Downloaded to IP:
11 Feb 2014 22:24:26

This ar
FIG. 8. Iso-contours of the correlation coefficientCTF(j,h) for selectedcases:~a! N15N03 (Dt570 ms); ~b! N19N20 (Dt535 ms); ~c! N15N03P(Dt570 ms).
e
in
hibsloss
re-setedan
c-ws
N15N03P, seen in Fig. 8~c!, the results are close to casN15N03.
Indeed, we confirm trends seen in several previousvestigations mentioned in the Introduction: forMc greaterthan about 0.3, supersonic–subsonic combinations exfast modes and supersonic-supersonic combinationsmodes. The only case where theUc measurement agreewith Eq. ~3! is N22A21 withMc50.24. These observationare illustrated in Fig. 9 where the non-dimensionalUc is
Phys. Fluids, Vol. 9, No. 3, March 1997ticle is copyrighted as indicated in the article. Reuse of AIP content is sub
128.200.90.57 On: Tue,
-
itw
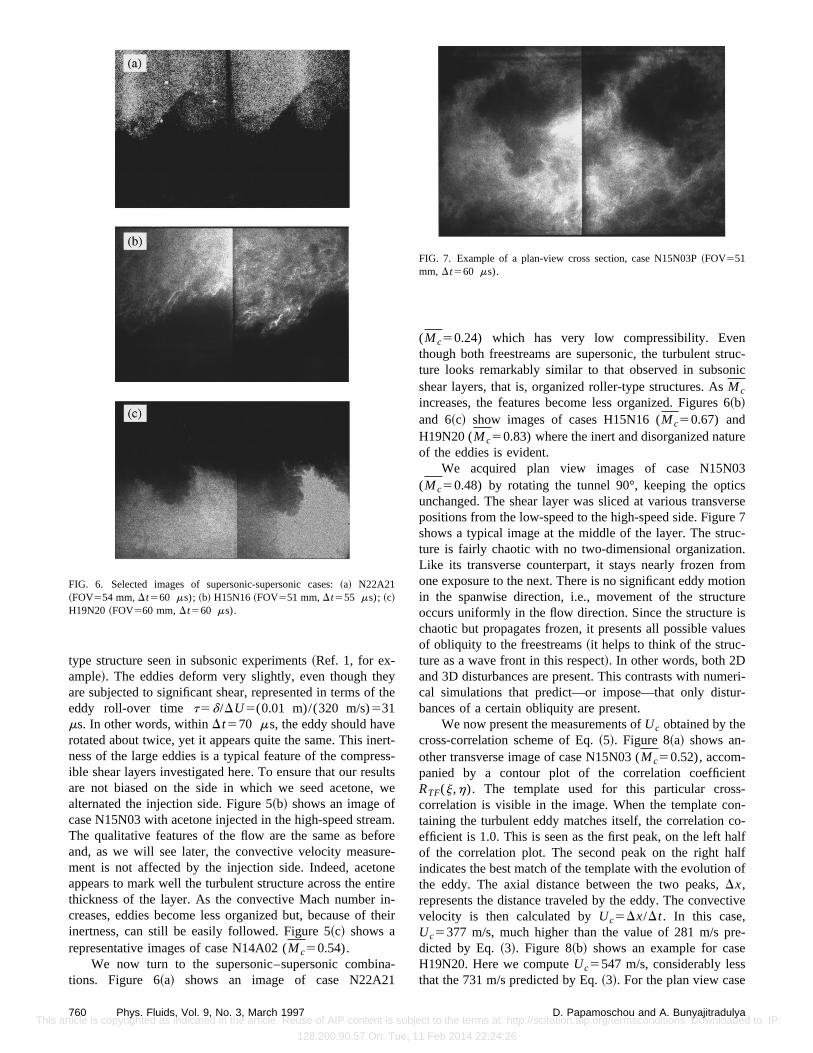
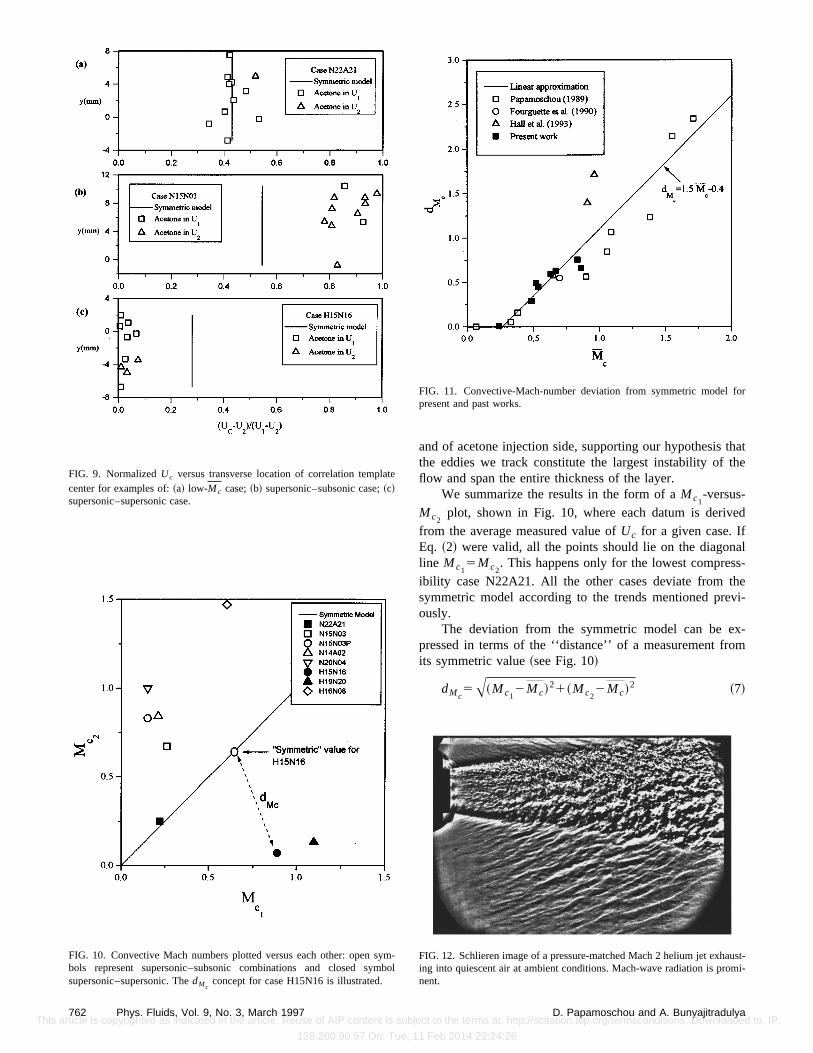
plotted versusy ~transverse location of template center! forcases N22A21, N15N03, and H15N16. The theoretical pdiction of Eq. ~3! is superimposed on the plots. For caN22A21 agreement with theory is very good, as expecsince this is a low compressibility case. This serves asadditional check on the accuracy of ourUc measurements. Incase N15N03,Uc is much higher than the theoretical predition and in case H15N16 much lower. Figure 9 also shothat theUc measurement is largely independent ofy location
761D. Papamoschou and A. Bunyajitradulyaject to the terms at: http://scitation.aip.org/termsconditions. Downloaded to IP:
11 Feb 2014 22:24:26
thatthe
ed
als-hevi-
x-om
te
sym
for
ust-mi-
This a
FIG. 9. NormalizedUc versus transverse location of correlation templacenter for examples of:~a! low-Mc case;~b! supersonic–subsonic case;~c!supersonic–supersonic case.
FIG. 10. Convective Mach numbers plotted versus each other: openbols represent supersonic–subsonic combinations and closed sysupersonic–supersonic. ThedMc
concept for case H15N16 is illustrated.
762 Phys. Fluids, Vol. 9, No. 3, March 1997rticle is copyrighted as indicated in the article. Reuse of AIP content is sub
128.200.90.57 On: Tue,
and of acetone injection side, supporting our hypothesisthe eddies we track constitute the largest instability offlow and span the entire thickness of the layer.
We summarize the results in the form of aMc1-versus-
Mc2plot, shown in Fig. 10, where each datum is deriv
from the average measured value ofUc for a given case. IfEq. ~2! were valid, all the points should lie on the diagonline Mc1
5Mc2. This happens only for the lowest compres
ibility case N22A21. All the other cases deviate from tsymmetric model according to the trends mentioned preously.
The deviation from the symmetric model can be epressed in terms of the ‘‘distance’’ of a measurement frits symmetric value~see Fig. 10!
dMc5A~Mc1
2Mc!21~Mc2
2Mc!2 ~7!
m-bol
FIG. 11. Convective-Mach-number deviation from symmetric modelpresent and past works.
FIG. 12. Schlieren image of a pressure-matched Mach 2 helium jet exhaing into quiescent air at ambient conditions. Mach-wave radiation is pronent.
D. Papamoschou and A. Bunyajitradulyaject to the terms at: http://scitation.aip.org/termsconditions. Downloaded to IP:
11 Feb 2014 22:24:26

aich
c
icnic
entmns
onelathely
aa
eieea-
inarssno
rafuseto
tiom
a-don
i-sonicrip-in-ad-veert-areics?gebe-sheardedri-or-
edumruc-hertill
It isa
nd,
ss iftogion.ea-
ionschlts
ersngor-
ine
.nalvec-
ofofic–
gdpeed
This a
which is plotted versusMc in Fig. 11. Data of previous in-vestigations that report large-eddy convective velocitiesincluded in the figure. A monotonic trend is observed, whis approximated by the linear fit
dMc5H 1.5Mc20.4, Mc.0.27
0, Mc<0.27.~8!
We can use Eq.~8!, together with Eq.~1!, to construct anapproximate prediction scheme for the convective Manumbers in the following fashion:
Mc15Mc6dMc
/A11~a1/a2!2 ,
~9!Mc2
5Mc62dMc/A11~a2/a1!
2 ,
where the plus sign should be used for supersonsupersonic combinations and the minus sign for supersosubsonic combinations.
Applied to flows of practical interest, the above modgives reasonable results. As an example, Fig. 12 preseschlieren image of a Mach 2 helium jet exhausting into abient air, obtained in one of our facilities. The jet conditioareU151330 m/s,a2 /a150.53, andMc51.31. A pattern ofMach waves is evident, generated because the eddies mat supersonic speed with respect to the ambient air. Thefield, defined by the potential core surrounded by shearers, covers the left two thirds of the image. The slope ofMach waves originating from the near field is approximat22°, which corresponds toMc2
'2.7. This agrees well withthe prediction obtained by applying Eq.~8! to Eq.~9!, whichgivesMc2
52.69. It should be understood, however, thatthis point the model is entirely empirical. The physical resons for the asymmetries are yet to be understood.
VI. DISCUSSION
We wish to offer some thoughts on three main issuthat arose from this study: the inertness of the large eddtheir asymmetric convective speeds, and the physical ming of ‘‘convective velocity’’ inferred by 2D versus 1D correlations.
Given the sharp decline of growth rates with increasMc , it is not surprising that compressible large eddiesmore inert in their mutual interactions than their incompreible counterparts. Previous evolution works have alsoticed this inertness at highMc.
21 In subsonic flows, largeeddies are very active in entrainment and frequently intewith each other, through pairings and amalgamations, tother boost the growth rate. In our images, we do notevidence of pairing. If it happens, it is probably too slowbe of significance. Recent theoretical works25,26 have attrib-uted the inactivity of compressible eddies to the reorientaof the pressure field and consequent breakdown in comnication between regions of the flow asMc increases. Also,direct numerical simulation of the interaction of vortex filments has shown that vortex reconnection time is delayehigh Mach numbers, a result of baroclinic and dilatatieffects.27
Phys. Fluids, Vol. 9, No. 3, March 1997rticle is copyrighted as indicated in the article. Reuse of AIP content is sub
128.200.90.57 On: Tue,
re
h
––
ls a-
veary-e
t-
ss,n-
ge--
ctr-e
nu-
at
The dependence ofUc on whether the freestream velocties are supersonic–supersonic versus supersonic–subis puzzling and cannot be explained by Lagrangian desctions of the flow. Quantities that are frame-of-referencevariant, like the density ratio and temperature ratio, are inequate as predictors of which mode will occur. We beliethat the answer to this question is tied to the observed inness of the eddies. If eddies evolve very slowly, wherethey formed and where do they acquire their characteristA region of special attention should be the trailing edwhere the two streams merge. An obvious distinctiontween supersonic–supersonic and supersonic–subsoniclayers is that the former have a stronger and more extenwake region than the latter. It is hoped that future expements will explore the effects of the near field on the mphology and convective velocity of the large eddies.
In previous works,16,28 it has been speculated that thasymmetricUc could be the result of a strong shock formeon only one side of the eddy. To satisfy pressure equilibriat the presumably stable stagnation point between two sttures, the stream with the shock would need a much higMc than the stream without. While this argument is splausible for flows with very highMc , one has great diffi-culty extending it to shear layers withMc as low as 0.3–0.5,the apparent threshold for occurrence of asymmetries.hard to imagine a process through which fluid inMc50.5 shear layer accelerates to anMc on the order of 3required to cause significant asymmetry. On the other haviscous dissipation is strongly related toMc and is signifi-cant even at subsonicMc’s.
29 Though not as strong locally athe dissipation of a shock, it could produce similar lossesuffered for long distances, i.e., if the streamline leadingthe stagnation point has crossed an extended viscous re
We now comment on the differences between our msurement ofUc , using 2D space-time correlations@Eq. ~6!#,and the classical measurements that employ 1D correlatin x and t. As mentioned in the Introduction, our researhas focused on the largest instability in the flow. Our resuindicate that this instability propagates with a singleUc .Elliott et al.21 visualized supersonic–subsonic shear lay(Mc50.5,0.86) using double-pulse planar Mie scatteriand inferred convective velocities from 1D space-time crelations done simultaneously at manyy locations. Specifi-cally, their scheme tracked the convection of a vertical lof signal taken from the initial image and translated inx overthe evolution image. Their results indicate thatUc is a func-tion of y and that it basically follows the mean flow velocityIn fact, it appears that all studies using 1D, unconditiospace-time correlations come to the same result: the contive velocity is very close to the mean velocity~see for ex-ample Refs. 30, 31!.
A strong clue as to the relevance of each definitionUc comes from the flow itself. Consider the phenomenonMach wave radiation in supersonic jets and in supersonsubsonic shear layers~see Fig. 12!. It has been observed inflows withMc as low as 0.7532 and is believed to be a stroncontributor to supersonic jet noise.33 Mach waves are createbecause a strong instability propagates at supersonic s
763D. Papamoschou and A. Bunyajitradulyaject to the terms at: http://scitation.aip.org/termsconditions. Downloaded to IP:
11 Feb 2014 22:24:26

:-et
lonDe
prntathatnms,seaurgizoi
t
rgl eth
nsetiontheeen-ch-herecity.ethepyedtlein-ear.r-heallyn.eds
m-nos-geseretos.ute
tt the
e isndForym-des,wstonicic–tive
em
m-
mestoneale tode-ity
This a
with respect to the ambient air~or with respect to the low-speed stream in a shear layer!. It becomes clear that 1Dspace-time correlations fail to capture this phenomenonUc followed the mean velocity, the instability would be intrinsically subsonic, hence no Mach waves would be genated. There is little doubt that Mach waves were presenthe shear layers of Elliottet al.21 atMc50.86~the conditionswere very similar to those of Hallet al.18 who correlated thepressure traces of Mach waves to infer the convective veity! yet their Uc measurements do not reflect that. Coversely, theUc measurements in this paper, inferred by 2space-time correlations, are consistent with Mach-wave geration.
This does not mean that 1D correlations are inapproate or invalid. Rather, using 2D versus 1D correlatioshould depend on the quantity one tries to extract. To obthe evolution characteristics of large scales, it appears2D correlations are more suitable. In an attempt to illustrthis point, we offer the cartoon of Fig. 13. It depicts aidealized view of a large structure in the convective fraand its evolution a short time later. In slowly growing flowlike ours, the mean streamline patterns are nearly cloindicating little entrainment into the mixing region. So, forshort time, the streamline pattern propagates practicallydeformed. At the same time, the streamlines of the laeddies are transporting smaller scales, which in visualtions would appear as patches of the tracer. This superption of large and small scales has been vividly capturedthe shadowgraphs of Brown and Roshko.1 The small scalestravel with a speed close to the local mean value, whereaslarge eddy propagates at a constantUc . One-dimensional,unconditional correlations do not discriminate between laand small scales and cannot capture the two-dimensionatent of the large instability patterns. Since they includecontribution of small scales, the resultingUc is biased to-
FIG. 13. Illustration of argument that small scales~shown as lumps! travelwith convective velocities different from that of the largest eddies.
764 Phys. Fluids, Vol. 9, No. 3, March 1997rticle is copyrighted as indicated in the article. Reuse of AIP content is sub
128.200.90.57 On: Tue,
if
r-in
c--
n-
i-sinate
e
d,
n-ea-si-n
he
ex-e
ward the mean flow velocity. Two-dimensional correlatioaccording to Eq.~6! are conditional by their nature. They usa template of integral length scale, thus capture the evoluof the largest eddies and are not significantly affected bysmall scales. This scenario explains the differences betwour results and those of Elliottet al.21 as well as those Seitzmanet al.22 The latter investigation used a fluorescence tenique that emphasizes the edges of the shear layer, wtracer patches convect at speeds near the local mean velo
Looking at the sketch of Fig. 13, it is evident that thprincipal Mach wave generator is the large eddy, notsmall scales. The large streamline pattern acts like a bumwall to the external flow; the small scales travel at a speclose to the local mean velocity, thus they disturb very litthe external flow. Is the large eddy as important in entrament as it is in noise generation? The answer is not clGiven the slow evolution of eddies, and their lack of inteaction, it is questionable if they govern entrainment to textent seen in subsonic flows. Small scales may be equimportant in bringing freestream fluid into the mixing regioThis is an issue central to supersonic combustion that neto be addressed by future works.
VII. CONCLUSIONS
The evolution of large-scale turbulent structures in copressible shear layers has been studied with a laser diagtic technique which produced cross-sectional digital imaof the structure and its evolution. Seven flow cases wstudied with convective Mach numbers ranging from 0.220.86 and with large variations in density and velocity ratioTwo-dimensional cross-correlations were applied to compthe convective velocity of large eddies.
The convective velocityUc was found to be independenof transverse position. The results were correlated agains‘‘symmetric’’ convective Mach numberMc . At low Mc , themeasured convective velocity of the large-scale structurin agreement with the prediction of the symmetric model aeddies appear like their incompressible counterparts.Mc.0.3, however, the measurements depart from the smetric model and two trends become apparent: fast mowith Uc much higher than the symmetric value; and slomodes, withUc much lower than the symmetric value. Famodes were observed exclusively in supersonic–subsshear layers, while slow modes occurred only in supersonsupersonic shear layers. Consequently, the two convecMach numbers,Mc1
andMc2, are very different from each
other, in contrast to the symmetric model that predicts thto be equal. The deviation ofMc’s from the symmetric valueis a monotonic growing function ofMc . This leads to anapproximate model for predicting the convective Mach nubers.
The appearance of the large-scale structures becoprogressively more disorganized asMc increases, consistenwith observations of earlier works. The lack of organizatiis evident in both side and plan views. The plan views revchaotic patterns that present every possible obliquity anglthe freestream flow. The patterns propagate virtually unformed in a direction aligned with the freestream veloc
D. Papamoschou and A. Bunyajitradulyaject to the terms at: http://scitation.aip.org/termsconditions. Downloaded to IP:
11 Feb 2014 22:24:26
reurm
Sll
in
uid
id
ic
,’’
y
y-
tu
in
A
ar
o
ohe
J.
eluid
er,’’
fns,’’
n-
ss-
of
ndys.
e-vo-
ra-res-
ag-
e,’’
n a
c-
p.
,’’
.
e-J.
ll.
civil
This a
vectors. This suggests the coexistence of two- and thdimensionalities in the flow, an issue of significance for tbulence modeling and for the overall understanding of copressible shear-layer turbulence.
ACKNOWLEDGMENTS
The support by Grants No. CTS-9114220 and CT9310830 from the National Science Foundation is gratefuacknowledged.
1G. L. Brown and A. Roshko, ‘‘On density effects and large structureturbulent mixing layers,’’ J. Fluid Mech.64, 775 ~1974!.
2C. M. Ho and P. Huerre, ‘‘Perturbed free shear layers,’’ Annu. Rev. FlMech.16, 365 ~1984!.
3A. K. M. F. Hussain, ‘‘Coherent structures and turbulence,’’ J. FluMech.173, 303 ~1986!.
4L. M. Mack, ‘‘Linear stability theory and the problem of supersonboundary-layer transition,’’ AIAA J.13, 278 ~1975!.
5D. W. Bogdanoff, ‘‘Compressibility effects in turbulent shear layersAIAA J. 21, 926 ~1983!.
6D. Papamoschou and A. Roshko, ‘‘The compressible turbulent shear laAn experimental study,’’ J. Fluid Mech.197, 453 ~1988!.
7G. S. Elliott and M. Samimy, ‘‘Compressibility effects in free shear laers,’’ Phys. Fluids A2, 1231~1990!.
8S. G. Goebel and J. C. Dutton, ‘‘Experimental study of compressiblebulent mixing layers,’’ AIAA J.29, 538 ~1991!.
9N. T. Clemens and M. G. Mungal, ‘‘Two- and three-dimensional effectsthe supersonic mixing layer,’’ AIAA J.30, 973 ~1992!.
10H. Gropengiesser, ‘‘Study of the stability of boundary layers,’’ NASTT-F-12, 786~1970!.
11S. K. Lele, ‘‘Direct numerical simulation of compressible free sheflows,’’ AIAA-89-0375 ~1989!.
12N. D. Sandham and W. C. Reynolds, ‘‘Three dimensional simulationslarge eddies in the compressible mixing layer,’’ J. Fluid Mech.224, 133~1991!.
13R. J. Gathmann, M. Si-Ameur, and F. Mathey, ‘‘Numerical simulationsthree-dimensional natural transition in the compressible confined slayer,’’ Phys. Fluids A5, 2946~1993!.
14P. E. Dimotakis, ‘‘Two-dimensional shear-layer entrainment,’’ AIAA24, 1791~1986!.
15D. K. McLaughlin, G. D. Morrison, and T. R. Troutt, ‘‘Experiments on thinstability waves in a supersonic jet and their acoustic radiation,’’ J. FMech.69, 73 ~1975!.
Phys. Fluids, Vol. 9, No. 3, March 1997rticle is copyrighted as indicated in the article. Reuse of AIP content is sub
128.200.90.57 On: Tue,
e---
-y
er:
r-
f
far
16D. Papamoschou, ‘‘Structure of the compressible turbulent shear layAIAA-89-0216, 1989.
17D. C. Fourguette, R. W. Dibble, and M. G. Mungal, ‘‘Time evolution othe shear layer of a supersonic axisymmetric jet at matched conditioAIAA J. 10, 157 ~1990!.
18J. L. Hall, P. E. Dimotakis, and H. Rosemann, ‘‘Experiments in noreacting compressible shear layers,’’ AIAA J.31, 2247~1993!.
19T. L. Jackson and C. E. Grosch, ‘‘Inviscid spatial stability of a compreible mixing layer,’’ J. Fluid Mech.208, 609 ~1989!.
20C. K. W. Tam and F. Q. Hu, ‘‘On the three families of instability waveshigh-speed jets,’’ J. Fluid Mech.201, 447 ~1989!.
21G. S. Elliott, M. Samimy, and S. A. Arnette, ‘‘The characteristics aevolution of large-scale structures in compressible mixing layers,’’ PhFluids7, 864 ~1995!.
22J. M. Seitzman, M. F. Miller, T. C. Island, and R. K. Hanson, ‘‘Doublpulse imaging using simultaneous OH/acetone PLIF for studying the elution of high-speed, reacting mixing layers,’’Proceedings of the 25thInternational Symposium on Combustion, July 31–August 5 1994, Irvine,CA.
23A. Lozano, B. Yip, and R. K. Hanson, ‘‘Acetone: a tracer for concenttion measurements in gaseous flows by planar laser-induced fluocence,’’ Exp. Fluids13, 369 ~1992!.
24D. Papamoschou and A. Bunyajitradulya, ‘‘Double-exposure PLIF iming of compressible shear layers,’’ AIAA-95-0513, 1995.
25R. E. Breidenthal, ‘‘Sonic eddy-a model for compressible turbulencAIAA J. 30, 101 ~1993!.
26D. Papamoschou and S.K. Lele, ‘‘Vortex-induced disturbance field icompressible shear layer,’’ Phys. Fluids A5, 1412~1993!.
27D. Virk, F. Hussain, and R. M. Kerr, ‘‘Compressible vortex reconnetion,’’ J. Fluid Mech.304, 47 ~1995!.
28D. Papamoschou, ‘‘Thrust loss due to supersonic mixing,’’ AIAA J. ProPower10, 804 ~1994!.
29P. E. Dimotakis, ‘‘Turbulent free-shear layer mixing and combustionProg. Astro. Aero.137, 265 ~1991!.
30J. A. B. Wills, ‘‘On convection velocities in turbulent shear flows,’’ JFluid Mech.20, 417 ~1964!.
31T. R. Oakley, E. Loth, and R. J. Adrian, ‘‘Cinematic particle image vlocimetry of high-Reynolds-number turbulent free shear layers,’’ AIAA34, 299 ~1996!.
32M. Nagai, ‘‘Mechanism of pseudo-shock wave in supersonic jet,’’ BuJSME26, 207 ~1983!.
33J. M. Seiner and E. Krejsa, ‘‘Supersonic jet noise and the high speedtransport,’’ AIAA 89-2358~1989!.
765D. Papamoschou and A. Bunyajitradulyaject to the terms at: http://scitation.aip.org/termsconditions. Downloaded to IP:
11 Feb 2014 22:24:26