Embed Size (px)
Citation preview

EVOLUTION OF KENYA’S MAIZE MARKETING
SYSTEMS IN THE POST-LIBERALIZATION ERA
BY
JAMES K.NYORO, MARY W KIIRU AND T.S JAYNE
Support for this study was provided under the Tegemeo Agricultural Monitoringand Policy Analysis (TAMPA) Project, supported by the United States Agency forInternational Development/Nairobi.
Nyoro and Kiiru are Research Fellows at Tegemeo Institute/Egerton University.Jayne is Associate Professor, Michigan State University.

1
1.0. INTRODUCTION.......................................................................................................................... 2
2.0 CONCEPTUAL FRAMEWORK AND METHODS ....................................................................... 5
2.1 SCP FRAMEWORK........................................................................................................................... 52.3: SURVEY DESIGN AND IMPLEMENTATION ........................................................................................ 7
2.3.1 Market Level Data .............................................................................................................. 7
3.0 MARKET STRUCTURE AND CONDUCT .................................................................................. 11
3.1 MARKET STRUCTURE .................................................................................................................... 113.1.1 Maize Marketing Chain ..................................................................................................... 123.1.2 Relative Importance of Alternative Maize Marketing Channels........................................... 173.1.3 Market Concentration........................................................................................................ 193.1.4 Degree of Product or Service Differentiation ..................................................................... 21
3.2 CHARACTERISTICS AND CONDUCT OF MAIZE TRADERS................................................................... 223.2.1 Characteristic of Maize Traders......................................................................................... 22
4.0 MARKET PERFORMANCE......................................................................................................... 26
4.1 MAIZE MARKETING MARGINS ....................................................................................................... 264.1.1 Wholesale Maize Price Spreads ............................................................................................. 264.1.3 Millers Margin ...................................................................................................................... 31
4.2 BARRIERS TO ENTRY ..................................................................................................................... 32Institutional aspects ....................................................................................................................... 32Technical barriers.......................................................................................................................... 33Financial barriers.......................................................................................................................... 33Infrastructure Development............................................................................................................ 34Group Marketing ........................................................................................................................... 35Risks .............................................................................................................................................. 35Policy Environment........................................................................................................................ 36
5.0 HOUSEHOLD LEVEL RESPONSES TO LIBERALIZATION................................................... 38
5.1 CHANGES IN FARMER CROPPING PATTERNS.................................................................................... 385.3 HOUSEHOLD PERCEPTIONS OF CHANGES IN THE PERFORMANCE OF THE GRAIN MARKETING SYSTEM43
5.3.1 Relationship between Grain Prices and Households’ Perceived Welfare............................. 435.4. REGIONAL DISTRIBUTION OF GRAIN SALES AND PURCHASES ........................................................ 47
6.0 CONCLUSION AND POLICY IMPLICATIONS.................................................................. 49
6.1 Conclusions.............................................................................................................................. 496.2 Policy Implications................................................................................................................... 50
REFERENCES:.................................................................................................................................... 53

2
1.0. INTRODUCTION
Farm-level income and productivity growth throughout history has been intimately tied to
productivity growth in marketing systems (North 1985). Abundant worldwide evidence has
shown that the incentives and ability of farmers to make investments in productivity-enhancing
inputs and production methods depends on reducing the transaction costs and risks of exchange
across inputs, credit, and output. Throughout the world, the major share of staple food costs to
the consumer is typically accounted for by marketing costs. In most countries in eastern and
southern Africa, maize marketing costs account for about 40% to 60% of the total retail price of
maize meal paid by consumers. The reduction of these costs represents a major opportunity to
improve farm production incentives and simultaneously make food more affordable to low-
income consumers.
It is with this objective that since the early 1980s, donors and international lending agencies have
promoted the reform of agricultural marketing in southern and eastern Africa as a central
component of the Structural Adjustment Programs (SAPs) in Africa. The basic theory underlying
donor advocacy of market reforms was neatly summarized by Barrett and Carter (1994): “Once
governments free market channels and prices, private merchants will automatically bid up
formerly depressed agricultural prices. By virtue of a positive price elasticity of supply, higher
prices induce greater production, which further stimulates demand for purchased inputs, including
hired labor. Larger agricultural incomes were expected to have significant multiplier effects due
to the relatively high marginal propensity to consume for the poor farmers. Thus a liberalized
agricultural sector was expected to propagate prosperity across all sectors of the economy in a
distributionally progressive manner.”
In Kenya, maize market reform began around the same time as other countries in the region when
it embarked on the Cereal Sector Reform Program in 1987/88. The European Union supported the
program as part of the country’s overarching structural adjustment policies. The reform process
intensified in the early 1990s when, under pressure from international lenders, the government
eliminated movement and price controls on maize trading, deregulated maize and maize meal
prices, and eliminated direct subsidies on maize sold to registered millers (Jayne and Kodhek
1997). Maize and maize meal prices, which prior to policy change were set at pan-seasonal and
pan-territorial levels, were deregulated. Private traders were allowed to transport maize across

3
districts without any hindrance. Prior to this policy change, they were required to acquire
movement permit for varying quantities of maize that was to be transported. The government still
participates in markets, albeit on a more limited scale. For the first time in several years, the
NCPB in 1999 purchased about 72,000 tons of domestically produced maize as part of a
governmental decision to stabilize maize prices.
The reform process was expected to reduce costs in the maize marketing system by encouraging
more private sector participation in the market. In practice, the reform process has been slow and
marked with a series of advances and reversals regarding the amount of freedom the private
sector was to be permitted in maize marketing. Uncertain policy environment and frequent
government interventions such as trade controls on maize imports and exports through use of
tariffs and bans also affected the extent of cereal market reform and the response by the private
sector. For example, in 1994, the government introduced a variable import duty following
substantial imports by the private that have been blamed for a slump in the price of domestically
produced maize. The reluctance on the part of the government to refrain from controlling prices
through policy tools such as tariffs and trade bans emanated from the perception that
liberalization would expose maize producers and consumers to predatory practices of private
traders (Kodhek et al., 1993). Further reluctance stemmed from the concern that maize meal
prices would no longer be controlled in an unregulated market which, especially in a drought year
could adversely affect household food security (Pinckney, 1988). It was also feared that removal
of food subsidies would hurt poor consumers by jeopardizing their access to food.
Unfortunately, and despite the fact that the liberalization process is 5-10 years old, discussions of
grain marketing policy in the post-liberalization period have often taken place in an information
vacuum. There is very little up-to-date empirical knowledge of the market structure, the behavior
of the various actors in the marketing system, and the constraints they face that impede further
innovation and productivity growth in the food system. As a result, policy debates about market
reform are often based on conventional wisdom and notions about how the system is operating.
Some critics of the system point to an apparent lack of private sector response to liberalization,
and continue to interpret their behavior as collusive and exploitative. In other cases, the
government’s behavior in the maize marketing system is blamed for dampening the private
sector’s response to liberalization. The purpose of this study is to shed some empirical light on
the operation of Kenya’s grain marketing system in the post-liberalization period. It identifies the

4
major constraints on market participants that influence its performance and formulates strategies
that could be used by governments and the private sector to promote the development of the
evolving market oriented food systems.
The objectives of this paper thus are fourfold: (1) identify the pattern of private sector investment
in the maize marketing system since the reforms were initiated and evaluate the extent of private
sector response to the reforms; (2) assess how maize prices and marketing margins have changed
in response to the market reforms; (3) identify market-oriented mechanisms that have evolved in
the current environment to reduce vulnerability of farmers, traders and consumers to price and
expenditure instability; and (4) identify strategies that the government and private sector could
implement to effectively promote the development of the evolving market oriented food systems.
The report is divided into 6 sections. Section 1 is the introduction while Section 2 discusses the
research methodology used in the study. Section 3 assesses the structure and behavior of various
actors in the marketing system. It discusses how the market is organized and coordinated, degrees
of concentration and relative ease or difficulty for the market participants to gain entry into the
market. It discusses where private sector response has been greatest and weakest and the reasons
for this. This section also examines the types of market-oriented mechanisms and coordination
arrangements that have evolved in the post-liberalization maize marketing system.
Section 4 assesses the performance of the maize marketing system by looking at the level of
competitiveness at key stages of the system and the effects of reform on marketing margins. We
also discuss the strengths and limitations of the evolving system to deal with price and market
instability, especially in relation to the former control period. What problems and constraints are
observed in transportation, storage, and financial credit and market information. What has been
the role of government in facilitating and/or impeded the private sector ability to respond to
liberalization. How has private sector response to liberalization been affected by poor roads,
government trade controls on maize import and export (tariffs and bans), uncertain policy
environment and quality specifications.
Section 5 discuss as how liberalization has affected cropping and consumption patterns (both
rural and urban) and general impression on liberalization. The final section 6 highlights the
conclusions, policy implications, and remaining outstanding knowledge gaps for future research

5
work to support policy makers in their efforts to effectively promote the development of market
oriented food systems.
2.0 CONCEPTUAL FRAMEWORK AND METHODS
2.1 SCP Framework
One important approach to the study of market performance is the Structure-Conduct-
Performance (SCP) framework. The SCP framework suggests that relationships exist between
structural characteristics of a market and the behavior of market participants and that their
behavior in turn influences the performance of the market (Scarborough and Kydd 1992; Scott
1995). Among the major structural characteristics of a market are the degree of concentration,
that is, the number of market participants and their size distribution; and the relative ease or
difficulty for market participants to secure entry into the market. Market conduct refers to the
behavior of firms or the strategy they use with respect to pricing, buying, selling, etc., which may
take the form of informal cooperation or collusion.
Typical structure-conduct-performance (SCP) analysis tend to assess market performance largely
in terms of:
(1) whether marketing margins charged by various actors in the marketing system are
consistent with costs; and
(2) whether the degree of market concentration is low enough (and the number of firms
operating in a market is large enough) to ensure competition,1 which is in turn assumed to
drive down costs to their lowest level.
The SCP approach postulates that as market structure deviates away from the paradigm of perfect
competition, the extent of competitiveness of the market will decrease, which is likely to impede
market efficiency (Scarborough and Kydd 1992; Scott 1995).
1 It is generally assumed that a market is competitive if: (a) there are many buyers and sellers inthe market, (b) there are no dominant market participants powerful enough to pressurizecompetitors or engage in unethical marketing practices, ( c) there is no open or concealedcomplicity among market participants regarding pricing and other marketing decisions, (d) thereare no artificial restriction that obstruct mobility of resources, (e) there is free entrance of buyersand sellers to the market with no special treatment to particular groups or individuals, and (f)there is a homogeneous product so that customers are indifferent between supplies offered byalternative channels.

6
However, there are several shortcomings with these criteria for assessing market performance,
which should be kept in mind when reviewing the findings contained in this report. First, the
criterion that observed marketing margins should be consistent with costs does in no way indicate
that the marketing system is performing adequately. Schultz’s “efficient but poor” observation of
low-resource farmers also characterizes the functioning of marketing systems in many developing
areas (Shaffer et al. 1985). Marketing margins may approximate costs, but these costs may be too
high and unstable to encourage rapid investment in the marketing system to promote on-farm
productivity growth. The technologies used on the farm and in the marketing system may be
appropriate if one takes as given the risks and high costs within the system. However, these
technologies would surely not be appropriate if better developed institutions and coordination
arrangements were implemented to shift and absorb risks of investment in new technology and
reduce transaction costs of exchange. Economic development can be largely viewed as a
continuous process of institutional innovation in response to (and to facilitate the use of) new
productive technologies, and technical innovation made possible (or constrained by) the risks, and
costs of exchange within existing institutions governing market exchange.
Therefore, assessments of market performance based on whether costs approximate marketing
margins must be viewed as very static snapshots at a particular point in time that fail to
incorporate the longer-run dynamic issues of how incentives can be structured within the rules of
economic exchange to reduce costs at the various stages of the production/marketing system
(Jayne 1997).
The second criterion (establishing whether competition exists based the number of firms in the
market) is also problematic in the presence of scale economies. In Kenyan grain markets, scale
economies may arise both from technology and from the existence of isolated thin markets. The
high costs of transportation between a production region and a major regional market may result
in very low producer prices in the remote production region. Low prices in turn depress the
marketable grain surplus available for purchase by assemblers. And the existence of small
surpluses in turn limits the number of grain traders that can profitably operate in an area,
particularly in the presence of scale economies in marketing activities (e.g., transportation).
Therefore, the existence of few traders (high market concentration among grain buyers) would
not necessarily point to lack of competition or artificial barriers to entry, nor would a large
7
number of traders each handling very small volumes indicate that per unit marketing costs are
being minimized.
Third, the ability to capture the gains from specialization and commercialization is limited by the
size of the market. The size of the market is influenced by transaction costs. These costs include
the ex-ante costs of collecting the information necessary to decide whether to engage in
exchange, negotiating the deal, and the ex-post costs of contract monitoring and enforcement.
When these expected costs exceed the expected gains from exchange, no transaction takes place.
Conventional approaches tend to evaluate performance based on the transactions that occur and
can be observed not the trade that never occurred because of high transaction costs. High
transaction costs therefore prevent what would otherwise be beneficial trades, and depress the
dynamic development of exchange-based economic systems required for structural
transformation. Therefore, market performance should also be assessed based on the range of
activities that do not exist in addition to assessing the efficiency of existing exchange
arrangements.
2.3: Survey Design and Implementation
2.3.1 Market Level Data
Data used in this paper is a combination of the analysis of a single visit survey of 1540 rural
households conducted in April 1997 (Kodhek 1998) and primary data collection of a range of
actors in the marketing system. The 1997 household survey collected information on responses to
maize market liberalization by producers. The primary market data was collected from
storeowners in the surplus regions (assemblers), store owners in the deficit regions (dis-
assemblers), wholesalers, grain processors (both posho and large-scale millers), retailers and key
informants in maize marketing. For the purposes of this study, the country was divided into high-
potential maize production zones, maize-deficit rural regions of the eastern and western lowlands,
and the Nairobi area. From maize surplus districts, Trans Nzoia and Nakuru were selected for
this study. These districts were chosen because of their importance in national maize production
(Both accounts for about 15% of national production) and their proximity to maize consumption
areas. Trans Nzoia is the main source of maize that is consumed in the western lowland areas.
Maize from Nakuru is transported mainly to the eastern lowlands and Nairobi area.

8
In western lowlands, Kisumu and Siaya Districts were selected as maize deficit areas due to their
proximity to the maize surplus region. In the eastern lowlands, data was collected from Kitui,
Mwingi and Machakos towns. In Nairobi, data were collected in Kibera, Dandora, Kariobangi
and Korogocho, which are wholesale maize markets in the low-income estates. In order to gain a
more comprehensive picture of the maize marketing system in Nairobi, posho millers and
retailers in the low and medium income estates of Umoja and Buru Buru were interviewed. Areas
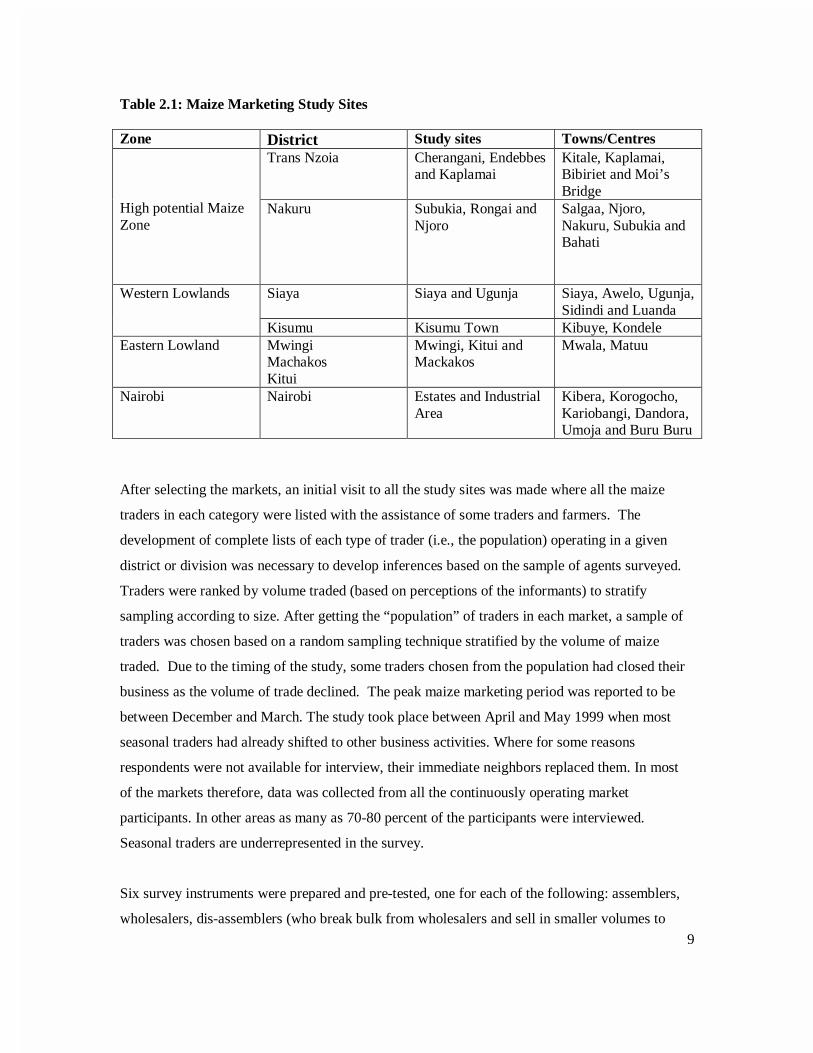
selected for the study are shown in Table 2.1.
In the surplus region, two to three divisions were selected as the data collection focus areas
depending on their relative importance in maize production and their proximity to maize
consumption routes. In Nakuru, the divisions selected included Bahati, Rongai and Njoro. Data
on retailing, posho milling and large-scale milling were in addition collected within Nakuru town.
In Trans Nzoia, maize surplus area, data was collected from Cherangani, Endebbes and Kitale
Municipality Divisions. Retailers, wholesalers, posho and large-scale millers were also
interviewed within Kitale town and its environs.
9
Table 2.1: Maize Marketing Study Sites
Zone District Study sites Towns/CentresTrans Nzoia Cherangani, Endebbes
and KaplamaiKitale, Kaplamai,Bibiriet and Moi’sBridge
High potential MaizeZone
Nakuru Subukia, Rongai andNjoro
Salgaa, Njoro,Nakuru, Subukia andBahati
Siaya Siaya and Ugunja Siaya, Awelo, Ugunja,Sidindi and Luanda
Western Lowlands
Kisumu Kisumu Town Kibuye, KondeleEastern Lowland Mwingi
MachakosKitui
Mwingi, Kitui andMackakos
Mwala, Matuu
Nairobi Nairobi Estates and IndustrialArea
Kibera, Korogocho,Kariobangi, Dandora,Umoja and Buru Buru
After selecting the markets, an initial visit to all the study sites was made where all the maize
traders in each category were listed with the assistance of some traders and farmers. The
development of complete lists of each type of trader (i.e., the population) operating in a given
district or division was necessary to develop inferences based on the sample of agents surveyed.
Traders were ranked by volume traded (based on perceptions of the informants) to stratify
sampling according to size. After getting the “population” of traders in each market, a sample of
traders was chosen based on a random sampling technique stratified by the volume of maize
traded. Due to the timing of the study, some traders chosen from the population had closed their
business as the volume of trade declined. The peak maize marketing period was reported to be
between December and March. The study took place between April and May 1999 when most
seasonal traders had already shifted to other business activities. Where for some reasons
respondents were not available for interview, their immediate neighbors replaced them. In most
of the markets therefore, data was collected from all the continuously operating market
participants. In other areas as many as 70-80 percent of the participants were interviewed.
Seasonal traders are underrepresented in the survey.
Six survey instruments were prepared and pre-tested, one for each of the following: assemblers,
wholesalers, dis-assemblers (who break bulk from wholesalers and sell in smaller volumes to

10
retailers or consumers), retailers, “posho” (small-scale) millers, and large-scale millers. The
instruments covered information on business investment, assets, other business activities of the
respondents, maize sources and sale outlets, buying and selling prices over the year and types of
pricing and coordination arrangements used in maize business. Information was also collected on
barriers and requirements for entry into maize trade, volumes traded in the peak and slack trading
seasons, maize sources and market outlets in the slack and peak season, availability and access to
credit and perceived constraints that raise costs and risks to the maize trading business.
Additional information collected from the grain processors included the extraction rates for maize
to maize meal, quantities of by-products and their value, maize and maize meal prices and maize
procurement and sale procedures.
The administration of the survey involved use of enumerators who had earlier been hired and
trained to undertake the 1998 household survey. The enumerators were re-trained and taken
through the questionnaire in both English and Kiswahili. They also were involved in the pre-
testing of the questionnaires before the actual data collection started.
Among the key parameters analyzed to estimate some basic market characteristics, was the
degree of market concentration. In this case, the concentration ratio (CR4) was developed, which
represents the proportion of total trade volume within a specific market area handled by the
largest 4 traders in the population. The numerator in the CR4 ratio thus is the volume traded by
the 4 largest traders in the population. The denominator represents the volume traded by the
entire population within a specific market. Since only a sample (assumed to be representative)
are surveyed, the following formulae was used to approximate the CR4 of the population:
CR4 = VT4p/VTp
VTp = VTs* P/S
VT4p = VT1s*P/S if P/S > 4
= VT1s*P/(S*2) + VT2s*P/(S*2) if 2<P/S < 4
= VT4s if P/S < 2
Where: CR4 is the proportion of total trade by the largest 4 traders; VT4p is the volume of trade
by the largest 4 traders in the population; VTp is the volume of total trade of population; VTs is
the volume traded by the sample of traders; P is the number of traders in the population, and S is
the number of traders in the sample. VT1s is the volume of trade of the largest trader in the

11
sample; VT2s is the volume of trade of the second largest trader in the sample; and VT4s is the
volume of trade of the four largest traders in the sample.
The CR4 ratios provide a rough measure of how “concentrated” is the volume of trade in a
particular market. CR4 ratios greater than 35-40% are typically used as a benchmark for
indicating the potential for collusive or non-competitive behavior in the market.
Market performance was estimated by calculating the marketing margins charged at each
marketing level. For the processors, milling margins were easily dis-aggregated. The milling
margins for whole meal production was defined as the custom milling fee charged by the hammer
(posho millers) for processing grain into the meal. For the large scale millers, milling margins for
sifted maize meal were defined as the difference between the retail price of sifted maize meal and
the price at which millers purchase grain, after adjusting for extraction rates and the value of by-
products. Milling margins for this category of maize meal thus was defined as:
MM=PMEAL – PGR*Er + PBY (Er – 1)
Where, PMEAL is retail price of maize meal per kg; PGR is miller’s procurement price of maize
grain per kilo; PBY is the value of the milling by-product (estimated at 40% value of PGR); and
Er is the grain/meal extraction rate (i.e., how many kgs of grain is necessary to produce one kg of
maize meal).
From wholesale market price data, the price spreads between key wholesale maize markets was
also calculated to determine the direction of change in these price spreads with the transition to
liberalization.
3.0 MARKET STRUCTURE AND CONDUCT
3.1 Market Structure
This section discusses the market structure and the conduct of the various actors in the maize
marketing chain and how these two affect performance of the marketing system. In order to
assess the organization and characteristic of the market, the most important parameters evaluated

12
include; the degree of buyer and seller concentration; the degree of product or service
differentiation and; conditions or barriers to entry.
3.1.1 Maize Marketing Chain
Results of the study indicated the existence of six categories of marketing agents identified as
assemblers, wholesalers, retailers, and dis–assemblers, posho millers and large-scale millers (see
Figure 1). In addition, a smaller category of traders usually using bicycles purchased and bulked
maize at the farm level and delivered to the assemblers, retailers, or posho millers.
Assemblers
Assemblers were usually the first commercial purchasers of maize in the marketing chain. They
usually begin as farmers who graduate to the next stage in the system, i.e., bulking up surpluses
of neighboring farmers to capture scale economies in transport to local market. Those that are
farmers raise their working capital from the sale of their own maize immediately after the harvest.
All they require to enter into the maize business was to rent a stall or shop, buy a weighing
balance and acquire a license from the county council. After selling their maize, the capital raised
was reinvested back into the maize assembling business. Assemblers bought maize from the
farmers or bicycle traders and sold it to wholesalers, dis-assemblers and retailers. Some
assemblers, particularly in the surplus areas, acted as purchasing agents on behalf of the large-
scale millers. Whereas assemblers are found in largest numbers in the maize surplus areas, a few
of them operated sporadically in the deficit areas where they purchased maize from the relatively
smaller proportion of farmers with surplus production in these areas.
Wholesalers
Wholesalers are traders who buy maize from surplus districts (usually from assemblers)
and transport the grain to deficit areas where they sold to either dis-assemblers, retailers
or millers. Most wholesalers are also vertically integrated into assembly, as most of
thevolume they purchase in the post-harvest months are direct from farmers. About half
(5l%) of those interviewed owned a lorry. Some of the wholesalers are involved in other
businesses and join the maize trade only at the peak-harvesting season. Results of the
survey indicated that during peak purchase months, wholesalers buy maize mainly from
Nakuru, Uasin Gishu, Nandi and Trans-Nzoia and sell in the high-demand deficit districts
of Kisumu, Siaya, Nairobi, Machakos, and Kitui. During the July to September period,

13
Figure 1: A Generalized Maize Marketing Chain/Flow
Farmer/Producer
Bicyclists
Assemblers
Dis-Assemblers
Retailers
Consumers
Large
Scale
Posho Millers
Wholesalers
Imports
14
the wholesalers move their operation to Kericho, Bomet, and Trans-Mara district where
maize is harvested at this time of the year (See Map1).
Most of the wholesalers in Nakuru preferred to sell their maize to Nairobi, Nyeri and Ukambani
districts (Machakos, Kitui, Mwingi and Makueni). Those based in Trans- Nzoia preferred to sell
to Siaya, Kisumu and other maize deficit areas within Nyanza. In the peak harvest season, most
wholesalers from both Trans-Nzoia and Nakuru preferred to sell to the large-scale millers because
of their ability to buy in large volumes and their quick payment. It took less time sell maize to
the millers than it did to sell directly to retailers. The responses indicated that wholesalers
favored selling to millers partially because the transaction costs per unit sold were very low
compared to other potential buyers.
Dis-assemblers
‘Dis-assembler’ is a term coined in this study to refer to a category of maize traders who buy
maize mainly from large wholesalers in the deficit areas, and break-down the volumes for resale
to smaller-scale retailers and final consumers. Dis-assemblers are usually local traders who raise
their initial capital from either salaried employment or from their involvement in other business
activities. There appear to be economies of scope in undertaking several different types of
businesses if the seasonal patterns of expenditures and revenue are different, so that revenue
coming in from one business can be used to finance purchases in another business. Most of the
dis-assemblers were also involved in maize retailing to consumers. Dis-assemblers also
assembled maize during the short harvest period in the generally deficit areas in which they
operate. Likewise assemblers in the surplus regions turn into dis-assemblers during the slack
maize-harvesting season when some farmers run out of maize and begin purchasing for home
consumption.
Retailers
This category of market agents were found to consist of those traders who bought and sold maize
in small quantities and were directly selling to consumer for home consumption. Retailers were
mainly found in the deficit regions with a few of them in the urban areas. The retailers in the
surplus regions were over shadowed in business by the assemblers who took over to dis-
assembling and retailing activities during the slack periods. In the deficit regions, these retailers

15
TRANS-NZOIA
UASINGISHU
SIAYA
NAKURUKERICHO
KISUMUNYERI
MWINGIBOMET
MACHAKOS
TRANS-MARA
KITUI
NAIROBI
MOMBASA
Maize Flow From Surplus To Deficit Areas
Ethiopia
Uganda
Tanzania
Somali
Key:
Major deficit area
Minor deficit area
Major surplus area
Minor surplus area

16
purchased maize from the dis-assemblers or directly from the wholesalers while in the surplus
regions, retailers purchased maize from the bicycle traders or directly from farmers. Most of
these retailers were also involved in other business activities such as general retail stores.
The retailer category also consisted of small traders mostly women in the market places where
maize was stocked and sold in small volumes in temporary structures. The retailers in Nairobi
were a combination of those with shops operating other retail stores at the wholesale markets and
the small traders in market places such as Kibera and Korogocho.
Posho Millers
This category of traders was involved in the processing of maize grain into maize meal. Posho
millers employed a simple hammer milling technology where the germ and the bran of the maize
grain were milled together with the kernel into flour. The small-scale millers specialized in
custom milling whereby the customer provided the grain. Some posho millers had invested in de-
hullers to produce a more refined product that is most often referred to as “Number 1”. Capacity
utilization was used to distinguish these small-scale from the large-scale millers. The small-scale
millers milled either Number 1 or 2 or both but were not involved in the packaging of maize
meal. The flour is either sold in kilograms or is packed in bags. Most posho millers in the maize
surplus regions were doing more of custom milling than production milling. Investment in
posho milling has expanded rapidly in the post-liberalization period for reasons explained below.
Over the past decade, posho millers have moved a relatively negligible share to an important
proportion of maize meal market in urban and rural grain-deficit areas (Jayne and Argwings-
Kodhek 1997; Mukumbu and Jayne1994).
Large-scale Millers
Large Scale Millers are those processors who deal with large volumes of maize and do their own
packaging. These millers are characterized by large-scale, capital intensive, roller-milling
technology. Most of the large-scale millers were concentrated in maize deficit areas with a few
of them in the surplus regions of Kitale, Eldoret and Nakuru. As shown in Figure 1, most millers
acquired maize from wholesalers, farmers, and the NCPB stores depending on the season. In
order to cope with the inter-seasonal variations of maize availability or supplies, millers have
hired storage facilities, including silos in the maize surplus areas where maize is stored
17
3.1.2 Relative Importance of Alternative Maize Marketing Channels
Results from the survey (Table 3.1) showed that in the peak maize marketing season, all traders
bought maize directly from farmers. About 45% of the maize bought by wholesalers in the peak
marketing season was purchased directly from farmers. In the slack marketing period,
wholesalers bought 61% of their maize direct from farmers. The predominance of farmer-to-
wholesaler trade is largely due to the existence of large-scale commercial farms producing large
surpluses. Odhiambo et al. (1993) indicate that about 25% of the total marketed maize output
produced in Kenya comes from small-scale farms, while the other 75% comes from large-scale
farms, mainly in the Northern Rift Valley. With many large farms, wholesalers can directly
acquire the volumes needed for long-distance trade without needing the services of assemblers to
bulk up small volumes from small farms. And these results suggest that, to some extent, the
storage of maize for consumption later in the season is occurring on large farms that directly
supply wholesalers in the later months.
However, smaller farms also produce maize surpluses in particular areas (about 30% of small
farms sold maize in 1996 and 1997, see Jayne et al 1998). For these farmers, a smaller scale and
more decentralized marketing system has developed in which assemblers and other diversified
traders purchase maize from farmers and bulk the volumes up for subsequent sale to wholesalers
and others. During the peak-harvesting season, wholesalers take more time to gather the maize
and fill the lorry hence relatively more reliance on the assemblers who stocked more maize thus
taking less time to make a lorry load. But in the slack period, when the volume of maize sales
from small farmers declines, and assemblers servicing them collect less, wholesalers turn more to
large-scale farmers as the main source of maize.
The findings indicate that farmers sold only a small proportion of maize direct to large millers
and the NCPB. Most who do sell to NCPB are large-scale farmers (Argwings-Kodhek 1998).
The main outlet for the maize from the assemblers was to the wholesaler, but the importance of
wholesalers as a market outlet declines as the season progresses.. Assemblers sold 76% of their
total maize volume sold to wholesalers, 11% to retailers, and 5% directly to consumers in the
months directly after harvest. But as the season advanced, assemblers sold only 55% of their
volumes to wholesalers. Large-scale and small-scale mills accounted for 7% and 9% of
assemblers’ sales during the slack season, while dis-assemblers, retailers, and consumers
accounted for a combined 29%.
18
During the peak harvesting season, wholesalers sell about 51% of the total volume they handled
to the large-scale millers, 13% to small processors mainly in the urban centers, 28% to the dis-
assemblers in deficit areas, and 8% to retailers. Later in the season, wholesalers sold a higher
share of their maize (55%) to the dis-assemblers, 24% to retailers, and 11% direct to consumers.
Notably, the volume of sales to large scale millers dropped off considerably as the season
progressed, from 51% of wholesalers’ sales to only 10% (to millers or NCPB (who generally sold
to millers) combined). Large-scale millers tended to rely more on NCPB and imports for their
supplies later in the year especially between June and November when domestic supplies are tight
and prices rise up to import parity levels.
Dis-assemblers are marketing agents who provide a link between the wholesalers and the
consumers either directly or through the retailers. Some dis-assemblers bought maize directly
from farmers or from the assemblers in maize surplus areas. They did this by forming a group of
4 to 5 who then hired a lorry that transported the maize from the surplus region. Of the total
volume purchased by the dis-assemblers during the peak period, 41% was from the wholesalers,
33% from farmers, and 26% from the assemblers. In the slack season, 55% of the maize traded
by the dis-assembler was procured from wholesalers. Retailers and consumers accounted for
91% of the maize sold by the dis-assemblers with a bigger proportion (58%) being sold to
retailers. The other 9% were sold to both the posho and large-scale millers as shown in Table3.1.
The large-scale millers form a link between maize producers and consumers of sifted and super-
sifted maize meal products. Millers procure their maize mainly from wholesalers during the peak
marketing season. Maize is stored in rented stores for use later in the season. As the harvests
season wane, millers rely more on their stocks in addition to maize supplies from NCPB. On the
other hand, the posho millers form a link between maize producers and consumers of whole
maize meal (posho). Most of the posho millers particularly those specializing in custom milling in
the surplus maize areas did not stock maize for resale. Posho millers who are doing production
milling and those in the deficit areas were also retailing maize.
19
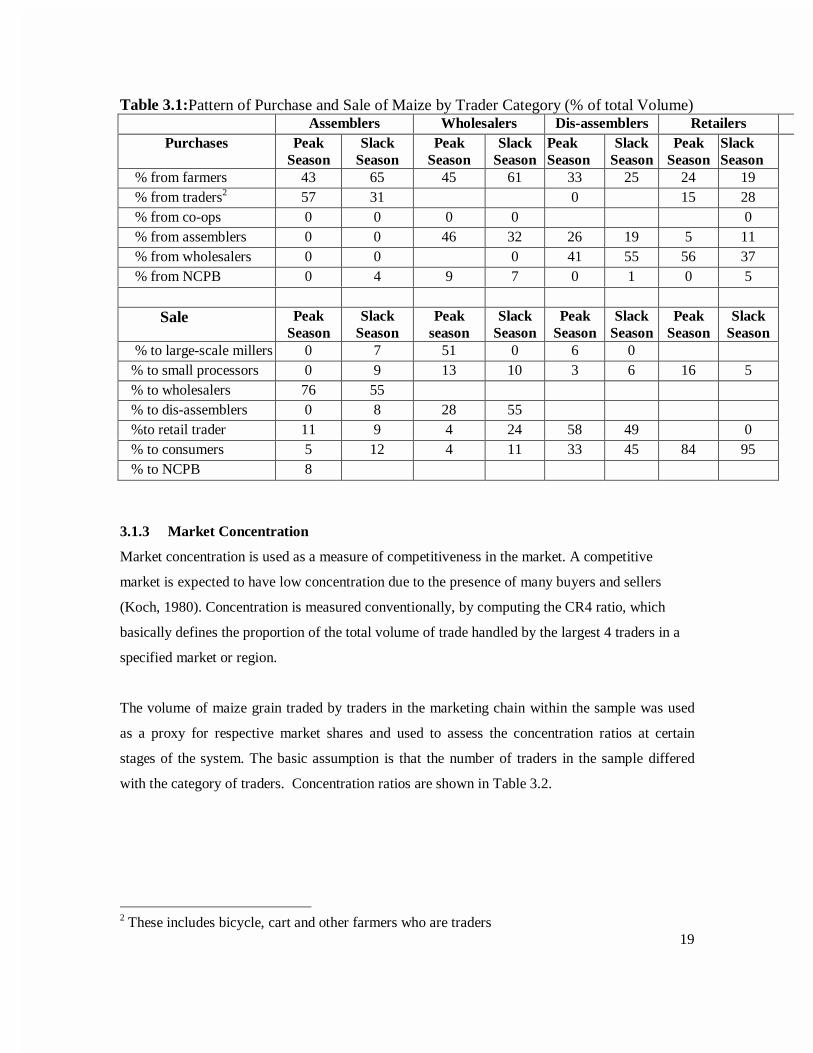
Table 3.1:Pattern of Purchase and Sale of Maize by Trader Category (% of total Volume)Assemblers Wholesalers Dis-assemblers Retailers
Purchases PeakSeason
SlackSeason
PeakSeason
SlackSeason
PeakSeason
SlackSeason
PeakSeason
SlackSeason
% from farmers 43 65 45 61 33 25 24 19 % from traders2 57 31 0 15 28 % from co-ops 0 0 0 0 0 % from assemblers 0 0 46 32 26 19 5 11 % from wholesalers 0 0 0 41 55 56 37 % from NCPB 0 4 9 7 0 1 0 5
Sale PeakSeason
SlackSeason
Peakseason
SlackSeason
PeakSeason
SlackSeason
PeakSeason
SlackSeason
% to large-scale millers 0 7 51 0 6 0 % to small processors 0 9 13 10 3 6 16 5 % to wholesalers 76 55 % to dis-assemblers 0 8 28 55 %to retail trader 11 9 4 24 58 49 0 % to consumers 5 12 4 11 33 45 84 95 % to NCPB 8
3.1.3 Market Concentration
Market concentration is used as a measure of competitiveness in the market. A competitive
market is expected to have low concentration due to the presence of many buyers and sellers
(Koch, 1980). Concentration is measured conventionally, by computing the CR4 ratio, which
basically defines the proportion of the total volume of trade handled by the largest 4 traders in a
specified market or region.
The volume of maize grain traded by traders in the marketing chain within the sample was used
as a proxy for respective market shares and used to assess the concentration ratios at certain
stages of the system. The basic assumption is that the number of traders in the sample differed
with the category of traders. Concentration ratios are shown in Table 3.2.
2 These includes bicycle, cart and other farmers who are traders

20
Table 3.2. Market Concentration Ratios for the various Trader Categories
Trader Category District CR4
Assemblers Nakuru 0.33
Kitale 0.39
Whole sample 0.22
Dis-assemblers Siaya 0.33
Nairobi 0.23
Eastern 0.19
Whole sample 0.12
Wholesalers Nakuru 0.28
Kitale 0.22
Surplus 0.17
Siaya 0.33
Nairobi 0.37
Eastern 0.40
Deficit 0.23
Whole sample 0.12
Most stages of the marketing chain have concentration ratios (CR4) of less than 40%, the typical
benchmark used beyond which there is concern for excessive market concentration. This
indicates that the different stages of the marketing system are relatively competitive and reveals
the absence of major barriers to entry into the business. It is important to note that the level of
concentration differs from region to region and from trader category to another. The clusters for
example, indicate higher concentration ratios than for each individual category of traders. This
could be due to the fact that most of the traders who had closed maize marketing business by the
time of the study could have been the small traders with small volumes leaving the big and long-
term traders. This is particularly so for the assemblers. The concentration ratio for the assemblers
in Kitale was slightly higher than for Nakuru, which is attributed to the presence of some few
assemblers who acted as agents for the large-scale miller and purchased large volumes on their
behalf. The maize was stored in silos rented in Kitale. The dis-assemblers in the Ukambani were
found to be more competitive than the ones in Siaya and Nairobi. This could be due to the large

21
number of such traders in the eastern region. Maize wholesaling was slightly more concentrated
in Nairobi and Ukambani than in all the other areas. This could be attributed to reduced numbers
of traders as the majority avoided transporting maize to the East of the Rift Valley so as to evade
charges at the weighbridge thus preferring to take maize to Siaya and Kisumu. It could also be
that some transporters avoided long distance hauls due to the poor state of road and vehicles used,
thus favoring the shorter Kisumu/Siaya route where there are fewer traffic police checks. This
resulted in only a few large traders having a market share in Nairobi and Ukambani areas.
Trading in maize in these areas requires a higher capital investment than in areas around Siaya
and Kisumu due to the increased transport costs.
Concentration in the market is actually lower than estimated here, because these ratios were
computed only for a given type of trader. For example, we did not include wholesalers who also
were involved in assembly in the calculation of concentration ratios at the assembly level. Most
wholesalers were also involved in assembling (Table 3.1). The presence of wholesalers integrated
into assembly puts even greater competition at this stage to the benefit of farmers. The point is
equally valid at other levels of the system (e.g., primary retailers were not included in the
calculation of market concentration at the dis-assembler level). Thus, the CR4 ratios in Table 3.2
should be regarded as upper-bounded estimates.
3.1.4 Degree of Product or Service Differentiation
Results from the study revealed that product differentiation in maize marketing is important due
to quality differences. The major product differentiation factors are color, size and moisture
content of the maize as well as the quality of flour milled out of it. At all stages of the maize
marketing chain before the milling stage, the respondents reported that quality differences are
distinguished by eyesight. Maize traders used color, size of the kernels, and amount of foreign
material as the main criteria determining quality and price. This is a crucial factor in product
differentiation. Poor quality maize was offered lower prices. In all cases, over 90% of
respondents in all categories of traders reported that they visually inspected the maize before
purchasing it. At the large-scale miller’s level, quality inspection was enhanced by the use of
moisture meters. According to the quality standards in Kenya, the maximum moisture content
level should be 13.5%. Grains with a higher moisture content are often rejected because this
normally detracts from the quality of the maize flour. Quality was enhanced through sorting,
cleaning and drying.

22
The majority of maize traders expressed their satisfaction in the current system of grading maize
in the country. About 81% of retailers, 74% of dis-assemblers, 57% of assembler said they were
happy with the current grading system.
3.2 Characteristics and Conduct of Maize Traders
3.2.1 Characteristic of Maize Traders
Most maize traders were usually more horizontally than vertically integrated. Survey results
indicated that 33% of the retailers, 21% of assemblers and 18% of wholesalers and dissemblers
were involved in the retail sale of maize meal. Many wholesalers were also assemblers. But for
the majority of maize traders, the most important other business activities were not directly linked
to maize trade (Table 3.3). Most of the dis-assembler and retailers were operating diversified
retail businesses. Horizontal integration thus is used as a strategy to cope with the seasonal
nature of maize trade and also the risks associated with maize trade. The seasonal revenues from
other business activities facilitate access to working capital to finance maize purchases. None of
the large-scale maize millers interviewed were involved in either retailing or wholesaling of
maize meal.
However, about 43% of posho millers interviewed were also involved in retailing maize meal.
We refer to these kinds of posho millers as production millers: they sell meal usually milled and
stocked at their shop premises. In response to the liberalization of maize market, there was an
over-investment of posho millers in the urban and rural areas thus resulting in high competition
among them and hence reduced capacity utilization (Mukumbu, 1992). About 89% of the posho
millers interviewed were primarily engaged in custom milling (milling consumers’ grain into
meal for a fee), whereas the other 11% were primarily engaged in production milling. However,
over 40% of the posho millers were also retailers who stocked maize for resale to consumers
(although for most of them their custom-milling throughput surpassed their throughput from
production milling). Some posho millers in Nakuru and Nairobi who were production milling for
sale to customers were also milling Number 1, a more refined meal comparable to the sifted flour
produced by the large-scale millers. These posho millers purchased grain from wholesalers or
directly from farmers, milled and either exchanged directly with the customers or retailed the
meal. The extraction rates for whole meal varied from 97% to 100% with a mean rate of 99.5%.
That of Number 1 varied from 63% to 88% with a mean of 76%. The milling charge for the
23
whole meal varied from Ksh 2 per kg of maize in the rural areas to Ksh 2.60 in towns. To
exchange with the production milled number 1 maize meal, the customer was required to add an
extra Ksh 4.70 per kg of maize although the by-product was then retained by the miller. Among
the constraints cited by the small millers was inadequate access to credit, high costs of electricity,
low capacity utilization and price instability for those who also acted as maize retailers.
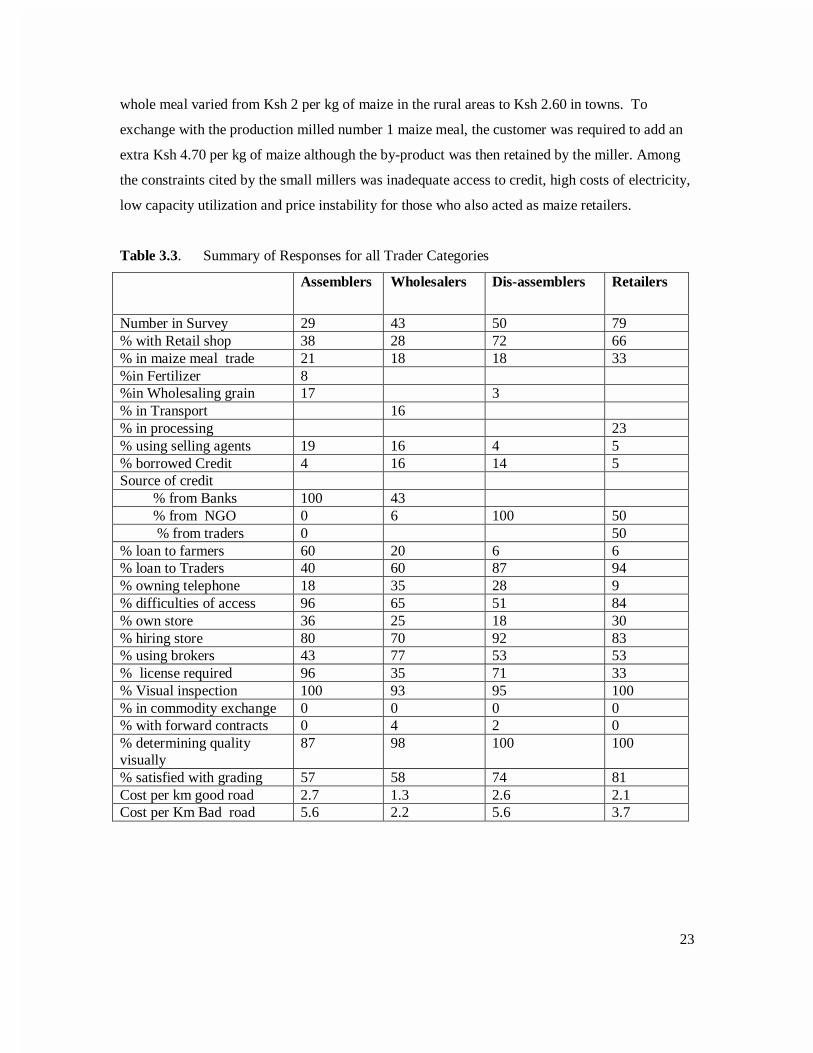
Table 3.3. Summary of Responses for all Trader Categories
Assemblers Wholesalers Dis-assemblers Retailers
Number in Survey 29 43 50 79% with Retail shop 38 28 72 66% in maize meal trade 21 18 18 33%in Fertilizer 8%in Wholesaling grain 17 3% in Transport 16% in processing 23% using selling agents 19 16 4 5% borrowed Credit 4 16 14 5Source of credit % from Banks 100 43 % from NGO 0 6 100 50 % from traders 0 50% loan to farmers 60 20 6 6% loan to Traders 40 60 87 94% owning telephone 18 35 28 9% difficulties of access 96 65 51 84% own store 36 25 18 30% hiring store 80 70 92 83% using brokers 43 77 53 53% license required 96 35 71 33% Visual inspection 100 93 95 100% in commodity exchange 0 0 0 0% with forward contracts 0 4 2 0% determining qualityvisually
87 98 100 100
% satisfied with grading 57 58 74 81Cost per km good road 2.7 1.3 2.6 2.1Cost per Km Bad road 5.6 2.2 5.6 3.7
24
Large-scale millers acquired about 76 % of their grain requirement from the wholesalers mainly
in the main harvesting period. About 24% of the purchases by the large-scale millers were from
large-scale farmers, 8% of their purchases was from small-scale farmers who hire and pooled
transport to deliver maize to the miller. During this peak period, there were little maize purchases
from NCPB. But in the slack period, 32% of the purchase by the millers were from traders who
bought maize from large-scale farmers who had stored maize. However the bulk of purchase
during the slack period (60%) is from the NCPB stores. Although the millers reported to have
rented large storage capacity, only about 5 % of the large-scale millers had enough maize stock to
last for more than 2 months. The millers intimated that the entry of NCPB in maize purchases in
the season and following the imposition of import duty of about 33 percent, the future policy
direction was uncertain thus creating price uncertainty. Millers thus adopted a wait and see
attitude. In the meantime, wholesalers exported substantial volumes of maize to Tanzania due to
drought conditions there, which along with the purchases by NCPB drove maize prices in Nairobi
from about Ksh 800 per bag during the harvest to about Ksh 1450 per bag in a span of 4 months.
In Siaya, prices ran up from Ksh 700 to 1,300 per bag over the same period. The millers thus
intimated that price instability and uncertain future policy environment are among the main
constraints affecting the maize milling business.
Most millers also indicated that they were suffering from low processing capacity utilization (less
than 60 percent) caused by competition from posho and small-scale maize millers. The posho
have become relatively cheaper and more readily available after the controls on maize movement
and implicit subsidies on large-scale sifted meal were abolished in late 1993 (Jayne and
Argwings-Kodhek 1997). Difficulties in stock financing, inadequate access to working capital
and the high and volatile interest rates are some of the other constraints that discourage millers
from storing maize.
Large-scale millers were asked about their preferences for the current reformed marketing system
vs. the controlled marketing system. Their opinions were markedly divided. Whereas only 10%
were non-committal, 45% preferred the current system and the remaining 45% preferred the
control system. The sizeable proportion of millers preferring the control period was
understandable because large-scale millers were formerly the beneficiaries of subsidies and
preferential access to maize from the NCPB during the regulated grain trading systems. Maize

25
was stored free of charge for the large-scale millers by NCPB through the pan-seasonal pricing
policy. Most importantly, the former controls on private maize movement constrained grain
supplies available for posho milling in urban and rural deficit areas, thus restricting the
competition that large-scale millers faced. Consumers have been major beneficiaries from the
transition to liberalization as prices in deficit areas have declined. The price decline in deficit
areas appears mostly due to more direct flow of maize grain into deficit areas as the controls on
inter-district maize trade were lifted.
The nature of maize marketing encouraged the traders to devise new marketing strategies to fight
off competition and thus retain their business particularly at the onset of the season when seasonal
traders invade the market. These strategies included:
♦ Reliance on brokers to sources maize (i.e. 43% of the assemblers, 77% of wholesalers, 53%
of dis-assemblers and retailers). Brokers provided the market information about maize
availability in the surplus regions. Amongst all the traders, wholesalers particularly employed
the services of brokers to purchase maize.
♦ Switching business between maize assembling and dis-assembling depending on the season.
Assemblers converted their activities to disassembling maize in later in the year when
supplies from the farm dwindled and demand increased. They buy maize from the
wholesalers for resale to the retailers and consumers in the same areas they bought maize
during the harvest season.
♦ Maintaining good reputation with the customers, extending credit facilities, insisting on high
quality grain and flexibly adjusting their prices are some of the strategies used by traders to
minimize competition particularly that from the seasonal traders.
♦ Maintaining a flexible maize selling strategy where for example wholesalers purchase maize
directly from maize farmers during the peak marketing seasons for delivery to millers rather
than to disassemblers whose demand for maize is low at this time. As the maize sale season
advances, the wholesalers shifted from assemblers to large-scale farmers as the main source
of grain, leaving it to assemblers to spend the time and cost of bulking up the dwindling off-
flow of maize from smaller farms for sale to small-scale retailers and consumers.

26
4.0 MARKET PERFORMANCE
4.1 Maize Marketing Margins3
4.1.1 Wholesale Maize Price Spreads
This section first examines trends in maize prices and their movement in response to
liberalization. We then examine the trends in price spreads, i.e., the difference between wholesale
prices in key regional surplus and deficit markets.
Three periods were distinguished. First, the control period, which starts first quarter of 1985 (the
starting point of the data used) until when the Cereal Sector Reform Program was initiated in
1989. Second, the initial reform period, termed Phase 1 Reform period between the first quarter
of 1989 to the fourth quarter of 1993, which was characterized by only partial lifting of the inter-
district controls on private maize trade, the continued dominance of the NCPB in maize purchase
and sales, and the continuation of controls on producer and consumer maize prices through the
formal sector marketing channel. The Phase 2 Reform period, the first quarter 1994 to the third
quarter 1998, was characterized by complete decontrol of domestic maize movement and maize
meal prices, and an almost negligible role of the NCPB in maize purchases.
Unit root tests both Philips-Peron (PP) and augmented Dickey Fuller (ADF) tests, was performed
on all market price series to guide model specification before proceeding to the impact model
Details of this estimation are explained elsewhere (Karanja, Jayne, and Strasberg, 1998).
One of the most important and debated issues in Kenyan food policy discussions has been the
effect of food market liberalization. One viewpoint holds that liberalization has been associated
with a cutback in support to smallholder farmers. Evidence in support of this view is that the
NCPB has closed many rural grain depots since the reform process began, as part of tightening
fiscal constraint under structural adjustment. The argument is that the withdrawal of NCPB
market infrastructure cut off farmers from grain sale outlets and forced them to face lower and
unstable output prices in local markets or at farm gate. However, as indicated earlier, many
analysts anticipated that the market reforms would lead to better producer prices and access to
farm inputs by farmers.

27
Table 4.1 presents descriptive data on the levels and variability of maize prices in various markets
over the sample period. For most markets reported, there was a progressive decline in the
inflation-adjusted maize price between the control period and the Phase 2 period of liberalization.
The price decline was especially pronounced in the maize deficit areas of Nairobi, Kisumu, and
Nyeri, where wholesale prices have declined 34% on average between the control period and
Phase 2 liberalization period. By contrast, prices declined by an average of 17% over the same
period in the generally surplus markets of Kitale, Eldoret, Kisii and Nakuru. This suggests that
price spreads between the surplus and deficit areas may have narrowed somewhat after
liberalization. While the NCPB producer price was on average lower than most market prices
during the control period, this has shifted since the market reforms were initiated. However, it is
difficult to make meaningful comparisons between NCPB prices and market prices in the Phase 2
period as the NCPB’s role in the market declined to marginal proportions since 1995. But when
the NCPB has purchased grain in the market in recent years, it has typically done so at higher
prices than prevailing market prices.
The market reform process has also been associated with more variable prices than the NCPB’s
pan-seasonal, pan-territorial prices during the control period. While unconditional price variances
in local markets have generally increased, some of the variability is predictable and in fact
necessary to induce useful marketing functions by the private sector. For instance, seasonal price
increases are necessary to encourage on-farm and off-farm storage during the season, an area that
was deeply neglected and even found unnecessary during the control period. However, the extent
to which the unpredictable component of maize prices, that is the conditional variance in prices,
has increased in Kenya after market reform is unclear, and is a useful subject of future research.
Results are shown in Table 4.2. The adjusted R-squared values for each of the regressions are in
the range between 0.36 and 0.76. The results indicate strong seasonal effects in most markets,
and differences in seasonal high and low price periods. Rainfall effects are significantly negative,
as expected, in a few cases.
3 This section draws partially from Karanja, Jayne, and Strasberg (1998).

28
Table 4.1. Maize Prices and Standard Deviations in Selected Markets1
Control Period(1985.1 – 1988.4)
Reform Phase 1(1989.1 - 1993.4)
Reform Phase 2(1994.1 - 1998.3)
NCPB Price 919(54)
826(130)
1051(31)
Eldoret 1399(246)
1181(319)
1022(346)
Kitale 1140(205)
1069(233)
956(319)
Kisii 1219(219)
1092(214)
942(313)
Nakuru 937(208)
1030(314)
964(294)
Kisumu 1581(144)
1424(290)
1149(338)
Meru 1349(285)
1102(353)
1122(293)
Nyeri 1730(367)
1280(191)
1094(294)
Nairobi 1593(252)
1346(201)
1164(260)
Sources: Market Information Bureau, Ministry of Agriculture; Consumer price inflation data fromIMF Financial Statistics.1 Constant 1997 Ksh/90-kg bag (Standard deviations in parentheses).

29
Table 4.2. Seemingly Unrelated Regression Results by Selected Markets
Eldoret Kisii Kitale Nakuru Meru Nyeri Kisumu Nairobi
Constant 1044.5 *** 131.7 729.2 *** 652.5 *** 661.4 *** 519.3 *** 376.8 760.2 ***
1st quarter -50.7 229.6 *** 93.4 57.3 -28.6 64.2 126.2 9.2
2nd quarter 71.1 34.7 165.2 ** 67.9 163.4 ** 177.3 *** -54.3 72.6
3rd quarter -293.4 *** 161.4 *** -173.6 ** -76.2 90.7 63.0 -136.5 39.8
Rainfall -0.23 0.18 * -0.04 -0.33 ** -0.10 -0.18 * 0.25 -0.09
Reform Phase 1 -169 ** -42.8 -67.1 91.6 * -103.2 * -36.3 -156.4 -94.0 **
Reform Phase 2 -219 *** -87.3 -103.8 * 61.7 -36.1 -50.4 -253.2 ** -163.2 ***
P t-1 0.38 *** 0.46 *** 0.38 ** 0.57 *** 0.53 *** 0.69 *** 0.45 *** 0.46 **
P t-2 – -0.12 -- -- -0.23 -- -- --
Adjusted R2
DW
0.38
1.87
0.37
1.66
0.34
1.92
0.57
1.99
0.44
1.56
0.76
1.89
0.46
1.71
0.49
1.59
30
This suggests that maize prices in some areas are less affected by local rainfall conditions compared to other
factors.
Regarding the effects of the price changes due to market reform, at least one of the two reform coefficients
was statistically significant at least at the 10% level in 6 of 8 selected markets. The Phase 1 reform variable
was negative in 7 of 8 cases and significantly in only 4 cases. During Phase 2, which is the more important
of the two reform periods, the effect on maize price was, again, negative in 7 of the 8 markets and again
significantly in 4 cases. However, the magnitude of effect was larger in Phase 2 than during Phase 1.
Across all 8 markets, the mean change in the wholesale maize price was -98.7 Ksh per 90 kg bag. This
represented an 8% decline in maize price levels, on average, due to market reform after controlling for other
factors represented in the model. For particular markets, the percentage change in price levels associated
with the Phase 2 reforms ranged from -16.0% in Kisumu to +6.5% in Nakuru.
4.1.2 Effects of liberalization on price spreads between surplus and deficit markets
The impact of liberalization on the price spreads between major regional markets is now straightforward.
The effects can be calculated by subtracting the coefficient values on “Reform Phase 1" and “Reform Phase
2" in any surplus market (in Table 4.2) from their corresponding coefficient values in any deficit market, as
long as the two markets are linked either directly or indirectly by trade. This will show the net effect of
liberalization on the price spread between two markets after controlling for rainfall, seasonally, and the
information contained in lagged price movements. The results are shown in Table 4.3.
The findings indicate that along most of the major trade routes where data was available, marketing margins
have declined, sometimes substantially. Considering that average price spreads in the control period were in
the range of 200-500 Ksh per bag, the change in margins reported in Table 4.3 are quite substantial.
However, a few market pairs experienced greater price spreads, especially those involving Eldoret market,
where prices have fallen sharply since the reforms were initiated. Overall, however, the results show that
the spatial price spreads between surplus and deficit regions of the country have declined, reflecting the fact
that prices in the deficit consumer areas have generally declined more so than those in the surplus areas
during the current liberalization period. The finding of a decline in spatial price spreads is consistent with
prior expectations that the removal of restrictions on inter-district grain movement would reduce the
marketing margin between surplus and deficit regions.

31
Table 4.3. Effects of Maize Market Liberalization, Phase 1 (1989 - 1993) and Phase 2 (1994-1998) on
Wholesale Price Spreads Between Major Regional Markets
Change in Price Spread (Ksh per bag)
market pair: Phase 1 Phase 2
Kitale-Nairobi
Kitale-Kisumu
Kitale-Meru
-27
-89
- 9
-59
-144
- 68
Eldoret-Nairobi
Eldoret-Kisumu
Eldoret-Meru
+75
+13
-66
+56
-34
+183
Nakuru-Nairobi
Nakuru-Nyeri
Nakuru-Meru
-186
-128
-195
-225
-112
-98
4.1.3 Millers Margin
Table 4.2 represents the Millers margin for all types of maize meal. The margin to the posho miller for
whole meal was the custom-milling fee charged by hammer millers. This varied between Ksh 2 .20 and
2.60 per kilogram of maize, depending on whether it is in a rural or urban area. The milling margin for
whole meal was reported to have been Ksh 1.70 in 1993 and 1.94 in 1995 (after re-scaling into 1998
constant Ksh). The increase in milling margins since 1995 thus reflects an increase of about 20 percent.
The milling margins for those milling Number 1 was found to be Ksh 5.70 per kg of maize grain as
shown in Table 4.4.
The margin for sifted maize meal was Ksh 9.3 per kg. This margin is the miller/retailer margin because
the consumer price of sifted meal includes the cost of distribution from the mill to retail shops as well as
the mark up for the retailer.

32
Table 4.4 Maize Meal Prices and Milling Margins (1998)
Whole meal Number 1 Sifted meal
Extraction ratio
Grain to meal
1.03 1.24 1.19
Maize price Ksh/kg 10.3 16.3
Value of by products
Ksh/kg
0 4.1 5.3
Milling
Margin Ksh/Kg
2.2 5.7 9.3
The milling margin by the large-scale millers has not changed much since 1995. This could be attributed
to increased competition in the milling sector after liberalization particularly from the heavy investment in
posho mills, thus causing a shift in consumption away from sifted to custom meal. This finding mirrors
the post-liberalization experience of other countries in eastern and southern Africa, in which the large-
scale milling sector has experienced much greater competition from the small-scale milling sector.
Consumers have benefited greatly from this situation. The increased availability of whole meal at 60% to
75% the cost of roller meal has partially or fully offset the adverse effects of eliminating consumer
subsidies on roller meal in these countries. Similar benefits have been achieved in rural grain-deficit
areas that were formerly dependent on refined industrial-produced meal prior to the reforms. Household
surveys carried out in the 1993-1995 period indicated that low-income consumer’s in particular, shifted
quickly to hammer-milled meal (see Jayne et al. 1995 for a synthesis of cross-country findings).
4.2 Barriers to Entry
The issues that were considered important in determining the conditions or barriers to entry into maize
marketing pertains to the institutional, technical, financial and risk factors associated with this business.
Institutional aspects
Institutional barriers to entry into maize marketing include government rules and regulations regarding
the conditions set before entering into maize business. This includes the licensing requirements (98% of
assemblers, 71 % of dis-assemblers, 35% of wholesalers and 33% of retailers reported that they required a
license to trade in maize). There is a government requirement in form of annual licenses for both new and
old entrants. This may sometimes be translated as a barrier to entry especially when small traders with
small capital base intend to enter into maize trade. Maize importers are also required to pay certain

33
statutory duties and levies on imports of maize. Millers willing to export maize flour are also required to
get authorization before this can be done. However, except for the licensing fees, duties and levies, there
are no direct restrictions on entering maize marketing.
Technical barriers
Technical barriers to maize relate to the flow of information and the constraints that could be hampering
it. Access to all the information regarding sources and outlets of maize, prevailing market prices and the
cost structure in every market channel are important. Whereas most traders depended on telephone to get
market information, only 18% of assemblers, 28% of dis-assemblers, and 9% of retailers had access to
telephone usually from public call boxes. Assemblers and dis-assemblers relied on wholesalers in getting
the maize prices from the deficit and surplus regions respectively. They could also send individuals on
price collection errands. This asymmetrical information flow reduces the bargaining power of assemblers
and dis-assemblers thus making maize trading riskier. It is also expensive to collect prices by sending
people to markets. Prices were at times wrong particularly in times of high volatility. Ironically, a higher
proportion of wholesalers (35%) had access to telephone than all the others. But even so, majority of
those using telephones had difficulties in accessing well functioning telephones.
Survey results also indicated that traders relied on brokers in various buying and selling centers to get
market information. The daily newspapers also include a section on the retail prices of maize and other
commodities every day. However, this information is not readily available in remote areas and does not
include other non-price information.
Financial barriers
These relate to the capital and credit availability especially the initial capital investment. Access to
working capital was found to be a major barrier to entry into the business and to expansion by the old
traders. This is attributed to lack of an organized system of availing credit to the traders. The only source
of credit for the traders is the commercial banks but the high interest rates and the collateral issue are a
major limitation in the acquisition of credit. Results from the survey indicated that only about 4% of
assemblers, 14% of dis-assemblers, 16% of wholesalers and 5% on retailers had access to credit. Of those
who had access to credit, it was inadequate and repayments not properly tied to the sale of the crop.
About 42% of the credit to wholesalers were from commercial banks. But high and unstable interest rates
and the requirements for collateral by the commercial banks makes commercial borrowing risky. Lack of
credit thus is a barrier to entry into maize trade.

34
The financial barrier thus is a major impediment to entry into maize marketing particularly wholesaling
and large-scale milling whose capital requirements are higher than in assembling, dis-assembling retail
and posho milling. These other areas have been the easiest to enter hence the high competition at these
stages. Business expansion and inter-seasonal storage have also been limited by capital constraints.
Large-scale millers are unwilling to finance stocks to last them for more than 2 months.
Infrastructure Development
Most traders particularly the dis assemblers and wholesalers cited poor road network and inaccessible
rural feeder roads as another factor that have led to high transport costs thus increasing maize costs to
consumers. About 21% of the assemblers, 35% of dis-assemblers and 48% of wholesalers sited poor
roads as one of the main constraints in maize marketing. Similarly, 15% of the assemblers interviewed,
17% of dis-assemblers and 40% of the wholesalers cited high transport cost as a bottleneck to efficient
maize marketing. Table 4.5 shows the difference in maize transport costs between good tarmac road and a
poor one. In almost all cases, the transport costs on bad roads is more than one and half times that of the
good roads. In the remote areas of the surplus production region, donkey carts are used to collect the grain
and move it closer to the passable roads for bulking and sale to the assemblers. Farmers are paid lower
prices than would be the case if transport infrastructure were improved. The newly introduced axle limit
compliance was also cited as a factor that has increased transport costs. At the weighing bridges which are
located at various points along the truck roads, the officers demand an unconditional and unofficial Ksh
2000 per lorry load irrespective of whether the axle limits are exceeded. Transporters thus are encouraged
to exceed the axle limit to cover for this charge. They also are encouraged to transport maize at night to
avoid meeting the mobile weighing bridges that imposes a fine of Ksh 5 per every extra Kilogram
irrespective of whether the transporter had paid Ksh 2000 at the weighbridge. This has unofficially raised
transport costs. It also does not serve its initial intended purpose of reducing the wear and tear on the
road.
Table 4.5 Comparison between Costs on good and bad roads.
Assemblers Dis-assemblers Wholesalers RetailersCost per Km of good road 2.7 2.6 1.3 2.1Cost per Km of bad road 5.6 5.6 1.2 3.7Number of times bad overgood
2.07 2.15 0.92 1.76

35
Group Marketing
Group marketing arrangement is rare in the grains sector. In the entire sample, there was no evidence that
cooperatives or any other organized farmer groups were involved either in grain sales or purchases. It was
only in the Posho mills where over 40% of those interviewed reported having obtained financing from
cooperatives. The poor and negative image of cooperative arrangement stems from the unpopularity of
the other commodity handling, processing and marketing cooperatives such as those dealing with coffee,
pyrethrum and dairy. In deed, these organizations have been poorly managed, are corrupt and have been
state rather than farmer controlled thus lacking accountability to their members. The Cooperative Act has
been changed to make the cooperative more farmers than state driven though this have not improved the
marred image of the cooperatives. Nevertheless, some dairy and horticultural farmers on their initiatives
are forming loose organizations to market their produce and receive market services support as a group.
Farmers in grain marketing regions have made none of such initiatives. Formation of cooperatives or
other farmer organizations in grain marketing could improve farmer’s bargaining power. They also could
serve as a vehicle through which market services like market information and arrangement of commodity
sales in the conventional spot, forward or futures and options market could be handled. The cooperatives
or other farmer organizations will be required to bulk up smaller volumes from farmers and traders if they
are to benefit in trading in commodity exchanges and in arranging future contacts with millers and other
commodity traders.
Risks
Risks caused by price instability could also act as a barrier to entry in maize marketing. Traders avoid
buying and stocking huge stocks due to the price volatility. The millers are forced to deal with low stocks
sometimes, as low as less than a week’s stock to avoid this price volatility. One of the major fears the
government had before the liberalization of the maize marketing was that price fluctuation could have
adverse effects on poor maize consumers and producers. Respondents interviewed indicated that price
fluctuation is a constraint in maize marketing. About 41% of assemblers, 56% of wholesalers, 45% of dis-
assemblers and 32% of retailers cited price instability as a factor influencing grain trading. While the
NCPB intervened in the maize market in 1999 to buy maize and thus raise market prices, the funds given
to NCPB for this purpose was only enough to buy roughly 450,000 bags at the announced support price.
Though the intervention measure was short lived, it stirred the market and maize prices increased
gradually. With grain also migrating to Tanzania due to drought conditions there, prices unexpectedly
have shot up dramatically over a four-month period.
Measures to stabilize maize prices through new instruments like the futures exchange has not borne fruit.
Most maize thus is transacted under spot market or private negotiation. In the entire sample, only 2% of

36
the assemblers and 4% of wholesalers reported having future contracts in maize trade. The rest of the
responded traded maize in the spot market. None of the respondents reported being aware of the presence
of the commodity exchange market in Kenya.
The Kenya Agricultural Commodity Exchange (KACE) is a private firm, which was started in 1997 to
facilitate and ease the marketing of agricultural commodities. It identifies the buyer and seller and brings
them together. KACE is not a buyer or a seller of the commodities. Available information from the
Exchange indicated that although they had received offers by buyers and sellers, no transaction in maize
had taken place. But some buying and selling of other small grains like millet, sorghum and beans have
taken place. KACE would therefore offer an alternative to reduce the maize spot market volatility.
Farmers, traders and millers could use forward and futures contract to manage their price risks.
Understanding why very little maize volume is exchanged through the KACE could potentially help in
developing market arrangements for reducing the risks faced by farmers, traders, and millers.
Policy Environment
Uncertainty in the government policy environment was cited by 32% of assemblers, 47% dis-assemblers,
56% of wholesalers and 85% of millers interviewed as a major factor influencing the efficiency of grain
trading. Since 1994, the government has provided contrasting signals in the market liberalization process.
Variable import levies have been imposed at rates ranging from 25% to 32.5%. Exports are also
occasionally banned. The tariff was increased to 32.5% in September 1998 in anticipation of the large
harvests. At the time of this study, the tariff still stood at 32.5% though there were indications that the
tariffs could be adjusted downwards to 25% to encourage some imports in the months of September to
October.
But even where tariffs are imposed, some politically influential individuals are reputed to have their taxes
waived. This would not only provide preferential rents for those that can take advantage of their waiver,
but would also make it much more risky for others to engage in importation. Most traders particularly
millers are unaware when duties will be imposed or when import or export ban is reinstated. They are
thus unable to make long term business decisions or risk taking major losses if the levy is reduced or
waived for others. In 1998/99 harvest for example when NCPB started buying maize from the farmers,
the millers projected that NCPB could only manage to buy about 400,000 bags at Ksh 1000 per bag and
that as soon as this money is spent, they would exit from the market. However, NCPB continued to buy
their commercial stock thus remaining in the market longer than the millers anticipated. Maize was also
being exported to Tanzania. In response to the reducing supplies, maize prices increased and most of the
millers found themselves with no maize in their stores and facing an increasingly tight market. Millers are

37
now buying the maize from NCPB stores. Inability to predict with certainty the future government policy
has led to widespread speculation on the part of the private sector. Millers were hesitant to import maize
because due to the depreciation of the local currency, the import parity prices with the import duty
included were higher than the local prices as shown in Table 4.6. Local prices in Nairobi in May-June
1999 were about 1,350 Ksh per bag.
Table 4.6. Import Parity Prices for White Maize Ex South Africa, May-June, 1999
FOB ex Durban (US$) 154Ocean freight and Insurance (US$) 25CIF Mombasa (US$) 179Exchange rate (Ksh/US$) 70CIF Mombasa Ksh per ton (Ksh per ton) 12,530Import Duty (32.5%) 4,072Port Charges, bags & bagging costs Ksh/Ton 1,950Import parity (Mombasa) Ksh per bag 1,670Inland transport & Insurance (Ksh per bag) 300
Import parity Nairobi Ksh per bag (Ksh per bag) 1,970
The variable levy on maize import under these circumstances acted like an implicit import ban. Millers in
Mombasa in May 1999 paid Ksh 1700 per bag of maize bought in Kitale due to high transport costs
between Kitale and Mombasa. However, if no variable duty was charged, millers in Mombasa could have
imported maize from South Africa at the same price as that of the domestic maize in Nairobi. This could
have eased pressure on the local maize thus making sure that the stocks available will be enough for the
country until maize is available in July August from Trans-Mara, Kisii and Bomet areas and the long rains
production from all over the country.

38
5.0 Household Level Responses to Liberalization4
5.1 Changes in Farmer Cropping Patterns
Tables 5.1 and 5.2 present households' responses on how they have changed their agricultural activities
over the past 5 years. Changes in cropping patterns, while not necessarily driven by liberalization, are
likely to at least partially reflect the changes in incentives that have taken place with the changes in
relative crop prices due to the main reforms. Consistent with national level figures reported by Ministry
of Agriculture which show a decline in grain production since the mid-1980s, surveyed households in
most areas reported that their involvement in cereal production has decreased over time. The largest shift
out of cereal production has been along the coast, in the Marginal Rain Shadow Zone, Western Lowlands,
and Eastern Lowlands. Formerly, with controls on inter-district movement of maize, there may have been
heightened incentives to achieve cereal self-sufficiency, which may have encouraged cereal production in
these grain-deficit areas. But since these agro-ecological areas are generally not well suited to maize
production, the decline in cereal production after cereal market liberalization may reflect a shift in
cropping patterns more in line with comparative advantage, and a shift to higher valued crops. This is
consistent with aggregate production figures showing that growth rates for crops such as horticulture are
the highest in Kenya, while growth in cereal crop production has been generally stagnant. The only area
where the majority of households stated that they have increased their involvement in cereal production
since market liberalization was the High-Potential Maize Zone.
The findings in Table 5.2 show that over the past five years there has been a further shift into dairy
production in areas such as Eastern Lowlands, Central Highlands, and the Marginal Rain Shadow.
Involvement in dairy activities has remained stagnant or declined in the Western parts of the country.
4 Parts of this section draw from Argwings-Kodhek et al (1999).

39
Table 5.1. Household Involvement in Cereal Production Compared to 5 Years AgoMore now More 5 years
agoAbout the same Not sure
------- % of households -------
Coastal Lowlands 23.1% 67.9% 9.0% --
Eastern Lowlands 35.5% 60.8% 3.6% --
Western Lowlands 19.3% 63.1% 16.0% 1.6%
Western Transitional 14.0% 55.8% 30.2% --
High Potential MaizeZone
47.8% 29.0% 22.7% 0.4%
Western Highlands 24.4% 56.4% 17.9% 1.3%
Central Highlands 34.8% 48.3% 16.9% --
Marginal RainShadow
11.9% 79.7% 6.8% 1.7%
AVERAGE 31.5% 50.2% 17.7% 0.6%
Source: Egerton University/KARI/MSU Rural Household Survey, 1996/1997 season.
Table 5.2. Household Involvement in Dairy Production Compared to 5 Years AgoMore now More 5 years
agoAbout the same Not sure
------- % of households -------
Coastal Lowlands 5.2% 15.6% 79.2% --
Eastern Lowlands 47.6% 30.5% 22.0% --
Western Lowlands 15.5% 57.5% 23.8% 3.3%
Western Transitional 20.7% 66.2% 13.1% --
High Potential MaizeZone
32.5% 50.9% 16.4% 0.3%
Western Highlands 30.8% 39.1% 28.8% 1.3%
Central Highlands 53.4% 30.6% 16.0% --
Marginal Rain Shadow 40.7% 23.7% 33.9% 1.7%
AVERAGE 33.1% 43.2% 23.0% 0.7%
Source: Egerton University/KARI/MSU Rural Household Survey, 1996/1997 season.

40
5.2 Household Grain Purchase and Sale Behavior
An assessment of grain purchase and selling behavior of rural households was done in order to determine
those household which would benefit and who would suffer from price changes in various commodities.
Table 5.3 shows the percentage of rural households in each region that were net sellers of maize (i.e.,
sales of maize exceeded purchases), net buyers (purchases of maize exceeded sales) or neither buyer nor
seller (did not participate in the market). The results indicate that, across all the zones sampled, only 29%
and 34% of the farm households were net sellers of maize during the 1996/1997 and 1997/98 year,
respectively. Only in the High-Potential maize zone, comprised of Trans-Nzoia, Uasin Gishu, Nakuru,
Bomet, and Lugari Division of Kakamega were there more farmers who sold maize more maize than they
purchased. All of the zones were, in the aggregate, grain deficit regions, i.e.; more maize flowed into
these areas than flowed out, with the exception of the High-Potential Maize Zone. Clearly the parts of the
sample comprising the High-Potential Maize accounted for the vast bulk of the marketed maize supplies
produced domestically.

41
Table 5.3. Percapita Income and Net Maize Sales by Zone in 1997 and 1998
Number ofsampledhouseholds
PercapitaIncome
Percent ofnet maizeseller
Percapita net maize sales Price ofMaize per kg
Zone Year Amongnet sellers
Amongnetbuyers
All
Ksh Percent Kg kg kg Ksh/kgEastern Lowlands 1997 75 19,169 11 45 -38 -29 15
1998 75 21,285 32 90 -29 9 10Western Lowlands 1997 85 11,187 7 57 -68 -59 12
1998 85 10,044 4 69 -95 -89 11Western Transitional 1997 75 16,621 20 137 -75 -33 11
1998 75 16,302 27 144 -55 -2 12High Potential MaizeZone
1997 166 28,661 63 392 -47 231 11
1998 166 26,886 71 477 -42 332 11Western Highlands 1997 90 14,688 24 71 -45 -16 13
1998 90 13,806 21 94 -50 -19 12
Central Highlands 1997 121 30,540 18 80 -43 -22 13
1998 121 26,768 22 83 -23 0 11
Total 1997 612 21,902 29 265 -52 40 121998 612 20,620 34 312 -50 75 11
Source: Tegemeo Institute/Egerton University/KARI//MSU Rural Household Survey, 1997.

42
Table 5.3 highlights the following points:
1. The only region in the country in which over half of the surveyed households were net maize
sellers was the High Potential Maize Zone (including Trans Nzoia, Uasin Gishu, Nakuru, Bomet,
and Narok) was also among the most affluent areas in relative terms. Government price policy
designed to raise maize prices is likely to hurt rural households in most other areas of the country,
and benefit relatively wealthy farmers mainly in the High-Potential Maize Zone.
2. A majority of households were net buyers of maize in zones commonly perceived as grain
surplus. For example, over 70% of households in the highland areas of Vihiga and Kisii areas
were net buyers of maize. About 60% of households were net buyers in Kakamega and Bungoma
areas (Western Transitional).
3. In most of these areas (with the exception of the High-Potential Maize Zones), the average
purchases of net buying households ranged from 20 to 100 kgs per capita. But this is only the
mean level within this group. In each area, the lowest 25% of the sample had net purchases of
between 380 to 700 kg per household.
A major question for maize policy is whether most smallholder households are better off or worse off
with policies designed to raise maize prices. The interests of commercial maize-surplus farmers have
typically weighed prominently in the formation of cereal policy in Kenya, and have been reflected in
various attempts over decades to support maize prices, with the assumption that this would contribute to
rural income growth. In part, the longstanding perception of farmers as producing surplus maize has been
propagated by the absence of reliable micro-level household-level data on maize marketing and purchase
behavior. Whether this perception was always erroneous, or whether household food marketing patterns
have changed over the past several decades due to declining farm size, population pressure, and soil
degradation in some areas, the emerging picture from this survey is that a large proportion of rural farm
households buy maize and are actually hurt by higher maize prices.5 This picture, while needing
verification through additional household surveys, is consistent with empirical evidence in other African
countries (see, for example, Cousins, Weiner, and Amin 1992; Kirsten and von Bach 1992; Lele 1990;
5Mellor and others had made this point decades ago in Asia, but the perception of rural foodself-sufficiency in Africa has been modified more slowly, since lower population densities inmost of Africa were often equated with land abundance and relatively egalitarian distribution ofproductive resources.

43
Odhiambo and Wilcock 1990; Weber et al. 1988). In Zimbabwe, normally a food exporter during the
1980s, the proportion of rural farm households that are net grain buyers is 70% or more in the drier areas
where over 60% of the smallholder population lives. Of these households, about half purchase over 50%
of their annual grain requirements (Jayne and Chisvo 1991). In Malawi, over 65% of the rural population
were net buyers of maize in 1991, an unexceptional weather year (Kandoole and Msukwa 1992). These
findings indicate that the effects of the reforms on food security will depend on the ability of the emerging
private trade to reduce the costs of food to the grain-deficit and generally poorer regions.
5.3 Household Perceptions of Changes in the Performance of the Grain Marketing System
Effects of grain marketing reform on household welfare, from perception of rural households themselves
were analyzed in order to provide further understanding of households' responses to liberalization and
also important implications for cereal pricing and trade policy.
5.3.1 Relationship between Grain Prices and Households’ Perceived Welfare
The effects of grain marketing reform on household welfare, from the perceptions of rural households are
shown in Table 5.4. Roughly two-thirds of the respondents stated that they are better off with low maize
prices, even lower than those of 1996 are. The preference for lower maize prices was particularly evident
in the low-potential areas such as Western Lowlands, and Coastal Lowlands, but also in relatively high-
potential but grain-deficit areas such as Western Transitional and Marginal Rain Shadow. Only in the
High-Potential Maize Zone did the majority of households experience a preference for higher maize
prices than in 1996. These household perceptions lend further support to the findings in the previous
section showing that the majority of rural farm households in most areas are net buyers of maize.
5.3.2 Household Perceptions of the Performance of the Current Marketing SystemCompared to the Controlled Marketing System
Perceptions by households on ease of purchasing maize under the current liberalized marketing system
compared to the former control period are shown in Table 5.5. These results are important considering
that results in Table 5.3 showed that many households in the rural areas are net purchasers of maize.
Overall, almost 60% of the households surveyed felt that the availability of maize grain for purchase has
improved since the controlled marketing period against 31% who felt it had deteriorated. Ten percent of
the households perceived no change. The regions where the greatest proportion of households perceived
an improvement in the availability of maize grain were in the Eastern Lowlands, Coastal Lowlands,
Western Lowlands, and Western Highlands. As mentioned earlier, many of these households now have

44
the option of purchasing maize grain and milling it at local small-scale mills at considerably less cost than
purchasing sifted maize meal. Moreover as shown in Table 4.2, inflation-adjusted maize prices in local
markets have generally declined. This also undoubtedly contributes to the perception of better conditions
for net-grain buyers. Interestingly, the one region where a greater number of households said maize grain
was in greater supply during the control period was in the Marginal Rain Shadow, which has suffered two
consecutive droughts in recent years.
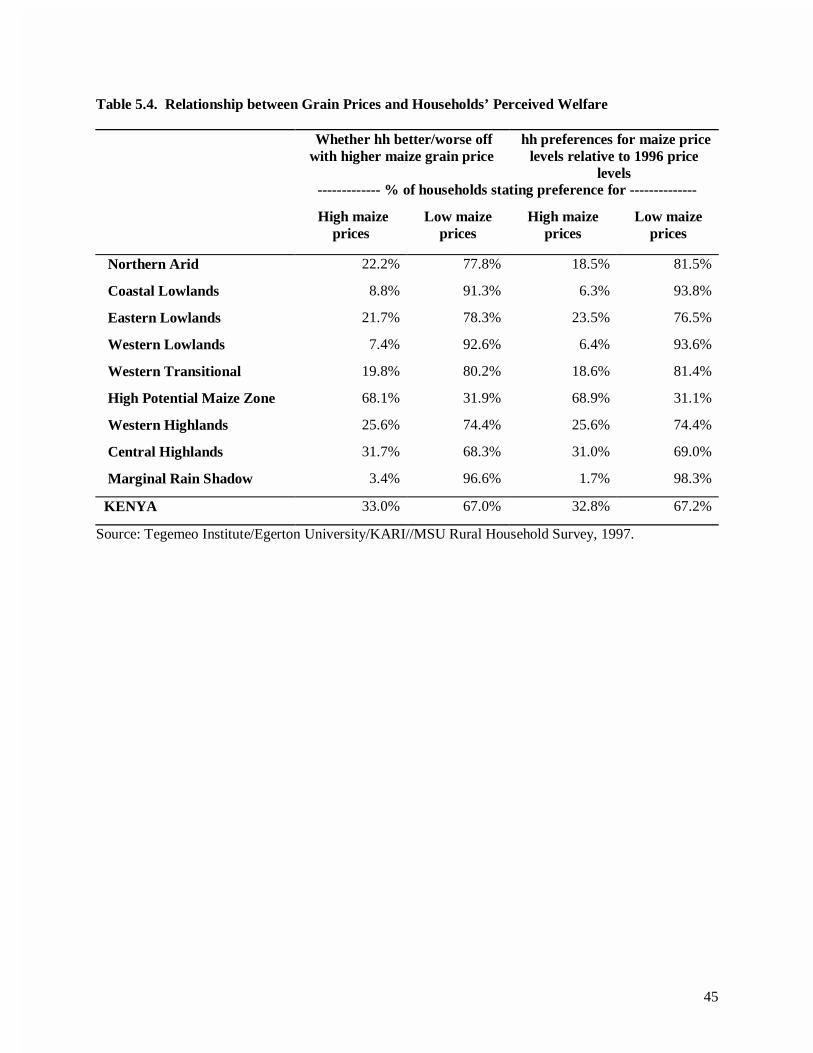
45
Table 5.4. Relationship between Grain Prices and Households’ Perceived Welfare
Whether hh better/worse offwith higher maize grain price
hh preferences for maize pricelevels relative to 1996 price
levels------------- % of households stating preference for --------------
High maizeprices
Low maizeprices
High maizeprices
Low maizeprices
Northern Arid 22.2% 77.8% 18.5% 81.5%
Coastal Lowlands 8.8% 91.3% 6.3% 93.8%
Eastern Lowlands 21.7% 78.3% 23.5% 76.5%
Western Lowlands 7.4% 92.6% 6.4% 93.6%
Western Transitional 19.8% 80.2% 18.6% 81.4%
High Potential Maize Zone 68.1% 31.9% 68.9% 31.1%
Western Highlands 25.6% 74.4% 25.6% 74.4%
Central Highlands 31.7% 68.3% 31.0% 69.0%
Marginal Rain Shadow 3.4% 96.6% 1.7% 98.3%
KENYA 33.0% 67.0% 32.8% 67.2%
Source: Tegemeo Institute/Egerton University/KARI//MSU Rural Household Survey, 1997.
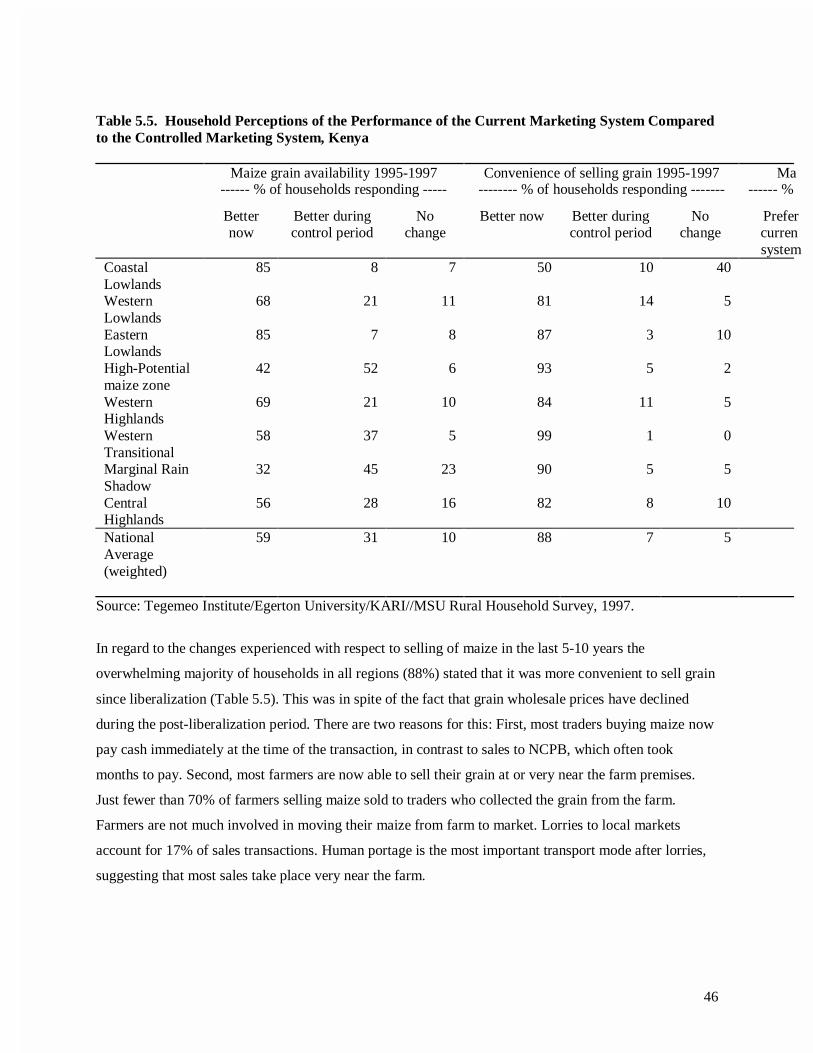
46
Table 5.5. Household Perceptions of the Performance of the Current Marketing System Comparedto the Controlled Marketing System, Kenya
Maize grain availability 1995-1997 Convenience of selling grain 1995-1997 Ma------ % of households responding ----- -------- % of households responding ------- ------ %
Betternow
Better duringcontrol period
Nochange
Better now Better duringcontrol period
Nochange
Prefercurrensystem
CoastalLowlands
85 8 7 50 10 40
WesternLowlands
68 21 11 81 14 5
EasternLowlands
85 7 8 87 3 10
High-Potentialmaize zone
42 52 6 93 5 2
WesternHighlands
69 21 10 84 11 5
WesternTransitional
58 37 5 99 1 0
Marginal RainShadow
32 45 23 90 5 5
CentralHighlands
56 28 16 82 8 10
NationalAverage(weighted)
59 31 10 88 7 5
Source: Tegemeo Institute/Egerton University/KARI//MSU Rural Household Survey, 1997.
In regard to the changes experienced with respect to selling of maize in the last 5-10 years the
overwhelming majority of households in all regions (88%) stated that it was more convenient to sell grain
since liberalization (Table 5.5). This was in spite of the fact that grain wholesale prices have declined
during the post-liberalization period. There are two reasons for this: First, most traders buying maize now
pay cash immediately at the time of the transaction, in contrast to sales to NCPB, which often took
months to pay. Second, most farmers are now able to sell their grain at or very near the farm premises.
Just fewer than 70% of farmers selling maize sold to traders who collected the grain from the farm.
Farmers are not much involved in moving their maize from farm to market. Lorries to local markets
account for 17% of sales transactions. Human portage is the most important transport mode after lorries,
suggesting that most sales take place very near the farm.
47
The respondents were also asked on their preference of grain marketing situation as it was 5 years ago, or
compared to the present. Responses to this question are shown in the final 3 columns of Table 5.5.
Overall, 61% of households stated a preference for the current system while 34% preferred the former
system. As with the previous questions, the preference for the current liberalized system was strongest in
the grain-deficit areas such as Central Highlands, Coastal Lowlands, Eastern Lowlands, and Marginal
Rain Shadow. Only in the Western Transitional zone (Kanduyi division of Bungoma District and the
Kabras and Mumias divisions of Kakamega District) did the majority of households prefer the controlled
marketing system.
5.4. Regional Distribution Of Grain Sales And Purchases
Operations of the national and regional maize in markets in the post liberalization period shows that the
rural sector in the aggregate sells 195%, almost double, of what it purchases (Table 5.6). This makes a
surplus available for urban dwellers. There is also tremendous diversity of maize trading patterns across
the zones where almost all households and zones are involved in both sales and purchases. But sales as a
proportion of purchases are lowest in the Coastal lowlands, the Marginal Rain Shadow zone that suffered
from two consecutive drought years, and the traditionally deficit Western Lowlands along the shores of
Lake Victoria. The transitional and highland zones, and surprisingly, the eastern lowlands all sell about
half of what they end up buying in the market later in the season mainly as grain but also as sifted maize
meal. The Eastern lowlands are the fourth most important source of marketed maize after the High
Potential Maize, Western transitional and Central Highland zones. High Potential Maize Zone alone
accounts for 90.5% of marketed maize.

48
Table 5.6. Regional Dis-aggregation Of National Maize Sales and Purchase Patterns
Zone Sales as% of
Purchases
% ofNational
Sales
Districts within High Potential Maize Zone
Northern Arid 16.25 0.19 District Purchases as % ofNational
Coastal Lowlands 1.31 0.08 % of Sales SalesEastern Lowlands 43.70 2.29 Bungoma 29.07 4.92Western Lowlands 5.43 0.37 Lugari
(Kakamega)1.67 16.60
Western Transitional 38.73 2.85 Bomet 280.25 0.47High Potential MaizeZone
985.71 90.47 Nakuru 20.20 11.56
Western Highlands 37.51 1.15 Narok 4.58 6.54
Central Highlands 35.49 2.51 Trans Nzoia 7.14 29.43Marginal Rain Shadow 1.83 0.09 Uasin Gishu 6.77 20.94
195.73 100.00 10.14 90.47Source: Kodhek, 1998.
Bomet households which is within the High potential maize zones end up buying almost 3 times as much
maize as they sell. All other zones engage in both purchases and sales that range from a low of less than
2% in Lugari where very small amounts of maize are bought from the market, to 20% and 29% in Nakuru
and Bungoma respectively. Overall households in the High Potential Maize Zone buy 10 % as much
maize as they sell. This zone dominates national maize sales. About 90.5% of sales come from this zone
with 4 districts, Trans-Nzoia, Uasin Gishu, Lugari and Nakuru accounting for almost 70% of the maize
sold in the sample.

49
6.0 CONCLUSION AND POLICY IMPLICATIONS
6.1 Conclusions
The structure of the post- liberalization maize market in Kenya reveals that there are numerous different
stages in the marketing of maize from farmer to consumer. However, these various stages are very
“fluid” i.e., traders at one stage frequently operate at different levels in the system. For example, retailers,
consumers, dis-assemblers and wholesalers are at some times and some locations also involved in maize
assembling activities at the farm level. The presence of these traders at multiple stages in the marketing
system increases competition at each stage. The evidence from this study indicates that a high level of
competition characterizes the maize marketing system in Kenya.
Maize trading businesses in Kenya are also horizontally integrated, i.e.; they are also engaged in other
businesses outside the grain subsector. For a majority of maize traders, the other business activities were
not enterprises such as retail shops, transport and farming that could be directly linked to maize business.
Horizontal integration thus is used as a strategy to cope with the seasonal nature of maize trade, the risks
associated with maize trade, and to increase access to working capital. Seasonal revenues earned from
other business activities are used to finance maize purchases later in the season. Horizontal integration
was also employed as a way of diversifying business activities due to the various risks involved in maize
trade.
Liberalization of maize marketing has led to a decline in inflation-adjusted maize prices throughout the
country. The price decline was especially pronounced in the maize deficit areas. Price spreads between
the surplus and deficit areas may also have narrowed after liberalization. This decline in maize prices has
benefited urban consumers and most farmers who are net buyers of maize. The reform process could also
have contributed to changes in cropping patterns. Grain production in most areas has decreased over time
while production of higher value crops has increased in line with principle of comparative advantage.
Maize marketing at most stages in the system have a low degree of market concentration, indicating that
there has been substantial entry into maize marketing by private traders since liberalization began in the
late 1980s.
Some levels, however, had slightly higher concentration ratios that others mainly due to some implicit
entry barriers such as poor state of roads and new restrictions on axle loading that limits the number of
wholesale traders in certain regions. While entry into maize trading thus remains reasonably free,
50
expansion of various maize marketing activities has been hindered. The barriers include, lack of market
information on sources and outlets of maize, prevailing market prices and the cost structure in every
marketing channel. Others are access to capital for entry and expansion in maize business, price
instability, a poor national and rural feeder road network that has led to high transport costs and
uncertainty over government policy.
Maize in Kenya is currently traded almost entirely in the spot market with little or no evidence of the
existence of other institutional marketing arrangements like forward contracts or commodity exchanges.
Indeed, a commodity exchange exists in Kenya, but no maize has been traded on it so far and most
respondents were not aware of its existence. In other parts of the world where commodity exchanges
have been successfully developed, the benefits to small farmers have not occurred primarily through their
direct participation. Rather, small farmers selling relatively small quantities have benefited from the
engagement of traders and cooperatives on the exchange. By locking in positions on the exchange,
traders are able to pass along more secure price arrangements to farmers (e.g., forward contracting). By
bulking up production from small farmers, traders and farmer cooperatives have been able to overcome
the entry barriers of participation on commodity exchanges that are prohibitively expensive for individual
farmers. But effective use of the exchanges will require traders, farmer organizations, and cooperatives
serving smallholder farmers to become more conversant with the operations of these exchanges. This will
open up a number of market-oriented mechanisms for reducing the risks of price and supply instability.
6.2 Policy Implications
The private sector has responded to maize marketing liberalization by investing in various channels in the
marketing channel. But the response has been constrained due to lack of enabling environment thus
limiting their investment to areas with low capital requirement and minimal risks. The high and unstable
interest rates, high transport costs caused by poor infrastructure, lack of market information caused by
undeveloped communication systems and uncertain government policy environment. The role of the state
thus remains critical in stimulating further private sector investment in maize market. The following are
important steps that governments could take to enhance the competitiveness of maize marketing and thus
promote more entry into the trade, reduce transaction costs and thus raise productivity and stability of the
food systems in the country:

51
1. Invest in the road network to reduce transportation costs between the surplus and deficit areas and
enhance farm gate maize prices. Better and accessible roads could also reduce farm gate input
prices and thus stimulating crop productivity. Further infrastructure development between countries
would facilitate incentives for regional trade, thereby reducing the need for large national maize
stockpiles that impose additional costs on the marketing system
2. Improve access to public market information systems to accelerate both the private and public
response to supply gluts and shortages. The timely dissemination of market information can also
help policy makers to monitor the evolving effects of market liberalization, identify problems that
require mid-course correction, and to respond to impending supply fluctuations in a more timely
way. It is therefore imperative that telecommunication systems are improved by enabling the
private sector to play a larger role in the print and electronic media by way of investment.
3. Modify the NCPB’s pricing and trading policies by having the Board announce why, and at what
price, they intend to intervene in the market to create certainty and reduce risks and exposure to the
private sector. Import bans and huge import tariffs should be eliminated as they adversely affect
consumers while protecting only a few large-scale producers. These import policies impede the
potential to stabilize food supplies and prices through intra-regional trade. Moreover, the
uncertainty in the level of the import tariff (which has been changed and sometimes waived for
certain periods of time in recent years with little prior warning) also introduces major price risks
into the trading operations of all actors in the system.
4. Put policies in place that could nurture the political and legal foundations of marketing systems
such as those which strengthen mechanisms of specifying and enforcing contracts, raising the costs
of contract non-compliance, and more pluralistic procedures for developing the rules governing
market activity. A well-functioning legal and political framework for market activity reduces the
risks and transactions costs of private trade. These measures are important adjuncts to developing
reliable markets, and inherently involve strengthening the regulatory abilities of the state rather
than "getting the state out of market regulation". In general, this means a reorientation of the state
from "control" activities to "facilitation" activities designed to reduce transacting costs of inputs,
credit, and commodities faced by farmers and traders.
5. Devise policies that could support the development of alternative marketing channels such as
commodity exchanges and forward contracts, which could stabilize maize prices. Education of
farmers and support of the private sector initiative on alternative marketing channels would
enhance their acceptability by farmers and traders.
6. Increase support for the formation of local farmer organizations to sell and buy commodities on
behalf of their members. The groups could also be used to lend hence reducing traders' transaction

52
costs of credit and input disbursement, increase loan repayment rates, and relieve other aspects of
market failure that have impeded the functioning of rural farm finance systems (Otero and Rhyne
1994; Chimedza 1994). Moreover, there are different economies of scale at various stages of the
food system. The development of strong farmer groups may also enhance vertical integration in the
maize marketing channel.

53
References:
Argwings-Kodhek, G., “Monitoring for Improved Agricultural Policy Making,” paper presented at the
Conference on Strategies for Raising Productivity in Agriculture, May 12, 1998, Kenya College of
Insurance, Nairobi, Tegemeo Institute/Egerton University, 1998.
Argwings-Kodhek, G., M. Mukumbu, and E. Monke, "The Impacts of Maize Market Liberalization in
Kenya," Food Research Institute Studies, Vol. 12, No. 3 (1993), pp. 331-348.
Argwings-Kodhek, Gem and T.S. Jayne, "Relief Through Development: Consumer Response to Maize
Market Liberalization in Urban Kenya," Tegemeo Working Paper 2 (Njoro: Egerton Univ., 1996).
Barrett, Christopher and Michael Carter, "Microeconomically Coherent Agricultural Policy Reform in
Africa," paper prepared for World Bank Research Program on Reforms in Socialist Economies in
Africa (Madison: University of Wisconsin, 1994).
Chimedza, Ruvimbo, "Rural Financial Markets," in M. Rukuni and C. Eicher (Eds.), Zimbabwe's
Agricultural Revolution (Harare: University of Zimbabwe Press, 1994), pp. 139-152.
Cousins, Ben, Dan Weiner, and Nick Amin, "Social Differentiation in the Communal Lands of
Zimbabwe," Review of African Political Economy Vol 53 (1992), pp. 5-24.
Jayne, T.S. “ Do High Food Marketing Costs Contraint Cash Production?Evidence From Zimbambwe”.
Economic Development and Cultural Change, Vol 42, pp 387-402
Jayne, T.S., and M. Chisvo, "Unravelling Zimbabwe's Food Insecurity Paradox," Food Policy, Vol. 16,
No. 5 (1991), pp. 319-329.
Jayne, T.S., and Gem Argwings-Kodhek., Consumer Response to Maize Market Liberalization in Urban
Kenya. ," Food Policy, Vol. 22, No. 5 (1997), pp.447-457.
Jayne, T.S., and Mandivamba Rukuni, "Distributional Effects of Maize Self-Sufficiency in Zimbabwe:
Implications for Pricing and Trade Policy," Food Policy, Vol. 18, No. 4 (1993), pp. 334-41.
Jayne, T.S., and L. Rubey, "Maize Milling, Market Reform and Urban Food Security: The Case of
Zimbabwe," World Development, Vol. 21 No. 6 (1993), pp. 975-988.
Jayne, T.S., Y. Khatri, C. Thirtle, T. Reardon, "Determinants of Productivity Change Using a Profit
Function Approach: The Case of Zimbabwe," American Journal of Agricultural Economics, Vol.
76, No. 3 (1994), pp. 613-616.
54
Jayne, T., L. Rubey, D. Tschirley, M. Mukumbu, M. Chisvo, A. Santos, M. Weber, and P. Diskin,
"Effects of Food Market Reform on Household Access to Food in Four Countries in Eastern and
Southern Africa," International Development Paper 19 (E. Lansing: Michigan State Univ., 1995).
Kandoole, B.F., and L. Msukwa, "Household Food and Income Security Under Market Liberalization:
Experience from Malawi," in J. Wyckoff and M. Rukuni (Eds.), Food Security Research in
Southern Africa: Policy Implications (Harare: University of Zimbabwe, 1992).
Karanja Daniel D, Jayne T.S, and Paul Strasberg, Maize Productivity and Impact of Market Liberalization
in Kenya. Proceedings on the Conference on Strategies For Raising Smallholder Agricultural
Productivity and Welfare Egerton University/Tegemeo Institute, November 1998.
Kirsten, J.F., and H.J. Sartorius von Bach, "Surplus Producers and the Food Price Dilemma in Traditional
Agriculture in Southern Africa, Agrekon, Vol. 31, No. 4 (1992), pp. 235-240.
Koch 1980, Industrial Organization and Prices, Prentice-Hall International
Lele, Uma, "Structural Adjustment, Agricultural Development and the Poor: Lessons from the Malawian
Experience," World Development, Vol. 18, No. 9 (1990), pp. 1207-1219.
Mosley, P., "Maize Control in Kenya 1920-1970," (Bath: Center for Development Studies, Univ. Bath,
1975).
Mukumbu, Mulinge, "Effects of Market Liberalization on the Maize Milling Industry in Kenya," in Maize
Supply and Marketing Under Liberalization (Nairobi: Egerton Univ./Policy Analysis Matrix,
1992).
Mukumbu, M. (1994) Consumer and Milling Industry Responses to Maize Market Reform in Kenya.
Proceedings on the Conference on Market Reforms, Agricultural Production and Food Security.
Egerton University/Policy Analysis Marix, June 1994, Nairobi.
Mukumbu M. and Jayne T.S, (1994) Urban Maize Meal Consumption Patterns: Strategies for Improving
Food Access to Vulnerable Groups in Kenya. Working Paper No 1. Tegemeo Institute of
Agricultural Policy and Development, Egerton Unversity, Nairobi.
North, Douglass C. 1985. “Institutions, Transaction Costs and Economic Growth.” In Economic
Inquiry, pp. 419-429.

55
North, Douglas C. 1994. Institutions and Credible Commitments. Journal of Institutional and
Theoretical Economics, Volume 84, No. 3:11-22.
Odhiambo, Mark, and David Wilcock, "Reform of Maize Marketing in Kenya." In M. Rukuni, G.Mudimu, and T. Jayne (eds.), Food Security Policies in the SADCC Region (Harare: Univ.Zimbabwe, 1990).
Otero, M. and E. Rhyne (eds), The New World of Micro-Enterprise Finance: Building Healthy Financial
Institutions for the Poor (West Hartford: Kumarian Press, 1994).
Pinckney, Thomas C., "Is Market Liberalization Compatible with Food Security? Food Policy, Vol. 18,
No. 4 (1993), pp. 325-333.
Scarborough, V. And Kydd, J. 1992. Economic Analysis of Agricultural Markets: A Manual. Chatham,
U.K. Natural Resources Institute.
Scott, Guy, "Agricultural Transformation in Zambia: Past Experience and Future Prospects," paper
presented at Agricultural Transformation Workshop, Abidjan (East Lansing: Michigan State Univ.,
1995).
Shaffer, James D., Michael Weber, Harold Riley, and John Staatz, "Influencing the Design of Marketing
Systems to Promote Development in Third World Countries." in Ag. Markets in the Semi-Arid Tropics:
Proceedings of the Intl. Workshop