Embed Size (px)
Citation preview

En
do
crin
e-R
ela
ted
Can
cer
ResearchM E Sabatino et al. Cellular senescence in
pituitary tumors22 :3 299–317
Evidence of cellular senescenceduring the development ofestrogen-induced pituitary tumors
Maria Eugenia Sabatino, Juan Pablo Petiti, Liliana del Valle Sosa, Pablo Anibal Perez,
Silvina Gutierrez, Carolina Leimgruber, Alexandra Latini1, Alicia Ines Torres and
Ana Lucıa De Paul
Facultad de Ciencias Medicas, Instituto de Investigaciones en Ciencias de la Salud (INICSA–CONICET),
Centro de Microscopıa Electronica, Universidad Nacional de Cordoba, Av. Enrique Barros y Enfermera Gordillo,
Ciudad Universitaria, 5000 Cordoba, Argentina1Laboratorio de Bioenergetica y Estres Oxidativo, Departamento de Bioquımica, Centro de Ciencias Biologicas,
Universidad Federal de Santa Catarina, Florianopolis, Brazil
http://erc.endocrinology-journals.org q 2015 Society for EndocrinologyDOI: 10.1530/ERC-14-0333 Printed in Great Britain
Published by Bioscientifica Ltd.
Downloa
Correspondence
should be addressed
to A L De Paul
Abstract
Although pituitary adenomas represent 25% of intracranial tumors, they are usually benign,
with the mechanisms by which these tumors usually avoid an invasive profile and metastatic
growth development still remaining unclear. In this context, cellular senescence might
constitute a plausible explanation for the benign nature of pituitary adenomas. In this study,
we investigated the emergence of cellular senescence as a growth control mechanism during
the progression of estrogen-induced pituitary tumors. The quantification of Ki67-
immunopositive cells in the pituitaries of estrogenized male rats after 10, 20, 40, and 60 days
revealed that the mitogenic potential rate was not sustained for the whole period analyzed
and successively decreased after 10 days of estrogen exposure. In addition, the expression of
cellular senescence features, such as the progressive rise in the enzymatic senescence-
associated b-galactosidase (SA-b-gal) activity, IL6, IL1b, and TGFb expression, was observed
throughout pituitary tumor development. Furthermore, tumoral pituitary cells also
displayed nuclear pATM expression, indicating activated DNA damage signaling, with a
significant increase in p21 expression also being detected. The associations among DNA
damage signaling activation, SA-b-gal expression, and p21 may provide a reliable
combination of senescence-associated markers for in vivo pituitary senescence detection.
These results suggest a role for this cellular process in the regulation of pituitary cell growth.
Thus, cellular senescence should be conceived as a contributing component to the benign
nature of pituitary adenomas, thereby influencing the capability of the pituitary gland to
avoid unregulated cell proliferation.
Key Words
" pituitary
" estrogen
" immunohistochemistry
" tumor
" cellular senescence
ded
Endocrine-Related Cancer
(2015) 22, 299–317
Introduction
The pituitary gland is a principal controller of endocrine
homeostasis. Through the release of specific hormones
synthesized by five highly differentiated cells, this gland
responds to central and peripheral signals. In spite of
presenting low mitogenic and apoptotic rates, the gland
exhibits dynamic and plastic fluctuations in reaction to
from Bioscientifica.com at 04/06/2022 11:13:47AMvia free access
En
do
crin
e-R
ela
ted
Can
cer
Research M E Sabatino et al. Cellular senescence inpituitary tumors
22 :3 300
exogenous and endogenous stimuli in order to constantly
adapt the hormonal and metabolic responses to changing
environments (Levy 2002). Nevertheless, several altera-
tions in cell growth can lead to pituitary hyperplasia and
high levels of hormone production, frequently related to
adenoma formation (Asa & Ezzat 2009).
Pituitary adenomas represent 25% of intracranial
tumors, with their prevalence rising with age, and both
sexes being similarly affected (Asa & Ezzat 2009). However,
despite their relatively common incidence, pituitary
tumors are usually benign (Maiza & Caron 2009). The
mechanisms by which these tumors may rarely acquire
invasive profile and metastastic growth are unclear, even
when oncogenic pathways are triggered or tumor sup-
pressor pathways are inactivated. These particularities of
pituitary adenomas have led to the hypothesis that there
may be an additional process that acts as a protective
anti-proliferative mechanism.
Cellular senescence can be interpreted as a spontaneous
initial barrier in tumorigenesis, because senescent cells are
abundant within pre-malignant lesions, whereas they
rarely appear in malignant tumors (Collado et al. 2005).
In this way, senescence renders an impediment against
oncogenic stimulation and prevents cellular transfor-
mation (Collado & Serrano 2010). In vitro studies have
revealed that certain oncogenic signaling, depending on
the context, can paradoxically provoke growth arrest along
with a cellular senescent phenotype (Michaloglou et al.
2005). Moreover, emergent evidence has described in vivo
premature cellular senescence in the early stages of tumor
growth, suggesting that this process could act as a potent
anti-tumor protective mechanism that must be overcome
for tumor progression (Braig et al. 2005, Collado et al. 2005).
Senescence is considered to be a stress response
characterized by permanent cell cycle arrest, which can
be triggered by different factors including DNA damage,
oxidative stress, telomere dysfunction, aberrant prolifera-
tive signals of oncogenes, and the inactivation of tumor
suppressor genes (Campisi & d’Adda di Fagagna 2007).
Consistent with cellular arrest, the senescence phenotype
is accompanied by the upregulation of different cell-cycle
regulators such as the CDK inhibitors p16INK4A, p15INK4B,
p21CIP1, among others (Roninson 2002, Holst et al. 2003).
Because several senescence-inducing stimuli provoke
epigenomic disruption or genomic damage, many senes-
cent cells harbor a persistent DNA damage response (DDR)
signaling, such as the activation of the kinase ataxia
telangiectasia mutated (ATM) (Di Micco et al. 2006), and
the involvement of p53 activation (Rodier et al. 2007). In
addition, senescent cells show higher levels of detectable
http://erc.endocrinology-journals.org q 2015 Society for EndocrinologyDOI: 10.1530/ERC-14-0333 Printed in Great Britain
senescence-associated b-galactosidase (SA-b-gal; Dimri
et al. 1995, Lee et al. 2006), which can also include
compromised mitochondrial dynamics and metabolism
(Moiseeva et al. 2009), with unbalanced mitochondrial
fusion and fission processes (Lee et al. 2007). In fact,
senescent cells undergo extensive gene expression
changes that emulate the inflammatory response, thereby
developing a complex senescence-associated secretory
phenotype (SASP), in vitro and in vivo, associated with
the activation of nuclear factor kappa B (NFkB) or C/EBPB
(Coppe et al. 2008). SASP proteins include a wide range
of growth factors, proteases, chemokines, and cytokines
including interleukin 6 (IL6), IL1, transforming growth
factor beta (TGFb), IL8, among others, which participate
in senescence intercellular signaling, and interact at, or in
the immediate vicinity, of the plasma membrane (Coppe
et al. 2008, Kuilman et al. 2008, Young & Narita 2009).
Cellular senescence may constitute a plausible expla-
nation for the benign nature of pituitary adenomas
through the existence of an intrinsic predisposition of
pituitary cells to limit uncontrolled proliferation through
this cellular program. Some recent studies on pituitary
tumorigenesis in transgenic mice (Chesnokova et al.
2007, 2008) and SA-b-gal in human pituitary tumor
(Chesnokova et al. 2011, Alexandraki et al. 2012) have
suggested that cellular senescence could be a significant
mediator of growth cessation in these tumors. However, it
still remains uncertain whether this cellular response takes
place in the absence of direct genetic manipulation or
during the development of pituitary proliferative injuries,
indicating a possible physiological role for cellular
senescence in the modulation of pituitary cell growth.
Appropriate in vivo models are required to achieve a
better understanding of senescence during the develop-
ment of tumors. In this study, we used a previously
developed pituitary tumor experimental model, which
consists of long-term estrogen administration in rats, and
leads to the formation of prolactin (PRL) secretory tumors
presenting hyperplasia/hypertrophy, greater vascularity,
and the disruption of the reticulin network (Mukdsi et al.
2006, Palmeri et al. 2009). Considering that it has been
postulated that estrogen-induced proliferative lesions
could increase the ability of cells to generate prime
tumorigenic changes (Melmed 2003), our experimental
conditions may represent an accurate in vivo model for
studying the outcome of pituitary senescence. In this
context, the aim of this study was to investigate the
emergence of cellular senescence as a growth control
mechanism during the progression of estrogen-induced
pituitary tumors.
Published by Bioscientifica Ltd.
Downloaded from Bioscientifica.com at 04/06/2022 11:13:47AMvia free access

En
do
crin
e-R
ela
ted
Can
cer
Research M E Sabatino et al. Cellular senescence inpituitary tumors
22 :3 301
Materials and methods
Animals and experimental models
Three-month-old Wistar strain male rats were maintained
at controlled temperature (21G3 8C) and lighting con-
ditions (14 h light:10 h darkness cycle), with free access to
commercial laboratory chow and tap water. Taking into
account that exogenous estrogen excess induces pituitary
tumors (Asa & Ezzat 2002, Mukdsi et al. 2004), intact
animals were treated with estradiol benzoate (Sigma–
Aldrich) for 10, 20, 40, and 60 days (E10, E20, E40, and
E60). Estrogen was implanted subcutaneously in slow-
releasing silastic brand capsules (Dow Corning, Medical
grade, Midland, MI, USA) filled with 10 mg of estrogen
crystals and sealed with silastic cement. The control group
was implanted with empty capsules. The rats were
decapitated within 10 s after being removed from their
cage, thus avoiding any stress or external stimuli. Fresh
pituitary glands were photographed in situ and weighed
immediately after collection. The animals were kept in
accordance with the Guide for the Care and Use of
Laboratory Animals, published by the United States
National Institutes of Health (1996), and the experiments
were approved by the Institutional Animal Care Committee
of the School of Medicine, National University of Cordoba.
Circulating estrogen levels
Serum estrogen levels were measured by an electrochemi-
luminescence immunoassay from Roche Diagnostics
GmBH, using the commercial Elecsys System 2010 (Elecsys
Corporation, Lenexa, KS, USA). For statistical purposes,
the serum analyzed was obtained from six rats for each
experimental group.
Pituitary cell dissociation
The protocol for pituitary cell dissociation has been
previously described (DePaul et al. 1997). Briefly, rat pituitary
glands were placed in the minimal essential medium, and
then minced and digested with 0.4% w/v trypsin at constant
slow agitation at 37 8C. The cell suspension was gently
dispersed using flame-rounded Pasteur pipettes. Cell viabi-
lity, tested with Trypan blue exclusion, was always better
than 90%. Cell dispersions were transferred to 1.5 ml
Eppendorf tubes and centrifuged for 5 min at 400 g.
Cell culture
The rat somatolactotroph pituitary adenoma GH3B6 cell
line was cultured in HAM–F12 medium (Sigma–Aldrich)
http://erc.endocrinology-journals.org q 2015 Society for EndocrinologyDOI: 10.1530/ERC-14-0333 Printed in Great Britain
supplemented with 5% v/v FCS and 12% v/v horse serum
(Invitrogen), as previously described (Petiti et al. 2010).
After 3 days of culture and 70% of confluence in order to
recreate estrogenic doses administration at E40–E60, cells
were exposed to 17b-estradiol (E2; 4 nM; Sigma–Aldrich) or
vehicle for 120 h and then submitted to the cytochemical
detection of SA-b-gal staining.
Cell cycle analysis
Dispersed pituitary cells from control and estrogenized
animals were fixed in 70% v/v ice-cold ethanol by
gentle vortexing. After centrifugation (400 g for 5 min),
pellets were washed with citrate–phosphate buffer of pH
7.8. Finally, the cells were incubated with RNAse (ribonu-
clease A 0.7 mM; Sigma–Aldrich) at 37 8C for 30 min, and
stained with propidium iodide (75 mM; Sigma–Aldrich) for
1 h. The fluorescence intensity was analyzed by flow
cytometry using a BD FACS Canto II, and cell cycle
analysis of the DNA content was performed using ModFit
LT Program (Verity Software, Verity Software House,
Topsham, ME, USA). For statistical purposes, cellular
dispersions from nine animals of each experimental
group were analyzed.
Cytochemical detection of SA-b-gal staining
SA-b-gal-positive cells were detected by using a b-gal
staining kit (Senescence Cell Staining Kit, Sigma–Aldrich),
one of the most extended staining methods for cellular
senescence mentioned in the bibliography (Dimri et al.
1995, Lee et al. 2006). Briefly, pituitary cryosections (8 mm
thickness) were fixed in a mixture containing 2% v/v
formaldehyde and 0.2% v/v glutaraldehyde in PBS for
7 min. After washing, the staining solution was added
according to the manufacturer’s instructions and cryosec-
tions were incubated at 37 8C in a warm room for 20 h.
Pituitary sections were mounted and examined under
light microscope and photographed at 100!, with only
senescent cells staining in blue at a pH of 6.0. In order to
determine the senescent cell index, dispersed pituitary
cells from control and estrogenized animals, as well as
control and estrogen-stimulated tumoral GH3B6 cells,
were subjected to the same SA-b-gal staining procedure
and counted in a Neubauer chamber. Rat kidney was used
as positive control and the same reaction, but omitting the
substrate, served as negative controls. For statistical
purposes, randomly chosen visual fields photographed at
400! and 2000 cells were counted for each cell dispersion
for all experimental groups in triplicate.
Published by Bioscientifica Ltd.
Downloaded from Bioscientifica.com at 04/06/2022 11:13:47AMvia free access
En
do
crin
e-R
ela
ted
Can
cer
Research M E Sabatino et al. Cellular senescence inpituitary tumors
22 :3 302
Also, with the purpose of determining the double
localization of SA-b-gal/Ki67 and SA-b-gal/PRL into the
pituitary parenchyma, after performing the cytochemical
detection of SA-b-gal staining, the same pituitary cryo-
sections were processed by immunocytochemistry with
monoclonal anti-Ki67 antibody (1:50; BD Pharmingen,
Oxford, UK) or rabbit polyclonal anti-PRL (1:4000; NIH
Hormone Program, Bethesda, MD, USA, USA), as referred
to in the next section.
Immunocytochemistry
Paraffin-embedded pituitary glands were processed by
immunocytochemistry for phosphorylated ATM (pATM),
p53, and Ki67. The sections (3 mm thickness) were treated
with 3% v/v hydrogen peroxide in methanol for 30 min to
inhibit endogenous peroxidase, followed by an antigen
retrieval method using a hot antigen unmasking solution
(0.01 Mcitratebuffer;pH6.0).Then, sectionswere incubated
for 30 min in 10% v/v normal serum (Sigma–Aldrich) to
block nonspecific binding, which was followed by overnight
incubation with anti-Ki67 (1:50), rabbit polyclonal anti-p53
(1:200; Santa Cruz), or mouse monoclonal anti-pATM
(1:750; Abcam, Cambridge, UK) at 4 8C in a humidifier
chamber. The sections were then incubated with biotiny-
lated secondary antibodies and ABC complex, with staining
carried out using 3,30-diaminobenzidine tetrahydrochloride
as a cromogen, according to the manufacturer’s instructions
(Sigma–Aldrich). Diaminobenzidine (Sigma–Aldrich) was
utilized as the chromogenic substrate for 10 min at room
temperature, and the sections were rinsed in running water,
with hematoxylin being used as the counterstain (Sigma–
Aldrich). Controls were performed by applying the same
protocol, but omitting primary antibodies. The slides from
three animals of each experimental condition were photo-
graphed in randomly chosen fields at 400!, with more than
2000-immunoreactive cells being examined. The Ki67, p53,
and pATM labeling indexes were determined using NIH
Image J Software (National Institutes of Health, Bethesda,
MD, USA), and the number of positively stained nuclei was
recorded along with the total nuclei.
Also, to assess colocalization of PRL/p21, PRL/Ki67,
PRL/p53, and PRL/pATM, additional sets of slides from
different experimental conditions were processed for con-
focal laser scanning microscopy. Paraffin-embedded pituitary
sections were processed as mentioned before, but including
incubation for 1 h in 70% v/v ethanol supplemented with
0.25% v/v NH3, while rehydrating the deparaffinized sections
in graded alcohol in order to reduce autofluorescence
(Baschong et al. 2001). Then, pituitary sections were
http://erc.endocrinology-journals.org q 2015 Society for EndocrinologyDOI: 10.1530/ERC-14-0333 Printed in Great Britain
incubated with anti-PRL (1:4000), anti-Ki67 (1:50), anti-
pATM (1:750), anti-p21 (1:50; Santa Cruz), or p53 (1:300) for
1 h. These slices were washed, and further incubated with
Alexa 647 anti-rabbit or Alexa 594 anti-mouse secondary
antibodies (1:1000; Invitrogen) for 1 h. The images were then
obtained using an inverted FluoView FV 1000 confocal laser
scanning microscope (Olympus) and were collected with a
60! objective. The analysis of confocal microscopy images
was carried out using FV10-ASW 1.6 Viewer Software
(Olympus Inc., Olympus, Hamburg, Germany).
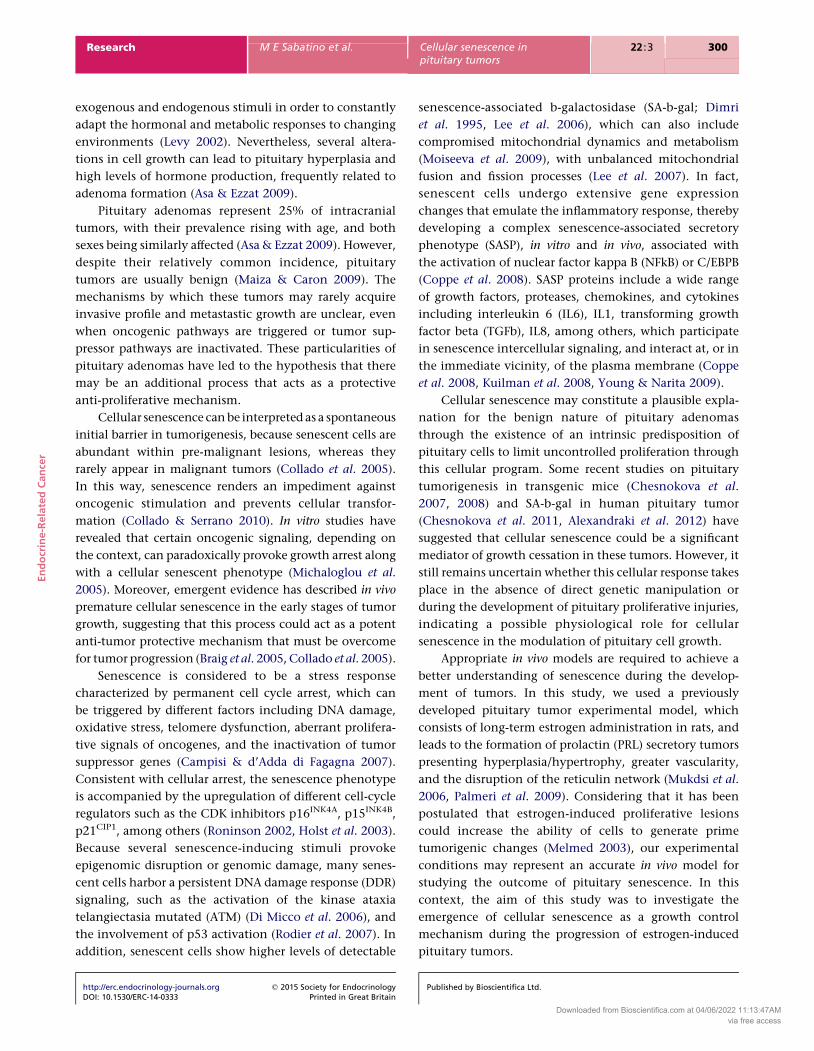
Ultrastructural immunogold labeling
The subcellular localization of p21 and pATM in pituitaries
was determined by a immuno-electron-microscopy post-
embedding protocol as previously reported (Sabatino et al.
2013). In brief, pituitary glands were embedded in
LR-White (London Resin Corporation, Berkshire, UK),
and thin sections were incubated overnight on a drop of
anti-p21 or anti-pATM antiserum, which was diluted 1:100.
Immunoreactive sites were labeled with anti-mouse
secondary antibody conjugated to 15 nm colloidal gold
particles (1:30; Electron Microscopy Sciences, Hatfield, PA,
USA). Then, to validate the specificity of the immuno-
staining, negative controls were performed, and the
primary antibodies were replaced with either 1% w/v BSA
in PBS or diluted preimmune serum followed by the
corresponding secondary antibody. Finally, sections were
stained with an aqueous uranyl acetate saturate solution,
and examined under a Zeiss LEO 906-E electron microscope
and photographed using a Megaview III camera.
Also, the effect of estrogen as an inducer of pituitary
tumor development was documented in semithin sections
from epoxy resin-embedded glands by high-resolution
light microscopy. With this aim, pituitaries from control
and E60 were fixed in a mixture of 4% v/v formaldehyde
and 2% v/v glutaraldehyde in 0.1 M cacodylate buffer for
2 h and then treated with 1% OsO4 before being block-
stained with 1% v/v uranyl acetate, as previously described
(De Paul et al. 2009). After dehydration with a series of
graded cold acetones, glands were embedded in Araldite.
The semithin sections (200 nm) were cut using a JEOL
ultramicrotome with a diamond knife, stained with
Toluidine blue, and examined using a Zeiss Axiostar Plus
light microscope (Oberkochen, Germany).
Subcellular fractionation
The nuclear and cytoplasmic extracts from control and
estrogen-treated rat pituitary glands were prepared
Published by Bioscientifica Ltd.
Downloaded from Bioscientifica.com at 04/06/2022 11:13:47AMvia free access

En
do
crin
e-R
ela
ted
Can
cer
Research M E Sabatino et al. Cellular senescence inpituitary tumors
22 :3 303
according to the method of Sugawara et al. (1993) with
modifications (Mukdsi et al. 2004). Briefly, three pituitaries
per experimental group (from a total of three independent
experiments) were minced and homogenized (4 8C) with a
teflon glass Potter Elvehjem tissue grinder in 2 ml 0.3 M
sucrose, 1 mM EDTA, 1 mM phenylmethylsulphonyl
fluoride, and 10 mM HEPES/KOH (pH 7.5). The homo-
genate was centrifuged at 1000 g for 10 min, and the
supernatant was aliquoted and stored at K20 8C until
required for cytoplasmic protein quantifications. The
pellet containing the nuclear fraction was resuspended
in 2 ml solution of 0.3 M sucrose, 1 mM CaCl2, 10 mM
Tris–HCl (pH 7.5), 1 mM dithiothreitol (DTT), and
protease inhibitors. Then, 75 ml of 10% v/v Igepal CA-
630 were added, and the solution was incubated at 4 8C for
10 min and centrifuged at 250 g for 5 min. After washing
the pellet once with the same buffer, it was resuspended
in two volumes of 20 mM HEPES (pH 7.8), 0.6 M KCl,
0.02 mM ZnCl2, 0.2 mM EGTA, 0.5 mM DTT, and protease
inhibitors, and incubated at 4 8C for 30 min. The
suspension was centrifuged at 20 000 g at 4 8C for
30 min, and the aliquots were stored frozen until they
were used in western blotting assays.
Western blotting analysis
The total protein concentration was measured using a Bio-
Rad Kit (Bio-Rad Protein Assay, Bio-Rad) and subcellular
fractions were run in 12% v/v acrylamide gel. To estimate
the corresponding molecular weights, the Full Range
Rainbow molecular weight marker was used (Amersham).
The membranes were incubated overnight at 4 8C with
the corresponding primary antibody: rabbit polyclonal
anti-mitofusin 1 (MFN1) (1:750), rabbit polyclonal anti-
dynamin-related protein 1 (DRP1) (1:500), rabbit poly-
clonal anti-rat sarcoma (RAS) (1:200), rabbit polyclonal
anti TGFb1 (1:300), mouse monoclonal anti-IL6 (1:200),
mouse monoclonal anti-p21 (1:200), rabbit polyclonal
anti-p53 (1:200), rabbit anti-total ERK1/2 (1:300) (Santa
Cruz), rabbit polyclonal anti-NFkB (1:1000), rabbit poly-
clonal anti-IL1b (1:300) (Abcam), rabbit polyclonal anti-
cytochrome c oxidase subunit 4 (COX4) (1:100), rabbit
polyclonal anti-pERK1/2 (1:700) (Cell Signaling Tech-
nology, Inc., Boston, MA, USA), mouse monoclonal anti-
b-actin (1:1000), or rabbit polyclonal anti-HDAC1 (1: 500;
Sigma–Aldrich). After washing, blots were incubated with
a peroxidase-conjugated (HRP) goat anti-rabbit (1:2500) or
goat anti-mouse (1:2500) diluted in blocking buffer, rinsed
in PBS/0.1% v/v Tween 20, and revealed with an ECL
detection system (Amersham Biosciences). Emitted light
http://erc.endocrinology-journals.org q 2015 Society for EndocrinologyDOI: 10.1530/ERC-14-0333 Printed in Great Britain
was captured on Hyperfilm (Amersham Pharmacia
Biotech), and the b-actin, COX4, and HDAC1 antibodies
were used as loading controls.
Detection of apoptosis by DNA nick-end labeling
Nick-end labeling was detected using the TUNEL tech-
nique, as previously reported (Palmeri et al. 2009).
Pituitary sections fixed on glass slides were processed as
stated in the manufacturer’s protocol (In Situ Cell Death
Detection Kit; Roche). As positive control, the reaction was
carried out on DNAse recombinant I (6500 U/ml, Invitro-
gen)-treated sections to induce DNA strand breaks before
the labeling procedure. The slides were observed using
a Zeiss Axiostar plus microscope at 400!.
Statistical analysis
The statistical analysis was carried out using an ANOVA
with Fisher’s post-test (InfoStat version 2004; Grupo
InfoStat, Facultad de Ciencias Agropecuarias, Universidad
Nacional de Cordoba, Cordoba, Argentina). In order to
analyze the binomial proportion data resulting from
counting the data of the cytochemichal reactions, a
generalized linear mixed modeling procedure of InfoStat
Software was utilized with a model that included the fixed
effect of treatment (with the logit link function being the
default for binomial proportion data). The results were
given as the meansGS.E.M., and the data were obtained
from three replicates measured for three independent
experiments. The significance levels were chosen at
P!0.05.
Results
Estrogen treatment induced pituitary tumor development
For the purpose of evaluating the cellular senescence
during the progression of the experimental pituitary
tumors, proliferative lesions were induced in Wistar male
rats as previously reported (Mukdsi et al. 2006, Sabatino
et al. 2013). For all the periods analyzed: E10, E20, E40, and
E60, the mean values of the serum E2 levels were above
3.7 nM (4.00G0.18 nM in E40), representing 100 times
more than those achieved in control rats (0.18G0.01 nM).
The effect of prolonged estrogen administration on
pituitary mass expansion was examined and a significant
and progressive increase was observed, with the highest
values being obtained at E60 (Fig. 1A). This was also
corroborated by the macroscopic observation in sellae,
Published by Bioscientifica Ltd.
Downloaded from Bioscientifica.com at 04/06/2022 11:13:47AMvia free access

40A
B
C
D
30
20
Pitu
itary
wei
ght (
mg)
10
0Basal
Basal E10 E20
E60E40
E40
E60
Basal
Basal
E10 E20
a*
b*
c*
E40 E60
Figure 1
Rat pituitary expansion after estrogen administration. (A) Pituitary weight
(mg) from control (basal) and estrogen-treated rats (nZ12/group). Results
are expressed as meansGS.E.M.; Fisher’s test (*P!0.05 vs basal; means with
different letters are statistically different). (B) Photographs of representa-
tive in sellae pituitary glands derived from male rats submitted to different
periods of tumor development. The pituitary gland sizes are depicted by a
circle. (C) Paraffin-embedded adenohypophysis sections from control and
estrogen-induced tumoral pituitaries (E40). The parenchyma is surrounded
by a network of vascular channels (*), with a marked development in
models of sustained stimulation with estradiol benzoate, mainly starting
from 40 days of hormone treatment. Staining: H/E. Scale bar: 10 mm.
(D) Micrographs of semithin sections (200 nm) of Araldite-embedded
pituitary gland from control and E60 stained with Toluidine blue.
The sustained estrogen exposition provoked a streaking hypertrophy of
endocrine cells and hormonal release, as revealed by the lower Toluidine
blue staining in the cytoplasms in E60 compared with control cells (arrow).
Scale bar: 10 mm. A full colour version of this figure is available at
http://dx.doi.org/10.1530/ERC-14-0333.
En
do
crin
e-R
ela
ted
Can
cer
Research M E Sabatino et al. Cellular senescence inpituitary tumors
22 :3 304
http://erc.endocrinology-journals.org q 2015 Society for EndocrinologyDOI: 10.1530/ERC-14-0333 Printed in Great Britain
which revealed a notable size growth compared with
normal pituitaries (Fig. 1B). The increase in the pituitary
weight was also accompanied by vascular channel
enlargement (Fig. 1C), with noticeable cellular hypertro-
phy being observed by high-resolution light microscopy
(Fig. 1D).
Next, we analyzed the time-course changes during the
pituitary tumor development by determining the Ki67
labeling index. The quantification of Ki67-immuno-
positive cells revealed a significant increase in cell
proliferation for all time periods analyzed compared with
controls, with a peak reached of approximately eightfold
higher at E10. In spite of the noteworthy pituitary
proliferative response, the estrogen-induced mitogenic
potential rate was not sustained for the whole period
analyzed and successively decreased after the E10 con-
dition. Interestingly at E60, the proliferative rate exhibited
a progressive reduction compared with that attained at
E10, with minimal changes observed from E40, which
might indicate a plateau phase, although this index still
continued to be higher, reaching threefold higher than
the control values (Fig. 2A and B).
RAS-deregulated oncogenic signaling induces cellular
senescence (Braig et al. 2005, Chen et al. 2005, Collado
et al. 2005, Michaloglou et al. 2005). Thus, to determine
the contribution of RAS/ERK1/2 signaling during the
estrogen-induced pituitary tumor development, their
expression levels were analyzed by western blotting. As
shown in Fig. 2C, RAS signaling was progressively
suppressed, with its expression being less evident at E40–
E60 than that at baseline conditions of normal pituitaries.
When the pERK1/2 protein was analyzed, a similar pattern
expression was observed for its phosphorylated form
during the development of experimental pituitary tumors.
Finally, to examine whether this decrease in cell
proliferation could be due to apoptosis, we also determined
the biochemical features of this type of cell death in
pituitary cells by the TUNEL method. As shown in Fig. 3,
for all experimental groups, the signs of apoptotic nuclei
were practically absent with no significant changes in the
number of TUNEL-positive cells being detected, thus
suggesting that the modifications observed in the growth
rate could not have been associated with apoptosis.
Tumoral pituitary cells acquired features of the cellular
senescence phenotype
To try to determine whether cellular senescence takes
place during estrogen-induced pituitary tumor develop-
ment, we turned our attention to the detection of SA-b-gal,
Published by Bioscientifica Ltd.
Downloaded from Bioscientifica.com at 04/06/2022 11:13:47AMvia free access

A
B
Basal
E20
E10
E40
E60
C21 kDa
Basal E10 E20 E40 E60
Basal E10 E20 E40 E60
c*
c*
b*
a*
10
8
6
4
2
0
Ki6
7 in
dex
(% o
fpo
sitiv
e nu
clei
of t
otal
)
RAS
pERK1/2
ERK1/2
b-actin
44 kDa42 kDa
44 kDa42 kDa
43 kDa
Figure 2
Ki67 immunolabeling in the estrogen-induced pituitary tumors.
(A) Immunocytochemical detection of Ki67 in sections of pituitaries from
control and estrogenized rats. A remarkable increase in Ki67 reactivity
(brown signal) was seen at the beginning of the proliferative injures.
Representative fields of anterior pituitary sections from a representative
experiment from a total of three independent experiments with similar
results are shown. Scale barZ20 mm. (B) The Ki67-positive nuclei staining is
expressed as a percentage of the total nuclei counted. Data are expressed
as meansGS.E.M. using the Fisher’s test (*P!0.05 vs basal; means with
different letters are statistically different). (C) RAS/pERK protein expression
during the development of experimental pituitary tumors. Analysis of RAS
and pERK1/2 (total fraction) from control and tumoral pituitary cells by
western blotting revealed a RAS/pERK gradual suppression during pituitary
tumor development. The b-actin and total ERK1/2 protein expression
confirmed equal loading occurring in all lanes. Data are from a
representative experiment from a total of three independent experiments
with similar results. A full colour version of this figure is available at
http://dx.doi.org/10.1530/ERC-14-0333.
Positive control Basal
E10 E20
E40 E60
Figure 3
TUNEL assay on normal and experimental pituitary tumors. No significant
detection of biochemical features of apoptosis (brown signal) was detected
in histological samples from each experimental condition. Positive control:
pituitary gland section treated with DNAase I. Data from a representative
experiment for a total of three independent experiments with similar
results from each experimental group. Scale barZ100 mm. A full colour
version of this figure is available at http://dx.doi.org/10.1530/ERC-14-0333.
En
do
crin
e-R
ela
ted
Can
cer
Research M E Sabatino et al. Cellular senescence inpituitary tumors
22 :3 305
and as shown in Fig. 4A a progressive rise in the enzymatic
activity was observed. In order to perform a morphometric
analysis of these modifications, the SA-b-gal reaction was
also developed on dispersed pituitary cells. The SA-
b-gal-positive cell index revealed a baseline expression at
http://erc.endocrinology-journals.org q 2015 Society for EndocrinologyDOI: 10.1530/ERC-14-0333 Printed in Great Britain
around 7% of the total pituitary cells, whereas in pituitary
tumors a significantly higher number of SA-b-gal-positive
cells was observed, with values ranging from almost
threefold in the earliest days of the proliferative injury
and rising over time until a fivefold increase was recorded
at E60 (Fig. 4C).
As it has been previously described that cellular
senescence might be overcome in order to develop
unregulated cell proliferation (Campisi 2005, Collado &
Serrano 2010), we next evaluated SA-b-gal reactivity in the
established GH3B6 pituitary tumor cell line under baseline
conditions as well as after sustained estrogen stimulation.
As expected, positive cells were scarce, hardly exceeding
1–2%, a value far below those obtained in tumoral
pituitaries (Fig. 4B and C).
Hence, during estrogen-induced pituitary tumor
development, a cellular senescence process might be
emerging, while GH3B6 pituitary tumoral cells rarely
become senescent.
Published by Bioscientifica Ltd.
Downloaded from Bioscientifica.com at 04/06/2022 11:13:47AMvia free access

E20
Positive control Negative control
A
B C
E40
Basal
GH3B6 GH3B6+E2
E60
40
30
20
10
b-ga
l ind
ex(%
pos
itive
cel
ls o
f tot
al)
0
a
*
a
*
b
*
c
*
d
*
e
*
Basal
GH3
GH3+E 2
E10 E20 E40 E60
E10
Figure 4
Senescence features are expressed during pituitary tumor development.
(A) Cryosections from normal and tumoral pituitaries showing increases in
SA-b-gal reactivity during pituitary tumor development, and GH3B6 cells
presenting a low detection of SA-b-gal. The SA-b-gal enzymatic activity is
dyed in blue. Positive control, rat kidney and negative control, rat kidney
omitting the substrate. Results of a representative experiment are shown.
Scale barZ100 mm. (B) SA-b-gal reaction in E2-stimulated GH3B6 cells. The
cells were cultured with a sustained E2 exposition (120 h; 4 nM).
(C) The number of SA-b-gal-positive cells stained in blue was evaluated and
related to the total number of pituitary cells counted for each experimental
group. Also, SA-b-gal index from control and estrogen-induced GH3B6
pituitary tumoral cell line was determined. Data were statistically analyzed
by the Fisher’s test, and the results are expressed as meansGS.E.M. (*P!0.05
vs basal). A full colour version of this figure is available at http://dx.doi.org/
10.1530/ERC-14-0333.
En
do
crin
e-R
ela
ted
Can
cer
Research M E Sabatino et al. Cellular senescence inpituitary tumors
22 :3 306
Furthermore, we determined the SA-b-gal reactivity
and Ki67 staining in the same cryosection for each
experimental condition. As shown in Fig. 5, for all
examined conditions, the cellular senescence response
was noticeably profuse regarding cell proliferation. By
analyzing the joint progression of both biomarkers during
the tumoral development, we found that, toward E40
and E60, it was possible to discriminate pituitary par-
enchyma differential areas in which Ki67-positive cells
were predominant, and adjacent zones bore a higher
proportion of cells exhibiting the SA-b-gal stain.
To investigate the SASP and involvement of
NFkB expression (Kuilman et al. 2008, Freund et al.
2010), next we evaluated IL6, IL1b, TGFb1, and NFkB
protein expression levels in pituitary extracts by western
blotting. As shown in Fig. 6A, a remarkable increase
in IL6 expression levels toward E40 and E60 was detected.
In agreement with this result, we also showed increases
in IL1b and TGFb1 protein expression levels from E20
to E60 (Fig. 6A). These responses were also accompanied
http://erc.endocrinology-journals.org q 2015 Society for EndocrinologyDOI: 10.1530/ERC-14-0333 Printed in Great Britain
by a rise in both the cytoplasmic and nuclear NFkB
expression, indicating the latter’s activation in the
context of an experimental pituitary tumor (Fig. 6B).
These data indicate that under the present experimental
context, inflammatory network activation was triggered
for this context together with cellular senescence
response.
In order to further characterize the senescence pheno-
type achieved by tumoral pituitaries, we were also interested
in determining whether the mitochondrial dynamics has
been compromised, because it was previously reported that
mitochondrial dysfunction may facilitate cellular senes-
cence emergence (Moiseeva et al. 2009). Thus, by western
blotting, the expression of MFN1 and DRP1 were assessed as
indicators of fusion and fission processes respectively. As
shown in Fig. 6C, both proteins were affected during the
development of experimental pituitary tumors, while MFN1
protein expression was progressively upregulated; the DRP1
expression was notably decreased during in vivo pituitary
tumor development.
Published by Bioscientifica Ltd.
Downloaded from Bioscientifica.com at 04/06/2022 11:13:47AMvia free access

Basal
E60
E20 E40
E60
Figure 5
SA-b-gal and Ki67 staining in cryosections from normal and tumoral
pituitaries. For all examined conditions, proliferating cells (white
rectangle) did not show any SA-b-gal expression. Results of a
representative experiment are shown. Scale barZ20 mm. A full colour
version of this figure is available at http://dx.doi.org/10.1530/ERC-14-0333.
En
do
crin
e-R
ela
ted
Can
cer
Research M E Sabatino et al. Cellular senescence inpituitary tumors
22 :3 307
Activated DNA damage signaling, p21 accumulation, and
an abnormal cell cycle profile are displayed in
experimental pituitary tumors
The pattern of expression of several key cycle regulators
involved in the senescence pathways was examined.
Considering that the DDR plays an essential role in the
senescence pathways (Di Micco et al. 2006), we aimed to
find out if SA-b-gal expression was accompanied by DDR
activation.
By immunocytochemistry, a significant increase in
the number of pituitary cells displaying nuclear pATM
expression was detected in experimental pituitary tumors,
reflecting the activation of DNA damage signaling. The
pATM signal showed a sustained increase from E10 to E60,
with a significant peak of nuclear pATM-positive cells of
around 30% at E40 (Fig. 7A and B). The pATM subcellular
A
25 kDa
17 kDa
15 kDa
43 kDa
65 kDa
Basal E10 E20 E40 E60 B
Basal
Cytoplasmic fraction
E10 E20 E40 E60
43 kDa
TGFb1
IL1b
IL6
b-actin
b-actin
NFkB 6
6
Figure 6
Senescence features are expressed during pituitary tumor development.
Western blotting expression of IL6, IL1b, and TGFb1 (A); NFkB (cytoplasmic
and nuclear fractions) (B) and DRP1; MFN1 (total extracts) (C) and from
control and tumoral pituitary glands revealed signs associated with
http://erc.endocrinology-journals.org q 2015 Society for EndocrinologyDOI: 10.1530/ERC-14-0333 Printed in Great Britain
localization was corroborated by electron microscopy
immunogold labeling, which revealed both nuclear and
cytoplasmic immunoreactivity in tumoral pituitaries
taking place at E40 (Fig. 7C).
The p53 protein, one of the major regulators of cell
cycle progression in response to DNA damage or arrest of
DNA synthesis, is considered to be an ATM target (Pluquet
& Hainaut 2001). Using immunocytochemistry, an
increase in p53 expression was detected for E10 and E20,
whereas for E40 this signal was no longer observed
(Fig. 8A). Considering that the p53 function is related to
its intracellular localization, we also analyzed p53 sub-
cellular expression by western blotting from nuclear and
cytoplasmic pituitary extracts. An important increase in
p53 signaling was immunodetected from E20 in the
cytosolic compartment of pituitary cells, while a decrease
C
Basal
Nuclear fraction
E10 E20 E40 E60
Basal E10 E20 E40 E60
b-actin
COX4
MFN1
DRP1
HDAC1
NFkB5 kDa
5 kDa
43 kDa
17 kDa
86 kDa
71 kDa
inflammatory network activation and mitochondrial fusion. The b-actin,
COX4, and HDAC1 protein expressions were used as loading controls.
Data are from a representative experiment from a total of three
independent experiments with similar results.
Published by Bioscientifica Ltd.
Downloaded from Bioscientifica.com at 04/06/2022 11:13:47AMvia free access

Basal E10
E40 E60
E20
E40
g
n
N
40B C
A
30
20
10
pAT
M in
dex
(% o
f pos
itive
nuc
lei/t
otal
)
0Basal E10 E20 E40 E60
d*
c*
b*
a*
Figure 7
DNA damage in estrogen-induced pituitary tumors. (A) DNA damage
signaling labeled by intranuclear accumulation for pATM immunoreactivity
(brown signal) in normal and tumoral pituitaries. Representative sections
from normal and estrogen-treated anterior pituitary glands are shown.
Scale barZ20 mm. (B) The pATM-positive nuclei as a proportion of the total
nuclei in pituitary sections are shown and results are expressed as meansG
S.E.M.; Fisher’s test (*P!0.05 vs basal; means with different letters are
statistically different). (C) Electron micrograph of pituitary cells from E40
expressing pATM label by using secondary antibody conjugated with 15 nm
gold particles. Black arrows indicate pATM signaling accumulated in the
cell compartments. N, nucleus; g, hormone granules; m, mitochondrion.
Scale barZ2 mm. A full colour version of this figure is available at
http://dx.doi.org/10.1530/ERC-14-0333.
En
do
crin
e-R
ela
ted
Can
cer
Research M E Sabatino et al. Cellular senescence inpituitary tumors
22 :3 308
in p53 nuclear fraction levels starting at E20 was also
observed (Fig. 8B). Therefore, we next evaluated the
expression of the CDK inhibitor p21 protein, a transcrip-
tional target for p53 that is involved in cell cycle responses
to DNA damage (Besson et al. 2008). By western blotting
analysis, an increase in the nuclear p21 was observed,
starting from E20 and strengthened over time from 40 to
60 days of tumor development (Fig. 9A). The subcellular
localization of p21 analyzed by electron microscopy
immunogold labeling for E40 pituitary glands revealed a
streaking immunoreactivity in the nuclear and
http://erc.endocrinology-journals.org q 2015 Society for EndocrinologyDOI: 10.1530/ERC-14-0333 Printed in Great Britain
cytoplasmic compartments of pituitary cells (Fig. 9B),
a result that might be related to the lower pituitary cell
proliferation detected at E40 (Fig. 2A and B). Moreover,
p21 cytoplasmic accumulation was also observed for
E20 and E40. However, an additional evaluation
performed on GH3B6 tumoral pituitary cells showed that
these cells did not express p21 (Fig. 9C), which could be
associated with the low SA-b-gal reactivity observed in this
cell type (Fig. 4B and C).
Alterations in the pituitary cell cycle profile were
analyzed by FACS, and in order to try to discriminate
Published by Bioscientifica Ltd.
Downloaded from Bioscientifica.com at 04/06/2022 11:13:47AMvia free access

A
Basal
E40
E10
E20
B
53 kDa
43 kDa
53 kDa
65 kDa
p53
Basal E10 E20
Cytoplasmic fraction
Nuclear fraction
E40 E60
Basal E10 E20 E40 E60
HDAC1
p53
b-actin
E60
Figure 8
p53 expression during pituitary tumor development. (A) p53 immuno-
reactivity (brown signal) in normal and tumoral pituitary sections. An
increase in p53 detection is observed at E10 and E20. Representative fields
of anterior pituitary sections are also shown. Scale barZ20 mm. (B) The p53
expression showed a cytoplasmic redistribution during the tumor
development as revealed by western blotting in fractionated pituitary
extracts. Expression of b-actin and HDAC1 was used as loading controls.
Representative images of three independent experiments are presented.
A full colour version of this figure is available at http://dx.doi.org/10.1530/
ERC-14-0333.
En
do
crin
e-R
ela
ted
Can
cer
Research M E Sabatino et al. Cellular senescence inpituitary tumors
22 :3 309
between the cycling population and S-phase arrest, the
S-phase was compared with the G2/M population, with
the result being expressed as a ratio. As shown in Fig. 9D, a
significant increase in the S-phase:G2/M ratio was
detected for E40 compared with the control ratio
(57.63G14.87 vs 12.59G10.86 respectively; P!0.05).
These results together with the DDR activation and p21
upregulation reinforce the possibility of a delay occurring
in the cell cycle progression, which became more evident
toward 40 days of tumor progression.
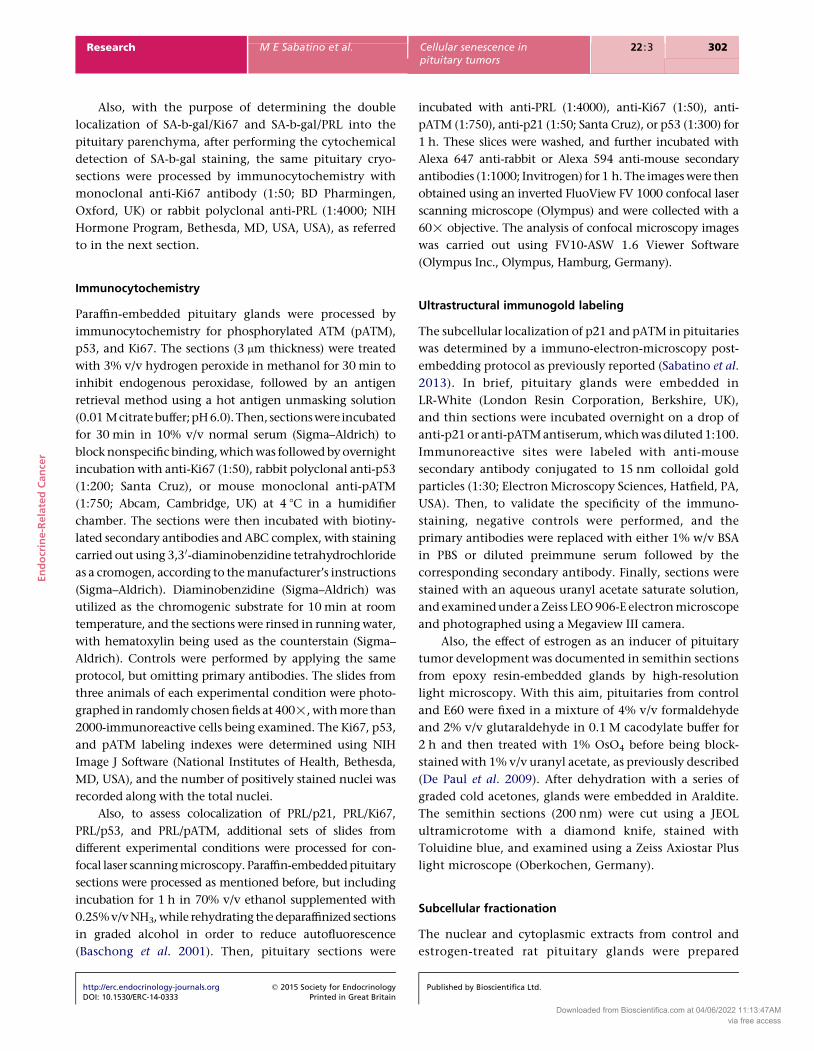
Senescence markers are not restricted to PRL cells
As most pituitary tumors induced by estrogen in experi-
mental animals are PRL-secreting tumors (De Nicola et al.
1978, Wiklund et al. 1981, Sadoul et al. 1992, Mukdsi et al.
2004), we attempted to determine whether lactotroph
specific cell lineage was involved in the pituitary senescent
http://erc.endocrinology-journals.org q 2015 Society for EndocrinologyDOI: 10.1530/ERC-14-0333 Printed in Great Britain
response. The colocalization between PRL/Ki67, PRL/p21,
PRL/p53, PRL/pATM, and PRL/Sa-b-gal proteins was carried
out by dual immunolabeling for different experimental
conditions. As shown in Fig. 10, for all the combination of
markers analyzed, it was possible to detect double-stained
cells, indicative of lactotrophs, which might possibly be
senescent as shown by SA-b-gal, DDR activation by pATM
or p21 accumulation indicating cellular arrest. However,
along with double-stained cells, it was also possible to
observe single-stained cells, representative of either non-
senescent lactotrophs or nonlactotroph cells undergoing
senescence. Therefore, none of the marker expressions
examined exclusively colocalized with PRL-positive cells,
suggesting that the senescence phenomena may not be
restricted to lactotroph populations.
Discussion
In this study, we have demonstrated clear evidence of
pituitary senescence taking place during in vivo estrogen-
induced pituitary tumor development. The cell prolifer-
ation reduction and expression of cellular senescence
features such as SA-b-gal and IL6 expression, as well as
DNA damage signaling activation and p21 expression,
indicate a role for senescence in the regulation of pituitary
cell growth.
The particularities of benign pituitary tumors have led
to the appearance of senescence being considered, which
has been proposed as an intrinsic barrier for tumor
development that emerges at the early stages of neoplastic
growth (Prieur & Peeper 2008). This pituitary cellular
response might be beneficial for organisms, because it
allows proliferation to be arrested while maintaining its
physiological functions (Adams 2009), and therefore,
hormones may continue to be secreted (Mooi 2009).
The tumor suppression role of cellular senescence has
been convincingly established in vitro (Bringold & Serrano
2000, Campisi 2001, Mooi & Peeper 2006), but further
evidence is still needed to demonstrate the relationship
between in vivo senescence and proliferation control
(Mooi & Peeper 2006, Collado & Serrano 2010). In this
context, benign pituitary microadenomas are faithful
models of in vivo senescence (Mooi 2009, Chesnokova &
Melmed 2010). Previous studies have already reported that
murine pituitary adenomas with altered PTTG and Rb
expression trigger cellular senescence (Chesnokova et al.
2007, 2008). These authors also correlated the high levels
of growth hormone (GH) with the senescence-associated
markers in adenomas, and suggested that cellular
senescence is activated in a lineage-specific fashion
Published by Bioscientifica Ltd.
Downloaded from Bioscientifica.com at 04/06/2022 11:13:47AMvia free access

A
B
C
D
21 kDa
Basal E10 E20
Cytoplasmic fraction
E40 E60Basal
Basal E40
RER
RER
n
g
NN
GH3B6 E60E10 E20
Nuclear fraction
E40 E60
Basal E10 E20 E40
*
E60
p21
b-actin
p21
b-actin
p21
HDAC143 kDa
21 kDa
65 kDa
21 kDa
43 kDa
80
60
40
S-p
hase
:G2/
M r
atio
20
0
Figure 9
The expression of CDK inhibitor p21 was increased in tumoral pituitary
glands. (A) The analysis of the p21 protein expression levels by western
blotting revealed an increase in its expression in both nuclear and cytosolic
extracts during tumor development. (B) The ultrastructural localization of
p21 was examined in control (basal) and E40 pituitary glands by electron
microscopy immunogold labeling. Black arrows indicate p21 signaling
mainly expressed at the nuclear cell compartment. N, nucleus; n, nucleolus;
RER, rough endoplasmic reticulum. Scale barZ2 mm. (C) Total extract of
established GH3B6 tumoral cells did not express p21. The expression of
b-actin and HDAC1 was used as loading controls. Representative images of
three independent experiments are shown. (D) S-phase:G2/M ratio analysis
during experimental pituitary tumor development. The DNA content was
determined by flow cytometry in order to evaluate modifications in the
pituitary cell cycle profile of normal and tumoral pituitary cells. A notable
increase in the S-phase:G2/M ratio is observed for E40, when compared
with control ratio. The meansGS.E.M. of the percentages of cells at different
cell cycle stages are presented Fisher’s test (*P!0.05 vs basal).
En
do
crin
e-R
ela
ted
Can
cer
Research M E Sabatino et al. Cellular senescence inpituitary tumors
22 :3 310
(Chesnokova et al. 2008, 2011, 2013). However, to date, no
attempt has been made to analyze the emergence of cellular
senescence with pituitary tumor progression in the absence
of genetic manipulation or specific senescence-inducing
stimuli. In this study, we have demonstrated that both
senescence markers and DNA damage signaling were
expressed during the development of estrogen-induced
pituitary tumors. This present in vivo approach allows us to
suggest a role of cellular senescence as a pituitary intrinsic
response to chronic cellular over-activation.
Although the pituitary cells of adult rats are charac-
terized by low proliferation rates (0.7–0.8%; McNicol &
Carbajo-Perez 1999), we have observed a strong stimu-
lation of cell proliferation accompanied by hypertrophy
and vascular network development after the start of
estrogen treatment, with all of these parameters con-
tributing to the significant mass increase revealed by
assessing the wet pituitary weight data. Although the
proliferation index still presents significantly higher
values at E60 than those detected in controls, the initial
increase in cell proliferation lost potency at advanced
endpoints, indicating a plateau phase in the cell prolifer-
ation rate until the end of stimulation, as shown by Ki67
immunoreactivity. Consequently, this biphasic pattern
might be distinct from the exponential proliferation
http://erc.endocrinology-journals.org q 2015 Society for EndocrinologyDOI: 10.1530/ERC-14-0333 Printed in Great Britain
typically associated with aggressive tumoral progression
(Hanahan & Weinberg 2000).
Furthermore, GH3B6 represents an equivalent for
estrogen-induced pituitary tumor cells, but as an estab-
lished and autonomous pituitary tumoral stage, showing a
basal proliferation rate of around 25–30% of total cells
(Giles et al. 2010, Petiti et al. 2015), while normal pituitary
cells showed 1% of proliferation, with the replication
index of estrogen-induced pituitary tumoral cells reaching
a maximum of 8%. The use of this tumoral cell line
permitted us to analyze the presence of cellular senescence
in a cell population, which might represent a clone in the
heterotypic tumor complexity that has acquired growth
signaling autonomy and may have possibly lost the ability
to respond to some cellular arrest signals.
Although intrinsic tumoral suppression has been
classically associated with apoptosis induction (Lowe
et al. 2004), we detected very few apoptosis events
throughout the adenoma development, in agreement
with previous findings (Spady et al. 1999, Palmeri et al.
2009). Earlier reports have demonstrated that estrogen
administration enhances cell survival in the anterior
pituitary gland by inhibiting apoptosis (Spady et al.
1999). Therefore, an apoptotic block manifested during
an estrogen-induced tumor development may support
Published by Bioscientifica Ltd.
Downloaded from Bioscientifica.com at 04/06/2022 11:13:47AMvia free access
Ki67
Basal E10 E40
pATM
p53
p21
SA-b-gal
Figure 10
KI67, pATM, p21, p53, and SA-b-gal expression in lactotroph cells. Confocal
laser scanning microscopy of pituitary paraffin-embedded sections from
control, E10, and E40 glands co-stained for PRL (green) with Ki67, pATM,
p21, or p53 (red). Single-stained lactotrophs, single-stained non-PRL cells
(arrowheads), and double-stained lactotrophs (arrows) are seen. Also,
immunolabeling for PRL (brown) and histoenzimology for SA-b-gal (blue)
were performed on the same cryosection. Data are from a representative
experiment from a total of three independent experiments with similar
results. Scale barZ20 mm. A full colour version of this figure is available at
http://dx.doi.org/10.1530/ERC-14-0333.
En
do
crin
e-R
ela
ted
Can
cer
Research M E Sabatino et al. Cellular senescence inpituitary tumors
22 :3 311
pituitary senescence being a cytological stress response
(Marcotte et al. 2004). In this way, senescence might be a
more appropriate mechanism for pituitary tumor suppres-
sion, taking into account that the pituitary gland is critical
for the homeostatic function, but which exhibits a
regenerative capacity (Chesnokova et al. 2013).
It is known that multiple processes might take place
in the gland during tumor development. In fact, it is the
balance between proliferation with death or senescence
that determines the growth rate of a particular tumor
(Lowe et al. 2004). The determination of double SA-b-gal-/
Ki67-positive cells allowed us to confirm the idea that
senescence is an important outcome in estrogen-induced
http://erc.endocrinology-journals.org q 2015 Society for EndocrinologyDOI: 10.1530/ERC-14-0333 Printed in Great Britain
pituitary tumors, as it was observed to be profuse regarding
cell proliferation. In addition, the nonoverlapped distri-
bution of Ki67 and SA-b-gal-positive cells observed at E60
supported the hypothesis of heterotypic cell populations
that coexist during tumor development. Hence, it is
possible to associate this coexistence of different kinds of
responses to the fact that the five cell types constitute the
pituitary cell population. Thus, specific diverse cell-type
trophic pathways may be activated in reaction to long-
term estrogen treatment.
Considering that the senescent cell phenotype still
lacks specific markers, in this study several senescence-
associated features were evaluated in order to investigate
this cellular mechanism. The strong association between
the SASP pattern and the other senescence biomarkers
(p21, pATM, and Sa-b-gal) led us to connect these
increased cytokine expressions with emerging pituitary
senescence within estrogen-induced pituitary tumors. A
putative role for IL6 in pituitary senescence induction has
been previously suggested (Fuertes et al. 2010), with TGFb1
and IL1b also having a known impact on pituitary tissue
homeostasis (Haedo et al. 2009). We have recently
demonstrated somatolactotroph GH3B6 tumoral cells
exhibiting a refractory behavior to the TGFb1 inhibitory
effects on cell cycle progression, as a consequence of the
crosstalk with proliferative pathways that counterbalances
the TGFb1 signal (Petiti et al. 2015). Considering the
specific activities implied in the secretion of each
cytokine, while IL6 is considered to be a critical controller
of the SASP and seems to have a more significant role in
autocrine senescence (Kuilman et al. 2008), the TGFb1 and
IL1 as SASP factors are able to trigger senescence by
paracrine actions (Hubackova et al. 2012).
In this regard, it is known that the proteins encoded
by NFkB target genes contribute in multiple ways to the
biological effects of NFkB, which include inflammation
response, apoptosis, mitogenic activity, implications in
the evolution of neoplastic injuries, cellular senescence,
and DNA repair (Hayden & Ghosh 2004, Pikarsky &
Ben-Neriah 2006). Furthermore, NFkB operates as a
molecular switch that conveys signals from an intricate
signaling network, thereby regulating essential processes
through the gene transcription regulation.
Regarding the focus of our study, NFkB cooperates
through feedback regulation within the senescence pro-
cess, because it can trigger SASP in response to persistent
DNA damage signaling (Freund et al. 2010). Therefore, we
focused on NFkB activity as an accompaniment of the SASP
activation evidence, rather than the association with
growth regulation pathways in which NFkB activity may
Published by Bioscientifica Ltd.
Downloaded from Bioscientifica.com at 04/06/2022 11:13:47AMvia free access

En
do
crin
e-R
ela
ted
Can
cer
Research M E Sabatino et al. Cellular senescence inpituitary tumors
22 :3 312
also surely participate (Freund et al. 2010). In this context,
several reports have implied that SASP induction is an
NFkB-dependent mechanism (Acosta et al. 2008, Chien
et al. 2011, Salminen et al. 2012), suggesting that the SASP
is caused primarily by genotoxic stress rather than by
proliferative arrest per se (Freund et al. 2010). From our data,
the notable increase in SASP component expression with
NFkB activation suggests that the inflammatory network
was triggered during pituitary tumor development. Under
the present experimental context, the expression of these
cytokines collectively reinforces the role of SASP in
ensuring an efficient growth arrest, as was also proposed
by others (Yang et al. 2006, Acosta et al. 2008, Kuilman et al.
2008, Wajapeyee et al. 2008).
The mitochondrial metabolism is also compromised
during cellular senescence, because DNA damage can be
powered by oxidative stress triggering premature senes-
cence (Moiseeva et al. 2009). In our study, we detected a
decreased DRP1 together with increased MFN1 expression,
suggestive of a misbalance between mitochondrial fission
toward fusion processes in favor of an enlargement of the
organelle. Therefore, the alteration of the mitochondrial
dynamics equilibrium toward the prevalence of fusion
processes might indicate an adaptation of the function-
ality of this organelle during pituitary tumor develop-
ment, occurring together with cellular senescence.
Regarding this, an ineffective mitochondrial fission
triggering cellular senescence has been previously
described (Lee et al. 2007).
In view of the fact that our experimental conditions did
not include cytotoxic drugs, irradiation stimuli, or other
stimuli strongly associated with DNA damage or senescence
induction, the manifestation of senescence signs during
the development of the pituitary tumor constitutes a
noteworthy finding of our study. Nevertheless, it cannot
be ignored that a multiplicity of molecular pathways could
be involved in the development of estrogen-induced
pituitary tumors (Sarkar 2006). Regarding this, we analyzed
RAS/ERK pathway activation due to the fact that abnormally
high mitogenic signals such as estrogen-induced RAS
activation (Weigel 1996) might function as a prolonged
cellular overactivation capable of inducing cellular senes-
cence (Serrano & Blasco 2001). However, this key core
element is part of a complex signaling network with many
interactions (McKay & Morrison 2007), and there have been
extensive attempts to clarify its contribution in the
promotion of cell growth, with it being the fine regulation
of these pathways which determines cell cycle arrest or
malignant transformation (Serrano et al. 1997, Roberts &
Der 2007). Moreover, although there are some studies
http://erc.endocrinology-journals.org q 2015 Society for EndocrinologyDOI: 10.1530/ERC-14-0333 Printed in Great Britain
showing increases in RAS/ERK activity in pituitary tumors
(Karga et al. 1992, Cai et al. 1994, Dworakowska et al. 2009),
its role in these tumors is far from being fully deciphered
(Cakir & Grossman 2009). In our study, RAS/pERK signaling
was progressively suppressed thereafter, with its expression
being less evident at E40–E60 than at baseline conditions.
These results imply that RAS/ERK effects were therefore, to a
major extent, impaired, and that there might exist a
regulation mechanism that could attenuate the abnormal
mitogenic signals. Supporting this notion, Courtois-Cox
et al. (2006) have shown that the suppression of RAS is
sufficient to induce cellular senescence, and that this event,
onitsown, canactivate theknowndownstreammediatorsof
the senescence response through a variety of mechanisms.
The detection of pATM expression demonstrated in
our study suggests the possibility of DNA damage during
experimental tumoral development, because ATM has
been reported to be one of the first proteins that responds
to DDR (Di Micco et al. 2006). Therefore, the combination
of a very high mitogenic signaling, the possibility of
chromatin disorder, and a blockage of apoptosis might
favor the emergence of cellular senescence as an alterna-
tive to control pituitary growth (Di Micco et al. 2006,
Chesnokova & Melmed 2010).
As senescence pathway involves cell cycle machinery
committed to cellular arrest (Kuilman et al. 2010), we
evaluated pituitary cellular arrest through the analysis of
the p53 and p21 restriction-point cell cycle proteins and
the cell cycle profile.
It is known that p53 integrates complex signaling
networks, increasing lifespan through genome mainten-
ance and triggering various cell fate decisions (Rodier et al.
2007). At the early stages of pituitary tumor development,
we observed an increase in p53 expression levels, with
its intracellular localization being principally detected in
the cytoplasm compartment. Furthermore, as it has been
described that estrogen induces p53 inactivation through
intracellular redistribution toward the cytosol (Molinari
et al. 2000), our findings could be interpreted as a p53
stabilization mechanism, as previously suggested (Liu et al.
2006). Despite having found DDR activation, the cyto-
plasmic p53 retention might indicate its incapability to
exert its canonical functions, thereby triggering a response
that either repairs DNA damage or else removes the
affected cell from the replicative pool. This indirect
evidence may explain the great accumulation of pATM
signaling, thus in turn favoring the increase in the
senescence signs observed at E40.
Although in most cells, p53 is crucial for a senescence
response following DNA damage (Di Leonardo et al. 1994),
Published by Bioscientifica Ltd.
Downloaded from Bioscientifica.com at 04/06/2022 11:13:47AMvia free access

En
do
crin
e-R
ela
ted
Can
cer
Research M E Sabatino et al. Cellular senescence inpituitary tumors
22 :3 313
in others it is only required to induce senescence growth
arrest and not necessary for the maintenance of senes-
cence, which subsequently becomes irreversible and p53
independent (Beausejour et al. 2003). Thus, cellular
senescence might not appear to entail a consistent
sustained rise in p53 protein levels (Itahana et al. 2001).
Under our experimental conditions, it is possible that
nuclear p53 initiated both senescence growth arrest and
some of the functional aspects of the senescent phenotype
by inducing p21. These p21 levels can then be sustained, at
least for several weeks, by a p53-independent mechanism
(Itahana et al. 2001).
CDK inhibitor p21 expression, strongly related to
cellular senescence pathways, elicits cell cycle arrest
(Roninson 2002). Pituitary growth control by p21 has
already been described, indicating its key role in senes-
cence pathways, while it was undetectable in pituitary
carcinomas (Chesnokova et al. 2007). In this study, the
upregulation of nuclear p21 protein expression in close
relationship with the highest levels of SA-b-gal reactivity
suggests that cell cycle restraint might take place during
the development of pituitary tumors. Moreover, in our
study, the lack of SA-b-gal and p21 protein expression
reactivity in GH3B6 pituitary cells indicates the incap-
ability of these cells to trigger a self-limiting senescence
arrest at the tumoral stage acquired in GH3B6 cells. In fact,
Chesnokova et al. (2008) have already reported that p21
expression underlies decreased pituitary tumor develop-
ment, and that this CDK inhibitor was undetectable in
tested human pituitary carcinomas. Thus, under the
present experimental conditions, p21 might constitute
another significant mediator in constraining pituitary
growth in tumor development. In addition, it has been
reported that this CDK inhibitor can function under either
p53-dependent or independent conditions (Gartel &
Tyner 1999). Considering that in our study no association
between the increase in p21 levels with a p53 expression
pattern was seen, p21 might therefore be induced in a p53-
independent fashion. In agreement with this, p53-
independent effects of p21 have also been reported in
relationship with cell cycle arrest of senescent cells (Noda
et al. 1994). Furthermore, some studies have presented
evidence of induction of the CDK inhibitor p21 in
response to activation of the cytokines IL6 and TGFb
signal transduction pathways (Zeng & el-Deiry 1996,
Bellido et al. 1998, Florenes et al. 1999). Thus, SASP
induction in experimental pituitary tumors may be
responsible for senescence cell growth arrest through
p21 induction. Concerning the increase observed in
cytoplasmic p21, this data could be interpreted as the
http://erc.endocrinology-journals.org q 2015 Society for EndocrinologyDOI: 10.1530/ERC-14-0333 Printed in Great Britain
outcome of the increased p21 synthesis or a degradation
taking place in the cytoplasm. Nonetheless, it may also be
linked to apoptosis delay or inhibition due to pleitropic
context-dependent p21 functions (Arai et al. 2006).
The CDK inhibitor p21 is also responsible for
inhibiting ongoing DNA synthesis, thus allowing time
for DNA repair (Luo et al. 1995), and also playing a role in
the G2 phase transition (Besson et al. 2008). The
significant decrease in the G2/M cell proportion observed
at E40, concomitant with an increase in p21 expression
and DDR activation, may indicate a p21-mediated
blockage of ongoing DNA synthesis, which was involved,
at least in part, in the declining cell progression from the
S phase to G2/M. Considering that S-phase checkpoint
activation in response to DNA damage has been previously
reported (Ogryzko et al. 1997, Pedeux et al. 1998, Knudsen
et al. 2000), our results suggest a possible delay taking place
in the cell cycle progression mediated by p21, provoked by
the occurrence of high DDR signaling.
Considering that prolactinomas are the most frequently
occurring neoplasms in humans and in laboratory animals
(Ciccarelli et al. 2005), we found that during estrogen-
induced pituitary tumor growth, the expression of all the
senescence markers used was not confined to the lactotroph
population. The direct assumption of the involvement of
PRL cells in pituitary senescence may be premature for
several reasons. Firstly, alpha and beta estrogen receptors are
also present in folliculostellate (Mitchner et al. 1998),
somatotroph, thyrotroph, and gonadotroph cells (Nishi-
hara et al. 2000, Gonzalez et al. 2008). Also, compelling
reports by Nolan & Levy (2009) in Wistar male rats have
shown that approximately two-thirds of anterior pituitary
cell divisions after estrogen treatment occur in non-PRL-
positive cells, with only one-thirds of the mitotic figures
corresponding to lactotroph cells.
PRL cells might represent a phenotype less sensitive
to growth inhibition programs. Indeed, other reports have
suggested that the senescence contribution to benign
pituitary tumor development might be cell-type specific
rather than universal. In agreement, Chesnokova et al.
(2008) have described senescence taking place predomi-
nantly in GH-secreting tumors, and to a lesser extent in
PRL-secreting tumors. In addition, Alexandraki et al.
(2012) showed that SA-b-gal is overexpressed only in
nonfunctional pituitary adenomas and GH-secreting
tumors, and that in the context of senescence, these
adenomas behave differently compared with ACTH- and
PRL-secreting adenomas. Finally, as the great majority of
pituitary carcinomas are derived from these latter types of
adenoma, we might speculate that the lack or bypass of
Published by Bioscientifica Ltd.
Downloaded from Bioscientifica.com at 04/06/2022 11:13:47AMvia free access

En
do
crin
e-R
ela
ted
Can
cer
Research M E Sabatino et al. Cellular senescence inpituitary tumors
22 :3 314
senescence in lactotrophs may permit the occasional
prolactinoma to develop into a carcinoma. In this study,
we have provided evidence for the involvement of
senescence from the early proliferative response of the
pituitary gland to estrogen and also we have demonstrated
that the changes observed were not associated exclusively
with PRL cells.
In summary, in this study, we have demonstrated
clear evidence of the emergence of pituitary senescence in
the development of tumoral pituitary injuries induced by
estrogen. The association between DDR activation, SA-b-
gal expression, and p21 involvement constitutes a reliable
combination of senescence-associated markers for in vivo
pituitary senescence detection. Moreover, the partici-
pation of cellular senescence should be conceived as a
contributing component behind the strikingly benign
intrinsic nature of pituitary adenomas, thereby influen-
cing the capability of the pituitary gland to avoid
unregulated cell proliferation. Understanding this
mechanism might provide significant insights into cancer
control networks and lead to new therapeutic strategies.
The future recognition of the intracellular targets involved
in the responses to anti-mitogenic signals would also help
to interpret the abnormalities responsible for their
dysfunction in tumorigenesis.
Declaration of interest
The authors declare that there is no conflict of interest that could be
perceived as prejudicing the impartiality of the research reported.
Funding
This work was supported by the Fondo Nacional de Ciencia y Tecnologıa
(FONCYT), Consejo Nacional de Investigaciones Cientıficas y Tecnicas
(CONICET), and Secretarıa de Ciencia y Tecnologıa de la Universidad
Nacional de Cordoba (SECyT–UNC). M E Sabatino and P A Perez are doctoral
fellows at the Consejo Nacional de Investigaciones Cientıficas y Tecnicas.
L d V Sosa and C Leimgruber are postdoctoral fellows at Consejo Nacional
de Investigaciones Cientıficas y Tecnicas. J P Petiti, S Gutierrez, A I Torres
and A L De Paul are established researchers at the Centro de Microscopıa
Electronica, Instituto de Investigaciones en Ciencias de la Salud, Consejo
Nacional de Investigaciones Cientıficas y Tecnicas (INICSA–CONICET),
Facultad de Ciencias Medicas, Universidad Nacional de Cordoba. A Latini
is established researcher at the Conselho Nacional de Desenvolvimento
Cientıfico e Tecnologico (CNPq), Laboratorio de Bioenergetica y Estres
Oxidativo, Departamento de Bioquımica, Centro de Ciencias Biologicas,
Universidad Federal de Santa Catarina, Brazil.
Acknowledgements
The authors wish to thank Ms Elena Pereyra and Ms Lucıa Artino for their
excellent technical assistance. They would also like to thank native speaker
Dr Paul Hobson for revising the English of the manuscript.
http://erc.endocrinology-journals.org q 2015 Society for EndocrinologyDOI: 10.1530/ERC-14-0333 Printed in Great Britain
References
Acosta JC, O’Loghlen A, Banito A, Guijarro MV, Augert A, Raguz S,
Fumagalli M, Da Costa M, Brown C, Popov N et al. 2008 Chemokine
signaling via the CXCR2 receptor reinforces senescence. Cell 133
1006–1018. (doi:10.1016/j.cell.2008.03.038)
Adams PD 2009 Healing and hurting: molecular mechanisms, functions,
and pathologies of cellular senescence. Molecular Cell 36 2–14.
(doi:10.1016/j.molcel.2009.09.021)
Alexandraki KI, Munayem Khan M, Chahal HS, Dalantaeva NS, Trivellin G,
Berney DM, Caron P, Popovic V, Pfeifer M, Jordan S et al. 2012
Oncogene-induced senescence in pituitary adenomas and carcinomas.
Hormones 11 297–307. (doi:10.14310/horm.2002.1358)
Arai D, Nomura N, Fukuchi K & Gomi K 2006 Cytoplasmic localization of
cyclin kinase inhibitor p21 delays the progression of apoptosis. Cancer
Genomics & Proteomics 3 10.
Asa SL & Ezzat S 2002 The pathogenesis of pituitary tumours. Nature
Reviews. Cancer 2 836–849. (doi:10.1038/nrc926)
Asa SL & Ezzat S 2009 The pathogenesis of pituitary tumors. Annual Review
of Pathology 4 97–126. (doi:10.1146/annurev.pathol.4.110807.092259)
Baschong W, Suetterlin R & Laeng RH 2001 Control of autofluorescence of
archival formaldehyde-fixed, paraffin-embedded tissue in confocal
laser scanning microscopy (CLSM). Journal of Histochemistry and
Cytochemistry 49 1565–1572. (doi:10.1177/002215540104901210)
Beausejour CM, Krtolica A, Galimi F, Narita M, Lowe SW, Yaswen P &
Campisi J 2003 Reversal of human cellular senescence: roles of the p53
and p16 pathways. EMBO Journal 22 4212–4222. (doi:10.1093/emboj/
cdg417)
Bellido T, O’Brien CA, Roberson PK & Manolagas SC 1998 Transcriptional
activation of the p21(WAF1,CIP1,SDI1) gene by interleukin-6 type
cytokines. A prerequisite for their pro-differentiating and anti-
apoptotic effects on human osteoblastic cells. Journal of Biological
Chemistry 273 21137–21144. (doi:10.1074/jbc.273.33.21137)
Besson A, Dowdy SF & Roberts JM 2008 CDK inhibitors: cell cycle regulators
and beyond. Developmental Cell 14 159–169. (doi:10.1016/j.devcel.
2008.01.013)
Braig M, Lee S, Loddenkemper C, Rudolph C, Peters AH, Schlegelberger B,
Stein H, Dorken B, Jenuwein T & Schmitt CA 2005 Oncogene-induced
senescence as an initial barrier in lymphoma development. Nature 436
660–665. (doi:10.1038/nature03841)
Bringold F & Serrano M 2000 Tumor suppressors and oncogenes in cellular
senescence. Experimental Gerontology 35 317–329. (doi:10.1016/S0531-
5565(00)00083-8)
Cai WY, Alexander JM, Hedley-Whyte ET, Scheithauer BW, Jameson JL,
Zervas NT & Klibanski A 1994 ras mutations in human prolactinomas
and pituitary carcinomas. Journal of Clinical Endocrinology and
Metabolism 78 89–93. (doi:10.1210/jcem.78.1.8288721)
Cakir M & Grossman AB 2009 Targeting MAPK (Ras/ERK) and PI3K/Akt
pathways in pituitary tumorigenesis. Expert Opinion on Therapeutic
Targets 13 1121–1134. (doi:10.1517/14728220903170675)
Campisi J 2001 Cellular senescence as a tumor-suppressor mechanism.
Trends in Cell Biology 11 S27–S31. (doi:10.1016/S0962-8924(01)
82148-6)
Campisi J 2005 Suppressing cancer: the importance of being senescent.
Science 309 886–887. (doi:10.1126/science.1116801)
Campisi J & d’Adda di Fagagna F 2007 Cellular senescence: when bad
things happen to good cells. Nature Reviews. Molecular Cell Biology 8
729–740. (doi:10.1038/nrm2233)
Chen Z, Trotman LC, Shaffer D, Lin HK, Dotan ZA, Niki M, Koutcher JA,
Scher HI, Ludwig T, Gerald W et al. 2005 Crucial role of p53-dependent
cellular senescence in suppression of Pten-deficient tumorigenesis.
Nature 436 725–730. (doi:10.1038/nature03918)
Chesnokova V & Melmed S 2010 Pituitary senescence: the evolving role of
Pttg. Molecular and Cellular Endocrinology 326 55–59. (doi:10.1016/
j.mce.2010.02.012)
Published by Bioscientifica Ltd.
Downloaded from Bioscientifica.com at 04/06/2022 11:13:47AMvia free access

En
do
crin
e-R
ela
ted
Can
cer
Research M E Sabatino et al. Cellular senescence inpituitary tumors
22 :3 315
Chesnokova V, Zonis S, Rubinek T, Yu R, Ben-Shlomo A, Kovacs K,
Wawrowsky K & Melmed S 2007 Senescence mediates pituitary
hypoplasia and restrains pituitary tumor growth. Cancer Research 67
10564–10572. (doi:10.1158/0008-5472.CAN-07-0974)
Chesnokova V, Zonis S, Kovacs K, Ben-Shlomo A, Wawrowsky K, Bannykh S
& Melmed S 2008 p21(Cip1) restrains pituitary tumor growth. PNAS
105 17498–17503. (doi:10.1073/pnas.0804810105)
Chesnokova V, Zonis S, Zhou C, Ben-Shlomo A, Wawrowsky K, Toledano Y,
Tong Y, Kovacs K, Scheithauer B & Melmed S 2011 Lineage-specific
restraint of pituitary gonadotroph cell adenoma growth. PLoS ONE 6
e17924. (doi:10.1371/journal.pone.0017924)
Chesnokova V, Zhou C, Ben-Shlomo A, Zonis S, Tani Y, Ren SG & Melmed S
2013 Growth hormone is a cellular senescence target in pituitary and
nonpituitary cells. PNAS 110 E3331–E3339. (doi:10.1073/pnas.
1310589110)
Chien Y, Scuoppo C, Wang X, Fang X, Balgley B, Bolden JE, Premsrirut P,
Luo W, Chicas A, Lee CS et al. 2011 Control of the senescence-
associated secretory phenotype by NF-kB promotes senescence and
enhances chemosensitivity. Genes and Development 25 2125–2136.
(doi:10.1101/gad.17276711)
Ciccarelli A, Daly AF & Beckers A 2005 The epidemiology of prolactinomas.
Pituitary 8 3–6. (doi:10.1007/s11102-005-5079-0)
Collado M & Serrano M 2010 Senescence in tumours: evidence from mice
and humans. Nature Reviews. Cancer 10 51–57. (doi:10.1038/nrc2772)
Collado M, Gil J, Efeyan A, Guerra C, Schuhmacher AJ, Barradas M,
Benguria A, Zaballos A, Flores JM, Barbacid M et al. 2005 Tumour
biology: senescence in premalignant tumours. Nature 436 642.
(doi:10.1038/436642a)
Coppe JP, Patil CK, Rodier F, Sun Y, Munoz DP, Goldstein J, Nelson PS,
Desprez PY & Campisi J 2008 Senescence-associated secretory pheno-
types reveal cell-nonautonomous functions of oncogenic RAS and the
p53 tumor suppressor. PLoS Biology 6 2853–2868. (doi:10.1371/journal.
pbio.0060301)
Courtois-Cox S, Genther Williams SM, Reczek EE, Johnson BW,
McGillicuddy LT, Johannessen CM, Hollstein PE, MacCollin M &
Cichowski K 2006 A negative feedback signaling network underlies
oncogene-induced senescence. Cancer Cell 10 459–472. (doi:10.1016/
j.ccr.2006.10.003)
De Nicola AF, von Lawzewitsch I, Kaplan SE & Libertun C 1978 Biochemical
and ultrastructural studies on estrogen-induced pituitary tumors in
F344 rats. Journal of the National Cancer Institute 61 753–763.
(doi:10.1093/jnci/61.3.753)
De Paul A, Pons P, Aoki A & Torres A 1997 Different behavior of lactotroph
cell subpopulations in response to angiotensin II and thyrotrophin-
releasing hormone. Cellular and Molecular Neurobiology 17 245–258.
(doi:10.1023/A:1026322130243)
De Paul AL, Attademo AM, Caron RW, Soaje M, Torres AI, Jahn GA & Celis ME
2009 Neuropeptide glutamic–isoleucine (NEI) specifically
stimulates the secretory activity of gonadotrophs in primary cultures
of female rat pituitary cells. Peptides 30 2081–2087. (doi:10.1016/j.
peptides.2009.08.022)
Di Leonardo A, Linke SP, Clarkin K & Wahl GM 1994 DNA damage triggers
a prolonged p53-dependent G1 arrest and long-term induction of Cip1
in normal human fibroblasts. Genes and Development 8 2540–2551.
(doi:10.1101/gad.8.21.2540)
Di Micco R, Fumagalli M, Cicalese A, Piccinin S, Gasparini P, Luise C,
Schurra C, Garre M, Giovanni Nuciforo P, Bensimon A et al. 2006
Oncogene-induced senescence is a DNA damage response triggered by
DNA hyper-replication. Nature 444 638–642. (doi:10.1038/
nature05327)
Dimri GP, Lee X, Basile G, Acosta M, Scott G, Roskelley C, Medrano EE,
Linskens M, Rubelj I, Pereira-Smith O et al. 1995 A biomarker that
identifies senescent human cells in culture and in aging skin in vivo.
PNAS 92 9363–9367. (doi:10.1073/pnas.92.20.9363)
Dworakowska D, Wlodek E, Leontiou CA, Igreja S, Cakir M, Teng M,
Prodromou N, Goth MI, Grozinsky-Glasberg S, Gueorguiev M et al.
http://erc.endocrinology-journals.org q 2015 Society for EndocrinologyDOI: 10.1530/ERC-14-0333 Printed in Great Britain
2009 Activation of RAF/MEK/ERK and PI3K/AKT/mTOR pathways in
pituitary adenomas and their effects on downstream effectors.
Endocrine-Related Cancer 16 1329–1338. (doi:10.1677/ERC-09-0101)
Florenes VA, Lu C, Bhattacharya N, Rak J, Sheehan C, Slingerland JM &
Kerbel RS 1999 Interleukin-6 dependent induction of the cyclin
dependent kinase inhibitor p21WAF1/CIP1 is lost during progression of
human malignant melanoma. Oncogene 18 1023–1032. (doi:10.1038/
sj.onc.1202382)
Freund A, Orjalo AV, Desprez PY & Campisi J 2010 Inflammatory networks
during cellular senescence: causes and consequences. Trends in
Molecular Medicine 16 238–246. (doi:10.1016/j.molmed.2010.03.003)
Fuertes M, Gerez J, Haedo M, Giacomini D, Paez-Pereda M, Labeur M,
Stalla GK & Arzt E 2010 Cytokines and genes in pituitary tumorigenesis:
RSUME role in cell biology. Frontiers of Hormone Research 38 1–6.
(doi:10.1159/000318488)
Gartel AL & Tyner AL 1999 Transcriptional regulation of the p21(WAF1/-
CIP1) gene. Experimental Cell Research 246 280–289. (doi:10.1006/excr.
1998.4319)
Giles A, Madec F, Friedrichsen S, Featherstone K, Chambers T, Harper CV,
Resch J, Brabant G & Davis JR 2010 Wnt signaling in estrogen-induced
lactotroph proliferation. Journal of Cell Science 124 540–547.
(doi:10.1242/jcs.078642)
Gonzalez M, Reyes R, Damas C, Alonso R & Bello AR 2008 Oestrogen
receptor a and b in female rat pituitary cells: an immunochemical
study. General and Comparative Endocrinology 155 857–868.
(doi:10.1016/j.ygcen.2007.10.007)
Haedo MR, Gerez J, Fuertes M, Giacomini D, Paez-Pereda M, Labeur M,
Renner U, Stalla GK & Arzt E 2009 Regulation of pituitary function by
cytokines. Hormone Research 72 266–274. (doi:10.1159/000245928)
Hanahan D & Weinberg RA 2000 The hallmarks of cancer. Cell 100 57–70.
(doi:10.1016/S0092-8674(00)81683-9)
Hayden MS & Ghosh S 2004 Signaling to NF-kB. Genes and Development 18
2195–2224. (doi:10.1101/gad.1228704)
Holst CR, Nuovo GJ, Esteller M, Chew K, Baylin SB, Herman JG & Tlsty TD
2003 Methylation of p16(INK4a) promoters occurs in vivo in
histologically normal human mammary epithelia. Cancer Research 63
1596–1601.
Hubackova S, Krejcikova K, Bartek J & Hodny Z 2012 IL1- and TGFb–Nox4
signaling, oxidative stress and DNA damage response are shared
features of replicative, oncogene-induced, and drug-induced paracrine
‘bystander senescence’. Aging 4 932–951.
Itahana K, Dimri G & Campisi J 2001 Regulation of cellular senescence by
p53. European Journal of Biochemistry 268 2784–2791. (doi:10.1046/
j.1432-1327.2001.02228.x)
Karga HJ, Alexander JM, Hedley-Whyte ET, Klibanski A & Jameson JL 1992
Ras mutations in human pituitary tumors. Journal of Clinical Endo-
crinology and Metabolism 74 914–919. (doi:10.1210/jc.74.4.914)
Knudsen KE, Booth D, Naderi S, Sever-Chroneos Z, Fribourg AF, Hunton IC,
Feramisco JR, Wang JY & Knudsen ES 2000 RB-dependent S-phase
response to DNA damage. Molecular and Cellular Biology 20 7751–7763.
(doi:10.1128/MCB.20.20.7751-7763.2000)
Kuilman T, Michaloglou C, Vredeveld LC, Douma S, van Doorn R, Desmet CJ,
Aarden LA, Mooi WJ & Peeper DS 2008 Oncogene-induced senescence
relayed by an interleukin-dependent inflammatory network. Cell 133
1019–1031. (doi:10.1016/j.cell.2008.03.039)
Kuilman T, Michaloglou C, Mooi WJ & Peeper DS 2010 The essence of
senescence. Genes and Development 24 2463–2479. (doi:10.1101/gad.
1971610)
Lee BY, Han JA, Im JS, Morrone A, Johung K, Goodwin EC, Kleijer WJ,
DiMaio D & Hwang ES 2006 Senescence-associated b-galactosidase is
lysosomal b-galactosidase. Aging Cell 5 187–195. (doi:10.1111/
j.1474-9726.2006.00199.x)
Lee S, Jeong SY, Lim WC, Kim S, Park YY, Sun X, Youle RJ & Cho H 2007
Mitochondrial fission and fusion mediators, hFis1 and OPA1, modulate
cellular senescence. Journal of Biological Chemistry 282 22977–22983.
(doi:10.1074/jbc.M700679200)
Published by Bioscientifica Ltd.
Downloaded from Bioscientifica.com at 04/06/2022 11:13:47AMvia free access

En
do
crin
e-R
ela
ted
Can
cer
Research M E Sabatino et al. Cellular senescence inpituitary tumors
22 :3 316
Levy A 2002 Physiological implications of pituitary trophic activity.
Journal of Endocrinology 174 147–155. (doi:10.1677/joe.0.1740147)
Liu W, Konduri SD, Bansal S, Nayak BK, Rajasekaran SA, Karuppayil SM,
Rajasekaran AK & Das GM 2006 Estrogen receptor-a binds p53 tumor
suppressor protein directly and represses its function. Journal of
Biological Chemistry 281 9837–9840. (doi:10.1074/jbc.C600001200)
Lowe SW, Cepero E & Evan G 2004 Intrinsic tumour suppression. Nature
432 307–315. (doi:10.1038/nature03098)
Luo Y, Hurwitz J & Massague J 1995 Cell-cycle inhibition by independent
CDK and PCNA binding domains in p21Cip1. Nature 375 159–161.
(doi:10.1038/375159a0)
Maiza JC & Caron P 2009 Pituitary carcinomas and aggressive adenomas:
an overview and new therapeutic options. Annales d’Endocrinologie
70 (Suppl 1) S12–S19. (doi:10.1016/S0003-4266(09)72471-0)
Marcotte R, Lacelle C & Wang E 2004 Senescent fibroblasts resist apoptosis
by downregulating caspase-3. Mechanisms of Ageing and Development
125 777–783. (doi:10.1016/j.mad.2004.07.007)
McKay MM & Morrison DK 2007 Integrating signals from RTKs to
ERK/MAPK. Oncogene 26 3113–3121. (doi:10.1038/sj.onc.1210394)
McNicol AM & Carbajo-Perez E 1999 Aspects of anterior pituitary
growth, with special reference to corticotrophs. Pituitary 1 257–268.
(doi:10.1023/A:1009950308561)
Melmed S 2003 Mechanisms for pituitary tumorigenesis: the plastic
pituitary. Journal of Clinical Investigation 112 1603–1618. (doi:10.1172/
JCI20401)
Michaloglou C, Vredeveld LC, Soengas MS, Denoyelle C, Kuilman T,
van der Horst CM, Majoor DM, Shay JW, Mooi WJ & Peeper DS 2005
BRAFE600-associated senescence-like cell cycle arrest of human naevi.
Nature 436 720–724. (doi:10.1038/nature03890)
Mitchner NA, Garlick C & Ben-Jonathan N 1998 Cellular distribution and
gene regulation of estrogen receptors a and b in the rat pituitary gland.
Endocrinology 139 3976–3983. (doi:10.1210/endo.139.9.6181)
Moiseeva O, Bourdeau V, Roux A, Deschenes-Simard X & Ferbeyre G 2009
Mitochondrial dysfunction contributes to oncogene-induced senes-
cence. Molecular and Cellular Biology 29 4495–4507. (doi:10.1128/MCB.
01868-08)
Molinari AM, Bontempo P, Schiavone EM, Tortora V, Verdicchio MA,
Napolitano M, Nola E, Moncharmont B, Medici N, Nigro V et al. 2000
Estradiol induces functional inactivation of p53 by intracellular
redistribution. Cancer Research 60 2594–2597.
Mooi WJ 2009 Oncogene-induced cellular senescence: causal factor in
the growth arrest of pituitary microadenomas? Hormone Research
71 (Suppl 2) 78–81. (doi:10.1159/000192442)
Mooi WJ & Peeper DS 2006 Oncogene-induced cell senescence – halting on
the road to cancer. New England Journal of Medicine 355 1037–1046.
(doi:10.1056/NEJMra062285)
Mukdsi JH, De Paul AL, Munoz S, Aoki A & Torres AI 2004 Immunoloca-
lization of Pit-1 in gonadotroph nuclei is indicative of the transdiffer-
entiation of gonadotroph to lactotroph cells in prolactinomas induced
by estrogen. Histochemistry and Cell Biology 121 453–462. (doi:10.1007/
s00418-004-0661-5)
Mukdsi JH, De Paul AL, Petiti JP, Gutierrez S, Aoki A & Torres AI 2006
Pattern of FGF-2 isoform expression correlated with its biological action
in experimental prolactinomas. Acta Neuropathologica 112 491–501.
(doi:10.1007/s00401-006-0101-9)
Nishihara E, Nagayama Y, Inoue S, Hiroi H, Muramatsu M, Yamashita S &
Koji T 2000 Ontogenetic changes in the expression of estrogen receptor
a and b in rat pituitary gland detected by immunohistochemistry.
Endocrinology 141 615–620. (doi:10.1210/endo.141.2.7330)
Noda A, Ning Y, Venable SF, Pereira-Smith OM & Smith JR 1994 Cloning of
senescent cell-derived inhibitors of DNA synthesis using an expression
screen. Experimental Cell Research 211 90–98. (doi:10.1006/excr.1994.
1063)
Nolan LA & Levy A 2009 The trophic effects of oestrogen on male rat
anterior pituitary lactotrophs. Journal of Neuroendocrinology 21 457–464.
(doi:10.1111/j.1365-2826.2009.01864.x)
http://erc.endocrinology-journals.org q 2015 Society for EndocrinologyDOI: 10.1530/ERC-14-0333 Printed in Great Britain
Ogryzko VV, Wong P & Howard BH 1997 WAF1 retards S-phase progression
primarily by inhibition of cyclin-dependent kinases. Molecular and
Cellular Biology 17 4877–4882.
Palmeri CM, Petiti JP, Sosa Ldel V, Gutierrez S, De Paul AL, Mukdsi JH &
Torres AI 2009 Bromocriptine induces parapoptosis as the main type of
cell death responsible for experimental pituitary tumor shrinkage.
Toxicology and Applied Pharmacology 240 55–65. (doi:10.1016/j.taap.
2009.07.002)
Pedeux R, Al-Irani N, Marteau C, Pellicier F, Branche R, Ozturk M, Franchi J
& Dore JF 1998 Thymidine dinucleotides induce S phase cell cycle arrest
in addition to increased melanogenesis in human melanocytes.
Journal of Investigative Dermatology 111 472–477. (doi:10.1046/j.1523-
1747.1998.00324.x)
Petiti JP, Gutierrez S, De Paul AL, Andreoli V, Palmeri CM, Sosa Ldel V,
Bocco JL & Torres AI 2010 GH3B6 pituitary tumor cell proliferation
is mediated by PKCa and PKC3 via ERK 1/2-dependent pathway.
Cellular Physiology and Biochemistry 26 135–146. (doi:10.1159/
000320519)
Petiti JP, Sosa Ldel V, Sabatino ME, Vaca AM, Gutierrez S, De Paul AL &
Torres AI 2015 Involvement of MEK/ERK1/2 and PI3K/Akt pathways
in the refractory behavior of GH3B6 pituitary tumor cells to the
inhibitory effect of TGFb1. Endocrinology 156 534–547. (doi:10.1210/
en.2014-1070)
Pikarsky E & Ben-Neriah Y 2006 NF-kB inhibition: a double-edged sword in
cancer? European Journal of Cancer 42 779–784. (doi:10.1016/j.ejca.
2006.01.011)
Pluquet O & Hainaut P 2001 Genotoxic and non-genotoxic pathways of p53
induction. Cancer Letters 174 1–15. (doi:10.1016/S0304-3835(01)00698-X)
Prieur A & Peeper DS 2008 Cellular senescence in vivo: a barrier to
tumorigenesis. Current Opinion in Cell Biology 20 150–155. (doi:10.1016/
j.ceb.2008.01.007)
Roberts PJ & Der CJ 2007 Targeting the Raf–MEK–ERK mitogen-activated
protein kinase cascade for the treatment of cancer. Oncogene 26
3291–3310. (doi:10.1038/sj.onc.1210422)
Rodier F, Campisi J & Bhaumik D 2007 Two faces of p53: aging and
tumor suppression. Nucleic Acids Research 35 7475–7484. (doi:10.1093/
nar/gkm744)
Roninson IB 2002 Oncogenic functions of tumour suppressor
p21(Waf1/Cip1/Sdi1): association with cell senescence and tumour-
promoting activities of stromal fibroblasts. Cancer Letters 179 1–14.
(doi:10.1016/S0304-3835(01)00847-3)
Sabatino ME, Sosa Ldel V, Petiti JP, Mukdsi JH, Mascanfroni ID, Pellizas CG,
Gutierrez S, Torres AI & De Paul AL 2013 Functional Toll-like receptor 4
expressed in lactotrophs mediates LPS-induced proliferation in
experimental pituitary hyperplasia. Experimental Cell Research 319
3020–3034. (doi:10.1016/j.yexcr.2013.08.012)
Sadoul JL, Thyss A & Freychet P 1992 Invasive mixed growth hormone/
prolactin secreting pituitary tumour: complete shrinking by octreotide
and bromocriptine, and lack of tumour growth relapse 20 months after
octreotide withdrawal. Acta Endocrinologica 126 179–183. (doi:10.1530/
acta.0.1260179)
Salminen A, Kauppinen A & Kaarniranta K 2012 Emerging role of NF-kB
signaling in the induction of senescence-associated secretory
phenotype (SASP). Cellular Signalling 24 835–845. (doi:10.1016/j.cellsig.
2011.12.006)
Sarkar DK 2006 Genesis of prolactinomas: studies using estrogen-treated
animals. Frontiers of Hormone Research 35 32–49. (doi:10.1159/
000094307)
Serrano M & Blasco MA 2001 Putting the stress on senescence.
Current Opinion in Cell Biology 13 748–753. (doi:10.1016/S0955-0674
(00)00278-7)
Serrano M, Lin AW, McCurrach ME, Beach D & Lowe SW 1997 Oncogenic
ras provokes premature cell senescence associated with accumulation
of p53 and p16INK4a. Cell 88 593–602. (doi:10.1016/S0092-8674
(00)81902-9)
Published by Bioscientifica Ltd.
Downloaded from Bioscientifica.com at 04/06/2022 11:13:47AMvia free access

En
do
crin
e-R
ela
ted
Can
cer
Research M E Sabatino et al. Cellular senescence inpituitary tumors
22 :3 317
Spady TJ, McComb RD & Shull JD 1999 Estrogen action in the regulation of
cell proliferation, cell survival, and tumorigenesis in the rat anterior
pituitary gland. Endocrine 11 217–233. (doi:10.1385/ENDO:11:3:217)
Sugawara A, Yen PM, Darling DS & Chin WW 1993 Characterization and
tissue expression of multiple triiodothyronine receptor–auxiliary
proteins and their relationship to the retinoid X-receptors.
Endocrinology 133 965–971. (doi:10.1210/endo.133.3.8396023)
Wajapeyee N, Serra RW, Zhu X, Mahalingam M & Green MR 2008
Oncogenic BRAF induces senescence and apoptosis through
pathways mediated by the secreted protein IGFBP7. Cell 132 363–374.
(doi:10.1016/j.cell.2007.12.032)
Weigel NL 1996 Steroid hormone receptors and their regulation by
phosphorylation. Biochemical Journal 319 657–667.
http://erc.endocrinology-journals.org q 2015 Society for EndocrinologyDOI: 10.1530/ERC-14-0333 Printed in Great Britain
Wiklund J, Wertz N & Gorski J 1981 A comparison of estrogen effects
on uterine and pituitary growth and prolactin synthesis in F344
and Holtzman rats. Endocrinology 109 1700–1707. (doi:10.1210/
endo-109-5-1700)
Yang G, Rosen DG, Zhang Z, Bast RC Jr, Mills GB, Colacino JA,
Mercado-Uribe I & Liu J 2006 The chemokine growth-regulated
oncogene 1 (Gro-1) links RAS signaling to the senescence of stromal
fibroblasts and ovarian tumorigenesis. PNAS 103 16472–16477.
(doi:10.1073/pnas.0605752103)
Young AR & Narita M 2009 SASP reflects senescence. EMBO Reports 10
228–230. (doi:10.1038/embor.2009.22)
Zeng YX & el-Deiry WS 1996 Regulation of p21WAF1/CIP1 expression by
p53-independent pathways. Oncogene 12 1557–1564.
Received in final form 13 March 2015Accepted 19 March 2015Made available online as an Accepted Preprint19 March 2015
Published by Bioscientifica Ltd.
Downloaded from Bioscientifica.com at 04/06/2022 11:13:47AMvia free access