Embed Size (px)
Citation preview

_______________________
The capital Market,Bank of Israel Insurance and
Research Department Savings Authority
Monitoring Costs of Public Debt:1
Evidence from a Natural Experiment in Israel
Itay Kedmi* and Guy Lakan**
Discussion Paper 2021.18
October 2021
Bank of Israel - http://www.boi.org.il 1 This paper does not necessarily reflect the views of the Bank of Israel and the Capital
Market, Insurance and Savings Authority. We would like to thank Dan Amiram for his
discussion of this paper. We also thank Moshe Bareket, Beeri Caspi, Eugene Kandel, Roy
Stein, Yishay Yafeh, and participants at the Bank of Israel Research Department seminar
for their helpful comments. All errors are our own.
* Research Department, Bank of Israel - Email: [email protected]
** The Capital Market, Insurance and Savings Authority and the Hebrew University.
Email: [email protected]
Any views expressed in the Discussion Paper Series are those of the authors
and do not necessarily reflect those of the Bank of Israel
91007 םשליירו 780 דת" אלרישקבנ ר,חק המ תיבחט
Research Department, Bank of Israel. POB 780, 91007 Jerusalem, Israel

Monitoring Costs of Public Debt:
Evidence from a Natural Experiment in Israel
Itay Kedmi and Guy Lakan
Abstract
The incentive for creditors to monitor borrowers is influenced, in part, by the extent to
which the creditor is concentrated in a specific debt, a factor underscored by the
differences between the public debt market and the private debt market. In this study, we
examine how the investment decisions made by institutional investors were influenced
by the implementation of Hodak Committee recommendations. This committee imposed
substantial monitoring costs in the public debt market, costs that are borne exclusively
by institutional investors. After the recommendations entered into force, the institutional
investors redirected their investments to private loans at the expense of public bonds.
Using the Difference-in-Differences methodology, we find that the price difference
between the two debt instruments diminished significantly. Actually, those findings
suggest that following the Hodak Committee, the institutional investors changed their
investment preferences in corporate debt.
יקונצרנ ובבח וסדייםופים המהג לעה שפות ההשקהעד ק עלודח ועדת פעותהש
א לקןוגי יקדמ תיאי
ירתקצ
תויוזיכרמ תר, יהןיב,עיםפ מוש והולה וףהג לע (Monitoring) ורטינעבצ לבובח עיםיק המש ימריצת
ןיבל ירסחה ובהח וקשןיב מיםייהק ליםהבדב חדדמתה יבטה,יפיפצס ובחב עיםיהמשק פים והג
ועפ הוש ייםסד והמ פיםוהג לש עההשקהתוטלהח כיצד ניםחוב ונא זה חקרמב טי. פרהבוהח וקש
תועהשקב ות יתועמשמ הובקר וחקיפ ותיולע הליטה וז דהעו ק".דחו" עדתו ותהמלצ ישוםימ
םיי וסדהמ יםפוגה,ןפ וקלת ותהמלצה סת ינכ חרלא ני.ונצרקה "חאגה יקפ בא ייםד וסהמ פיםוהג
יר.סחה יננצר ו הק "חאגה יקפא ןוחשב לע ותי פרטה תוואולהה יקפאל יהםותעהשק תא ונפה
בוהח יירמכש ינש ןיב רים ימח ה ערפ יכ איםמוצ ונא פרשים,ה-ירש פה יתוגלוודתמ ותעבאמצ
תועקבביכ ים ידעמולא איםממצ עשה,למ עדה.ווה ותצלהמ ישוםי חראל הקובמןפובא צםמצטמ
.ינונצרוב קח ם ב להש העקההש תופעדה ו אתניים שי וסדמה םיפוהג ודקח עדתו ותהמלצ ישוםי

Monitoring Costs of Public Debt:
Evidence from a Natural Experiment in Israel *
Itay Kedmi† Guy Lakan‡
October 2021
Abstract
The incentive for creditors to monitor borrowers is influenced, in part, by the extent to
which the creditor is concentrated in a specific debt, a factor underscored by the differences
between the public debt market and the private debt market. In this study, we examine how
the investment decisions made by institutional investors were influenced by the implementation
of Hodak Committee recommendations. This committee imposed substantial monitoring costs
in the public debt market, costs that are borne exclusively by institutional investors. After the
recommendations entered into force, the institutional investors redirected their investments to
private loans at the expense of public bonds. Using the Difference-in-Differences methodology,
we find that the price difference between the two debt instruments diminished significantly.
Actually, those findings suggest that following the Hodak Committee, the institutional investors
changed their investment preferences in corporate debt.
Keywords: Institutional Investors, Corporate Debt, Monitoring Costs, Alignment of Interests
JEL Classification code: G12, G23, G28 * This paper does not necessarily reflect the views of the Bank of Israel and the Capital Market, Insurance and
Savings Authority. We would like to thank Dan Amiram for his discussion of this paper. We also thank Moshe
Bareket, Beeri Caspi, Eugene Kandel, Roy Stein, Yishay Yafeh, and participants at the Bank of Israel Research
Department seminar for their helpful comments. All errors are our own. †The Bank of Israel, Research Department. Email: [email protected]. ‡The Capital Market, Insurance and Savings Authority and the Hebrew University. Email: [email protected].
1

1 Introduction
When do creditors have an incentive to monitor borrowers? This question has been widely investi-
gated, and even though it seems to be a naive question – the literature suggests complex answers
that depend on the characteristics of the lenders and borrowers, and the type of debt instrument.
In trying to answer this question we should start by describing the different entities that play a role
in the different debt markets that we investigate, as well as the setup which we used to analyze the
different factors that may affect the incentives of these creditors to carry out monitoring.
In this paper, we study the effect of a regulation which obligated the institutional investors
(pension funds, provident funds and life insurance) in Israel to perform monitoring when investing
in public corporate bonds – this regulation applies only to this type of investor, while other investors
(mainly mutual funds) don’t have to perform any monitoring acts when investing in the public
corporate bonds market. In addition, the regulation applies only on one type of debt instrument –
public corporate bonds, while there is no obligation to perform monitoring when investing in private
loans.
When trying to analyze the factors that may influence the decision of institutional investors to
perform monitoring on their investments, it is important to mention the theoretical frameworks as
well as the considerable empirical evidence suggested by the academic literature. Shleifer and Vishny
(1986), Kahn and Winton (1998) and Maug (1998) suggest theoretical models that shed a light on
the decision-making process of institutional investors when deciding whether to perform a costly
monitoring activity or simply trade. There is empirical evidence for the benefits of institutional
ownership on the firm, which is caused by the monitoring activity of the institutional investors
(Bushee 1998; Hartzell and Starks 2003; Almazan, Hartzell, and Starks 2005). There are also
studies that found that institutional investors decide to sell their holdings when they are dissatisfied
with corporate performance (Parrino, Sias, and Starks 2003). According to Chen, Harford, and Li
(2007), when monitoring benefits exceed costs, institutional investors will monitor rather than trade;
and their monitoring activities offer them informational advantages that they can use to adjust their
portfolios over time.
When focusing on debt investment, it is important to note another aspect that might affect
the decision of whether to perform monitoring or not–the level of concentration of investors in
2

the debt instrument. The academic literature contains a great deal of evidence showing that the
concentration of the composition of debt investors increases their incentive to monitor that debt
(Diamond 1984; Fama 1985; R. G. Rajan 1992; Focarelli, Pozzolo, and Casolaro 2008). It would
therefore be expected to find considerable variance between the level of private debt monitoring
which is generally characterized by a small number of investors; and public debt which is generally
much less concentrated. The fact that the regulation obligated institutional investors to bear the
monitoring costs for their investments in public debt (which is decentralized) could cause the other
investors in the debt to act as ”free riders”, to benefit from the institutional investor’s monitoring
activity without bearing any of the costs (Grossman and Hart 1980; Kim and Walker 1984; Baumol
2004).
As mentioned above, the regulation applies only to public corporate bonds and not to private
loans. In examining the substitutability between investments in public debt and investments in pri-
vate debt, we must address the structural differences between these two debt instruments. Leftwich
(1981) found evidence that costs incurred at the time of renegotiation in the event of insolvency, or
in case of a violation of the covenants, will be lower for private debt than for public debt. Kahan
and Tuckman (1993) show how public debt is differentiated from private debt in the number of
covenants it contains and how stringent they are (stringency was defined as the difference between
the actual financial ratio and that defined in the covenant clause). Their principal conclusion is that
the conflict of interest is more limited in private debt than in public debt.
In addition to the obligation of monitoring, the regulation has another important impact on the
public corporate bond market – improved product quality. The regulation obligated institutional
investors to invest only in public corporate bonds that contain financial covenants and contractual
undertakings, as generally accepted around the world, and detailed the sanctions to be applied if
they are violated (higher rates of interest, partial or full repayment of the bonds).1 The academic
literature on financial contracts emphasizes the important role of covenants in moderating the inher-
ent conflict of interest between a company’s bondholders and its stockholders (Jensen and Meckling
1976; Myers 1977). Smith Jr and Warner (1979) described the theoretical effect of these covenants,
which they called the Costly Contracting Hypothesis (CCH), and discuss the fact that financial
covenants entail substantial costs.
1See extension in Section 2.
3

However, despite these costs, financial covenants could increase a company’s value when the
debt is issued and reduce the yield spreads at which the debt series are traded. Empirical evidence of
this phenomenon can be found in a study by Bradley and Roberts (2003). As R. Rajan and Winton
(1995) show in their theoretical research, there is a strong positive relation between the presence
of covenants in the loan’s contract and the incentive to perform monitoring by the institutional
investor. Therefore, another significant aspect of the Hodak Committee (”HC”) recommendations is
the obligation imposed on the institutional investors to monitor the public debt in their possession
regularly, which involves major costs.
The fact that these monitoring efforts include significant costs raises an important question
regarding the efficiency of this kind of monitoring of investments on the public corporate bond
market. There is theoretical literature that shows that having junior lenders monitor the borrower
is not as effective as a senior lender carrying out monitoring because of distorted incentives (Diamond
1991; Diamond 1993; Repullo and Suarez 1998; Berglof and Von Thadden 1994). Seniority allows
the monitoring senior lender to extract the full return from his monitoring activities (Park 2000).
In our research, the public bonds are considered as junior debt, compared to private loans which are
considered as senior debt.
Therefore, we can develop our main research hypothesis. The institutional inventors have no
incentive to monitor public corporate debt, so we would expect to find an increase in the demand
for private loans at the expense of the demand for public corporate bonds, after the implementation
of the regulation. As a result, the difference in the yield spreads between these two types of debt
instruments will decrease, due to a reduction in the yield spreads of the private loans which is caused
by the growing demand among institutional investors.
The empirical analysis indicates some key results. We find that after the implementation of
this regulation there was a statistically and economically significant decrease in the yield spread
differences between public corporate debt and private loans. We attribute this result to institutional
investors’ growing demand for private loans as their demand for public bonds diminished, a result
that is reinforced in light of the fact that following the implementation of the regulation, institutional
investors in Israel have dramatically diverted their investments in corporate debt from public bonds
towards private loans, in what was a unique anomaly on a global scale.2
2See Section 4 in the Bank of Israel Annual Report for 2018 (link).
4

This paper contributes to the exiting literature. There is an extensive literature that suggests
theoretical frameworks that deal with the decisions of investors when choosing to invest in each
type of debt, but the empirical evidence is limited. We contribute to the literature by supporting
empirical evidence for the lack of incentive to perform monitoring in the decentralized public debt
market. We show it by demonstrating how institutional investors in Israel redirected their investment
to the private debt market as a result of the obligation for monitoring only one kind of creditor in
decentralized debt market.
The rest of this paper is organized as follows: Section 2 describes the HC recommendations and
provides descriptive statistics of the quality of the public bonds issued in the period prior to and
after the Committee’s recommendations; Section 3 includes a description of the data sets used for the
paper; Section 4 describes the identification strategy; Section 5 describes the empirical estimation
strategies and the results (including robustness checks); Section 6 concludes.
2 The Regulatory Committee (”Hodak”)
In September 2010, the final recommendations of the Hodak Committee (a public committee on
behalf of the Ministry of Finance, and chaired by David Hodak) were published. The Committee was
established following the growth of the non-government bond market and the GFC, which turned
the spotlight on significant weaknesses in the corporate bond investment process by institutional
investors. As a result of the financial crisis, many firms were unable to service their liabilities, and
the ensuing wave of debt restructuring proceedings demonstrated the weaknesses in the public bond
market: most of the issuances, both before and after the crisis, were not backed by collateral and
lacked adequate contractual undertakings or financial covenants. The Committee discussed the need
for setting professional standards and tools to be used by the institutional investors in reviewing the
quality of the borrowers in the public debt market.
The Committee’s recommendations focused on non-government bonds and they were not applied
to alternative investment classes (e.g., private loans and investments abroad). The Committee’s
recommendations centered on three main areas: (1) establishing a formal process for each bond
series before deciding whether to purchase these bonds (“debt analysis”); (2) determining the type
of information that institutional investors will receive; and (3) improving product quality. The
5

Committee’s recommendations regarding improved product quality addressed financial covenants
and contractual undertakings, as generally accepted around the world, and detailed the sanctions
to be applied if they are violated (higher rates of interest, partial or full repayment of the bonds).3
The Committee’s recommendations included a closed, structured list of critical parameters re-
quired for debt analysis, which include: characteristics of the issuer, including sector, the issuer’s
strategy and aspects of its corporate governance; characteristics of the bonds, their terms, designa-
tion of the issue proceeds and the reasonability of the debt repayment, also in the event of insolvency,
considerations such as whether liens are in place, whether there is an undertaking not to create liens,
as well as whether contractual undertakings and financial covenants are in place; and an assessment
of the bond’s risk profile (return versus risk).
Likewise, the proposals to improve product quality can similarly be divided into four categories:
(1) a requirement for financial covenants; (2) restrictions regarding rating and dividends distribution;
(3) a requirement for liens and collateral; and (4) other contractual undertakings, such as change of
control, cross-insolvency, merger / sale of assets, and fundamental breach of the bond conditions.
When analyzing the implementation of the recommendations, it was found that the use of
financial covenants, restrictions on the creation of additional debt (or an expansion of debt series)
and limitations on the distribution of a dividend, increased during the years following the HC
recommendations (Figure 1). Furthermore, there was a marked, steady increase in the share of the
new bond series that include an interest compensation in the event of a financial covenants violation
or a rating downgrade (Figure 2), which was addressed in detail in the HC recommendations. It
was also found that following the implementation of the Committee’s recommendations, most of the
new bond series included a large number of contractual undertakings compared with bond series
that were issued prior to the implementation of the recommendations (Figure 3).4
3See for example: Bradley and Roberts (2015). 4These findings are consistent with a study published by the Tel Aviv Stock Exchange (“Three years of the
implementation of the Hodak Committee recommendations”, Nurit Dror) and a paper presented by Ana Brodesky
in the Bank of Israel Research Department Conference (“Competition and Structural Changes”, December 2020,
see link).
6

-----
■
■
■
-
Figure 1: Share of new bond series which include restrictions and financial covenants, 2007–2015
0%
10%
20%
30%
40%
50%
60%
70%
80%
90%
100%
2007 2008 2009 2010 2011 2012 2013 2014 2015
Restrictions on Additional Debt
Restrictions on Dividend Distribution
Financial Covenants
Figure 2: Share of new bond series which include interest compensationa , 2007–2015
0%
10%
20%
30%
40%
50%
60%
70%
80%
2007 2008 2009 2010 2011 2012 2013 2014 2015
Violation of Financial Covenants Rating Reduction
aFor a negative event, like financial covenants violation or rating reduction.
7

■ ■ ■ ■ ■
Figure 3: Distribution of new bond series by number of contractual undertakingsa , 2007–2015
0%
10%
20%
30%
40%
50%
60%
70%
80%
90%
100%
2007 2008 2009 2010 2011 2012 2013 2014 2015
0 1 2 3 4
aThose contractual undertakings include four aspects: cross-insolvency, change in activity / merger, control
change, and rating change/discontinuation.
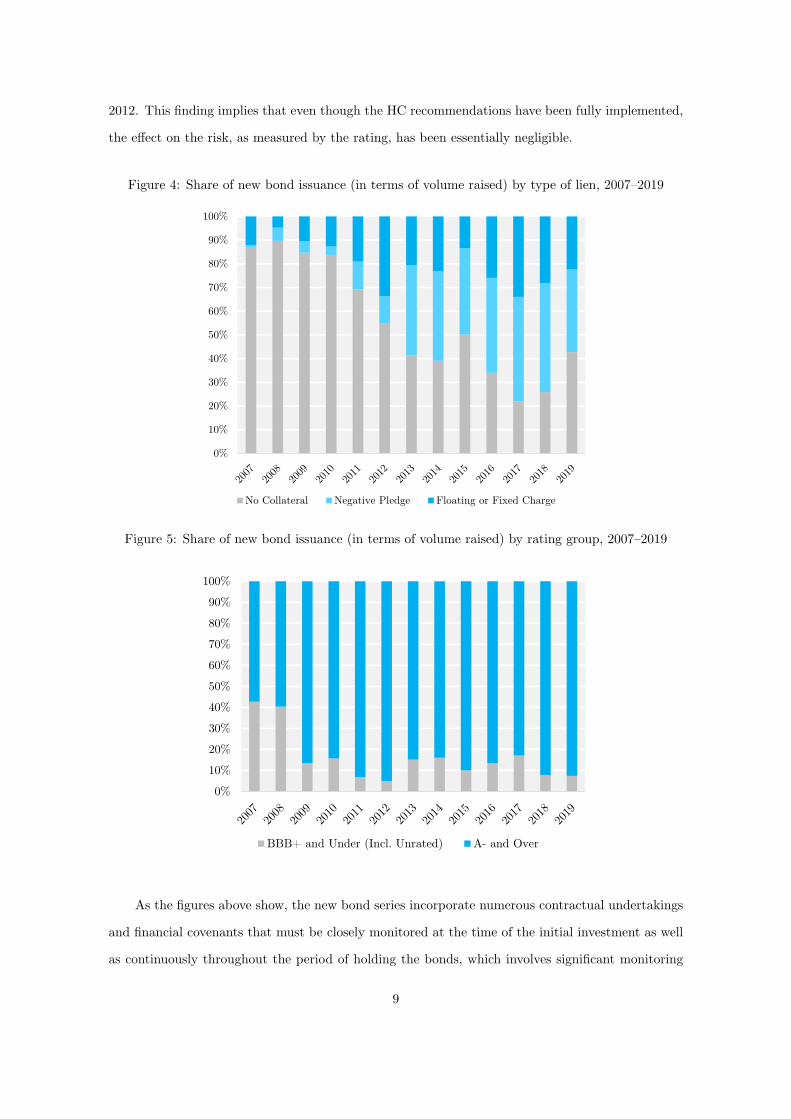
An analysis of additional contractual conditions present in the deeds of trust shows a steady
decrease in the proportion of bonds issued (in terms of volume of debt raised) that are not backed
by collateral or liens (Figure 4) from 2011 onward – from an average of 86 percent in the period
prior to implementation of the Committee’s recommendations to an average of 42 percent after
implementation of the recommendations. From 2013, most of the increase in terms of the volume
of debt raised is via bonds’ issuances, which include negative pledge, and in practice do not include
collateral but rather limitations imposed on the issuing company to create liens for other creditors.
An analysis of the share of bond issuance (in terms of volume of debt raised) by rating, shows
an increase, albeit insignificant, in the rating of the issued series in the two years following the
implementation of the Committee’s recommendations. Figure 5 divides the bond issuance into two
groups: series that were issued with a high rating (A- and higher), compared with series that were
issued with a low rating or without any rating; the figure shows that the improvement in the rating
of the issued bonds occurred mainly in the period 2009-2010, after the GFC. In 2011-2012, there
was a further but negligible improvement in the rating of the issued bonds. In subsequent years, the
relatively high quality of the issued bonds was maintained, although to a lesser degree than in 2011-
8
■ ■ ■
■ ■
2012. This finding implies that even though the HC recommendations have been fully implemented,
the effect on the risk, as measured by the rating, has been essentially negligible.
Figure 4: Share of new bond issuance (in terms of volume raised) by type of lien, 2007–2019
0%
10%
20%
30%
40%
50%
60%
70%
80%
90%
100%
No Collateral Negative Pledge Floating or Fixed Charge
Figure 5: Share of new bond issuance (in terms of volume raised) by rating group, 2007–2019
0%
10%
20%
30%
40%
50%
60%
70%
80%
90%
100%
BBB+ and Under (Incl. Unrated) A- and Over
As the figures above show, the new bond series incorporate numerous contractual undertakings
and financial covenants that must be closely monitored at the time of the initial investment as well
as continuously throughout the period of holding the bonds, which involves significant monitoring
9

. ---· - - _., .... .... ....
.... • .. .... .. ~.... '•---■
operations. These operations include control of the quality and value of the collateral, conducting a
quarterly review of compliance with financial covenants and violations of the contractual undertak-
ings during the bond’s life and preparing a written analysis on the date of the issuance and at least
once a year. Additionally, the institutional investor’s investment committee and board of directors
must receive ongoing reports from the middle office regarding irregularities. Furthermore, once a
year, and as necessary, the middle office reviews and updates the internal rating model and then
validates it. The costs to the institutional investors involved in these monitoring processes are con-
siderable and were not incurred prior to the implementation of the Committee’s recommendations.
Another phenomenon in the new bond series, which underscores the effect of the considerable
monitoring costs following HC, is the increase in the concentration among the institutional investors
in new bond issuance (almost doubled) following the Committee (Figure 6).5 This finding implies
that the institutional investors increased their stake in each issuance, in order to align the interests
between the monitoring efforts and their benefits from the corporate debt investments. In fact, it
supports the claim that HC caused changes in investments decisions made by institutional investors
due to the monitoring costs.
Figure 6: HHI levels among the institutional investors in new bond series issuance, 2009–2016
0.00
0.05
0.10
0.15
0.20
0.25
0.30
0.35
HHI
5In addition, we observe (in parallel) a significant decline in the market share of the institutional investors in
new bond issues following the implementation of HC. For instance, in the years 2009–2011 the average share is 27%,
and in the years 2012–2015 the average share is 13%.
10

3 Data
This study focuses on data of two types of debt instruments – (1) private loans; and (2) public corpo-
rate bonds. Both of these were impacted by the implementation of the HC recommendations. Public
bonds were directly affected by the recommendations due to the addition of financial covenants and
contractual undertakings to deeds of trust, as shown in Section 2, while loans probably were indi-
rectly affected through the shifting in demand by the institutional investors after the implementation
of the regulation.
Given that our main estimation strategy in this paper (see below) requires the use of two
homogeneous groups, only one of which was affected (or treated) by means of an exogenous shock,
in formulating the data set we rely on the fact that the Committee’s recommendations do not apply
to the expansion of existing bond series. The Committee’s recommendations were only applied to
new bond series issued from the fourth quarter of 2010 onward. That is, they do not apply to series
that were expanded. Consequently, in creating the data set for the public bonds, we used data for
new bond series that were issued from 2008 until the third quarter of 2010, and from the fourth
quarter of 2010 through 2013 we used bond series that had been expanded (based on the series issued
prior to the implementation of the Committee’s recommendations). We were therefore able to create
one group that was not affected (directly or indirectly) by the Committee’s recommendations.6
3.1 Private Loans Data
In this paper, we analyze data of 547 loans provided by institutional investors in the period 2008–2013.
The HC recommendations were implemented at the end of 2010 and we therefore analyze the credit
provided by the institutional investors over a three-year period before and after the regulations
entered into force. Notably, these data are not reported publicly and were received from the insti-
tutional investors by way of a report requested specifically for this study
Table 7 (Appendix A) describes the private loans data by year and sector. The average volume
of a loan in the entire period was NIS 74 million, with an average rating of A, and the average yield
6In bond series that were issued in the period prior to implementation of the Committee’s recommendations
(and were not affected by its conclusions) and were expanded after implementation of the recommendations, we
do not expect to find any effect since the Committee’s recommendations only apply to new bond series that were
issued later on.
11

spread was 3.6 percent.7 The table shows that from 2008 until 2013, the size of the loans provided by
the institutional investors increased, whereas in 2011 – immediately following the implementation of
the HC recommendations – there was a marked increase in the number of loans. At the same time,
the average spread of the loans dropped by 0.56 percentage points (56 basis points) even though no
distinct trend is noticeable in the average duration and average rating.
When examining the total volume of the loans by sector8 , the commerce and services sector is
prominent, accounting for 30 percent of the total volumes of loans. Other prominent sectors are the
real estate and energy (including oil and gas) sectors, where each of the accounting for 20 percent
of the total volume. The heterogeneity among the sectors with respect to average duration is also
marked.
3.2 Public Bonds Data
In this paper, we analyze data of 476 bond series that were issued on the Tel Aviv Stock Exchange in
the period 2008–2013. Table 8 (Appendix A) presents the data for the bond series that were issued,
by year and by sector. The table shows that the average volume of the issuance of the bond series
is NIS 221 million, higher than that of the average loan. The average spread is lower, compared
with the private loans (3 percent compared with 3.6 percent), even though the average duration is
slightly higher and the rating is the same.
3.3 Private Loans vs. Public Bonds
Table 1 compares the private loans and public bonds data, before and after the implementation
of the Committee’s recommendations. In the period prior to implementation of the Committee’s
recommendations, as one can see, the loans generally had a higher rating, a lower average duration
and higher spread, all with a high statistical significance.
In the period subsequent to the implementation of the Committee’s recommendations, the
average rating in both groups is similar: the rating for the loans was unchanged compared with
7The spread was calculated by subtracting the average yield derived from the zero curve estimation (link) from
the price of the loan (the interest rate determined at the date of the loan), according to the duration, index and
month in which the loan was provided. 8The number of loans multiplied by the average loan value for the sector.
12

11 __ _ _ 11 I • ■ ■
the prior period, while the rating for the bonds was one notch higher. Table 1 also shows that the
average duration of the loans increased but is not significantly different from the average duration of
the bonds; it is particularly noticeable that in the period after implementation of the Committee’s
recommendations, the average spread for the loans decreased substantially and it slightly differs
from the average spread in the bond series.
Figure 7 shows the sectoral distribution of the two groups (as a share of the total volume).
One particularly unusual sector in this comparison is the financial sector (banks and insurance)
which accounts for approximately 40 percent of the public debt, but in which the share of loans is
extremely low (almost negligible). Another noticeable sector is energy: whereas the proportion of
public debt issuance is low, the proportion of loans in this sector is high. The differences in the
other sectors are insignificant, and it is also worth noting that at the sectoral distribution, there is
no significant difference when comparing the periods prior to and after the implementation of the
recommendations.
Figure 7: Sectoral distribution of public bonds and private loans, 2008–2013, in percent
0%
5%
10%
15%
20%
25%
30%
35%
40%
45%
Holdings Gas, Oil &Energy
Commerce &Services
Real Estate Industry Other FinancialSectors
Public Bonds Private Loans
13

14
Table
1: Descriptive Statistics – Private
Loans Vs Public Bonds —
Pre
& Post
Private
Loans –
Pre
Public
Bonds –
Pre
Observations
Mean
Median
Min
Max
SD
Observations
Mean
Median
Min
Max
SD
Volume (K
of NIS)
95
77,400***
30,000
1,100
790,000
129,000
176
275,000
169,000
38,000
1,700,000
294,000
Spread
(%)
95
3.9***
3.7
-0.5
15.8
2.7
172
2.7
2.7
-3.6
8.8
2.1
Duration
95
3.3***
2.0
0.1
14.5
3.3
173
5.1
4.5
1.0
18.7
2.4
Rating
95
A***
A+
BB
AA+
2
notches
176
A-
A
BB
AA+
3
notches
Private
Loans –
Post
Public
Bonds –
Post
Observations
Mean
Median
Min
Max
SD
Observations
Mean
Median
Min
Max
SD
Volume (K
of NIS)
452
73,100***
45,000
2,400
940,000
102,000
336
192,000
105,000
3,500
1,530,000
240,000
Spread
(%)
452
3.5**
3.5
-0.5
10.5
1.3
304
3.3
2.6
0.1
15.3
2.0
Duration
452
4.3
3.8
0.1
11.1
2.8
304
4.4
4.1
0.8
10.6
1.8
Rating
452
A
A
BB
AAA
2
notches
336
A
A
BB
AAA
3
notches
***, **, *
indicate
that the average in
one group
is different than
the variable
in
the other
group
to
a degree that is
statistically
sig-
nificant at a
level
of 1%, 5%
and
10%, respectively,
based
on
t-test for equality
of average.
4 Identification Strategy
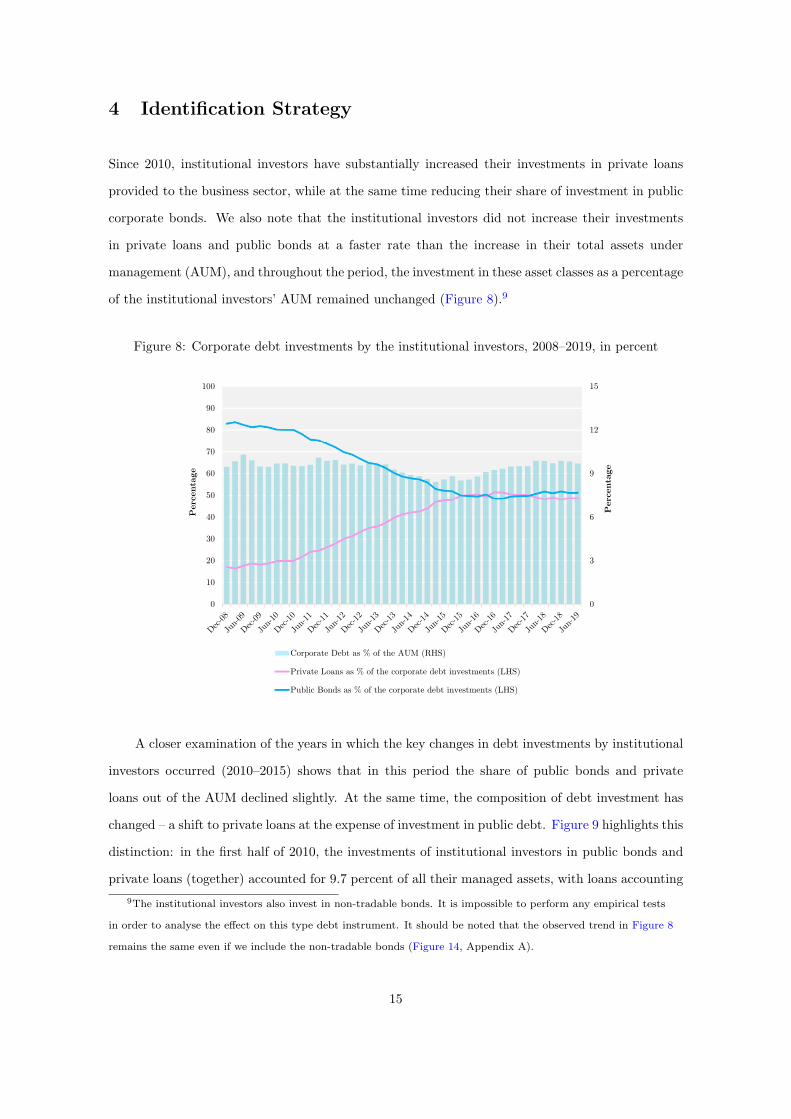
Since 2010, institutional investors have substantially increased their investments in private loans
provided to the business sector, while at the same time reducing their share of investment in public
corporate bonds. We also note that the institutional investors did not increase their investments
in private loans and public bonds at a faster rate than the increase in their total assets under
management (AUM), and throughout the period, the investment in these asset classes as a percentage
of the institutional investors’ AUM remained unchanged (Figure 8).9
Figure 8: Corporate debt investments by the institutional investors, 2008–2019, in percent
0
3
6
9
12
15
0
10
20
30
40
50
60
70
80
90
100
Percentage
Percentage
Corporate Debt as % of the AUM (RHS)
Private Loans as % of the corporate debt investments (LHS)
Public Bonds as % of the corporate debt investments (LHS)
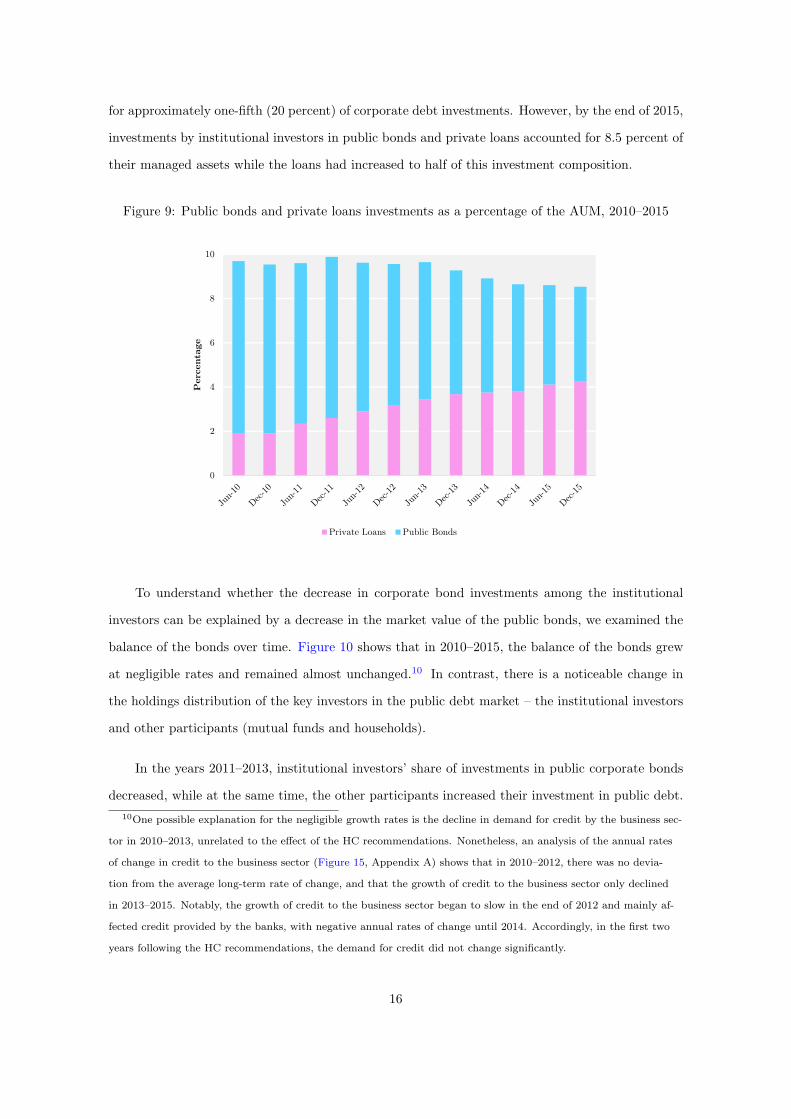
A closer examination of the years in which the key changes in debt investments by institutional
investors occurred (2010–2015) shows that in this period the share of public bonds and private
loans out of the AUM declined slightly. At the same time, the composition of debt investment has
changed – a shift to private loans at the expense of investment in public debt. Figure 9 highlights this
distinction: in the first half of 2010, the investments of institutional investors in public bonds and
private loans (together) accounted for 9.7 percent of all their managed assets, with loans accounting
9The institutional investors also invest in non-tradable bonds. It is impossible to perform any empirical tests
in order to analyse the effect on this type debt instrument. It should be noted that the observed trend in Figure 8
remains the same even if we include the non-tradable bonds (Figure 14, Appendix A).
15
■ ■
for approximately one-fifth (20 percent) of corporate debt investments. However, by the end of 2015,
investments by institutional investors in public bonds and private loans accounted for 8.5 percent of
their managed assets while the loans had increased to half of this investment composition.
Figure 9: Public bonds and private loans investments as a percentage of the AUM, 2010–2015
0
2
4
6
8
10
Percentage
Private Loans Public Bonds
To understand whether the decrease in corporate bond investments among the institutional
investors can be explained by a decrease in the market value of the public bonds, we examined the
balance of the bonds over time. Figure 10 shows that in 2010–2015, the balance of the bonds grew
at negligible rates and remained almost unchanged.10 In contrast, there is a noticeable change in
the holdings distribution of the key investors in the public debt market – the institutional investors
and other participants (mutual funds and households).
In the years 2011–2013, institutional investors’ share of investments in public corporate bonds
decreased, while at the same time, the other participants increased their investment in public debt.
10One possible explanation for the negligible growth rates is the decline in demand for credit by the business sec-
tor in 2010–2013, unrelated to the effect of the HC recommendations. Nonetheless, an analysis of the annual rates
of change in credit to the business sector (Figure 15, Appendix A) shows that in 2010–2012, there was no devia-
tion from the average long-term rate of change, and that the growth of credit to the business sector only declined
in 2013–2015. Notably, the growth of credit to the business sector began to slow in the end of 2012 and mainly af-
fected credit provided by the banks, with negative annual rates of change until 2014. Accordingly, in the first two
years following the HC recommendations, the demand for credit did not change significantly.
16

- - -- ... ------
From 2014, institutional investors maintained a steady share, but the other participants continued
to increase the share of their holdings in public bonds, in line with the increase in total issued
public bonds.11 This finding emphasizes that the institutional investors changed their preferences
regarding investments in the public debt market. Following a significant decrease in the share of
the investment in 2011– 2013, the institutional investors maintained a steady rate of investment in
public debt, despite the growth of the total market value after 2014 and despite the increase in their
AUM.
Figure 10: Balance of public corporate bondsa and distribution of the main investors, 2009–2019
0
50
100
150
200
250
300
350
30
35
40
45
50
55
60
65
70
Billion
s of
NIS
Pre
centa
ge
Market Value (RHS) Institutional Investors Other Participants
aIn terms of market value. Other Participants refers to mutual fund and households.
In order to identify whether we can interpret the phenomenon described above as evidence for
changes in the demand for the different instrument types, we could estimate the differences in yield
spreads between private loans and public bonds, in the period before and after the implementation
of the HC recommendations12 . We assume that if institutional investors changed their conduct after
11A possible argument is that in the period following the implementation of HC recommendations the public
bonds were underpriced, so the institutional investors could sell these bonds in the secondary market to less so-
phisticated investors. But, in a working paper of Graham, Michelson and Vieder (2021) there is no evidence for
underpricing (or rapid aggregate inflows to mutual funds) in the years following HC (see link). 12This difference is ostensibly the illiquidity premium between tradable and non-tradable debt instrument. But,
it should be noted that there are different characteristics between these two debt instruments (loans and bonds).
Thus, in this study we do not attribute the entire gap in the prices to the illiquidity premium.
17

implementation of the HC recommendations, such that the increase in the supply of loans they
provide was greater than the increase in the demand for loans by businesses, then the price of the
loans relative to public bonds would decline.
The main estimation issue is the fact that the regulation affected both the public bonds and
the private loans. When trying to address this problem it is important to mention that the HC
recommendations did not apply to the expansion of existing series but only to new bond series. In
that period, after the implementations of the HC recommendations, the rate of newly issued bond
series significantly dropped, and most issues were expansions of existing bond series (Figure 11).
This finding is therefore significant evidence of the market players’ preference for continuing, where
possible, to participate in the issuance of series that do not incorporate the conditions and regulations
set out in the Committee’s recommendations, in practice evading those recommendations. At a
certain point, the expansion of series becomes irrelevant (as their maturity approaches) and it can
be seen that from 2014, the share of the new series returns to the “normal” level
Figure 11: New series as a percentage of all public bond issues, 2009–2019, in percent
0
10
20
30
40
50
60
70
80
Percentage
Therefore, the implementation of the HC recommendations resulted in the creation of two
groups of public debt series – new series, which are subject to the Committee’s recommendations,
and expansions of existing bond series, to which the Committee’s recommendations do not apply.
In practice, the new bond series that were issued after implementation of the HC recommendations
18

are a separate group from the series that were in publicly issued prior to the publication of the rec-
ommendations (as well as from the bond series that were expanded later on), since they incorporate
financial covenants and contractual undertakings that were not present previously.
In other words, prior to publication of the Committee’s recommendations, there was one ho-
mogeneous group which split into two groups in the wake of implementation of the regulation: new
bond series and expansions of existing bond series. The empirical investigation in this paper is based
on the Committee’s recommendations not applying to the bond series that were expanded. We can
therefore estimate the difference in the cost of debt over time between a public debt instrument,
which should not be affected by the Committee – bond series that were issued prior to the Com-
mittee, and the series that were later expanded on the basis of those series13 – and a private debt
instrument, loans, which are likely to be affected, due to demand by the institutional investors being
redirected to this debt instrument as a result of the Committee’s recommendations.
5 Empirical Strategy and Results
5.1 Estimation of the yield spreads difference by OLS regression
For the purpose of the basic empirical strategy, we used an OLS regression in which the estimated
(dependent) variable is the yield spread of each debt instrument. The academic literature14 proposed
several econometric models for estimating yields (or spreads) for corporate bonds, which made use of
the characteristics of bonds, such as rating, duration and index. Additionally, characteristics such as
the sector in which the company operates and date of the measurement of the spread (as a variable
which controls macroeconomic characteristics) could also explain the variance in the bond spread.
The loan spread is relevant to the date of providing the loan and was calculated manually by
means of the difference between the interest rate quoted for the loan and the yield derived from a zero
13This data set allows us to create a control group which was not affected by HC. It should be noted that after
HC recommendations there was a change in the ratio of issuance of extended bond series (Figure 11), so in order to
avoid from the impacts of demand and supply, we use the price in the day in which the company announced that
it is going to issue extended bond series, before demand flows by investors. It is possible that in the wake of the
company announcement, the yield spreads will rise–because of the leverage increasing–but in some specifications we
control for the company’s leverage and basically we neutralize all the effects and remain with an untreated group. 14For example, see Elton et al. (2001), Campbell and Taksler (2003) and Gilchrist and Zakrajsek (2012).
19

15curve , adjusted to the month in which the loan was provided, the duration and linkage. The bond
yield spread on the date of issuance16 , according to the Bank of Israel’s automatic calculations, is the
difference between the yield of the bond series and the yield of the zero curve calculated according
to rating and index. The variable of interest is a dummy variable, which takes the value of 1 for
a private loan and 0 for a public bond. In practice, the coefficient of this variable estimates the
difference in the yield spreads between private loans and public bonds. In the regression, we control
for the sector, rating and time (the quarter in which the loan was provided/the bond was issued),
which are supposed to control the risk and time factors. Additionally, we control the characteristics
of the loan or bond series that was issued, which include amount (volume), time to maturity in
years, and a dummy variable for index. The estimated OLS regression is:
Yi,t = β0 + β1Loan + β2Sector + β3T ime + β4Rating + β5V olume (1)
+ β6Index + β7Maturity + �i,t
The results of the regression are presented in Table 2. Notably, due to the marked sectoral
difference between loans and bonds, primarily in the financial sector (banks and insurance) and in
the energy sector (see Figure 7), the results are presented in two ways: columns (1) through (3)
show the results for all sectors, and columns (4) through (6) show the results without the financial
and energy sectors.
Columns (1) and (4) in the regression estimate the difference in the yield spreads over the
entire period – without separating the periods before and after the HC. This estimation shows that
on average, the premium for a private loan is about 30 basis points (0.3 percentage points) higher
than for public bonds and has a high statistical significance, even in an estimation without the
excluded sectors. Columns (2) and (5) estimate the difference in the yield spreads in the years prior
to publication of the HC recommendations in which we can clearly see that the premium is positive
and on average is about 1.2 percentage points with a high statistical significance. Columns (3) and
(6) estimate the premium in the period after publication of the HC recommendations. As can be
seen, the premium is close to zero percentage points and has no statistical significance. Thus, it can
15The curve derived from Israel government bonds according to the paper by Ana Brodesky and Nadav Stein-
berg — ”Improving the Yield Curve Estimation Implemented at the Bank of Israel”. 16The yield spreads on the date of issuance serves as an estimation of the debt price of the requested by the in-
stitutional investors participating in the bond issuance.
20

t t
17be said that there is no significant difference in the yield spreads in those years.
We can therefore conclude that following the implementation of the Committee’s recommen-
dations, the yield spreads required by the institutional investors when providing loans decreased
substantially and there is no significant difference between the yield spread of a public bond to the
yield spread of a private loan. This is illustrated in Figure 12, which presents the estimation from
the regression in the period prior to and after publication of the Committee’s recommendations
as well as the confidence interval of the estimation (at a level of 5 percent). This result confirms
that following the implementation of the Committee’s recommendations, the estimated difference is
statistically significantly lower than the difference estimated prior to the recommendations.
Figure 12: The estimated yield spread difference and its confidence intervala , in percent
1.14
0.11
1.25
0.02
-0.5
0.0
0.5
1.0
1.5
2.0
2.5
Pre Post Pre Post
All Sectors Without the Energy& Financial Sectors
Per
centa
ge
aIn level of 5%.
17Notably, in robustness tests, we used all the new series that were issued in the sample period (instead of the
new series prior to publication of the Committee’s recommendations and the series that were expanded after the
recommendations) and the results we received are not significantly different from the results we obtained in this
estimation, and in fact they increase the robustness of our results.
21

Table 2: OLS Regression
All Sectors No Energy & Financial Sectors
(1) (2) (3) (4) (5) (6)
All Period
(2008 - 2013) Pre Post
All Period
(2008 - 2013) Pre Post
Loan 0.281**
(0.125)
1.137***
(0.400)
0.111
(0.117)
0.290**
(0.140)
1.254**
(0.506)
0.021
(0.128)
Time to Maturity -0.041*
(0.022)
-0.119**
(0.055)
0.029
(0.023)
-0.069**
(0.032)
-0.221**
(0.101)
0.010
(0.031)
Volume -0.255***
(0.048)
-0.138
(0.123)
-0.218***
(0.048)
-0.236***
(0.058)
-0.148
(0.149)
-0.165***
(0.058)
Index Dummy 1.128***
(0.109)
1.532***
(0.246)
0.811***
(0.114)
1.139***
(0.130)
1.344***
(0.296)
0.853***
(0.134)
Constant 6.230***
(1.243)
5.125**
(2.553)
4.850***
(1.148)
5.709***
(1.475)
5.122
(3.140)
3.205**
(1.352)
Sector FE
Time FE
Rating FE
Observations
R2
Yes
Yes
Yes
1023
0.430
Yes
Yes
Yes
267
0.504
Yes
Yes
Yes
756
0.478
Yes
Yes
Yes
766
0.386
Yes
Yes
Yes
205
0.452
Yes
Yes
Yes
561
0.472
Robust standard errors in parentheses.
*** p<0.01, ** p<0.05, * p<0.1
22

........
5.2 Estimation of HC recommendations’ effect using the DID method
As described in Subsection 5.1, the period 2008–2013 can be divided into two sub-periods: the
sub-period prior to the Committee’s recommendations (the Pre period, 2008 – 2010:Q3), and the
sub-period after publication of the Committee’s recommendations (the Post period, 2010:Q4 – 2013).
Therefore, we could utilize this set up in order to use the Difference-in-Differences (DID) method-
ology. First, we examine the trend in the loan and bond average yield spreads in the Pre period
(2008–2010) (Figure 13). A parallel trend can be identified, enabling us to utilize this approach to
examine the way in which implementation of the HC recommendations was treated as an exogenous
shock. Figure 13 also shows that in 2011–2013 the difference between the loan yield spreads and
the bond yield spreads, is slightly low, and as one can see, the parallel trends assumption also holds
after the exogenous shock.
Figure 13: Average yield spreads of private loans and public bonds, 2008–2013, in percent
0
1
2
3
4
5
2008 2009 2010 2011 2012 2013
Percentage
Public Bonds Private Loans
According to the estimation presented in Table 2, the average yield spreads decreased by more
than a percentage point in the period after the publication of the Committee’s recommendations,
but this estimation based on the OLS method does not take into account the Committee’s recom-
mendations as a causal effect. We therefore performed the estimation using a DID regression, where
we added a dummy variable to the regression in Section 5.1 which takes the value 1 for the Post HC
23

period, and 0 for the Pre HC period. We also added the interaction variable (the variable which, in
practice, estimates the DID) for the Post period, multiplied by the dummy variable for the loan or
bond. The DID estimated equation is:
Yi,t = β0 + β1Loan + β2P ost + β3Loan × P ost + β4Sector + β5T ime + β6Rating (2)
+ β7V olume + β8Index + β9Maturity + �i,t
The results are presented for a sample that includes all sectors of the economy and for a sample
that excludes the irregular sectors (financial and energy sectors). Another possible argument that
calls into question the concept that these are homogeneous groups is that the companies taking
loans are essentially different from companies issuing bonds. To address this argument and to test
the robustness of the results, we therefore restricted the sample to companies that have both types
of instruments – public bonds and private loans.
After restricting the sample to public firms only, we allow the addition of variables to the re-
gression which control for the firm characteristics, so that we estimated the DID regression including
some variables, such as the age and the size of the firm, as well as accounting-financial variables,
such as leverage, profitability, liquidity of the assets and the share of the company’s tangible assets.
The regression results are presented in Table 3: column (1) presents the results for the entire
sample and all of the sectors; column (2) presents the results without the energy and financial
sectors; column (3) presents the results in a restricted sample for companies with public bonds and
private loans and for all sectors; in column (4) we add to the estimation the control variables for the
firm characteristics; in column (5) we restrict the sample only for listed firms and include another
variables: standard deviation of the stock (to control for the issuer risk) and a P/B ratio (to control
for investments opportunities); and in column (6) we again omit the financial and energy sectors.
In each of the specifications presented in columns (1) – (6) it can be observed that the coefficient
for the loan variable is positive, and it has a statistical significance of 1 percent. The coefficient for
the interaction variable, which indicates the causal effect of HC, is between -0.5 percentage points
(-50 basis points) to -1.3 percentage points, with a high level of statistical significance. The economic
effect of this finding is significant – as we can observe in Figure 12, there is a decrease of about 25
percent in the loan yield spread following the implementation of the Committee’s recommendations.
24

Table 3: DID Regression
All Sample
(1) (2)
All Sectors No Energy &
Financial Sectors
Loan & Bond Firms Only
Listed Firms Only
(3) (4) (5) (6)
All Sectors All Sectors No Energy &
Financial Sectors
Loan 0.693***
(0.238)
1.052***
(0.283)
1.557***
(0.436)
1.484***
(0.447)
1.476***
(0.483)
1.721***
(0.502)
Post -0.548
(0.431)
-0.744
(0.506)
0.758
(0.973)
0.900
(0.971)
1.005
(1.004)
0.931
(1.007)
Post × Loan -0.498**
(0.245)
-0.922***
(0.298)
-1.259***
(0.450)
-1.304***
(0.460)
-1.044**
(0.508)
-1.322**
(0.536)
Time to Maturity -0.035
(0.023)
-0.047
(0.033)
-0.126***
(0.045)
-0.078*
(0.047)
-0.076
(0.058)
-0.010
(0.066)
Volume -0.235***
(0.048)
-0.201***
(0.059)
0.096
(0.091)
0.156
(0.095)
0.173
(0.109)
0.180
(0.111)
Index Dummy 1.084***
(0.111)
1.049***
(0.133)
0.776***
(0.196)
0.654***
(0.205)
0.632**
(0.258)
0.541**
(0.262)
Constant
Sector FE
Time FE
Rating FE
Firm Characteristicsa
Observations
R2
5.600***
(1.279)
Yes
Yes
Yes
No
1023
0.433
4.441***
(1.522)
Yes
Yes
Yes
No
766
0.394
-2.789
(2.271)
Yes
Yes
Yes
No
292
0.491
-9.384**
(4.187)
Yes
Yes
Yes
Yes
276
0.523
-7.326*
(4.373)
Yes
Yes
Yes
Yes
219
0.571
-7.273*
(4.372)
Yes
Yes
Yes
Yes
208
0.562
Robust standard errors in parentheses.
*** p<0.01, ** p<0.05, * p<0.1
aFirm characteristics include age, size, tangibility and financial ratios, like leverage, profitability and liquidity.
For listed firms the standard deviation of the stock and P/B ratio are also included.
25

5.3 Robustness Checks
5.3.1 Restricted sample period
The original sample period for which we examine the effect of the exogenous shock of publication
of the Committee’s recommendations is the three years prior to and three years after publication of
the HC recommendations – 2008 through 2013. Some events occurred during this period, which will
be detailed below, which might partially explain the results obtained in this paper.
The first major event is the GFC of 2008, which affected liquidity in the financial markets
and the price of assets (Garcia-Appendini and Montoriol-Garriga 2013; Allen and Carletti 2008;
Ivashina and Scharfstein 2010). Consequently, firms that wanted to raise debt at the beginning of
the sample period and faced difficulties may have chosen to approach the private debt market, which
is characterized with higher yield spreads, a factor that may skew the results of our study.
Another event that could drive the results of the study is the reduced business lending activity by
Israel’s banks. Given that the banks are the key player in providing loans to large entities, a reduction
of their activity for the purpose of accumulating capital (or for any other reason) might cause
borrowers to turn to nonbank sources of credit such as the institutional investors. An examination
of the business lending trends in the banking system in Israel shows that negative growth rates in
credit supply only began toward the end of 2012, which led to a negative growth in the supply in
2013.
These events took place mainly at the edges of our sample period and we therefore restricted the
estimated sample period to 2009-2012—namely two years prior to and two years after publication
of the HC recommendations—so as to rule out these possible explanations, and examine the same
regressions that were estimated in Table 3. These results are presented in Table 4, which shows
that the estimations of the Committee’s recommendations as a causal effect are almost unchanged
(compared with Table 3) and the statistical significance also remains high across the different spec-
ifications.
26

Table 4: DID Regression – Restricted Period
All Sample
(1) (2)
All Sectors No Energy &
Financial Sectors
Loan & Bond Firms Only
Listed Firms Only
(3) (4) (5) (6)
All Sectors All Sectors No Energy &
Financial Sectors
Loan 0.649***
(0.244)
0.853***
(0.289)
1.546***
(0.454)
1.582***
(0.457)
1.796***
(0.462)
2.133***
(0.468)
Post 1.947
(1.381)
0.134
(0.431)
1.421
(1.362)
1.924
(1.327)
1.579
(1.316)
0.866
(0.627)
Post × Loan -0.592**
(0.256)
-0.933***
(0.312)
-1.067**
(0.479)
-1.119**
(0.486)
-1.041**
(0.510)
-1.424***
(0.522)
Time to Maturity -0.055**
(0.025)
-0.077**
(0.038)
-0.167***
(0.053)
-0.128**
(0.054)
-0.074
(0.063)
-0.012
(0.067)
Volume -0.258***
(0.054)
-0.274***
(0.067)
0.146
(0.105)
0.222**
(0.108)
0.248**
(0.114)
0.246**
(0.113)
Index Dummy 1.113***
(0.122)
1.158***
(0.149)
1.003***
(0.224)
0.928***
(0.231)
0.913***
(0.273)
0.837***
(0.267)
Constant
Sector FE
Time FE
Rating FE
Firm Characteristicsa
Observations
R2
3.376*
(1.855)
Yes
Yes
Yes
No
705
0.496
4.991***
(1.635)
Yes
Yes
Yes
No
521
0.465
-4.849*
(2.572)
Yes
Yes
Yes
No
202
0.517
-6.325
(4.657)
Yes
Yes
Yes
Yes
191
0.568
-1.861
(4.462)
Yes
Yes
Yes
Yes
153
0.642
-1.179
(4.304)
Yes
Yes
Yes
Yes
146
0.664
Robust standard errors in parentheses.
*** p<0.01, ** p<0.05, * p<0.1
aFirm characteristics include age, size, tangibility and financial ratios, like leverage, profitability and liquidity.
For listed firms the standard deviation of the stock and P/B ratio are also included.
27

5.3.2 Using the new bond series for the entire sample period
The empirical strategy in the paper so far is based on the fact that the Committee’s recommendations
were not applied on expansions of bond series. In order to negate possible arguments in which this
group represents specific companies (for example, those that do not require tight monitoring), we
use the new bond series for a robustness check. For this purpose, we need to assume that the new
bonds’ price was not affected at all by the Committee’s recommendations. This requires two things:
(1) There is perfect competition in the bond market, so the financial institutions could not incur the
monitoring costs to the issuer (because there are additional participants, which are not subject to
the regulation); (2) Implementation of HC recommendations did not decrease the risk in new bonds.
The first one should be examined by the depth of bonds tradability, as in the study of Ger-
shgoren, Hadad, and Kedar-Levy (2020), indicating that the bond market in Israel is deep. The
second requires testing the risk pricing of the new bond series. First, in Figure 5, as one can see the
rating of the new bond series almost did not change following the committee. Second, we examined
empirically whether the price of new bonds is different from all of the rest of the tradable bonds,
and we did not find statistical evidence for that. So assuming that the price of new bond series was
not affected, it enables us to execute this check using the DID approach.
The results are presented in Table 5. Columns (1) – (3) include the entire period and columns
(4) – (6) include the restricted period (years: 2009–2012). Again, we test for all the sectors (columns
(1) & (4)); without the Financial and Energy sectors (columns (2) & (5)); and the restricted sample
for companies with public bonds and private loans and for all sectors (columns (3) & (6)). As one
can see, as expected, the interaction variable is still negative with high statistical significance.
28

Table 5: DID Regression – New Bond Series
Entire Period (2008–2013)
(1) (2) (3)
All Sectors No Energy & Loan & Bond
Financial Sectors Firms
Restricted Period (2009–2012)
(4) (5) (6)
All Sectors No Energy & Loan & Bond
Financial Sectors Firms
Loan 0.699***
(0.243)
1.049***
(0.284)
1.362***
(0.460)
0.608**
(0.251)
0.790***
(0.294)
1.320***
(0.504)
Post -0.211
(0.442)
-0.402
(0.516)
1.318
(1.038)
2.098
(1.370)
0.587
(0.450)
2.390
(1.501)
Post × Loan -0.736***
(0.249)
-1.161***
(0.296)
-1.569***
(0.491)
-0.753***
(0.269)
-1.185***
(0.326)
-1.768***
(0.560)
Time to Maturity -0.044*
(0.023)
-0.065*
(0.035)
-0.166***
(0.051)
-0.067***
(0.026)
-0.097**
(0.041)
-0.188***
(0.063)
Volume -0.235***
(0.056)
-0.215***
(0.069)
-0.018
(0.114)
-0.240***
(0.066)
-0.268***
(0.083)
-0.062
(0.131)
Index Dummy 1.141***
(0.115)
1.023***
(0.135)
1.022***
(0.221)
1.265***
(0.128)
1.255***
(0.153)
1.154***
(0.264)
Constant
Sector FE
Time FE
Rating FE
Observations
R2
5.725***
(1.452)
Yes
Yes
Yes
887
0.440
4.910***
(1.758)
Yes
Yes
Yes
659
0.413
-0.409
(2.766)
Yes
Yes
Yes
228
0.505
3.390*
(2.013)
Yes
Yes
Yes
609
0.496
5.015**
(1.980)
Yes
Yes
Yes
450
0.465
-1.155
(3.122)
Yes
Yes
Yes
164
0.553
Robust standard errors in parentheses.
*** p<0.01, ** p<0.05, * p<0.1
29

6 Conclusion
In this paper we suggest a novel set-up which enables us to analyze investors’ incentive to perform
monitoring in the public debt market. We use a regulation that obligated the institutional investors
in Israel to perform monitoring on borrowers only in the public debt market – which is highly
decentralized, but not in the private loans market – which is highly centralized. The fact that this
regulation, as an exogenous shock, is applied only on one type of debt instrument, allows us to use
the difference–in–differences (DID) methodology in order to estimate the effect of this regulation on
the decisions taken by the institutional investors when choosing to invest in each of the debt types.
We examined the question using an identification method based on estimation of the yield
spread differences between public bonds and private loans provided by the institutional investors,
pre and post implementation of the Hodak Committee’s recommendations. The key finding in
the study is that implementation of the HC recommendations brought about a statistically and
economically significant decrease in the yield spread differences between the two types of corporate
debt instruments, so that the results are robust to a large number of specifications and different
subsamples over the study period. We attribute the decrease in the yield spread differences to
institutional investors’ growing demand for private loans as their demand for public bonds declined.
In examining the causes that led the institutional investors to change their preferences and
increase their demand for private loans at the expense of public bonds, it is worth noting that the
regulations described above apply exclusively to institutional investors, whereas the other players
in the market (mainly the mutual funds) were not governed by them. Consequently, following
implementation of the regulations, the institutional investors found themselves alone in bearing the
burden of the substantial monitoring costs, which in practice became a public good, from which
other players in the market also benefited. In other words, a free rider situation was created among
the players competing with the institutional investors in the public debt market.
The fact that the Committee recommendations caused institutional investors to incur significant
monitoring costs in a decentralized debt market led them to redirect their investments to the much
more concentrated loan market, in which the institutional investor is generally the single lender.
This resulted in an alignment of interests between the costs of the monitoring activity and the
benefits inherent in this activity, which provides the institutional investor the incentive to monitor
30

the borrower, and although this process entails certain costs, the monitoring is at the discretion of
the institutional investor.
References
Allen, Franklin and Elena Carletti (2008). “Mark-to-market accounting and liquidity pricing”. In:
Journal of accounting and economics 45.2-3, pp. 358–378.
Almazan, Andres, Jay C Hartzell, and Laura T Starks (2005). “Active institutional shareholders and
costs of monitoring: Evidence from executive compensation”. In: Financial management 34.4,
pp. 5–34.
Baumol, William J (2004). “Welfare Economics and the Theory of the State”. In: The encyclopedia
of public choice. Springer, pp. 937–940.
Berglof, Erik and Ernst-Ludwig Von Thadden (1994). “Short-term versus long-term interests: Capital
structure with multiple investors”. In: The quarterly journal of economics 109.4, pp. 1055–1084.
Bradley, Michael and Michael R Roberts (2003). “Are bond covenants priced”. In: Unpublished
Working Paper, The Fuqua School of Business. Duke University.
— (2015). “The structure and pricing of corporate debt covenants”. In: The Quarterly Journal of
Finance 5.02, p. 1550001.
Bushee, Brian J (1998). “The influence of institutional investors on myopic R&D investment behav-
ior”. In: Accounting review, pp. 305–333.
Campbell, John Y and Glen B Taksler (2003). “Equity volatility and corporate bond yields”. In:
The Journal of finance 58.6, pp. 2321–2350.
Chen, Xia, Jarrad Harford, and Kai Li (2007). “Monitoring: Which institutions matter?” In: Journal
of financial Economics 86.2, pp. 279–305.
Diamond, Douglas W (1984). “Financial intermediation and delegated monitoring”. In: The review
of economic studies 51.3, pp. 393–414.
— (1991). “Debt maturity structure and liquidity risk”. In: the Quarterly Journal of economics
106.3, pp. 709–737.
— (1993). “Seniority and maturity of debt contracts”. In: Journal of financial Economics 33.3,
pp. 341–368.
Elton, Edwin J et al. (2001). “Explaining the rate spread on corporate bonds”. In: the journal of
finance 56.1, pp. 247–277.
31

Fama, Eugene F (1985). “What’s different about banks?” In: Journal of monetary economics 15.1,
pp. 29–39.
Focarelli, Dario, Alberto Franco Pozzolo, and Luca Casolaro (2008). “The pricing effect of certifica-
tion on syndicated loans”. In: Journal of Monetary Economics 55.2, pp. 335–349.
Garcia-Appendini, Emilia and Judit Montoriol-Garriga (2013). “Firms as liquidity providers: Evi-
dence from the 2007–2008 financial crisis”. In: Journal of financial economics 109.1, pp. 272–
291.
Gershgoren, Gitit Gur, Elroi Hadad, and Haim Kedar-Levy (2020). “A deep market in Israeli corpo-
rate bonds: Macro and microeconomic analysis in light of the accounting standards”. In: Israel
Economic Review 18.1, pp. 139–176.
Gilchrist, Simon and Egon Zakrajsek (2012). “Credit spreads and business cycle fluctuations”. In:
American economic review 102.4, pp. 1692–1720.
Grossman, Sanford J and Oliver D Hart (1980). “Takeover bids, the free-rider problem, and the
theory of the corporation”. In: The Bell Journal of Economics, pp. 42–64.
Hartzell, Jay C and Laura T Starks (2003). “Institutional investors and executive compensation”.
In: The journal of finance 58.6, pp. 2351–2374.
Ivashina, Victoria and David Scharfstein (2010). “Bank lending during the financial crisis of 2008”.
In: Journal of Financial economics 97.3, pp. 319–338.
Jensen, Michael C and William H Meckling (1976). “Theory of the firm: Managerial behavior, agency
costs and ownership structure”. In: Journal of financial economics 3.4, pp. 305–360.
Kahan, Marcel and Bruce Tuckman (1993). “Private vs. public lending: Evidence from covenants”.
In: John D. Finnerty and Martin S. Fridson, eds.: The Yearbook of Fixed Income Investing
(Irwin, New York).
Kahn, Charles and Andrew Winton (1998). “Ownership structure, speculation, and shareholder
intervention”. In: The Journal of Finance 53.1, pp. 99–129.
Kim, Oliver and Mark Walker (1984). “The free rider problem: Experimental evidence”. In: Public
choice 43.1, pp. 3–24.
Leftwich, Richard (1981). “Evidence of the impact of mandatory changes in accounting principles
on corporate loan agreements”. In: Journal of Accounting and economics 3.1, pp. 3–36.
Maug, Ernst (1998). “Large shareholders as monitors: Is there a trade-off between liquidity and
control?” In: The journal of finance 53.1, pp. 65–98.
32

Myers, Stewart C (1977). “Determinants of corporate borrowing”. In: Journal of financial economics
5.2, pp. 147–175.
Park, Cheol (2000). “Monitoring and structure of debt contracts”. In: The Journal of Finance 55.5,
pp. 2157–2195.
Parrino, Robert, Richard W Sias, and Laura T Starks (2003). “Voting with their feet: Institutional
ownership changes around forced CEO turnover”. In: Journal of financial economics 68.1, pp. 3–
46.
Rajan, Raghuram and Andrew Winton (1995). “Covenants and collateral as incentives to monitor”.
In: The Journal of Finance 50.4, pp. 1113–1146.
Rajan, Raghuram G (1992). “Insiders and outsiders: The choice between informed and arm’s-length
debt”. In: The Journal of finance 47.4, pp. 1367–1400.
Repullo, Rafael and Javier Suarez (1998). “Monitoring, liquidation, and security design”. In: The
review of financial studies 11.1, pp. 163–187.
Shleifer, Andrei and Robert W Vishny (1986). “Large shareholders and corporate control”. In:
Journal of political economy 94.3, Part 1, pp. 461–488.
Smith Jr, Clifford W and Jerold B Warner (1979). “On financial contracting: An analysis of bond
covenants”. In: Journal of financial economics 7.2, pp. 117–161.
33

Appendix A
Table 6: Definitions of the Main Variables
Variable Definition
Yi (Yield Spreads) The yield spread for each of the debt instruments from government
bonds adjusted to the average duration and index.
For loans, the spread is calculated manually by means of the differ-
ence between the interest rate quoted on the loan and the yield derived
from a zero curve, which is consistent with the month in which the
loan was provided, the average duration and the index.
For bonds, the spread is based on the Bank of Israel’s automatic calcu-
lations, in which the difference between the yield for the series and the
zero curve yield consistent with rating and indexation is calculated.
For the new bond series, we used the spread at the issuance date of
the series and for the expanded bond series we used the spread at the
date of the prospectus for the expanded series.
Loan A dummy variable that takes the value of 1 for a private loan and 0
for a public bond.
Sector A dummy variable for the sector, which is defined in accordance with
the sectoral classification of the Tel Aviv Stock Exchange.
Rating A dummy variable for the rating, based on the generally accepted rat-
ing scale in Israel. For loans, the rating is according to an external rat-
ing by a rating company (Maalot or Midroog) or an internal rating
model prepared by the institutional investor. For bonds, the rating is
according to an external rating prepared by a rating company (Maalot
or Midroog).
Quarter A dummy variable for quarter t in which the loan is provided, the
bond series is issued (for new bond series), or publication of the
prospectus (for expanded bond series).
Maturity The time to maturity (in years) of the loan or bond.
34

Table 6: Definitions of the Main Variables - Continued
Variable Definition
Volume A variable for the amount of the private loan or volume of the public
bond issuance.
Index A dummy variable that takes the value of 1 for linkage to the CPI and
0 for nominal debt instrument.
Post A dummy variable that takes the value of 1 for loans or bond series
that were provided or issued after the date of publication of the Hodak
Committee recommendations and 0 before.
Age The firm’s age (in years) in the time of estimating the regressions.
Size The size of the firm is measured using the natural log of the company’s
total assets in quarter t-1.
Leverage Leverage of the firm, calculated according to the Debt to Cap ratio
(the financial debt divided by the financial debt and shareholders’ eq-
uity) in quarter t-1.
Profitability The firm’s profitability, calculated according to the company’s ROE
(return on equity) in quarter t-1.
Liquidity The level of the firm’s liquid assets, measured according to its imme-
diate liquidity ratio (cash and cash equivalents and short-term invest-
ments as a percentage of current liabilities) in quarter t-1.
Tangibility The level of the firm’s tangible assets, calculated according to the ratio
of tangible assets to the firm’s total assets in quarter t-1.
P/B ratio A measure of the firm’s growth opportunities, calculated by the ratio
of the quarterly average market cap to the shareholders’ equity (book
value) at the end of quarter t-1.
Standard Devia-
tion
The standard deviation of the monthly stock return in the period be-
fore the bond was issued or the loan was taken (the periods which
tested are 1 year, 3 years and 5 years).
35

36
Table
7: Descriptive Statistics – Private
Loans
Panel A: by
sector
Mean
Median
Observations
Volume (K
of NIS)
Spread
(%)
Duration
Rating
Volume (K
of NIS)
Spread
(%)
Duration
Rating
Holdings
56
107,000
3.63
3.19
A+
79,900
3.57
3.12
A+
Gas,
Oil
& Energy
136
56,700
3.34
6.42
A
38,000
3.41
7.71
A
Insurance
6
36,600
1.98
7.27
AA-
23,300
2.05
6.98
AA-
Banks
6
67,400
3.81
3.63
AA-
57,200
3.60
1.80
AA-
Commerce
& Services
168
74,800
3.80
2.94
A+
33,000
3.72
2.16
A+
Real Estate
127
64,300
3.96
3.80
A
41,000
3.65
3.64
A
Industry
16
142,000
3.66
4.07
A-
56,000
3.57
4.11
A-
Other
32
97,500
2.29
3.35
A-
29,500
1.78
3.71
A-
Total
547
74,000
3.60
4.14
A
40,000
3.47
3.51
A
Panel B: by
year
Mean
Median
Observations
Volume (K
of NIS)
Spread
(%)
Duration
Rating
Volume (K
of NIS)
Spread
(%)
Duration
Rating
2008
28
94,600
4.36
2.28
A
12,000
3.43
1.37
A
2009
31
73,500
3.79
4.61
AA-
41,000
3.44
2.79
AA-
2010
54
60,500
3.79
3.03
A+
36,500
3.72
2.46
A+
2011
137
62,500
3.33
4.15
A
35,500
3.31
3.74
A
2012
137
58,900
3.33
4.15
A+
35,000
3.13
3.74
A
2013
160
97,800
3.80
4.75
A
57,700
3.96
4.04
A
Total
547
74,000
3.60
4.14
A
40,000
3.47
3.51
A

37
Table
8: Descriptive Statistics – Public Bonds
Panel A: by
sector
Mean
Median
Observations
Volume (K
of NIS)
Spread
(%)
Duration
Rating
Volume (K
of NIS)
Spread
(%)
Duration
Rating
Holdings
37
207,000
3.87
4.46
BBB+
150,000
3.54
4.31
A-
Gas,
Oil
& Energy
5
138,000
4.10
4.88
BB
134,000
3.74
4.83
BB
Insurance
29
148,000
2.71
6.54
A+
120,000
1.98
6.74
AA-
Banks
75
512,000
1.10
6.11
AA-
344,000
1.33
5.92
AA
Commercial &
Services
86
209,000
3.08
3.78
A
137,000
2.88
3.56
A
Real Estate
207
131,000
3.68
4.28
A-
80,000
3.14
4.14
A
Industry
37
227,000
2.87
4.25
A
120,000
2.71
3.96
A
Total
476
221,000
3.06
4.64
A
125,000
2.66
4.32
A
Panel B: by
year
Mean
Median
Observations
Volume (K
of NIS)
Spread
(%)
Duration
Rating
Volume (K
of NIS)
Spread
(%)
Duration
Rating
2008
23
330,000
2.85
4.19
A-
236,000
2.25
4.20
A+
2009
59
310,000
2.48
5.40
A-
212,000
2.80
4.33
A
2010
116
219,000
2.95
4.93
A-
119,000
2.78
4.67
A
2011
74
233,000
3.06
4.29
A
146,000
2.27
4.12
A+
2012
97
212,000
3.04
4.46
A+
116,000
2.80
4.16
A+
2013
107
154,000
3.59
4.38
A-
90,700
2.90
4.16
A
Total
476
221,000
3.06
4.64
A
125,000
2.66
4.32
A

Figure 14: Corporate debt investments by the institutional investors, 2008–2019
0
10
20
30
40
50
60
70
80
90
100
Percentage
Total Bonds as % of the corporate debt investments
Private Loans as % of the corporate debt investments
Figure 15: Annual rates of change in credit provided to the business sector, 2006–2019, in percent
-5
0
5
10
15
20
Percentage
Annual Growth Rate Annual Average Periodic Average
38