Embed Size (px)
Citation preview

University of Calgary
PRISM: University of Calgary's Digital Repository
Graduate Studies The Vault: Electronic Theses and Dissertations
2014-08-26
Evidence for Hydrothermal Influences During
Deposition in Organic Shale Using XRF and SEM
Techniques in the Horn River Group and Besa River
Formation, Northeast British Columbia, Canada
Weedmark, Thomas Craig
Weedmark, T. C. (2014). Evidence for Hydrothermal Influences During Deposition in Organic
Shale Using XRF and SEM Techniques in the Horn River Group and Besa River Formation,
Northeast British Columbia, Canada (Unpublished master's thesis). University of Calgary,
Calgary, AB. doi:10.11575/PRISM/25999
http://hdl.handle.net/11023/1697
master thesis
University of Calgary graduate students retain copyright ownership and moral rights for their
thesis. You may use this material in any way that is permitted by the Copyright Act or through
licensing that has been assigned to the document. For uses that are not allowable under
copyright legislation or licensing, you are required to seek permission.
Downloaded from PRISM: https://prism.ucalgary.ca

UNIVERSITY OF CALGARY
Evidence for Hydrothermal Influences During Deposition in Organic Shale Using XRF
and SEM Techniques in the Horn River Group and Besa River Formation, Northeast
British Columbia, Canada
by
Thomas Craig Weedmark
A THESIS
SUBMITTED TO THE FACULTY OF GRADUATE STUDIES
IN PARTIAL FULFILMENT OF THE REQUIREMENTS FOR THE
DEGREE OF MASTER OF SCIENCE IN GEOLOGY
GRADUATE PROGRAM IN GEOSCIENCES
CALGARY, ALBERTA
AUGUST, 2014
© THOMAS CRAIG WEEDMARK 2014

ii
Thesis Abstract
Chemical stratigraphy has a variety of applications in both academic and commercial
geology studies. Current mainstream belief is that the Horn River Group and analogous
Devonian organic shale units in North America were deposited in a restricted anoxic
basin and silicified due to diatom and radiolarian tests producing concentrations of
biogenic silica (Bustin & Ross, 2009). This hypothesis proposes that relative sea level
changes and associated seawater chemistry are the primary controls on preservation of
organic matter and the formation of pyrite. After studying these rocks using XRF and
SEM techniques there is little evidence to support the claims. There is however strong
evidence of syn-depositional hydrothermal fluid interactions with the sediments
originating from extensional faulting. SEDEX type mineralization and hydrothermal
minerals including hyalophane, celsian, and potassium feldspar are present in
authigenic quartz cements. In addition organics in close proximity show variable
maturation and association with quartz cementation.

iii
Thesis Acknowledgements
This thesis contains the findings of three years of collaboration with professors and
students from the University of Calgary along with industry professionals from
Quicksilver Resources Canada Inc. I would like to thank all the people and sponsors for
their time, materials, knowledge and financial support that went into this research
project.
In particular I would like to thank Francois Marechal and Quicksilver Resources Canada
Inc. for sponsoring the project and providing the financial support, samples, and well
data at the core of this research. The goal set out by our sponsors in 2011 was to
develop an XRF template which could predict reservoir qualities within the Horn River
Group essential for planning and completing horizontal gas producing wells. In order to
complete that task I had to learn all about portable XRF technologies which were
becoming available in oil and gas at the time. In addition to learning how portable XRF
technology worked, I had to learn all about the most recent depositional concepts for
organic shale so that the chemical data could be linked back to geology. As a result of
using portable XRF to understand organic shale from a chemical composition
perspective, many basic depositional concepts which hold for conventional sedimentary
rocks can also be applied to shale and siltstone. XRF technology and in particular its
application to unconventional shale plays has now become my geologic passion and a
cutting edge tool for oil and gas exploration.

iv
I am also very thankful to my advisor Dr. Ron Spencer for providing me with the
opportunity to attend graduate school for geology. While overseas with the Canadian
Forces on deployment in 2009, Ron managed to get a hold of me and suggested I
should give graduate school serious consideration once my time with the military was
complete. During my leave back to Canada later that year I was able to quickly
prepared and submit my application to the University of Calgary with the help of Ron. I
was accepted and began my studies in September 2010. Ron was very interested in
the new portable XRF instruments available and arranged for me to have total access to
one of these instruments in order to study organic shale from the Horn River Basin.
Throughout the course of my research and academic studies at the University of
Calgary he has been my mentor and a friend. He has provided important guidance and
direction along the way, but also allowed me to develop my own ideas, projects, and
problem solving methods in order to become a well-rounded geologist.

v
Table of Contents
THESIS ABSTRACT .................................................................................................................................... ii
THESIS ACKNOWLEDGEMENTS ............................................................................................................. iii
TABLE OF CONTENTS ............................................................................................................................... v
LIST OF TABLES AND FIGURES ............................................................................................................. vii
CHAPTER 1: THESIS INTRODUCTION ...................................................................................................... 1
1.1 Purpose of Study .................................................................................................................................. 1 1.2 Regional Considerations ...................................................................................................................... 3 1.3 Geologic History of the Horn River Basin .......................................................................................... 6
CHAPTER 2: SCIENTIFIC METHODS ...................................................................................................... 19
2.1 Portable X-Ray Fluorescence (XRF) .................................................................................................. 19 2.2 Scanning Electron Microscope (SEM) .............................................................................................. 20 2.3 X-Ray Diffraction (XRD) ...................................................................................................................... 21 2.4 TOC and Rock Eval Analysis ............................................................................................................. 23
CHAPTER 3: SUBSURFACE APPLICATIONS OF XRF AND SEM IN THE HORN RIVER BASIN, BRITISH COLUMBIA, CANADA ............................................................................................................... 25
3.1 Abstract ................................................................................................................................................ 25 3.2 Introduction ......................................................................................................................................... 27 3.3 Study Area and Sample Collection ................................................................................................... 29 3.4 Basic XRF Subsurface Exploration ................................................................................................... 30
3.4.1 Molecular Percentages .................................................................................................................. 31 3.4.2 Redox and TOC Indicators ............................................................................................................. 33
3.5 XRF and SEM Analysis of the Fort Simpson Formation and the Horn River Group ................... 36 3.5.1 Molecular Percentages .................................................................................................................. 36 3.5.2 Mineralogy ...................................................................................................................................... 38 3.5.3 Redox and TOC Indicators ............................................................................................................. 43 3.5.4 Hydrothermal Trace Metals ............................................................................................................ 45
3.5.5 Mechanical Properties .................................................................................................................... 50 3.5.6 Horizontal Well Applications ........................................................................................................... 55 3.5.7 Hydrothermal Vs Biogenic Silica Cement ...................................................................................... 56
3.6 Summary ............................................................................................................................................. 63

vi
CHAPTER 4: SYN-DEPOSITIONAL HYDROTHERMAL INFLUENCES, BESA RIVER FORMATION, NORTHEAST BRITISH COLUMBIA, CANADA ....................................................................................... 66
4.1 Abstract ................................................................................................................................................ 66 4.2 Introduction ......................................................................................................................................... 68 4.3 Study Area and Data Collection ........................................................................................................ 68 4.4 Lithology and Stratigraphy ................................................................................................................ 71
4.4.1 Type 1: Quartz-TOC-Clay Assemblage (Quartz-Rich)................................................................... 72 4.4.2 Type 2: Quartz-TOC-Clay Assemblage (Organic-Rich) ................................................................. 74 4.4.3 Type 3: Quartz-TOC-Clay Assemblage (Clay-Rich) ...................................................................... 76 4.4.4 Type 4: Dolomite-Chlorite Assemblage ........................................................................................ 78
4.5 SYN-DEPOSITIONAL HYDROTHERMAL EVIDENCE ...................................................................... 79 4.5.1 Organic Content and Maturity ....................................................................................................... 79
4.5.2 Detrital Quartz and Quartz Cement In The Besa River Shale ....................................................... 82 4.5.3 Hydrothermal Minerals .................................................................................................................. 87
4.6 Summary ............................................................................................................................................. 90
CHAPTER 5: THESIS SUMMARY ............................................................................................................. 92
5.1 Final Summary .................................................................................................................................... 92 5.2 References ........................................................................................................................................... 95

vii
List of Tables and Figures
FIGURE 1.1. REGIONAL TIME EQUIVALENT HYDROTHERMAL ORE DEPOSITS ................................. 3
FIGURE 1.2. LOCAL TIME EQUIVALENT HYDROTHERMAL ORE DEPOSITS. ....................................... 5
FIGURE 1.3. PASSIVE MARGIN IN THE LATE ORDOVICIAN (485 MA) ................................................... 7
FIGURE 1.4. DISTANT SUBDUCTION ZONE IN THE EARLY SILURIAN (430 MA) .................................. 8
FIGURE 1.5. PROXIMAL SUBDUCTION ZONE IN THE EARLY DEVONIAN (400 MA) .......................... 10
FIGURE 1.6. RIFTING AND EXTENSION DURING MIDDLE DEVONIAN (385 MA) ................................ 12
FIGURE 1.7. ISOPACH MAPS OF CHINCHAGA AND KEG RIVER FORMATION ................................. 13
FIGURE 1.8. CROSS SECTIONAL DEPICTION OF HORN RIVER BASIN GROWTH ........................... 14
FIGURE 1.9. RIFTING AND EXTENSION DURING LATE DEVONIAN (360 MA) .................................... 16
FIGURE 1.10. SUBDUCTION AND COMPRESSION DURING EARLY MISSISSIPPIAN (345 MA) ........ 18
FIGURE 2.1. XRF ANALYSIS ..................................................................................................................... 19
FIGURE 2.2. X-RAY DIFFRACTION PATTERNS FOR 20 QUARTZ-RICH SAMPLES ........................... 22
FIGURE 2.3. XRD VS XRF MINERALOGY ............................................................................................... 23
FIGURE 3.1. HORN RIVER BASIN STUDY AREA .................................................................................... 30
FIGURE 3.2. MOLECULAR PERCENTAGES (C-049-E) ........................................................................... 31
FIGURE 3.3. MOLECULAR PERCENTAGES (B-091 G) ........................................................................... 32
FIGURE 3.4. REDOX CONDITIONS AND TOC INDICATORS (C-049-E) ................................................ 34
FIGURE 3.5. REDOX CONDITIONS AND TOC INDICATORS (B-091-G) ................................................ 35
FIGURE 3.6. HORN RIVER GROUP MOLECULAR PERCENTAGES (C-049-E) ..................................... 37
FIGURE 3.7. HORN RIVER GROUP MOLECULAR PERCENTAGES (B-091 G) .................................... 38
TABLE 3.1. HORN RIVER GROUP MINERAL COMPOSITIONS ............................................................. 39
FIGURE 3.8. MINERAL PERCENTAGES (C-049-E) ................................................................................. 40
FIGURE 3.9. MINERAL PERCENTAGES (B-091-G) ................................................................................. 41
FIGURE 3.10. HORN RIVER GROUP REDOX CONDITIONS AND TOC POTENTIAL (C-049-E) .......... 44
FIGURE 3.11. HORN RIVER GROUP REDOX CONDITIONS AND TOC POTENTIAL (B-091-G) ......... 45
FIGURE 3.12. HYDROTHERMAL TRACE METALS (C-049-E) ................................................................ 46
FIGURE 3.13. HYDROTHERMAL TRACE METALS (B-091-G) ............................................................... 47
FIGURE 3.14. HYDROTHERMAL SILICA CEMENT (C-049-E) ................................................................ 49
FIGURE 3.15. POISSON’S RATIO ........................................................................................................... 52
FIGURE 3.16. YOUNG’S MODULUS ....................................................................................................... 53
FIGURE 3.17. APPLICATIONS OF XRF IN HORIZONTAL WELLS ........................................................ 56
FIGURE 3.18. HEAVY QUARTZ CEMENTED CUTTINGS WITH FEW FOSSILS .................................. 57

viii
FIGURE 3.19. HYDROTHERMAL DISSOLUTION AND REPLACEMENT OF FOSSILS ........................ 59
FIGURE 3.20. ELEMENT MAPS OF THE CEMENT FILLED FOSSIL VOIDS ........................................ 59
FIGURE 3.21. SILICA DISSOLUTION P-T GRAPH FOR QUARTZ ........................................................ 61
FIGURE 3.22. HYDROTHERMAL FLUID INTERACTIONS ...................................................................... 62
FIGURE 3.23. BEDDED SULPHIDE DEPOSITS IN THE HORN RIVER GROUP .................................. 63
FIGURE 4.1. NORTHWEST CORNER OF THE MACDONALD CREEK GEOLOGIC MAP .................... 69
FIGURE 4.2. MACDONALD CREEK GEOLOGIC MAP AND WELL LOCATIONS ................................. 71
FIGURE 4.3. QUARTZ - ORGANIC CARBON - CLAY ASSEMBLAGE TERNARY DIAGRAM ................ 72
FIGURE 4.4. OUTCROP AND SEM IMAGES OF LITHOLOGY TYPE 1 .................................................. 73
FIGURE 4.5. OUTCROP AND SEM IMAGES OF LITHOLOGY TYPE 2 .................................................. 75
FIGURE 4.6. OUTCROP AND SEM IMAGES OF LITHOLOGY TYPE 3 .................................................. 77
FIGURE 4.7. OUTCROP AND SEM IMAGES OF LITHOLOGY TYPE 4 .................................................. 79
FIGURE 4.8. TOC MATURITY IN MEASURED SECTION ...................................................................... 80
FIGURE 4.9. ORIGIN OF QUARTZ TYPES IN THE HORN RIVER BASIN ............................................. 84
FIGURE 4.10. K2O AND SIO2 GEOCHEMISTRY FROM OUTCROP, HORN RIVER GROUP .............. 85
FIGURE 4.11. SILICA CONTENT AND ROCK FABRICS FROM OUTCROP, BESA RIVER FORMATION .................................................................................................................................................................... 86
FIGURE 4.12. SILICA CONTENT AND ROCK FABRICS FROM SUBSURFACE, HORN RIVER GROUP .................................................................................................................................................................... 86
FIGURE 4.13. MONAZITE OCCURRENCES IN OUTCROP, BESA RIVER FORMATION ..................... 88
FIGURE 4.14. BA-BEARING MINERALS AND CHEMISTRY IN OUTCROP ........................................... 89
FIGURE 4.15. BA CONCENTRATION WITH DISTANCE FROM VENT IN OUTCROP AND SUBSURFACE ............................................................................................................................................ 89

1
Chapter 1: Thesis Introduction
1.1 Purpose of Study
The results of this study are presented in two related parts with the intent of achieving
two main objectives. The first objective is to demonstrate how X-ray fluorescence
analysis can be a valuable tool for developing geologic interpretations in sedimentary
rocks from a chemical composition perspective. X-ray fluorescence provides an
elemental breakdown of the rock sample in a relatively quick and inexpensive manner;
however, the instruments used in this project cannot detect elements lighter than Al.
This elemental data can be used to build a predictive model for estimating mineralogy,
TOC, REDOX conditions and rock mechanics data in organic shale using either core,
drill cuttings or outcrop samples. This information can be used for academic
applications such as sequence stratigraphy, paleo-environment reconstruction, or
sediment source studies. There are also practical applications in the oil and gas
industry where these data can be used for reservoir evaluation, reservoir geo-modelling
and well completions. In addition any models designed from vertical wells can be used
to provide that same information in a lateral production well from drill cuttings, where it
is difficult and expensive to collect data using conventional methods. I demonstrate
how the XRF analysis works in both subsurface and in outcrop.
The second objective is the use XRF and SEM analysis of rocks from the Horn River
Group and Besa River Formation to show that the deposition of these organic shale
packages are the result of tectonic activity and associated hydrothermal fluid

2
interactions. This paper directly challenges the commonly held belief that silica
cementation associated with these rocks is the result of biogenic siliceous oozes and
that restricted basin waters alone led to the reducing conditions required for organic
matter preservation (Chalmers et al., 2012). The biogenic model was introduced based
the ideas “that excess Si is partly due to biogenic sources because: 1) TOC contents
reach 4.8 wt.% and; 2) the Ti/Al ratio is relatively constant. Both of these factors suggest
coarse-grained clastic dilution was relatively low during deposition” (Bustin & Ross,
2009). This thesis presents data which support an alternative hypothesis, that the
dominant mechanism for silica cementation is syn-depositional hydrothermal fluid
interactions with sediments accumulation in the basin. Hydrothermal minerals including
hyalophane, celsian, and potassium feldspar are present in the form of cements
intermixed with the silica cement. There is also mineralization present in the Horn River
and Besa River consistent with SEDEX sulphide assemblages including pyrite,
arsenopyrite, chalcopyrite, and galena (Jowitt, 2013). Barite, a common SEDEX
mineral, is also present along with the rare earth phosphate monazite, both as
authigenic minerals. Sphalerite is also associated with pyrite in many samples. These
same fluids are the most likely cause for reducing and acidic conditions at the seafloor
which allowed for the preservation of the high total organic carbon (TOC). A mechanism
for these fluids to reach the surface is also provided. Extensional faulting during the
Devonian along deep seated basement faults created accommodation space for the
Horn River Basin, but also provided the conduits for which hydrothermal fluids enter the
basin.

3
1.2 Regional Considerations
There is substantial evidence of hydrothermal activity in the region during deposition of
the Horn River sequence (Figure 1.1). This includes hydrothermal venting and
dolomitization in age equivalent carbonates to the east (Slave Point and Keg River) as
identified by Aulstead and Spencer (1985) and Aulstead et al. (1987), and summarized
by Davies (2001). As well, the orientation of the Horn River Basin and Cordova
Embayment are the same as the basement faults and the margins of both basins are
associated with significant hydrothermal dolomitization creating prolific gas fields in the
adjacent carbonate platform.
Figure 1.1. Regional Time Equivalent Hydrothermal Ore Deposits. Hydrothermal SEDEX (black diamonds) and MVT (red stars) ore deposits, which formed at the same time as the Horn River Basin, are present to the west. Approximate borders of the Horn River Basin are also displayed and show the proximity of the basin to various hydrothermally formed ore bodies (dashed line). (Modified from British Columbia Ministry of Energy and Mines Open File 2000-22.)

4
To the west there are MVT-type lead-zinc deposits in the carbonate platform (Nelson et
al, 1998) and SEDEX deposits in Devonian-Mississippian shale within the Kechika
Trough (Paradis and Goodfellow, 2012). This logically suggests that there are also
hydrothermal influences in the region between the two, which is where the Horn River
Basin formed during the same time period. To both the east and the west there is
definitive evidence that hydrothermal fluids reached the surface during deposition of
time equivalent units. These same fault sets are present within the Horn River Basin
and must have been active and acting as conduits for hydrothermal fluids.
There must be a regional source and transportation mechanism in order for these
hydrothermal fluids to be present at the surface and within previously deposited rocks
over such a large area. There is strong evidence that several sets of regional
basement faults oriented NE-SW and NW-SE (Figure 1.2) were active during the
Devonian and Mississippian, but it does not appear that that is when they were first
created. The most likely source of these particular faults was the rifting episode during
which modern day Australia, Antarctica and South China were torn from the
supercontinent Rodinia approximately 750 Ma (Stewart, 2009). The fault zones and
associated hydrothermal events during the Paleozoic tend to follow the coast line of the
time, which is precisely where the remnant rift faults would have existed.

5
Figure 1.2. Local Time Equivalent Hydrothermal Ore Deposits. Hydrothermally dolomitized Devonian reefs are displayed in red (bottom right) and outline the edges of the Horn River Basin. Also displayed is the Horn River Basin and Cordova Embayment along with structurally formed terranes and basement faults imaged through seismic. The faults and are in the same orientations and the borders of the two basins and also shown are the gas fields (line filled areas) created by dolomitization of the reefs. (Modified from British Columbia Ministry of Energy and Mines Open File 2003-04.)
The movement on these fault sets appear to have been dominantly extensional and
strike-slip as presented in lithoprobe studies to the west in northwestern Alberta (Hope
et al, 1999). They also appear to responsible for the creation of large scale regional
features such as the Peace River Arch, Hay River Bank, Horn River Basin, and Cordova
Embayment. Although initial movements caused normal high angle faults from rifting
and extension during the Paleozoic, compression during subsequent orogeny episodes
may have led to some of these faults being converted into high angle reverse faults. It

6
is proposed that these active fault systems during sediment deposition in the Devonian
are the conduits for the hot hydrothermal fluids reaching the surface (Figure 1.2).
1.3 Geologic History of the Horn River Basin
The Horn River Basin likely formed over a relatively short time frame (less than 10 Ma);
however, the events leading up to its creation can be traced back to the breakup of
Rodinia between 265-445 Ma prior (Bogdanova et al, 2009). Evidence of these events
are presented in a series of paleomaps developed by Ron Blakey (2011). These
paleomaps were created by combining hundreds of geologic studies from various
authors work in North America.
Significant evidence is presented below that extensional faulting along the western
margin of ancient North America is what led to the formation of the Horn River Basin.
These faults appear to have been present prior to the basin forming, so how did they
get there? The most likely explanation is that they are remnant normal faults that were
created when Australia, Antarctica, and South China rifted away from North American.
Over time the rift zone moved progressively further away from the continental crust as
new oceanic plate formed, resulting in a passive margin along the west coast. This
passive margin existed until at least the Late Ordovician as displayed in Figure 1.3;
however, the faults created during rifting were still present within the continental crust.

7
Figure 1.3. Passive Margin in the Late Ordovician (485 Ma). This reconstructed paleomap of the Late Ordovician shows the continent of North America. On the west coast there is a passive margin. Along the passive margin are remnant extensional basement faults (red lines) created during rifting of the supercontinent Rodina (Modified from Blakey, 2011)

8
At some point between the Late Ordovician (~485) and Early Silurian (~430 Ma) a
subduction zone formed at great distance off the west coast of North America. This
subduction zone involved two oceanic plates designated as OP1 and OP2, the first of
which was attached to the North American craton. Based on reconstructions of the
island arcs associated with this subduction (Figure 1.4), OP2 was overriding OP1 at this
time, causing OP1 to sink. This is important for two reasons. First, OP1 sinking means
that as more of the plate dove down into the mantle the gravity pull exerted on the west
coast of North America would increase over time. Secondly, if OP2 is overriding OP1
then the subduction zone would move east over time and eventually collide with the
North American coast.
Global temperature is thought to have been quite warm during the Devonian and
supported extensive reef growth and carbonate shelled life. There was a shallow
seaway through North America in the Early Devonian, which covered the majority of
British Columbia and Alberta (Figure 1.5). This interior seaway was separated from
open ocean waters to the west by an extensive volcanic arc resulting from the
subduction of OP1 under OP2. Protection provided by the island arcs from open ocean
waters would help to create a series of massive barrier reef systems along the shallow
western interior seaway. It is also during the Early Devonian that some of the first
extensional fault movements likely occurred along the remnant fault systems because a
significant portion of OP1 had now been subducted and the gravity driven pull forces
resulting from that subduction would begin to have a larger effect.

9
Figure 1.4. Distant Subduction Zone in the Early Silurian (430 Ma). This reconstructed paleomap of the Early Silurian shows the continent of North America. On the west coast there is a passive margin. Along the passive margin are remnant extensional basement faults (red lines) created during rifting of the supercontinent Rodina. Off of the west coast a subduction zone has formed where oceanic plate 1 (OP1) began to subduct under oceanic plate 2 (OP2). The subduction of OP1 began to cause a weak pull on the western margin of North America. (Modified from Blakey, 2011)

10
Figure 1.5. Proximal Subduction Zone in the Early Devonian (400 Ma). This reconstructed paleomap of the Early Devonian shows the continent of North America. What was once a passive margin along the west coast now experiences extension due to strong pulling forces caused by the sinking of OP1 into the mantle. Initial extension occurs along remnant basement faults (red). The subduction zone is now just off the west coast with oceanic plate 1 (OP1) subducting under oceanic plate 2 (OP2). (Modified from Blakey, 2011)

11
In the Middle Devonian, reef systems and associated carbonates on the platform led to
the deposition of the Keg River Formation, which forms the bottom and initial edges of
the Horn River Basin. At this point in time gravity pull forces from subduction of OP1
would have been the greatest. In addition, the overriding volcanic arc and bending of
OP1 at the continental margin would create significant plate flexure providing further
extensional forces as demonstrated in Figure 1.6. This is the major extension and
rifting event which led to the deposition of the Horn River Basin. There is evidence that
this extension event occurred to the North in the Yukon and NWT, to the south in British
Columbia, and possibly to the south east into Alberta and through the United States
ending in the Gulf Coast (Mortensen, 1979).
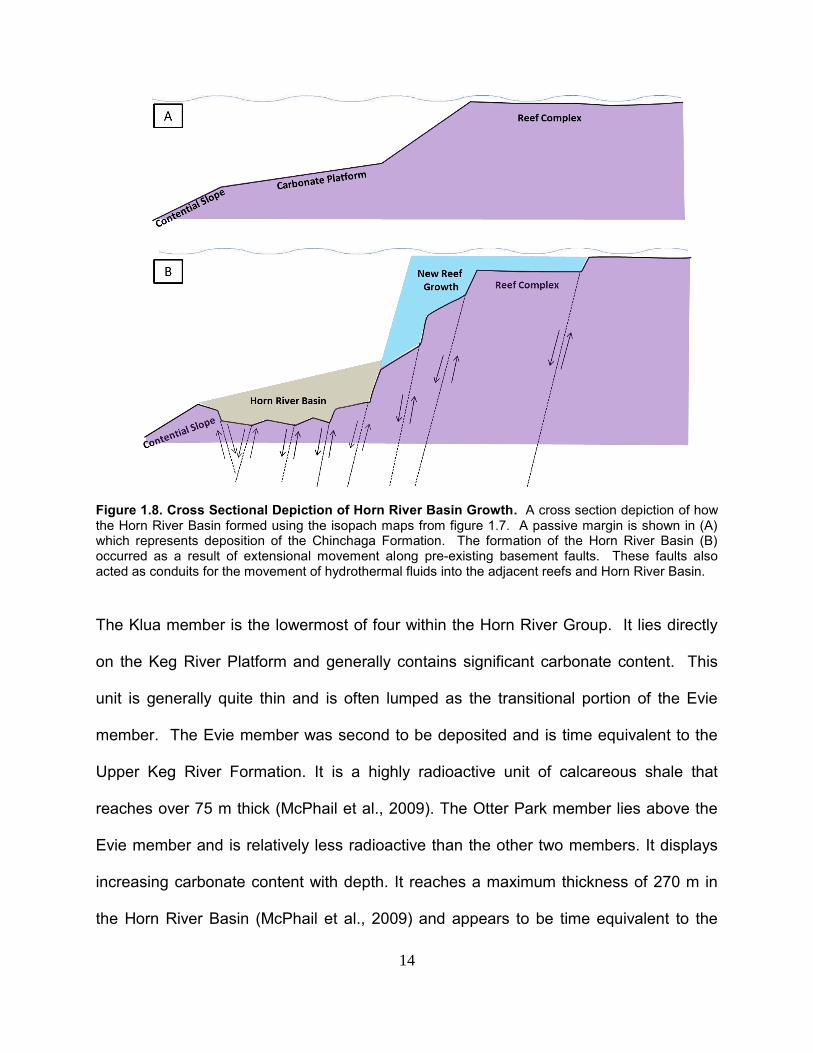
The Horn River Group appears to have been deposited during the Middle Devonian
from a relative sea level rise as a result of tectonic extension rather than a large eustatic
sea level rise. Blocks of the Chinchaga and Lower Keg River platform appear to have
dropped down over a short period of time. This can be seen when comparing isopach
maps of the Chinchaga Formation and Upper Keg River Formation with the associate
basement faults overlain (Figure 1.7 (A) and 1.7 (B)). The down-drop of these blocks
resulted in reef growth to the north, east, and south creating the edges of a new basin.
The accommodation space in this newly formed basin is where the Horn River Group
was deposited. A cross sectional representation depicts changes moving from a
passive margin to an active extensional basin in Figures 1.8 (A) and 1.8 (B).

12
Figure 1.6. Rifting and Extension During Middle Devonian (385 Ma). This reconstructed paleomap of the Middle Devonian shows the continent of North America. What was once a passive margin along the west coast now experiences extension due to strong pulling forces caused by the sinking of OP1 into the mantle and also plate flexure as the subduction zone approaches the continental crust. The extension occurs along remnant basement faults (red). Off of the west coast the subduction zone now approaches the point where oceanic crust is attached to continental crust, yet oceanic plate 1 (OP1) is still subducting under oceanic plate 2 (OP2). (Modified from Blakey, 2011)

13
Figure 1.7. Isopach Maps of Chinchaga and Keg River Formation. The comparison of isopach maps of the Chinchaga Formation (A) and Keg River Formation (B) show the timing of formation for the Horn River Basin and Cordova Embayment (dashed black lines). Basement faults which have similar orientations to the edges of both basins are overlain and likely had extensional motion during the Devonian. (Modified from British Columbia Ministry of Energy and Mines Open File 2003-04)
14
Figure 1.8. Cross Sectional Depiction of Horn River Basin Growth. A cross section depiction of how the Horn River Basin formed using the isopach maps from figure 1.7. A passive margin is shown in (A) which represents deposition of the Chinchaga Formation. The formation of the Horn River Basin (B) occurred as a result of extensional movement along pre-existing basement faults. These faults also acted as conduits for the movement of hydrothermal fluids into the adjacent reefs and Horn River Basin.
The Klua member is the lowermost of four within the Horn River Group. It lies directly
on the Keg River Platform and generally contains significant carbonate content. This
unit is generally quite thin and is often lumped as the transitional portion of the Evie
member. The Evie member was second to be deposited and is time equivalent to the
Upper Keg River Formation. It is a highly radioactive unit of calcareous shale that
reaches over 75 m thick (McPhail et al., 2009). The Otter Park member lies above the
Evie member and is relatively less radioactive than the other two members. It displays
increasing carbonate content with depth. It reaches a maximum thickness of 270 m in
the Horn River Basin (McPhail et al., 2009) and appears to be time equivalent to the

15
Slave Point reefs. The Muskwa member is the uppermost unit and is a highly
radioactive, siliceous and well cemented organic rich shale. Its upper surface forms a
conformable, gradational contact with the Fort Simpson Formation. It reaches a
maximum thickness of over 60 m in the Horn River Basin (McPhail et al., 2009).
Tectonic and hydrothermal activity was sporadic throughout the basin during deposition
of all members.
It is during the Late Devonian that the subduction zone and volcanic arc begin to collide
with North America (Figure 1.9). At this point OP1 is getting sheared off removing the
effects of gravity pull forces. The result is neutral or early compression along the North
American coast.
The Fort Simpson Formation represents a significant rise in relative sea level, possibly
the result of thermal contraction at the cessation of hydrothermal activity in the basin. It
is a thick basinal shale unit with higher clay content than the Horn River Formation and
lower TOC (Ross and Bustin, 2008). This shale reaches a thickness of up to 1000m and
is significantly compacted. It overtops the Slave Point reefs and extends much further
east, north and south than the Horn River Group. This suggests an overall deepening
of the seaway in addition to some sort of mechanism which prevented reef growth from
keeping up with subsidence. It is also during this time that hydrothermal events and
extensional faulting appear to begin shutting down.

16
Figure 1.9. Rifting and Extension During Late Devonian (360 Ma). This reconstructed paleomap of the Late Devonian shows the continent of North America. What was once a passive margin along the west coast now experiences extension due to strong pulling forces caused by the sinking of OP1 into the mantle and also plate flexure as the subduction zone approaches the continental crust. Off of the west coast the subduction zone and volcanic arc is just starting to collide with the continental crust. This collision begins to shear off OP1 from the North American continent. Rifting began to cease during this time which may have resulted in regional thermal subsidence (shaded red). (Modified from Blakey, 2011)
17
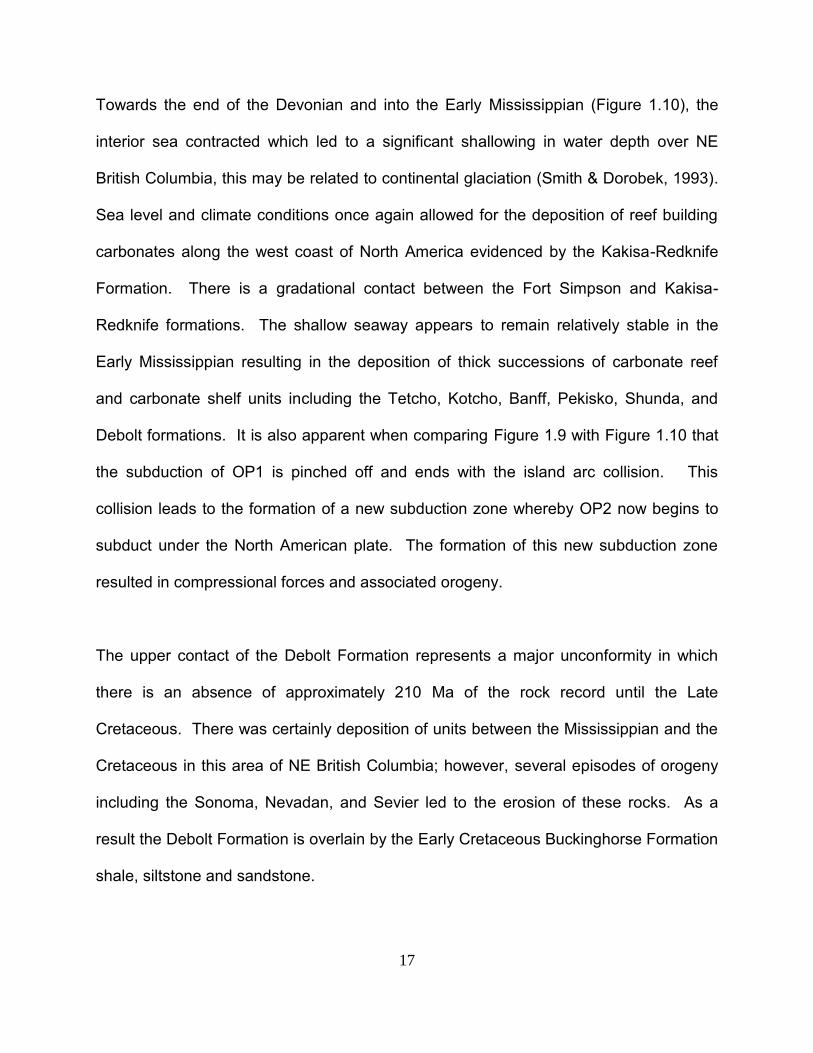
Towards the end of the Devonian and into the Early Mississippian (Figure 1.10), the
interior sea contracted which led to a significant shallowing in water depth over NE
British Columbia, this may be related to continental glaciation (Smith & Dorobek, 1993).
Sea level and climate conditions once again allowed for the deposition of reef building
carbonates along the west coast of North America evidenced by the Kakisa-Redknife
Formation. There is a gradational contact between the Fort Simpson and Kakisa-
Redknife formations. The shallow seaway appears to remain relatively stable in the
Early Mississippian resulting in the deposition of thick successions of carbonate reef
and carbonate shelf units including the Tetcho, Kotcho, Banff, Pekisko, Shunda, and
Debolt formations. It is also apparent when comparing Figure 1.9 with Figure 1.10 that
the subduction of OP1 is pinched off and ends with the island arc collision. This
collision leads to the formation of a new subduction zone whereby OP2 now begins to
subduct under the North American plate. The formation of this new subduction zone
resulted in compressional forces and associated orogeny.
The upper contact of the Debolt Formation represents a major unconformity in which
there is an absence of approximately 210 Ma of the rock record until the Late
Cretaceous. There was certainly deposition of units between the Mississippian and the
Cretaceous in this area of NE British Columbia; however, several episodes of orogeny
including the Sonoma, Nevadan, and Sevier led to the erosion of these rocks. As a
result the Debolt Formation is overlain by the Early Cretaceous Buckinghorse Formation
shale, siltstone and sandstone.

18
Figure 1.10. Subduction and Compression During Early Mississippian (345 Ma). This reconstructed paleomap of the early Mississippian shows the continent of North America. To the west is an oceanic-continental subduction zone (black) forming island arcs. The overriding plate has arrows pointing towards it, similar to the labelling of a thrust fault. A fundamental reversal in plate subduction occurred during this time where OP1 attached to North America gets pinched off and OP2 now begins subducting under North America. East of the subduction zone there are now compressional forces rather than extensional. Rifting is no longer active; however, there is still remnant regional thermal subsidence occurring (shaded red). (Modified from Blakey, 2011)

19
Chapter 2: Scientific Methods
2.1 Portable X-Ray Fluorescence (XRF)
X-Ray Fluorescence (XRF) analyses are rapid and relatively inexpensive. They give
information on the bulk rock chemistry in terms of both major elements and trace
elements. A portable XRF instrument (INNOV-X Instruments X-5000 model) was used
for this study and can achieve precise measurements for elements heavier than Mg;
however, this particular model cannot detect Mg. The analytical procedure is outlined in
Figure 2.1.
Figure 2.1. XRF Analysis. The procedure for performing XRF analysis is relatively simple. Drill cuttings are crushed in a mortar and pestle then placed into a special XRF sample cup provided by Chemplex. Each sample is run through “mining” and “soil” modes on the Innov-X X-5000 portable XRF unit. It takes roughly ten minutes to crush and run a sample through both modes.

20
Each sample was crushed into a powder using mortar and pestle in preparation for XRF
analysis then placed in a specially designed sample cup with mylar film on the bottom
which allows the passage of X-rays. Each sample must be run in two modes to collect
all the relevant chemical data. The first is “Mining Mode” which takes 120 seconds and
gives major elements related to the lithology of the rock (Si, Ca, Al, K, Fe, etc.). Next is
“Soil Mode” which requires 135 seconds and provides a list of trace element
concentrations (Mo, U, Th, Rb, Zr, Mn, etc.). The data for both modes are then
transported to EXCEL for processing and construction of the chemical stratigraphy logs.
The instrument needs to be standardized in order to ensure each element is calibrated
to the correct weight percent for a given analysis. Several separate instruments from
the manufacturer were standardized and during this process it was discovered that the
standardization for each is different. Standards used to obtain element abundance data
are two basalt and two shale standards from the USGS and two soil standards from the
US National Institute of Standards – NIST 2711a and NIST 2710a, plus quartz,
kaolinite, K-spar, dolomite, calcite and mixtures of these minerals. Each standard is
analyzed at least 5 times and these standard sets are checked periodically. Si, Al, Fe,
K, Ca and S are fit with polynomial best fit curves to achieve a calibration scheme while
remaining elements are fit to linear calibrations.
2.2 Scanning Electron Microscope (SEM)
Rock samples from the Fort Simpson and Horn River Group are generally composed of
fragments which fall into the silt or clay size range. These samples are also quite high

21
in TOC. The result is that standard visual thin section microscopy work is unable to
provide information in terms of mineralogy and rock fabric. Several SEM analysis were
performed on samples selected based on the XRF results in order to acquire this
information. The instrument available was the JEOL JXA 8200 Microprobe at the
University of Calgary. Drill cuttings for SEM analysis were selected and placed in a
vial. Cuttings were mixed with an epoxy resin. Once dry, pucks were cut, polished and
then carbon coated to allow for electron conductivity. Outcrop samples were also
saturated with epoxy resin then cut, polished, and carbon coated to create thin sections
suitable for SEM analysis.
2.3 X-Ray Diffraction (XRD)
X-ray diffraction (XRD) is a lab method for determining mineralogy. These data are
used as a reference for developing an XRF mineralogy model through normative
mineral calculations. Samples are prepared by crushing the rock with a pestle and
mortar into a fine powder. For simple bulk mineralogy the powders are simply placed in
a hold and analyzed. Some samples had clay separates analysis done whereby the
fine portion of the sample is removed. These fines are then subjected to air dried,
glycol and heat treatments to help determine the type of clays that are present.
Examples of XRD patterns from siliceous outcrop samples are displayed in figure 2.2.
The majority of these samples have a relatively simple mineralogy; quartz makes up
between 80 and 95 percent and illite or mica account for 5 to 20 percent by weight of

22
the minerals present. Pyrite is the only other mineral detected in most samples by XRD,
and appears to be present in trace amounts.
Figure 2.2. X-ray diffraction patterns for 20 quartz-rich samples. Samples contain quartz and illite or mica plus minor pyrite. A series of 20 different quartz rich sample patterns are overlain on each other to show how similar they are in terms of mineralogy.
Samples that are not quartz rich tend to have more complex mineralogy. Normative
mineral calculations applied to elemental data acquired through XRF can also be
compared with XRD results to test a mineralogy model. The results of such a test are
displayed in figure 2.3 which compares the XRD and XRF data from 24 samples
collected from a Besa River outcrop section. The XRF mineralogy model developed
from this test was used to analyze drill cutting samples from stratigraphic exploration
wells and horizontal production wells.
0
500
1000
1500
2000
2500
3000
5 10 15 20 25 30 35 40
degrees 2 theta
inte
nsity
illite/mica illite/micaillite/mica
quartz
quartz
pyrite
full scale14,000

23
Figure 2.3. XRD vs XRF Mineralogy. Mineralogy comparison of 24 samples analyzed by XRD and XRF. Elemental data acquired from the XRF analyses were run through normative mineral calculations to obtain mineral estimates.
2.4 TOC and Rock Eval Analysis
Rock eval analysis is a lab method used to analyze the organic content of a rock. The
rock is generally heated incrementally in an oven from 100ºC to 850ºC. The
hydrocarbons already present burn at the lowest temperature and are represented as
the S1 temperature peak in pyrolysis. The hydrocarbons produced and burned during
pyrolysis of the organics, which produce a second higher temperature peak, represent
S2. Trapped CO2 is also released at even higher temperatures and is proportional to
the amount of oxygen in the organics. This peak is called S3. Tmax is a measure of the
temperature at the top of the S2 peak and represents the maturity of the sample. As the
sample is heated it releases gases of various compositions from which the amount of C,

24
O and H are measured with special detectors. CO2 content measured during S2
relates to the amount of total organic carbon (TOC) present in the sample. The H is
converted into an index which is used to indicate the type of organic matter present and
its potential to produce oil or gas.
TOC values for the 24 samples from outcrop vary from 1.8 to 8.8 percent by weight.
Separate splits of two samples were analyzed for TOC and results varied by 0.25% in
one and just over 1.0% in the other. This is likely a result of sample heterogeneity. Tmax
values range from 326 to 610 degrees. However, many samples with Tmax values less
than 500 degrees did not have well defined peaks.

25
CHAPTER 3: SUBSURFACE APPLICATIONS OF
XRF AND SEM IN THE HORN RIVER BASIN,
BRITISH COLUMBIA, CANADA
3.1 Abstract
This study was undertaken in order to demonstrate basic portable X-Ray Fluorescence
(XRF) techniques which can be used to gather geologic information on subsurface
rocks. XRF uses low to moderate powered X-Rays to excite a material, which in turn
causes that material to emit a secondary X-Ray spectrum providing an elemental
composition. The XRF instrument used in this study is able to detect elements heavier
than Mg. The most significant benefit of portable XRF technology is its relative low cost
and efficiency. XRF analyses are up to three times more cost efficient than traditional
laboratory analysis in certain applications (Taylor et al., 2004). XRF analysis of drill
cuttings provide the ability to construct a reservoir model on vertical wells, which have
abundant lab and wire line data, then apply that model in order to chemically log
horizontal wells.
There are two parts to this study. The first section describes how basic
chemostratigraphy is used as an initial exploration tool in previously unstudied basins
(Ratcliffe et al., 2007) for both academic research and oil or gas exploration projects.
The second section focuses on the Fort Simpson Formation and Horn River Group. This

26
study demonstrates how basic XRF and SEM data are combined in a single model
which is used to interpret mineralogy, TOC content, rock mechanics, and depositional
history.
There is a general belief within academia and industry that silica cementation within the
Horn River Group is dominantly the result of biogenic siliceous oozes formed on the
seafloor during deposition (Ross & Bustin, 2008). The explanation for the presence of
the high TOC is that this basin was restricted early and therefore turned anoxic in the
presence of large amounts of organic matter. An alternative hypothesis is that
hydrothermal activity is the source of silica cementation which better explains the
presence of elevated TOC levels, hydrothermal minerals, discontinuous stratigraphic
intervals, sulphide ore deposits and variable compaction associated with the Horn River
Group. The mineralization is present in the form of pyrite, arsenopyrite, chalcopyrite,
and galena among others which are commonly associated with SEDEX deposits (Jowitt,
2013). Data indicate that hydrothermal activity may be one of the dominant processes
necessary for the creation of many black shale units and that there are likely different
classes of black shale.

27
3.2 Introduction
X-Ray Fluorescence (XRF) techniques can be used to gather geologic information on
subsurface rocks. XRF uses low to moderate powered X-Rays to excite a material,
which in turn causes that material to emit a secondary X-Ray spectrum. The emitted
spectrum consists of X-Rays of variable energies related to the elemental composition
of the material examined. A specialized detector captures the emitted spectrum and
identifies the amount and energy of each X-Ray over a specified time. The longer a
sample is analyzed the better the precision becomes. Once all the data for a sample
are collected they are run through elemental identification software which compares
known spectra for each element against that collected for the sample in question. The
energy patterns of X-Rays emitted allows for the identification of an element, while the
intensity or counts received for that pattern allows for the quantity of that element to be
determined. The most significant benefit of portable XRF technology is its relative low
cost and efficiency. XRF analyses are up to three times more cost efficient than
traditional laboratory analysis in certain applications (Taylor et al., 2004).
The major rock forming elements are plotted against each other to determine
mineralogy and establish interpretations of lithology. Traditional methods such as
wireline logs, biostratigraphy and seismic reflectance are used in conventional
reservoirs to make inter-well correlations. These methods become far less effective in
barren or thick mudrock sequences (Pearce et al., 2005). The major rock forming
elements acquired through XRF methods are excellent for identifying rock formations
and sub-units in the subsurface which can be correlated from well to well. XRF analysis

28
also yields a large quantity of chemical information on trace elements. Trace elements
related to TOC are used to locate zones with a high source rock potential, even though
carbon itself is too light to detect using XRF. The standardization of methods and
accuracy of the XRF instrument allows for quantitative comparisons of each rock
forming element and various trace elements, which enables quantitative evaluation of
rock composition. Quantitative evaluation is a valuable tool in oil and gas exploration
for locating conventional reservoirs, source rocks and for reservoir modeling. In
academic geology research there are applications in the fields of sequence stratigraphy,
sedimentary stratigraphy and mineralogy.
The second section focuses on the Fort Simpson Formation and Horn River Group to
demonstrate how basic XRF and SEM data are combined in a single model to
determine mineralogy, TOC content, rock mechanics and depositional history. There is
a general belief within academia and industry that silica cementation within the Horn
River Group is dominantly the result of biogenic siliceous oozes formed on the seafloor
during deposition. This idea appears to gain its origins from a Ross and Bustin (2008)
publication where it is suggested that origin of quartz in organic shale can be either from
a detrital or biogenic source. An alternative idea is that hydrothermal activity is the
source of silica cementation which better explains the presence of elevated TOC levels,
the presence of minerals associated with hydrothermal activity, discontinuous
stratigraphic intervals, sulphide ore deposits and variable compaction associated with
the Horn River Group sediments. It is likely that hydrothermal activity is one of the

29
dominant processes for the creation of many black shale units and that there are likely
different classes of black shale.
The samples in this study consist of cleaned drill cuttings collected from two vertical gas
well locations in NE British Columbia. The pilot holes are approximately 2800m from
surface to total depth (TD) and pass through Cretaceous, Mississippian and Devonian
formations which consist of carbonate and siliciclastic rocks. The target formation for
both wells is the Middle Devonian Horn River Group which is underlain by the Middle
Devonian Lower Keg River Formation and overlain by the Late Devonian Fort Simpson
Formation. Cuttings were collected at 5m intervals which is standard procedure in oil
and gas operations.
3.3 Study Area and Sample Collection
The Horn River basin consists of Devonian, Mississippian, and Cretaceous strata
located northeast of Fort Nelson British Columbia extending into the Northwest
Territories. The study area for this project is located in the northern portion of the Horn
River Basin just south of the NWT border (Figure 3.1). The operator in this area is
Quicksilver Resources Canada, who provided all samples and wireline data.
Drill cutting samples were collected every 5m and come from two separate vertical wells
located within the study area. A total of 518 drill cutting samples covering 2600m of
vertical well were analyzed from QUICKSILVER HZ DIANE C-049-E/094-O-16. An
additional 391 samples from two lateral wells associated with C-049-E were also

30
analyzed. A second well, QUICKSILVER HZ TATTOO B-091-G/094-O-15, had 548 drill
cutting samples covering 2735m of vertical well analyzed. Standard wireline log suites
were provided for each well with dipole sonic data for determining rock mechanics.
Figure 3.1. Horn River Basin Study Area. The study area is located in the northern portion of the Horn River Basin outlined by a black box. The Horn River Basin in located in the NE portion of British Columbia. Outlined and labeled are locations of several interpreted late-Devonian Era features. 3.4 Basic XRF Subsurface Exploration
General XRF analysis can be conducted over an entire vertical well interval in order to
locate potential areas of interest for both industry and academic applications. Areas of
interest are located through XRF using relatively simple interpretations such as
molecular percentages and TOC estimates to screen out samples for more expensive
or time consuming lab analyses.

31
3.4.1 Molecular Percentages
Molecular percentages are a simple way to look at the basic building blocks of the main
rock forming minerals. These are developed from the calibrated raw elemental values
of Ca, Si, Al, K, Fe, and S. Results are displayed graphically in figures 3.2 and 3.3 for
the two wells along with wireline gamma ray data.
Figure 3.2. Molecular Percentages (C-049-E). Percentage by weight of oxides, CaCO3, and FeS2. Natural gamma radiation curve from wireline logs has also been included. Each formation is labeled and separated by a dashed red line. Even with minimal processing of the XRF data there are obvious chemical differences in the rock which can be used for academic or commercial purposes. Note scales are different for each.
Each formation can be distinguished with relative ease using basic molecular
percentage log suites. The relative purity of carbonate or sandstone packages can be
estimated using the CaCO3 and SiO2 curves, which are useful for hydrocarbon
exploration. The SiO2 plots contain dashed lines to represent the rough amount of

32
SiO2 present as quartz while the solid line displays total SiO2 contained in all minerals.
If the dashed SiO2 line is on top of the solid SiO2 line then all the SiO2 is suggested to
be present as quartz.
Figure 3.3. Molecular Percentages (B-091 G). Percentage by weight of oxides, CaCO3, and FeS2. Natural gamma radiation curve from wireline logs has also been included. Each formation is labeled and separated by a dashed red line. Even with minimal processing of the XRF data there are obvious chemical differences in the rock which can be used for academic or commercial purposes. Note scales are different for each.
The K2O and Fe2O3 are displayed on a smaller scale. These two oxides, along with
Al2O3, are generally related to the clay mineralogy. Generalizations can be made
about the minerals present even though the compositions of minerals, particularly clays,
vary through the stratigraphy. K2O is primarily found in illite and mica minerals. Fe2O3
is present in illite, mica, chlorite, smectite and glauconite clays as well as in some
carbonates. Examining the relationship between the Al2O3, K2O and Fe2O3 can help

33
determine the types and quantities of clay present within a specific unit. The clay types
and compositions tend to be formation specific, so that a predictive mineralogy model
can be developed through a combination of XRF, XRD and SEM work.
3.4.2 Redox Conditions and TOC Indicators
The detection of carbon is not possible with XRF because it is too light. Carbon gives
off low energy X-Rays which are adsorbed in air and heavier elements give off spectra
which interfere with carbon to mask its signature. However, the trace elements Ni, Mo,
V, and U are associated with organics and can be detected by XRF. Concentrations of
Ni and V preserved in sediments above 100 PPM, which is the case in the Horn River
Group, are associated with kerogen from marine algae (Lewan & Maynard, 1982). U
accumulates on or within organics while Mo is captured in associated sulphides under
reducing conditions and both remain if the sediments do not get oxidized (Kowalski et
al., 2009). Combinations of these specific trace elements are used to predict zones of
higher and lower TOC as displayed in figures 3.4 and 3.5.
Redox-sensitive trace metals (U, V, and Mo), which are soluble under oxidizing
conditions but precipitate (or adsorb) under anoxic conditions, are used to identify the
redox state of sediments (Morford et al., 2005). The S content also correlates closely
with these and appears to be contained either within the organics or as part of the
sulphides formed under reduced conditions. In certain areas the S and Fe increase
dramatically while the other TOC indicators drop. This indicates there is pyrite, which

34
may not be entirely related to bacterial reduction of organics but also to other processes
such as precipitation from hydrothermal fluids or alteration of minerals.
Figure 3.4. Redox Conditions and TOC Indicators (C-049-E). Trace elements and minerals related to organics are displayed with measured depth. Areas highlighted with color have indicators for the accumulation and preservation of organic matter. Note scales are different in each track.
The trace element Mn can also be used to help determine redox conditions during
deposition. Mn will tend to be mobilized out of the sediments and into the overlying
seawater under reducing conditions (Morford et al., 2005), thus resulting in low
preservation in the rock record. Any significant accumulation of Mn in the rock
chemistry is a strong indication that these rocks were deposited under oxidizing
conditions and organic carbon is unlikely to be preserved. In general, a strong inverse
relationship between the amount of Mn present in the rock and both FeS2 and TOC

35
content is observed. Where organics are destroyed under oxidizing conditions, the U
and Mo tend to be mobilized while the V is more resistant and can accumulate within
the sediments. It is likely that V can be used as an indicator for primary original organic
production, while Mo and U show areas where those organics are preserved.
Figure 3.5. Redox Conditions and TOC Indicators (B-091-G). Trace elements and minerals related to organics are displayed with measured depth. Areas highlighted with color have indicators for the accumulation and preservation of organic matter. Note scales are different in each track.
There are several changes in TOC indicator levels through the wells as displayed in
figures 3.4 and 3.5. The intervals with high organic carbon accumulation are highlighted
with color. These intervals include the Buckinghorse Formation, Exshaw Formation and
the Horn River Group. Each of these intervals has elevated Mo, V, U, and FeS2 and a
decrease in Mn. The actual amount of Mo, U, and V present in the organics can vary

36
significantly depending on the organic source and the water conditions during the time
of deposition. This makes it difficult to directly compare source rocks from different
formations to determine which has a higher TOC content. However for a single
formation, intervals with higher TOC indicators are likely to have higher TOC values.
The concentrations of trace elements are related to the original TOC content and that
portion which was preserved. No relationship has been established between trace
element chemistry and the maturity of the source rock. If the organic content has
decreased due to maturation and hydrocarbon expulsion then the TOC indicators
predict higher TOC than is actually present.
3.5 XRF and SEM Analysis of Fort Simpson Formation and Horn River
Group
3.5.1 Molecular Percentages
The Horn River Group and a portion of the lower Fort Simpson Formation are examined
in this section. The molecular percentages for each well in this interval are displayed in
figures 3.6 and 3.7.
Carbonate markers within the Fort Simpson Formation include the informal Victoria
Scarp and the Marechal Horizon. These markers appear to be carbonate debris flow
beds based on SEM analysis showing a mixture of sand to clay sized particles. The
Horn River Group is broken into its members, which in this area include the Muskwa,

37
Otter Park, Evie and Klua. Below the Klua Member is the top of the Keg River
Formation. Comprehensive descriptions for each Horn River Group member are
available in literature (McPhail et al., 2009).
Figure 3.6. Horn River Group Molecular Percentages (C-049-E). Percentage by weight of oxides, CaCO3, and FeS2 are displayed with depth. Natural gamma radiation curve from wireline logs are also included. Each subunit of the Horn River Group and Fort Simpson is labeled and separated by a dashed red line. Even with minimal processing of the XRF data there are obvious chemical differences in the rock which can be used for academic or commercial purposes. Note scales are different for each.
The SiO2 curves in both wells show a significant increase in the amount of SiO2
estimated to be in quartz in the Horn River Group relative to the Fort Simpson
Formation. There is also a significant decrease in total amounts of Al2O3, K2O and
Fe2O3 in the Horn River Group relative to the Fort Simpson Formation. These two
trends show that although both the Fort Simpson Formation and Horn River Group are
composed of shale and clay sized grains, their quantitative mineral compositions are

38
very different. The relative proportions of Al2O3 to K2O and Fe2O3 suggest no
significant differences in the clay composition.
Figure 3.7. Horn River Group Molecular Percentages (B-091 G). Percentage by weight of oxides, CaCO3, and FeS2 are displayed with depth. Natural gamma radiation curve from wireline logs are also included. Each subunit of the Horn River Group and Fort Simpson is labeled and separated by a dashed red line. Even with minimal processing of the XRF data there are obvious chemical differences in the rock which can be used for academic or commercial purposes. Note scales are different for each.
3.5.2 Mineralogy
Major element data are used to estimate mineral percentages through normative
mineral calculations. The dominant minerals are calcite, quartz, Ba-feldspar
(hyalophane), albite, a well crystalline illite or mica, chlorite, kaolinite and pyrite based
on extensive SEM and elemental mapping. There is also Mg and Fe-rich dolomite
present in the Horn River Group and Fort Simpson Formation; however without the
ability to detect Mg, all the carbonate is simply calculated as calcite using the measured

39
Ca. The mineral compositions are important when doing normative mineral calculations
in order to get accurate totals. Each mineral composition is displayed in table 1 for the
Horn River Group. These compositions were determined from SEM spot analysis
averages on 3-8 crystals for each mineral type. Limiting factors used in the normative
mineral calculations are highlighted in yellow for each mineral. The order for conducting
the calculations are the same as displayed in the table starting with pyrite and ending
with quartz.
Table 3.1. Horn River Group Mineral Compositions. The compositions of each mineral in the Fort Simpson Formation and Horn River Group are displayed as determined by SEM analysis. Highlighted in yellow are the limiting factors for each mineral used in normative mineral calculations.
Results from the normative mineral calculations are displayed in figures 3.8 and 3.9.
The Fort Simpson Formation is dominantly composed of inorganic siliciclastic shale.
This shale tends to be un-cemented and highly compacted. Significant amounts of
pyrite are present near the Victoria Scarp and increase in concentration moving towards
the Horn River Group.
There are major differences in the mineralogy of the shale between the Fort Simpson
Formation and the Muskwa member. The carbonate content increases slightly, there is
also a large increase in quartz content and large decrease in clay content. Pyrite
concentrations jump to around 2.5% by weight in the Muskwa member and Ba-feldspar
increases as well. There is generally an increase in carbonate content from the

40
Muskwa member to the Klua member in this portion of the Horn River Basin. Shale
packages within the Horn River Group vary from having poor to well cemented fabrics
and compaction appears to be quite low. The dominant cement type encountered is
quartz; however, in some intervals there are dolomite and calcite fracture fills. Although
both the Fort Simpson Formation and Horn River Group are considered shale by grain
size, they are very different compositionally.
Figure 3.8. Mineral Percentages (C-049-E). Percentage by weight of calcite, quartz, Ba-feldspar, Illite/mica, chlorite, kaolinite, and pyrite determined from XRF normative mineral calculations. Each subunit of the Horn River Group and Fort Simpson Formation is labeled and separated by a dashed red line. Note scales are different for each mineral.
The minerals related to initial deposition and early digenesis in both the Fort Simpson
Formation and Horn River Group are silt to clay sized quartz, K-spar, dolomite, calcite,
illite/mica, chlorite, organic matter and pyrite. The pyrite does not appear to be detrital;

41
rather it is present in two different forms. The first is framboidal, formed under reducing
conditions during deposition and early diagenesis. This type of pyrite is strongly
associated with the preserved organic matter. The second type of pyrite is similar to
that in SEDEX deposits and occurs as continuous layers or nodules up to several
centimeters thick in association with other sulphides unusual in sedimentary deposits.
Figure 3.9. Mineral Percentages (B-091-G). Percentage by weight of calcite, quartz, Ba-feldspar, Illite/mica, chlorite, kaolinite, and pyrite determined from XRF normative mineral calculations. Each subunit of the Horn River Group and Fort Simpson Formation is labeled and separated by a dashed red line. Note scales are different for each mineral.
Reducing conditions are interpreted to be caused by highly saline and dense
hydrothermal fluids reaching the seafloor through fracture and fault systems. These
fluids came into contact with the cold sea water and caused silica cement, albite to
hyalophane alteration, Ba-feldspar cements, and sulfide precipitation. This second set

42
of minerals are also formed early in the depositional phase as many of the heavily silica
cemented rock units have little to no compaction visible.
Above the Keg River Formation the carbonate units appear to be largely composed of
debris flow deposits consisting of detrital dolomite, calcite, quartz, and minor amounts of
clay when examined under SEM. These are most prevalent in the Horn River Group;
however, they do appear sporadically in the Fort Simpson Formation. One of the main
triggers for debris flows is seismic events due to tectonic movement along fault lines.
They can also occur naturally from sediment build up and collapse on slope faces;
however, these are interpreted to be tectonically triggered because of the presence of
active extensional faulting during this time. The fact that there are a significant number
of these within the Horn River Group suggests that this was a very seismically active
period compared with the Fort Simpson Formation above.
The transition from the Keg River Formation deposits up through the Horn River Group
and into the Fort Simpson Formation is interpreted as a significant transgression. This
is because the rock sharply transitions from a coarse grained shallow carbonate reef
deposit into a quartz and clay mineral siliciclastic unit composed of clay and silt sized
grains. Debris flow deposits and a marine transgression are two strong lines of
evidence to suggest active fault movement caused the formation of the Horn River
Basin. Active faulting in the region also provides a source for hydrothermal fluids to
enter into the basin.

43
3.5.3 Redox Conditions and TOC Indicators
The presence of high TOC content in the Horn River Group but not the Fort Simpson
Formation is interesting. Indicators for redox conditions and TOC are displayed in
figures 3.10 and 3.11. Vanadium is used as a relative indicator for organic productivity
at the time of deposition. This is because Vanadium accumulates in marine algae and
bacteria as part of the photosynthesis process (Lewan & Maynard, 1982). Vanadium is
also less sensitive to redox conditions than Mo or U which allows it to be preserved
under either reducing or slightly oxidizing conditions (Emerson & Huested, 1991).
Therefore, Vanadium can be preserved in the rock record even if the organics are
destroyed. The Vanadium content is high in the Horn River Group and although there is
a slight decrease moving into the Fort Simpson Formation, it remains elevated
throughout. This indicates that there was significant organic production during the
deposition of both units.
Indicators for redox conditions show that the Horn River Group was deposited under a
reducing environment with a gradual change to oxidizing conditions in the Fort Simpson
Formation. These changes are visible in both the Mn and FeS2 curves for both wells.
Increases in the Mn content suggest the waters became progressively more oxidizing
above the Horn River Group; the decrease in pyrite over the same interval also supports
this. This helps to explain why organic matter is preserved in the Horn River Group but
not in the Fort Simpson Formation. It does not appear to be a case where the organic
production ceased above the Horn River Group, but rather a situation where the
organics were oxidized and destroyed. The reducing environment within the Horn River

44
Group is interpreted as the result of stratification of high density hydrothermal fluids
which move upward along active faults within the basin. The presence of SEDEX like
deposits as layers and nodules within the Horn River Group also provide evidence that
these fluids were reducing.
Figure 3.10. Horn River Group Redox Conditions and TOC Potential (C-049-E). Trace elements and minerals related to organics are displayed with measured depth. Areas highlighted with color have indicators for the accumulation and preservation of organic matter. Each subunit of the Horn River Group and Fort Simpson Formation is labeled and separated by a dashed red line. Note scales are different in each track.
The trace elements Mo and U along with pyrite content can be used to estimate TOC
within a particular formation even if C is too light to detect with the XRF instrument. Lab
measured TOC values are not available as reference data for this study for comparison;
however, it is possible to construct a weighted algorithm to accurately predict the TOC

45
content where lab data are available. This has been successfully achieved in the
outcrop study as well as for the Duvernay and Montney formations.
Figure 3.11. Horn River Group Redox Conditions and TOC Potential (B-091-G). Trace elements and minerals related to organics are displayed with measured depth. Areas highlighted with color have indicators for the accumulation and preservation of organic matter. Each subunit of the Horn River Group and Fort Simpson Formation is labeled and separated by a dashed red line. Note scales are different in each track.
3.5.4 Hydrothermal Trace Metals
The detection of certain trace metals through XRF analysis provides additional data to
determine the source of specific minerals and the depositional and diagenetic
environments. Trace metals provide very strong evidence of hydrothermal
mineralization and cementation during deposition and early diagenesis in the Horn River

46
basin. Trace metal components which indicate hydrothermal influences are displayed in
figures 3.12 and 3.13.
Figure 3.12. Hydrothermal Trace Metals (C-049-E). Specific trace metal concentrations can be used to locate areas of suspected mineralization or cementation. Above are trace metals and minerals which commonly form in SEDEX deposits plotted with elevation. Quartz/Zr is also shown to indicate areas which are quartz cemented. Each subunit of the Horn River Group and Fort Simpson Formation is labeled and separated by a dashed red line. Note that the scales are different for each curve.
The first set of metals related to mineralization of the sediments are Ni, Cu, Zn, Pb and
As along with the mineral pyrite. Each of the trace metal concentrations is divided by
the total amount of clay present in each sample. This is because some of these metals
also accumulate on clay minerals. Normalizing the metal concentrations to the total
clay clearly shows where there is far more metal present than can possibly be
contributed by the available clay. There is clear evidence that the Horn River Group
and portions of the Keg River Formation have been mineralized.

47
Figure 3.13. Hydrothermal Trace Metals (B-091-G). Specific trace metal concentrations can be used to locate areas of suspected mineralization or cementation. Above are trace metals and minerals which commonly form in SEDEX deposits plotted with elevation. Quartz/Zr is also shown to indicate areas which are quartz cemented. Each subunit of the Horn River Group and Fort Simpson Formation is labeled and separated by a dashed red line. Note that the scales are different for each curve. Outcrop and SEM observations show that the mineralization is in the form of sulphide
layers and nodules up to several centimeters thick. Sulphide minerals visually identified
by SEM are pyrite, chalcopyrite, arsenopyrite, and sphalerite. The exact mineral which
is responsible for elevated Ni is uncertain at this time; however, pentlandite is one
possibility. The combination of elements and sulphide minerals observed within the
Horn River Group is similar to other Devonian age SEDEX deposits in Western Canada
(Orberger et al., 2005).

48
It is also possible to separate detrital quartz content from quartz cement using the trace
element Zr. Zirconium is present in the resistant mineral zircon, which originates in
igneous or metamorphic rocks. These zircon minerals have a tendency to accumulate
in a consistent ratio with the detrital quartz; either because both minerals are chemically
and physically resistant or that small zircon inclusions are present in detrital quartz
grains. The ratio at which these minerals accumulate can be different for rocks
deposited from different source rocks; however, if the source remains the same then so
will the ratio.
This is clearly evident for rocks in the Fort Simpson Formation which have a consistent
quartz/Zr ratio (Figure 3.14). This ratio provides a baseline for quartz which is present
in the rock as a detrital component. The quartz/Zr increases significantly in the Horn
River Group and is also variable. If we assume the source for the Horn River Group
siliciclastics is the same as for the Fort Simpson Formation, then there is more quartz in
the rock than should be present from detrital input. This additional quartz is present in
the form of cement. The amount of quartz cement present in a sample is directly
related to how high above the baseline the quartz/Zr ratio is.
There are two basic end members of rock fabrics present in both the Fort Simpson
Formation and the Horn River Group. One is a fully detrital fabric which contains high
clay content and shows significant compaction. The second is a heavily quartz
cemented fabric which has a relatively low clay content and is only slightly compacted.
This second form is essentially chert.

49
Figure 3.14. Hydrothermal Silica Cement (C-049-E). These data show a strong correlation between the overall quartz content and the Quartz/Zr ratio. Where the Quartz/Zr ratio is higher there is quartz cementation. Also there is a strong correlation between the quartz cementation and the Poisson’s Ratio value for the rock which suggests mineralogy and rock fabric control mechanical properties.
The quartz/Zr ratio is displayed in relation to the total quartz present for both formations
in figure 3.14. There is also a Poisson’s Ratio curve calculated from measured sonic
and density wireline logs. These three curves together show that there is a relationship
between the quartz/Zr ratio and the amount of quartz cement present, but also that the
quartz cementation significantly affects the mechanical properties of the rock.
Increases in the amount of quartz cement and decreases in the amount of clay in a rock
cause it to become more brittle.

50
The mechanical properties appear to be fabric controlled and each mineral contributes
to the make-up of a specific fabric. Understanding these relationships makes it possible
to predict the mechanical properties of a rock using only the calculated mineralogy and
fabric.
3.5.5 Mechanical Properties
The mechanical properties of an unconventional shale reservoir are very important in oil
and gas exploration. If a rock is too ductile or too strong it may not be possible to
hydraulically fracture the rock. Quartz and feldspars are all relatively brittle (low
Poisson’s Ratio) with variable rock strengths (Young’s Modulus). Calcite and dolomite
have very high Poisson’s Ratio and Young’s Modulus. This causes these minerals to
be relatively ductile but quite strong. Most clay types can generally be considered to
have a low Poisson’s Ratio and a low Young’s Modulus; however, anisotropic minerals
such as illite or mica can be ductile in one orientation and brittle in another. High
concentrations of these clays can have a negative impact on hydraulic fracturing by
making the rock too ductile or allowing fractures to close over time due to embedment.
A Poisson’s Ratio value of less than 0.25 is selected as a cutoff for indicating potential
fracture success. This cutoff is commonly used in oil and gas reservoirs, including the
Horn River Group, for attempting hydraulic fracturing. Above that value the rocks may
be too ductile to fracture successfully. No firm cutoff for Young’s Modulus has been
established. Young’s Modulus can change significantly with burial depth and tectonic

51
stresses within the formation. Young’s modulus seems to play a role in pressures
required for a hydraulic fracture to take rather than the chance of the fracture initiating.
An algorithm for predicting Poisson’s Ratio and Young’s Modulus from XRF data has
been developed based on the relationship of mineralogy and rock fabric, which is
tailored to the Fort Simpson Formation and Horn River Group. These results are
displayed in figures 3.15 and 3.16. The XRF calculated data are compared against
Poisson’s Ratio and Young’s Modulus values calculated from wire line sonic and density
logs. Comparison of the data sets tends to produce a correlation of about 80-90% for
Poisson’s Ratio and Young’s Modulus. There is more difficulty in accurately calculating
Young’s Modulus using only mineralogy because small amounts of a mineral present as
cement can dramatically increase the strength of the rock depending on what mineral is
present as cement and how the cement forms. Both values are mineralogy, fabric, and
stress dependent which is why the algorithm cannot be applied universally to any
formation without adjustments.
The algorithms for both Poisson’s Ratio and Young’s Modulus are calculated by first
grouping the minerals into detrital or cement categories. Then each mineral is given a
mechanical property value, which is multiplied by the weight percent of that mineral for
the total rock. If the density of each mineral is known this calculation can also be done
using volume percent, which yields more accurate results.

52
Figure 3.15. Poisson’s Ratio. Poisson’s Ratio calculated using the mineralogy in orange and from wireline sonic and density logs in black. Each subunit of the Horn River Group and Fort Simpson Formation is labeled and separated by a dashed red line.
Most minerals fall into one category or the other; however, in this case quartz has both
a detrital and cement component. Quartz is separated into a detrital component and
cement component for each sample using a quartz/Zr baseline ratio of 0.3. Any
samples which are on or below the baseline are considered to be completely detrital. If
a sample is above the baseline, the quartz/Zr ratio is divided by the baseline value of
0.3. A result of 1 indicates the sample is entirely detrital. If the result is above 1, then
the result is divided by 1 to provide a percentage of the total quartz which is present as
detrital grains. The remainder is present as quartz cement.

53
Figure 3.16. Young’s Modulus. Young’s Modulus calculated using the mineralogy in orange and from wireline sonic and density logs in black. Each subunit of the Horn River Group and Fort Simpson is labeled and separated by a dashed red line.
An example of the calculation is given below:
Total Quartz = 60% by weight
Quartz/Zr = 0.87 Wt. %/PPM
Baseline = 0.30 Wt. % /PPM
Total Detrital Quartz = 1/ (0.87/0.30) x 60% = 1/ (2.90) x 60% = 20.69%
Total Quartz Cement = 60.00% - 20.69% = 39.31%

54
Detrital quartz, feldspar, calcite, and clay minerals in the Fort Simpson Formation and
Horn River Group are placed into the detrital category. Quartz cement and pyrite are
placed in the cement category. The total weight or volume percentages are normalized
to sum to 100%.
The next step in calculating either Poisson’s Ratio or Young’s Modulus is to assign rock
property values for each mineral in the calculation. For example crystalline quartz has a
Poisson’s Ratio of approximately 0.08 (White et al., 1992). The final step is to assign a
value for each mineral based on mineral fabric. If all components are detrital this can
be set as 1. This indicates that a rock is simply composed of detrital grains and is
essentially the sum of all its parts. However, if the mineral component is cement, this
value is greater than 1 as the cement begins to dominate the mechanical properties of
that rock. In other words if a rock is cemented the cemented portion has a much
greater effect on the mechanical properties of the rock and must therefore be weighted
higher. If there is an increase in any of the weighting factors, there must be a decrease
in another so that the sum of all the weighting factors is equal to a whole number.
There may also be the need to provide a shift factor when comparing the calculated
value to wireline log calculated mechanical properties. This shift value takes into
account effects on mechanics properties that are not mineralogical controlled such as
burial depth, compaction and formation stresses.

55
An example equation for Poisson’s Ratio is provided below:
PRRock = (.95)(PRQtz)(QtzDet %) + (.95)(PRFeldspar)(Feldspar %) +
(.95)(PRClay)(Clay %) + (.95)(PRCalcite)(Calcite %) +
(1.2)(PRQtz)(QtzCmt %) + (1.0)(PRPyrite)(Pyrite %) + (Shift Factor)
This is a starting point for calculating mechanical properties; however, a reference data
set is required in order to calibrate the equation. Once a reference data set is in place
and both curves are plotted in a single graph then adjustments to the weighting factors,
mineral properties and shift factor need to be made in order to get a strong correlation.
3.5.6 Horizontal Well Applications of XRF
The main goal of developing XRF techniques for calculating mineralogy, TOC, trace
metals indicators and rock mechanics in vertical wells is to apply these same
techniques in horizontal wells. Oil and gas operators are currently very limited in the
amount of data they can collect in horizontal production wells due to the cost, risk, and
simple mechanics of trying to log these wells with conventional wireline tools. However,
these production wells are exactly where the most information is required in order to
effectively and affordably induce hydraulic fractures, which control both short and long
term production.

56
This study used only drill cuttings because drill cuttings are what can be collected along
horizontal wells for no additional cost, risk or rig time. A basic look at two lateral wells
off the QUICKSILVER HZ DIANE C-049-E/094-O-16 pad are provided in figure 3.17 to
show how there can be significant variation both along a single lateral well and between
two lateral wells targeting the same horizon.
Figure 3.17. Applications of XRF in Horizontal Wells. Combined chemical logs for two laterals from the QUICKSILVER HZ DIANE C-049-E/094-O-16 pad are displayed.
3.5.7 Hydrothermal vs Biogenic Silica Cement
The combination of high TOC and high quartz cement content for inducing hydraulic
fractures is what makes the Horn River Group such a good unconventional gas

57
reservoir. A common belief in industry today is that the dominant source of silica
cement in the Horn River Group was provided by biogenic activity in the form of
sponges and radiolarians during deposition. Work using SEM in the Horn River shows
that there is simply a lack of these fossils in sufficient numbers to create the amount of
cement which is present. An example of a heavily cemented Horn River sample is
displayed in figure 3.18.
Figure 3.18. Heavy Quartz Cemented Cuttings with Few Fossils. Red circles outline fossils which in-filled with quartz, hyalophane, and albite.

58
This photo shows that the entire rock is heavily cemented yet there are very few
radiolarian fossils present to provide the silica cement. We estimate that some samples
may contain up to 30% quartz cement; however, there are no samples analyzed that
show even a few percent of the total rock volume as fossils. Furthermore these fossils
are in-filled with more silica cement (along with other minerals) than the fossils could
have contained originally. Radiolarian fossils are basically hollow shells with very little
total silica available for cement; however, based on SEM photos the voids which
originally contained fossils are now completely filled. A more likely source of the silica
cementation is hydrothermal activity during the Devonian within the basin as a result of
fluids moving during active faulting.
There are several relationships which strongly suggest that hydrothermal fluid activity is
a key factor. The first is that there is a strong correlation between the presence of
quartz cement and barium-rich K-spar (hyalophane and celsian). There are euhedral
crystals of hyalophane and albite within the quartz cement. Hyalophane is not a mineral
commonly associated with simple detrital deposition. In fact it is commonly present
within Cu-Pb-Zn ore SEDEX deposits which form from hydrothermal fluids. If the
source of the silica cements was from biogenic sources then there should be no
correlation between these cements and the hyalophane, but there is. The quartz,
hyalophane, and albite appear to have grown in place and are not detrital minerals.
Evidence for growth in place is visible in the SEM photos in figures 3.19 and 3.20.

59
Figure 3.19. Hydrothermal Dissolution and Replacement of Fossils. A) Silica fossils in-filled with quartz, hyalophane, and albite. B) Close up view of one of the fossils. Euhedral crystal masses of quartz, hyalophane, and albite are visible.
Figure 3.20. Element Maps of the Cement Filled Fossil Voids. Each mineral is identified based on its elemental composition. Notice a ring of organic carbon around the mass of minerals which likely formed as the minerals grew and pushed the carbon towards the edge.

60
The areas where the intergrowths of these unusual mineral sets are most apparent are
the larger voids where fossils once existed. These voids also provide additional
evidence that cementation was early, even syn-depositional. Many voids are round or
slightly oval in samples which have significant cementation, which is very close to the
shape of the original fossil. This indicates that these rocks did not undergo significant
compaction prior to cementation; otherwise these delicate fossils and voids would be
squished into linear features parallel to bedding.
The mineral assemblages also provide information about the temperature of the water
during deposition, which also points to hydrothermal origins. The original silica fossils
are dissolved or recrystallized and the voids filled with quartz, hyalophane, and albite.
The water temperature was likely above 160oC in order to carry significant silica in
solution to produce the cements (see figure 3.21) regardless of the pressure.
The presence of hyalophane and albite in this system is similar to the black shale
SEDEX deposit of the Selwyn Basin in the Northwest Territories, which are interpreted
to have formed from hydrothermal fluids less than 260oC (Orberger et al., 2005).

61
Figure 3.21. Silica Dissolution P-T graph for Quartz. The red circle indicates that the minimum temperature of the fluids required to carry significant amounts of dissolved silica is 160ºC. This temperature requirement is consistent with the silica being sourced from hydrothermal fluids. (Modified from Kennedy, 1950).
The presence of significant quartz cementation, little to no compaction, and mineral
assemblages showing water temperatures during deposition on the order of 160oC to
260oC indicate that there was stratification of the water column resulting from
hydrothermal fluid venting (Goodfellow & Rhodes, 1990) as displayed in figure 3.22.
Fluid inclusion data from the adjacent Slave Point platform dolomites yield salinities of
15-29% by weight or higher and temperatures of 160oC to 210oC for the hydrothermal
fluids (Alstead et al, 1987). Waters with high salinities are denser than seawater at any
temperature. These dense fluids contained large concentrations of dissolved metals,
silica, and sulphur. The dense fluids can explain the reducing conditions leading to high
preservation of organics, sulphide deposits, and quartz cementation of the sediments as
the fluids cooled.

62
Figure 3.22. Hydrothermal Fluid Interactions. The diagram above indicates 260ºC. This temperature requirement is consistent with the silica being sourced from hydrothermal fluids. (Modified from Goodfellow and Rhodes, 1990).
Presence of a variety of sulphides containing Ni-Cu-Zn-Pb-As are indicative of SEDEX
type deposits. Further, this argument is strengthened by the fact that many of these
occur as beds and nodules which can reach several centimeters. Some of these beds
contain larger euhedral sulphide crystals encapsulated by quartz cement (Figure 3.23),
which is similar to the hyalophane and albite fabric. This is further evidence that high
temperature sulphide minerals formed during deposition.

63
Figure 3.23. Bedded Sulphide Deposits in the Horn River Group. Outlined in orange is one of these beds which is approximately 0.1mm in thickness. Points 1 and 3 show euhedral sulphide crystals encapsulated in large growths of quartz cement within the bedded sulphide layer. Point 2 shows a mass of sulphides which is in the middle of a fossil void below the sulphide layer in association with quartz cement and hyalophane.
3.6 Summary
The combination of XRF applications to collect large volumes of data and SEM analysis
to provide definition on targeted samples are a great way to do reservoir analysis and
explore depositional and diagenetic history. XRF data can be collected in a relatively
quick and inexpensive manner using a new generation of portable XRF instruments.
The basic framework for such analyses are provided within this study as a template for
general subsurface prospecting or in depth subsurface formation analysis using only

64
drill cuttings. These methods can be applied to vertical wells, but more importantly to
horizontal wells where it is difficult to acquire information.
This in depth analysis of the Horn River Group and Fort Simpson Formation proposes a
viable alternative to the entrenched believe that restricted basin conditions and biogenic
silica oozes are responsible for the for the creation of the Horn River Group black shale.
The transition from Horn River Shale to Fort Simpson Formation was previously thought
to represent an influx of oxygen rich water and a decrease or total ceseation of silica
producing biogenic activity. These ideas are a sum of several unrelated events which in
some cases contradict one another. For instance moving from a restricted to
unrestricted basin environment should logically lead to either no change or an increase
in biologic production of silica fossils, not a decrease. Therefore, there should be an
equal or greater amount of quartz cementation in the Fort Simpson rather than a
decrease. This idea also has no real explanation for the lack of silica fossils within the
Horn River Group to cause the degree of cementation observed. There are also
difficulties explaining how these fossil could be dissolved, and how hyalophane and
albite form as cements, and why significant sulphide layers and nodules containing Ni,
Cu, Zn, Pb, and As are present. The expulsion of hot, dense, and reducing
hydrothermal fluids onto the seafloor from active fault systems which likely extend into
the basement rock explains all observations in the Horn River Group.
There are modern examples of this type of system which have many of the same
characteristics in the Red Sea as well as Proterozoic examples such as the Selwyn

65
Basin in NWT (Orberger et al., 2005) or Niutitang and Qiongzhusi Formations in China.
The winding down and eventual caseation of hydrothermal fluid expulsion associated
with indicators for decreased faulting are likely why there is a change moving from the
Horn River Group into the Fort Simpson Formation.
There are still some loose ends which need to be explored but were not able to be
incorporated into this study. Fluid inclusion analysis of the quartz, hyalophane and
albite cements will definitively provide information on what the water temperature and
salinity ranges were during deposition. Another avenue which should be explored is the
use of additional XRD measurements to confirm and refine the XRF calculated
mineralogy model. Finally the small degree of compaction observed in the Horn River
Group indicates it was deposited and cemented over a relatively short time period. It
would be interesting to do some age dating using Rb-Sr isotopes or Ur-Pb dating in both
the Horn River Group and the Fort Simpson Formation.

66
CHAPTER 4: SYN-DEPOSITIONAL HYDROTHERMAL
INFLUENCES, BESA RIVER FORMATION, NORTHEAST
BRITISH COLUMBIA, CANADA
4.1 Abstract
The Besa River Formation is equivalent to the Horn River Group and has outcrop
exposures in portions of NE British Columbia on the west side of the Liard Fault system.
Through the use of XRF, XRD, rock eval and SEM analysis, the shale sequence can be
divided by composition and fabric. There are four main types of composition and fabric
groups which are designated Type 1 through Type 4. Each type is grouped based on
the amounts of quartz, clay, carbonate and TOC present. In addition the rock fabrics
range from purely detrital to heavily cemented, which have a strong correlation to the
mineralogy. This study describes how this categorization can be done on either outcrop
or sub-surface samples.
This labeling system is very useful when evaluating a reservoir for oil and gas
exploration. In unconventional shale gas or oil reservoirs the mechanical properties of
the target zone play a significant role in hydraulic fracturing and completion of a well.
The mineral composition and fabric are directly related to the mechanical properties of
rock strength (Young’s Modulus) and brittleness (Poisson’s Ratio). In addition those
values can be approximated using the mineral composition calculated from the
geochemical data acquired through XRF.

67
It is also important to understand why there are such different mineral compositions and
fabrics within a shale succession. There is significant evidence that the dominant
control on deposition and early diagenesis of the Besa River and Horn River shale is
extensional faulting and hydrothermal fluids associated with that faulting. This study
draws on three distinct observations indicating hydrothermal influences. These include
stratified over mature and immature TOC intervals, analysis of detrital quartz and quartz
cement, and the presence monazite, Ba-sulphate and Ba-feldspar minerals commonly
associated with hydrothermal ore deposits. The anoxic and acidic properties of the
hydrothermal fluids are likely the dominant reason that significant TOC is preserved in
these intervals.

68
4.2 Introduction
The Besa River Formation is equivalent to the Horn River Group but portions have been
uplifted by thrust faults to be at the surface in outcrop. The Bovie Fault system is a
major set of normal faults, which run NE-SW in NE British Columbia. On the east side
of the fault is the Horn River Basin, where the Horn River Group is located at a depth of
roughly 2000m or more. Directly west of the fault the Besa River Formation is present
at depths of roughly 4000m; however, an additional set of normal faults even further
west brings it back to near surface depths and there are outcrop exposures. Having
continuous sections of this formation at surface allows for careful selection of samples
for geochemical and SEM analysis on the rock fabric.
The two main goals of this study are to show that XRF analysis can be a useful tool for
doing stratigraphic analysis on organic shale and that the Besa River Formation
provides compelling evidence of syn-depositional hydrothermal influences. Organic
shale is very fine grained and often obscured in visible light by the high TOC, which
makes conventional microscopy and visual observation difficult. The use of XRF, XRD,
rock eval, and SEM imagery allow for the analysis of rock composition, rock fabric, and
environmental conditions during the time of deposition.
4.3 Study Area and Data Collection
The section is located near mile 109 of the old Alaska Highway mile markers, about 150
km west of Ft. Nelson, British Columbia. Shale is present above limestone in a creek
bed just north of the highway. The MacDonald Creek map published as a preliminary

69
version in 1963 by the Geological Survey of Canada covers this area (94-K-10). The
northwest corner of the map is shown in Figure 4.1. The limestone was originally
mapped as the Nahanni Formation (unit 11 on Figure 4.1) and the shale as the
“Devonian black shale unit.” More recent maps assign the limestone to the Dunedin
Formation and the shale to the Besa River Formation.
Figure 4.1. Northwest Corner of the MacDonald Creek Geologic Map. Section location is indicated by arrow. (British Columbia Ministry of Energy and Mines, New Ventures Branch Petroleum Geology Open File 2003-4)
There are about 65 meters of nearly continuous shale exposed above the limestone at
this location. The shale is divided into three packages; the lower package contains dark
black shale that weathers brown-orange and parts parallel to bedding in 1 to 10 cm thick

70
units; the middle unit displays a strong cleavage; the upper unit contains some beds
that are similar to the lower unit and others that have a chertier appearance and fracture
pattern.
A series of cross sections based on well logs is available from the British Columbia
Ministry of Energy and Mines, New Ventures Branch (Petroleum Geology Open File
2003-4). Cross section V-V’ from this report includes three nearby wells (closest about
35 miles, 55 km) with thicknesses given for the Evie and Klua member shale above the
upper Chinchaga limestone (Figure 4.2). The thicknesses of the Evie and Klua
members are about 13 and 26 meters in c-86-D/94-J-12, 10 and 9 meters in a-69-J/94-
J-12 and 12 and 16 meters in b-94-L/94-J-11. The lower and middle portions of the
shale in the measured section are within this thickness range, and are tentatively
correlated with the Evie and Klua members in the subsurface. The upper portion of the
measured section appears to correlate with the lower Otter Park member in the
subsurface.

71
Figure 4.2. MacDonald Creek Geologic Map and Well Locations. Correlation of outcrop units to the subsurface. (British Columbia Ministry of Energy and Mines, New Ventures Branch Petroleum Geology Open File 2003-4)
4.4 Lithology and Stratigraphy
Rocks in the measured section to are assigned to four lithology assemblages based on
the composition of the rocks (Figure 4.3) as determined from XRD and rock eval lab
analyses. Each composition type also provides clues to how those rocks were
deposited. These are labeled as type 1 through type 4 as described below:

72
Figure 4.3. Quartz - Organic carbon - Clay Assemblage Ternary Diagram. Proportion of each component is displayed by volume.
1. quartz-TOC-clay assemblage - quartz-rich
2. quartz-TOC-clay assemblage - organic-rich
3. quartz-TOC-clay assemblage - clay-rich
4. dolomite-chlorite assemblage
4.4.1 Type 1: Quartz-TOC-Clay Assemblage (Quartz-Rich)
These rocks are black on a fresh surface and like those of the organic-rich assemblage
weather brown-orange (Figure 4.4). They tend to part parallel to bedding in an irregular
to blocky pattern from 1 to 10 cm thick and a cm to several cm on a side. Some beds
appear almost to be chert. This is different from the appearance and fracture pattern
quartz-organic C-clayclay-richorganic-rich6 prcent clay
quartz
clay organic C

73
seen in the other lithologies, and again can be related compositional differences among
the lithology assemblages.
Figure 4.4. Outcrop and SEM Images of Lithology Type 1.
The primary difference between this and the other quartz-organic carbon-clay
assemblages is in the low amount of both clay and organic carbon. The low organic
carbon content can be seen by comparing the dark areas in the SEM image on Figure
4.5 to those on Figure 4.4. This lithology is present as a relatively small component of
the lower unit and makes up a significant portion of the upper unit.
The mineralogy of these rocks by weight fraction is primarily quartz (90 to 95%) and
mica, or illite that again is very crystalline (5 to 10%), both of these show up as medium
gray tones on the SEM image in Figure 4.4. The mica/illite is slightly lighter than the
quartz, and forms elongate grains. Accessory minerals include those with high atomic

74
mass (white on SEM images) pyrite, apatite, barite, rutile and monazite; albite
(indistinguishable from quartz on SEM images) and chlorite (slightly darker than quartz
on SEM images). The accessory minerals are present in total abundances of less than
1%. The total organic carbon content of these rocks varies from 2 to 3.3% by weight;
assuming a density of close to 1 g/cc for the organic component this translates to a
volume percentage of 5 to 8.5%. This can be seen as the larger dark areas in the SEM
image in Figure 4.4.
Type 1 lithology is consistent with deposition of sediments in very close proximity to
active hydrothermal venting. In this case the expelled waters are very hot, anoxic,
acidic and have significant dissolved silica content. As these hydrothermal fluids
encounter seawater they cool very rapidly and precipitate significant amounts of silica
as quartz cement. It is likely that because this process is so rapid there is very little time
for these sediments to accumulate significant clay or organics before becoming
thoroughly cemented. These rocks generally show mineralization and little compaction.
4.4.2 Type 2: Quartz-TOC-Clay Assemblage (Organic-Rich)
These rocks are jet black on a fresh surface and weather brown-orange (Figure 4.5).
They part parallel to bedding in tabular to blocky plates from 1 to 10 cm thick and
several 10’s of cm on a side. This is different from the appearance and fracture pattern
seen in the other lithologies and can be related to compositional differences among the
lithology assemblages. The primary difference between this and the other quartz-
organic carbon-clay assemblages is in the amount of organic carbon. The high organic

75
carbon content can be seen as dark areas in the SEM image on Figure 4.5. This is the
dominant lithology in the lower unit and also makes up a significant portion of the upper
unit.
Figure 4.5. Outcrop and SEM Images of Lithology Type 2.
The mineralogy of these rocks by weight fraction is primarily quartz (70 to 95%) and
mica, or illite that is very crystalline (5 to 30%), both of these show up as medium gray
tones on the SEM image in Figure 4.5. The mica/illite is slightly lighter than the quartz,
and forms elongate grains. Accessory minerals include those with high atomic mass
(white on SEM images) pyrite, apatite, barite, rutile and monazite; albite
(indistinguishable from quartz on SEM images) and chlorite (slightly darker than quartz
on SEM images). The accessory minerals are generally present in total abundances of
less than 1%. The total organic carbon content of these rocks varies from 5.5 to 8.8%
by weight; assuming a density of close to 1 g/cc for the organic component this

76
translates to a volume percentage of 13.5 to 20.5%. This can be seen as the larger dark
areas in the SEM image in Figure 4.5.
Type 2 lithology is consistent with deposition of sediments in a moderate to close
proximity to active hydrothermal venting. In this case the waters are anoxic and acidic;
however, they have cooled sufficiently that much of the silica content has already been
dropped out. This allows for the preservation of significant organic matter with
moderate silica cementation. These rocks tend to show moderate to significant
mineralization and little compaction.
4.4.3 Type 3: Quartz-TOC-Clay Assemblage (Clay-Rich)
These rocks have a strong cleavage which gives them a very different appearance from
the other lithologies (Figure 4.6). They tend to crumble along the cleavage, rather than
along the bedding. This different appearance and fracture pattern relative to those seen
in the other lithologies again can be related compositional differences among the
lithology assemblages. The primary difference between this and the other quartz-
organic carbon-clay assemblages is in the higher clay content. The middle stratigraphic
unit is composed of this lithology.
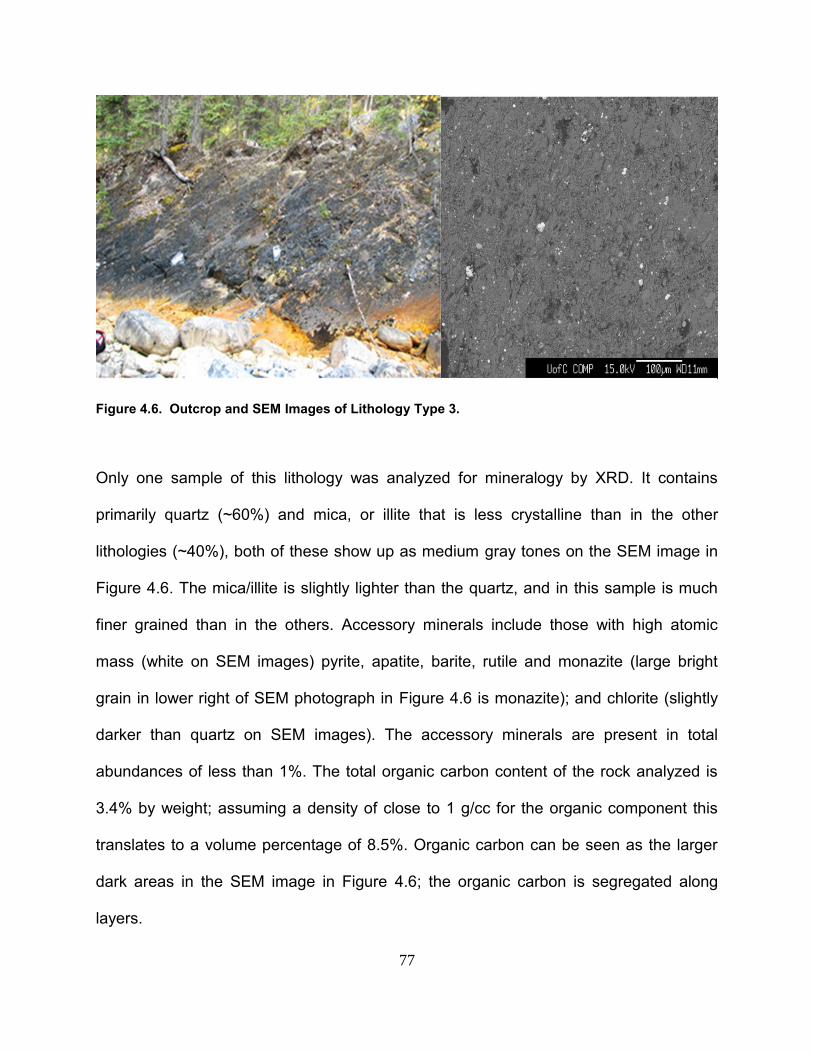
77
Figure 4.6. Outcrop and SEM Images of Lithology Type 3.
Only one sample of this lithology was analyzed for mineralogy by XRD. It contains
primarily quartz (~60%) and mica, or illite that is less crystalline than in the other
lithologies (~40%), both of these show up as medium gray tones on the SEM image in
Figure 4.6. The mica/illite is slightly lighter than the quartz, and in this sample is much
finer grained than in the others. Accessory minerals include those with high atomic
mass (white on SEM images) pyrite, apatite, barite, rutile and monazite (large bright
grain in lower right of SEM photograph in Figure 4.6 is monazite); and chlorite (slightly
darker than quartz on SEM images). The accessory minerals are present in total
abundances of less than 1%. The total organic carbon content of the rock analyzed is
3.4% by weight; assuming a density of close to 1 g/cc for the organic component this
translates to a volume percentage of 8.5%. Organic carbon can be seen as the larger
dark areas in the SEM image in Figure 4.6; the organic carbon is segregated along
layers.

78
Type 3 lithology is consistent with deposition of sediments in a distal proximity to active
hydrothermal venting. In this case the waters are probably only slightly anoxic and have
cooled sufficiently that very little dissolved silica remains. There are still some weaker
effects of mineralization present in these rocks; however, the rock fabric is dominantly
detrital. This type of fabric often shows significant compaction.
4.4.4 Type 4: Dolomite-Chlorite Assemblage
Three of the samples analyzed contain a dolomite-chlorite assemblage. Two of these
samples show a dense fracture pattern as in Figure 4.7, the other sample is from a
more massive bed.
These samples differ significantly from the others in terms of the mineralogy. Quartz is
not the primary mineral. Dolomite makes up between 60 and 70% of the rock. The
remainder is composed of chlorite (15 to 25%), quartz 10 to 20%) and calcite (<5 to
10%). The accessory minerals are present in total abundances of less than 1%. The
total organic carbon content of these rocks ranges from 1.8 to 3.75% by weight. The
organic carbon plus void space is the darkest portion of the SEM image in Figure 4.7;
chlorite is dark gray, dolomite and quartz are lighter gray and calcite is quite light.

79
Figure 4.7. Outcrop and SEM Images of Lithology Type 4.
Type 4 lithologies are interpreted to be carbonate dominated debris flow deposits. The
carbonate grains are primarily silt to sand sized particles and are heavily dolomitized.
This is consistent with the type of carbonate materials that would have been shed off
the adjacent Devonian platform and reefs at the time. These units are interpreted to be
the result of large scale regional earthquakes which occur as a result of extension and
basement faulting.
4.5 Syn-Depositional Hydrothermal Evidence
4.5.1 Organic Content and Maturity
The shale in this study area is divided into three packages (Figure 4.8), each of which
has a different appearance and composition. The lower package contains dark black
shale that weathers brown-orange and parts parallel to bedding in 1 to 10 cm thick units
and is dominated by rocks that are rich in quartz and organic carbon. The middle unit

80
displays a strong cleavage and is clay-rich. The upper unit contains some beds that are
similar to the lower unit, but most have a chertier appearance and fracture pattern and
are quartz-rich, but lower in organic carbon.
Figure 4.8. TOC Maturity in Measured Section. The shale section is divided into a lower (Evie?), middle (Klua?) and upper (lower Otter Park?) portion. Squares indicate samples analyzed by XRD (yellow – quartz-rich), purple – dolomite-chlorite, brown – clay-rich), arrows indicate samples analyzed by SEM,

81
diamonds indicate TOC (green) and Tmax measurements (red, white dots indicate samples without a good Tmax peak).
Figure 4.8 demonstrates a strong relationship showing samples that are higher in TOC
(>4%) also tend to have higher Tmax (>500ºC) suggesting they are very mature. This is
opposite to what is expected had all the organics in this unit been deposited as a result
of only restricted basin conditions. If that were the case then more mature samples
would generally be lower in TOC as the organics are partially converted to
hydrocarbons. What is also very obvious is that there is a large range in thermal
maturity of the samples within a short distance of only 75m. In addition the change in
maturity is not gradational from top to bottom, rather it is stratified. Between 25m and
75m in the measured section there are samples showing a Tmax of ~350ºC within a few
meters of samples with a Tmax of ~650ºC. How could it be possible to have a rock
column consisting of stratified units immature and post mature organic shale?
The only logical explanation for this strange situation is that the organics were heated or
not heated cyclically during deposition. In addition the samples that are heated are
severely cooked to bring them into the post mature state. This is very strong evidence
that hot hydrothermal fluids were present sporadically during the deposition of Besa
River sediments. Morrow et al. (1990) also interpret a late Devonian thermal event
through conodont and vitrinite maturity indexes which is in agreement with these
findings. The fluids were likely very anoxic and acidic which accounts for the higher
TOC preservation in association with higher thermal maturity. Although fluid inclusion
analyses were not performed as part of this study to determine the exact temperatures

82
of hydrothermal fluids, the indirect evidence from maturity shows that they were likely
hot enough to carry significant dissolved silica. Rapid cooling of these fluids after
expulsion onto the seafloor likely resulted in quartz cementation of the sediments with
relatively little compaction, which is precisely what is seen in SEM photos.
4.5.2 Detrital Quartz and Quartz Cement In the Besa River Shale
Quartz is present in two forms in the Besa River shale. The first component is clay to
silt sized quartz grains from a detrital source. These grains are deposited with other
detrital minerals such as illite and zircons. In offshore marine shale deposits like the
Besa River Formation the assumption is made that detrital quartz and zircon are
deposited in a consistent ratio. This is because they have similar properties with
respect to physical and chemical resistance to weathering. Through XRF normative
mineral calculations it is possible to determine the total quartz content and also
measure the trace element Zr, which is in zircons. In samples which contain no quartz
cement the ratio of quartz/Zr remains consistent for a specific depositional package.
When the ratio of quartz/Zr increases that indicates there is more quartz in the system
than can be expected simply from detrital components. Even without doing normative
mineral calculations for quartz, the Si content can be plotted against Zr to demonstrate
there are significant geochemical differences between rocks with detrital fabrics and
those with cemented fabrics.

83
The Si vs Zr plot in Figure 4.9 shows that there is separation of samples based on
chemistry and rock fabric. There are several observations which can be made based
on this plot:
1. There is a consistent Si/Zr ratio of approximately 0.25 in those samples which
define largely detrital rocks consisting of variable amounts of carbonate and
siliciclastics. This consistent ratio is what is expected if the rocks are from a
detrital source, which suggests both the carbonate and siliciclastic dominated
samples are detrital. This is consistent with SEM photos showing the carbonates
appear to be debris flows while the siliciclastics are probably longshore current
deposits. Samples which do not contain significant carbonate content with a
detrital fabric tend to fall in the detrital envelope.
2. Samples which have high radiolarian content are not significantly off the detrital
Si/Zr line and therefore are not significantly enriched in quartz. The samples that
do contain significant radiolarian content do not contain significant amounts of
quartz cement; rather they exist as individual fossils within a detrital fabric.
3. Quartz cemented rocks are significantly out of the detrital envelope and tend to
have a Si/Zr ratio ranging from 0.5 to greater than 1.0. If there is not significant
silica content coming from radiolarians then it must be coming from another
source.

84
Figure 4.9. Origin of Quartz Types in the Horn River Basin.
If the quartz cementation present in the Besa River Formation is not biogenic, then all
other indicators point towards it being sourced from hydrothermal origins. Additional
evidence exists that the quartz cementation occurred syn-depositionally as samples
which are cemented have relatively little compaction while those with a detrital fabric
show more significant compaction. This is most apparent when looking at radiolarian
fossils in SEM imagery, as radiolarian tests are relatively delicate. In cemented
samples the original fossil is generally dissolved and the void is circular or semi-circular
with a quartz or feldspar cement fill. In detrital fabrics radiolarian fossils tend to show

85
evidence of compaction; they are present as flattened ovals and some even appear as
thin quartz lines parallel to bedding.
Understanding the origin of the quartz is important. The presence or absence and
abundance of quartz cements determine if rocks are ductile or brittle. This in turn
controls the fracture properties and has a large impact on completions in oil and gas
development. There is a continuum in the degree of cementation ranging from
unconsolidated detrital fabrics to chert-like fabrics as the Si content increases (Figure
4.10). Calculated values for Poisson’s Ratio and Young’s Modulus from XRF data are
displayed below each SEM image in Figure 4.11 to demonstrate how fabric can affect
the rocks mechanical properties (also see Figure 4.12).
Figure 4.10. K2O and SiO2 Geochemistry From Outcrop, Horn River Group.

86
Figure 4.11. Silica Content and Rock Fabrics from Outcrop, Besa River Formation.
Figure 4.12. Silica Content and Rock Fabrics from Subsurface, Horn River Group.
8. fissile to platy – PR~0.19 YM~41isolated grains - original
depositional detrital fabric
14. platy – PR~0.18 YM~43isolated grains connected
(lightly) cemented detrital fabric
30. dense platy – PR~0.16 YM~47grains better connected cemented detrital fabric
59. dense platy – PR~0.1 YM~65grains well connected
(heavily) cemented detrital fabric
52. cherty – PR~0.09 YM~62quartz cement is more massivedensely cemented detrital fabric
60. cherty – PR~0.07 YM~77quartz cement is massive
welded fabric
0
20
40
60
80
100
120
140
160
50 60 70 80 90 100SiO2
very soft soft hard very hard
Well Data (SiO2)Samples with low SiO2 are easy togrind with a mortar and pestle and wecalled them very soft (grey); those withslightly higher SiO2 are slightly harderto grind - soft (blue); those with higherSiO2 are hard (black); high SiO2samples are very hard to grind (red).Sequence goes from very ductile tovery brittle.
0
5
10
15
20
25
30
35
40
0 50 100 150
Si (%
)
Zr (ppm)
carbonate
quartzcement

87
4.5.3 Hydrothermal Minerals
There are minerals within the Horn River Group and Besa River sequences both in
outcrop and subsurface not usually found in sedimentary deposits. The presence of
several unusual minerals typically associated with SEDEX deposits is further evidence
that hydrothermal fluid interactions have occurred. One of these is monazite, a rare
earth phosphate typically found in high grade metamorphic rocks, but also reported from
hydrothermal deposits. The monazite crystals are much larger than the detrital grains
and overgrow them (Figure 4.13). The fact that they overgrow detrital grains clearly
indicates they are not part of the detrital sequence, but rather grew in-situ. They occur
throughout this section in conjunction with several rare earth metals (REMs) that are not
expected in a typical sedimentary deposit. The REMs detected in association with
monazite are Cerium, Lanthanum, and Yttrium.
Ba is also present in several forms (Figure 4.14) and is also indicative of hydrothermal
fluid interactions. Hyalophane (Ba with K and/or Na in the feldspar) and celsian (pure
Ba feldspar) minerals are often reported from Ni-Cu-Zn hydrothermal ore deposits. In
outcrop barite is present as disseminated grains and as linings of vugs that are filled by
quartz and/or albite. These Ba-rich minerals have grown in situ after initial deposition
as evident by the fact they are present as cements, many have euhedral crystal faces
and they commonly grow around detrital grains, line or infill voids. These Ba-rich
minerals are also observed in core and cuttings.

88
Figure 4.13. Monazite Occurrences in Outcrop, Besa River Formation.
The concentration of Ba can also be used as an indicator for relative proximity of
sediments to seafloor vents. Ba concentrations from three different locations within the
Horn River Group and Besa River Formation are displayed in Figure 4.14. One is from
outcrop while the other two are from cuttings at 5m sample spacing. In this case well A
is interpreted as being the most proximal of the three to a vent while the outcrop
-10
0
10
20
30
40
50
60
70
0 50 100 150 200 250
Hei
ght i
n se
ctio
n (m
)
La+Ce+Y (ppm)
Monazite
Monazite
Monazite
No SEM
No SEM
No SEM
No SEM
XRF data
Monazite Rare Earth Phosphate
Cerium (Ce) Lanthanum (La)
Yttrium (Y) Neodimium (Nd)
Thorium (Th)
XRF data show relatively high values of Cerium (Ce), Lanthanum (La) and
Yttrium (Y) in samples containing monazite.

89
samples are more distal. Also sediments which are in close proximity to a vent appear
to have a higher degree of fluctuation in the Ba concentration where as those more
distal tend to have less variability in total Ba.
Figure 4.14. Ba-Bearing Minerals and Chemistry in Outcrop.
Figure 4.15. Ba Concentration with Distance from Vent in Outcrop and Subsurface.
-10
0
10
20
30
40
50
60
0 500 1000 1500 2000
Hei
ght i
n se
ctio
n (m
)
Ba ppm Ni+Cu+Zn (ppm)
barite very bright
vug lining
and disseminated
hyalophane corescelsian rims
0
25
50
75
100
125
150
175
200
0 2000 4000 6000 8000
Hei
ght i
n se
ctio
n (m
)
Ba (ppm)
OutcropWell AWell BConcentration profiles for Ba indicate
large spatial variation in the fluid chemistry. Consistent with vertically and horizontally stratified fluids which differ with proximity to source (vents). Fluid chemistry also appears to vary with time at a given location.
Well Data (Ba)

90
4.6 Summary
A key component of this study is the XRF and SEM analysis of Besa River Formation
outcrop samples. At the most basic level there are a variety of different shale
compositions and fabrics within this thick organic shale succession. Each of the
different shale compositions and fabrics can provide evidence of specific geological
conditions surrounding deposition and early diagenesis. There are at least four unique
rock types which can be used to describe an entire succession of shale and develop a
stratigraphic analysis.
One of the main objectives of this study is to provide additional evidence from outcrop
that the Besa River Formation and Horn River Group shale sequences were deposited
under the heavy influence of hydrothermal fluids. In this paper three lines of evidence
are provided to support this claim. First it is demonstrated that increased organic
preservation is not only associated with increased silica cement, but also with over
maturity of the organics. These over mature packages are also inter-stratified with less
mature packages, indicating that there were sporadic episodes of extreme heating
during deposition. The only plausible explanation for these heating episodes is hot
hydrothermal fluids being expelled from subsea vents.
The second line of evidence comes in the form of the Si/Zr ratio. In pure detrital
sediments a consistent Si/Zr ratio can be expected because quartz and zircon tend to
be deposited in similar concentrations. When the Si/Zr ratio increases above what is
expected that indicates there is additional quartz in the system. SEM images show that
91
the samples which contain significant radiolarian fossils tend to not fall too far off the
detrital ratio and can be cemented or not. In contrast there are samples which are
heavily cemented and contain little or no radiolarian fossils and tend to have a Si/Zr
ratio of 2 to 4 times that of the detrital signature. The explanation for the presence of
such high silica cement content is that the quartz has precipitated out of solution. High
silica cement content is also associated with mineralization and minerals which are
unusual in sedimentary environments, but common in hydrothermal systems.
In this study minerals associated with hydrothermal deposits were observed
consistently; monazite, metal sulphides, barite and Ba-feldspars. Monazite is observed
growing in euhedral crystal form and encompassing detrital grains, suggesting it grew
in-situ near the time of deposition. It also occurs in association with several REMs
which again strongly suggest hydrothermal influences. Barite is commonly associated
with SEDEX deposits. Ba-feldspars are commonly associated with Ni-Pb-Zn SEDEX
deposits. The minerals celsian and hyalophane are present in addition to increased
mineralization in the form of Ni, Pb, and Zn detected by XRF. The presence of these
specific mineral assemblages is extremely difficult to explain in any ordinary
sedimentary setting.

92
Chapter 5: Thesis Summary
5.1 Final Summary
The study of shale can be difficult due to the small grain sizes of the minerals making up
the composition of these rocks. The presence of even small amounts of TOC can make
visual and microscope observation even more difficult. In this project a method is
developed by which the combination of XRF, XRD, rock eval, and SEM analysis are
used to categorize shale by composition, fabric, and trace element chemistry. In this
case the analyses are on the Horn River Group and Besa River Formation; however,
these same methods can be applied to other formations and are not limited to fine
grained rocks.
The real key is the ability to collect and analyze large amounts of data in a timely and
cost effective manner by implementing portable XRF technology. XRF provides an
elemental breakdown of the sample in a relatively quick and inexpensive manner;
however, the instruments used in this project cannot detect elements lighter than Al.
This elemental data can be used to build predictive models for estimating mineralogy,
TOC, REDOX conditions and rock mechanics data in organic shale using either core,
drill cuttings or outcrop samples. Results can be used for academic applications such
as sequence stratigraphy, paleo-environment reconstruction, or sediment source
studies. There are also practical applications in the oil and gas industry where these
data can be used for reservoir evaluation, reservoir geo-modelling and well completions.
In addition any models designed from vertical wells can be used to provide that same

93
information in a lateral production well from drill cuttings, where it is difficult and
expensive to collect data using conventional methods.
At the outset of this project I was not satisfied with the generally accepted explanation
for how several Devonian aged shale formations formed. This includes the Horn River
Group, Besa River Formation, and the Duvernay Formation. The current biogenic silica
model suggests that anoxic conditions necessary for the perseveration of organic matter
were the result of restricted basin conditions and poor water circulation. In addition the
sporadic heavy cementation of strata within these shale units was attributed to siliceous
oozes settling on the seafloor composed of radiolarian and foraminifera skeletal
remains. Eustatic sea level changes controlled basin accommodation space and
REDOX conditions such that these shale units are interpreted to have formed in deep
water settings. There are also several key observations within these organic shale units
which the conventional beliefs cannot explain.
One of these is the fact there is stratified and variable maturation of organics within
close proximity of each other. Another is the presence of unexpected minerals such as
authigenic barite, Ba-feldspar, K-spar, albite, monazite, chalcopyrite, sphalerite, and
arsenopyrite commonly associated with Ni-Cu-Zn ore deposits. These minerals are
present as layers, cement or euhedral crystals which have grown around detrital grains.
The sulphides occur in stratified layers ranging from less than one mm up to several cm
thick in line with what is observed in SEDEX deposits. Finally there is very little
evidence to support the claim that biogenic oozes are responsible for significant quartz

94
cementation. Most samples which show heavy quartz cementation have little or no
evidence of radiolarians even being present. In fact where radiolarian fossils are
observed in cemented rocks they are often dissolved and filled with more quartz than
the original fossil could have contained.
A more complete explanation that can account for all observations is that there was
extensional rifting and faulting during the Devonian, likely as a result of pulling and
flexure forces from the subduction of oceanic crust attached to the western margin of
North America. This extensional faulting is what created accommodation room for the
Horn River Basin, among others, and is also responsible for the geometry of reef
growth. Earthquakes associated with the extensional faulting are responsible for the
coarser grained carbonate debris flows observed sporadically within these shale units.
The faults acted as conduits for hot hydrothermal fluids to reach the surface as crustal
thinning occurred. These fluids are responsible for the preservation of organics, syn-
depositional maturation of the organics, silica cementation, mineralization, and growth
of hydrothermal minerals. Devonian aged fluids have been shown to be responsible for
dolomitization of the reefs to the east, development of SEDEX and MVT deposits to the
west and south, and deposition of additional organic shale units in the NWT and Yukon.
There are additional studies which could be done to further support the claim of
hydrothermal influences on the deposition of Devonian aged organic shale. The first is
fluid inclusion analysis from outcrop and drill cuttings. I believe that these would show
silica cementation of the sediments occurred at very high temperatures, likely greater

95
than 210ºC. This would definitively prove that the cements are not the result of biogenic
oozes. Another avenue to explore is the isotopic compositions of Sr, O, and C in
sediments from the Keg River Formation upward through the top of the Fort Simpson
Formation. I believe this will show that sediments and cements have an isotopic
composition suggesting hydrothermal fluid interactions rather than normal sedimentary
deposition for the time. Finally a detailed analysis of the carbonate debris flows using
SEM may help to confirm that they are indeed the result of tectonic activity and support
the claim extensional faulting.
5.2 References Aulstead K.L. and Spencer R.J., 1985. Diagenesis of Keg River Formation, northwestern Alberta; fluid inclusion evidence. Bulletin of Canadian Petroleum Geology, v. 33, p. 167-183 Aulstead K.L. and Spencer R.J. and Krouse H.R., 1987. Fluid inclusion and isotopic evidence on dolomitization, Devonian of Western Canada. Geochimica et Cosmochimica Acta, Volume 52, Issue 5, May 1988, Pages 1027–1035 Blakey R., 2011. Paleogeography Maps of North America. Northern Arizona University, Geology Department. http://jan.ucc.nau.edu/rcb7/ Bogdanova S.V., Pisarevsky S.A., Li Z.X., 2009. Assembly and Breakup of Rodinia (Some Results of IGCP Project 440). Stratigraphy and Geological Correlation 17 (3): 259–274. Chalmers G.R.L., Ross D.J.K., Bustin M., 2012. Geological controls on matrix permeability of Devonian Gas Shales in the Horn River and Liard basins, northeastern British Columbia, Canada. International Journal of Coal Geology, Volume 103, Issue null, Pages 120-131. Emerson S.R. and Huested S.S., 1991. Ocean anoxia and the concentrations of molybdenum and vanadium in seawater. Marine Chemistry, v. 34, p. 177-196. Goodfellow W.D. and Rhodes D., 1990. Geological setting, geochemistry and origin of the Tom stratiform Zn-Pb-Ag-barite deposits, in Abbott, J.G., and Turner, R.J.W., eds.,

96
Mineral Deposits of the Northern Canadian Cordillera: Field Trip 14 Guidebook: International Association on the Genesis of Ore Deposits, Eighth Symposium, Ottawa, p. 177-244. Hope J., Eaton D.W., and Ross G.M., 1999. Lithoprobe seismic transect of the Alberta Basin: Compilation and overview. Bulletin of Canadian Petroleum Geology Vol. 47, No. 4 (December, 1999), P. 331-345. Jowitt S. M., and Keays R. R, 2013. Shale-hosted Ni–(Cu–PGE) mineralization: a global overview." Applied Earth Science. 2013. Kennedy G.C., 1950. A portion of the system silica water, Economic Geology v 45, Number 7, p. 629-653. Kowalski N., Dellwig O., Beck M., Grunwald M., Fischer S., Piepho M., Boettcher M. E., 2009. Trace metal dynamics in the water column and pore waters in a temperate tidal system; response to the fate of algae-derived organic matter. Ocean Dynamics, 59(2), p. 333-350. Lewan M.D. and Maynard J.B., 1982. Factors controlling enrichment of vanadium and nickel in the bitumen of organic sedimentary rocks, Geochimica et Cosmochimica Acta, Volume 46, Issue 12, December 1982, Pages 2547-2560, (http://www.sciencedirect.com/science/article/pii/0016703782903775) McPhail S., Walsh W., Lee C. and Monahan P., 2009. Shale units of the Horn River Formation, Horn River Basin and Cordova Embayment, northeastern British Columbia. British Columbia Ministry of Energy, Mines and Petroleum Resources. (http://www.empr.gov.bc.ca/OG/oilandgas/petroleumgeology/UnconventionalOilAndGas/Pages/Shale.aspx) Morford J.L., Emerson S., Breckel E.J., Kim S.H., 2005. Diagenesis of oxyanions (V, U, Re, and Mo) in pore waters and sediments from a continental margin. Geochimica et Cosmochimica Acta, Vol. 69, No. 21, p. 5021–5032. Morrow D.W., Cumming G.L., and Aulstead K.L. 1990. The Gas-Bearing Devonian Manetoe Facies, Yukon and Nothwest Territories. Geological Survey of Canada, Bulletin 400, p. 19-20. Mortensen J.K., 1979. Stratigraphy, structural, and tectonic setting of an upper Devonian-Mississippian volcanic-sedimentary sequence and associated base metal deposits in the Pelly Mountains, Southeastern Yukon Territory. M.Sc Thesis, Geological Sciences, University of British Columbia, 1979. Nelson J.L, Paradis S., and Zantvoort W., 1998. The Robb Lake carbonate hosted lead-zinc deposit, northeastern British Columbia: A Cordilleran MVT deposit. Geological Fieldwork 1998, Paper 1999-1.

97
Orberger B.T., Gallien J.P., Pinti D.L, Failin M., Daudin L., Grfcke D.R., Pasava J. 2005. Nitrogen and carbon partitioning in diagenetic and hydrothermal minerals from Paleozoic Black Shales, (Selwyn Basin, Yukon Territories, Canada). Chemical Geology 218 (2005), p. 249 – 264. Paradis S., Goodfellow W., 2012. SEDEX Deposits in the Cordillera: Current concepts on their geology, genesis, and exploration. Geological Survey of Canada, Open File 7144, 2012 Pearce T.J., Wray D., Ratcliffe K.T, Wright D.K. and Moscariello A., 2005. Chemostratigraphy of the upper Carboniferous Schooner Formation, southern North Sea. In: Carboniferous hydrocarbon geology: the southern North Sea and surrounding onshore areas. Occasional Publication series of the Yorkshire Geological Society, v. 7, p. 147-164. Petroleum Geology Open File 2003-4, 2003. Exploration Assessment of Deep Devonian Gas Plays, Northeastern British Columbia. Petrel Robertson Consulting Ltd. British Columbia Ministry of Energy and Mines, Resource Development Division, New Ventures Branch. Ratcliffe K.T., Morton A.C., Ritcey D.H. and Evenchick C.A., 2007. Whole-rock geochemistry and heavy mineral analysis as petroleum exploration tools in the Bowser and Sustut basins, British Columbia, Canada. Bulletin of Canadian Petroleum Technology, v. 55, p. 320-336. Ross D.J.K. and Bustin R.M., 2008. Characterizing the shale gas resource potential of Devonian–Mississippian strata in the Western Canada sedimentary basin: Application of an integrated formation evaluation. AAPG Bulletin, v. 92, p. 87-125. Ross D.J.K. and Bustin R.M., 2009. Investigating the use of sedimentary geochemical proxies for paleoenvironments of thermally mature organic-rich strata: examples from Devonian-Mississippian strata, Western Canadian Sedimentary Basin. Chem. Geol. Smith T.M., Dorobek, S.L., (1993). Stable isotopic composition of meteoric calcites; evidence for Early Mississippian climate change in the Mission Canyon Formation, Montana. Tectonophysics, 222(3-4), p. 317-331. Stewart J.H., 2009. Reconstructing Rodinia by fitting Neoproterozoic continental margins. U.S. Geological Survey Open-File Report 2009-1191. P. 94. Taylor P.D., Ramsey M.H. and Potts P.J., 2004. Balancing measurement uncertainty against financial benefits: comparison of in situ and ex situ analysis of contaminated land. Environmental Science and Technology, v. 38, p. 6824-6831.

98
White D.J., Milkereit B., Salisbury M.H. and Percival J. A., 1992. Crystalline lithology across the Kapuskasing Uplift determined using in situ Poisson's ratio from seismic tomography. J. Geophys. Res., 97(B13), 19993–20006.